Functional links between sensory representations, choice activity, and sensorimotor associations in parietal cortex
- Department of Neuroscience, School of Medicine and Public Health, University of Wisconsin–Madison, United States
- WiSys Technology Foundation, United States
Figures
Figure 1 with 1 supplement
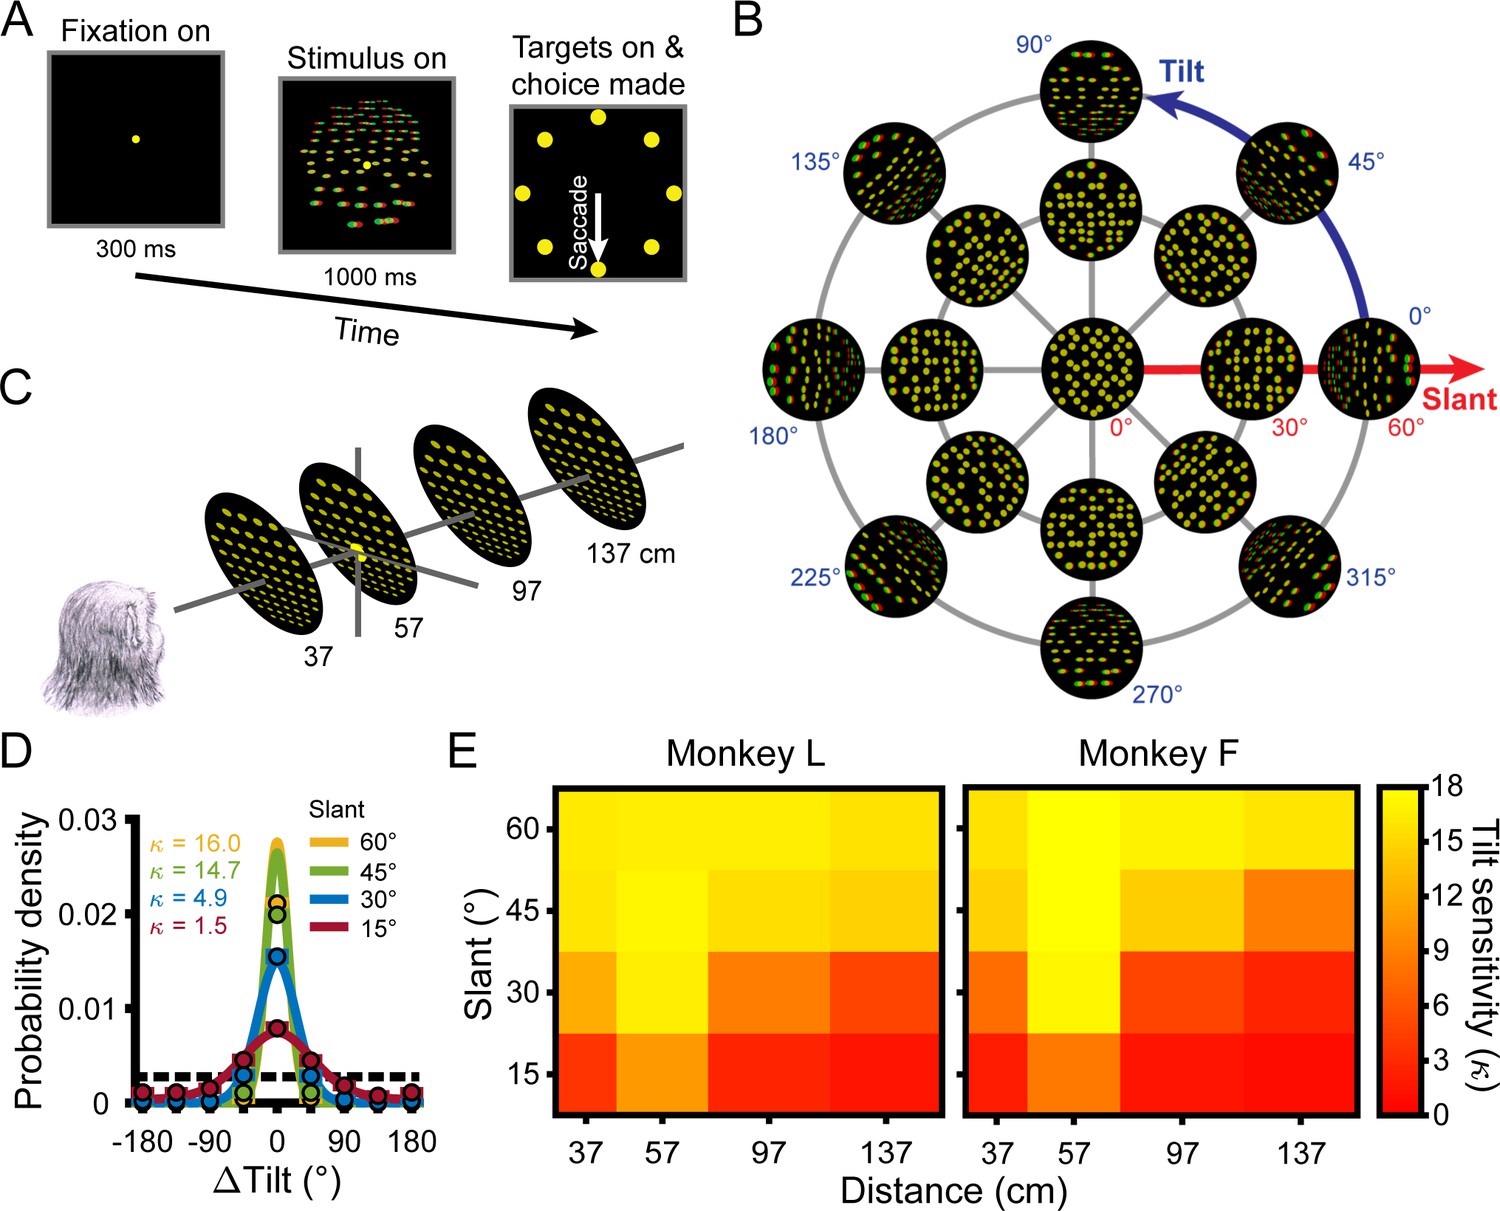
Task, stimuli, and performance.
(A) Tilt discrimination task. After fixating a target at the center of the screen for 300 ms, a plane was shown for 1 s while fixation was maintained. The target and plane then disappeared and eight choice targets appeared. The nearest side of the plane was then reported via a saccade to the corresponding target (e.g. the bottom target for a bottom-near plane). (B) Tilt and slant. Planes were rendered as random dot stereograms with perspective and stereoscopic cues. A subset of planes are shown here as red–green anaglyphs. For clarity, the number of dots is reduced and the dot size is increased compared to the actual stimuli. (C) Planes were presented at the center of the screen at four distances and always subtended 20° of visual angle. The fixation point (depicted by the larger yellow dot) was always located at 57 cm. (D) Error distributions of reported tilts at each slant (distance = 137 cm) calculated over all tilts for Monkey L. Data points show the mean probability of a given ΔTilt (correct choice: ΔTilt = 0°) and SEM (error bars are obscured by the data points) across sessions. Solid curves are von Mises probability density functions. Taller and narrower densities indicate greater sensitivity. Sensitivities (, the von Mises concentration parameter) are indicated in the inset. At higher sensitivities, deviations between data points at ΔTilt = 0° and the density functions reflect discrete versus continuous representations of the area between presented tilts (Chang et al., 2020). Chance performance is marked by the dashed horizontal line. (E) Heat maps show mean tilt sensitivity across sessions as a function of slant and distance for each monkey. Yellow hues indicate greater sensitivity.
Figure 1—figure supplement 1
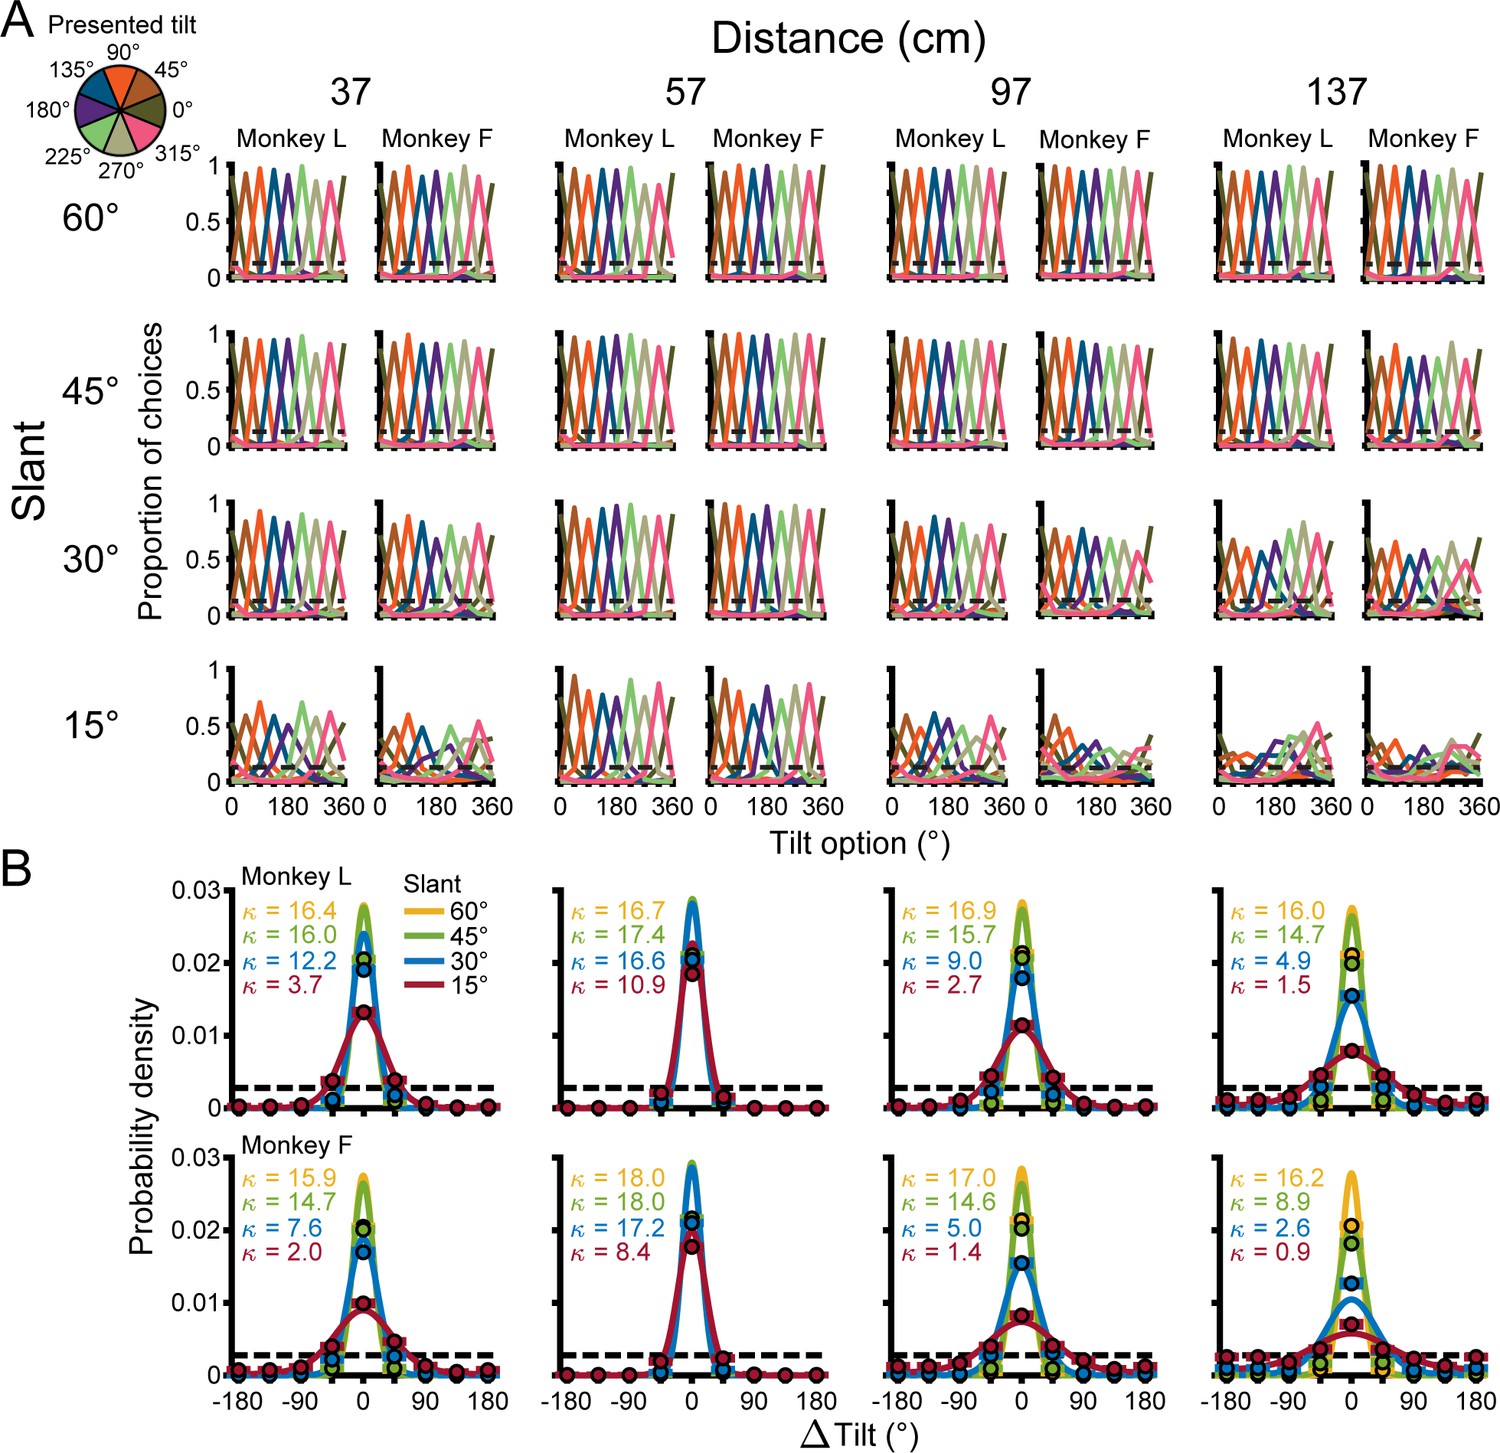
Behavioral performance.
(A) Proportion of choices made for each tilt option at each combination of tilt (colors), slant (rows), and distance (supercolumns) for each monkey (subcolumns). Performance was near perfect at combinations of large slants and distances near fixation (57 cm) but approached chance level at small slants and distances far from fixation. Sensitivity was not significantly dependent on tilt (see text). (B) Error distributions of reported tilts at each combination of slant (colors) and distance (columns) calculated over all tilts (Monkey L: top row; Monkey F: bottom row). Data points show the mean probability of a given ΔTilt (correct choice: ΔTilt = 0°) and SEM (error bars are obscured by the data points) across sessions. Solid curves are von Mises probability density functions. Sensitivities are indicated in the insets. Chance performance is marked by dashed horizontal lines.
Figure 2
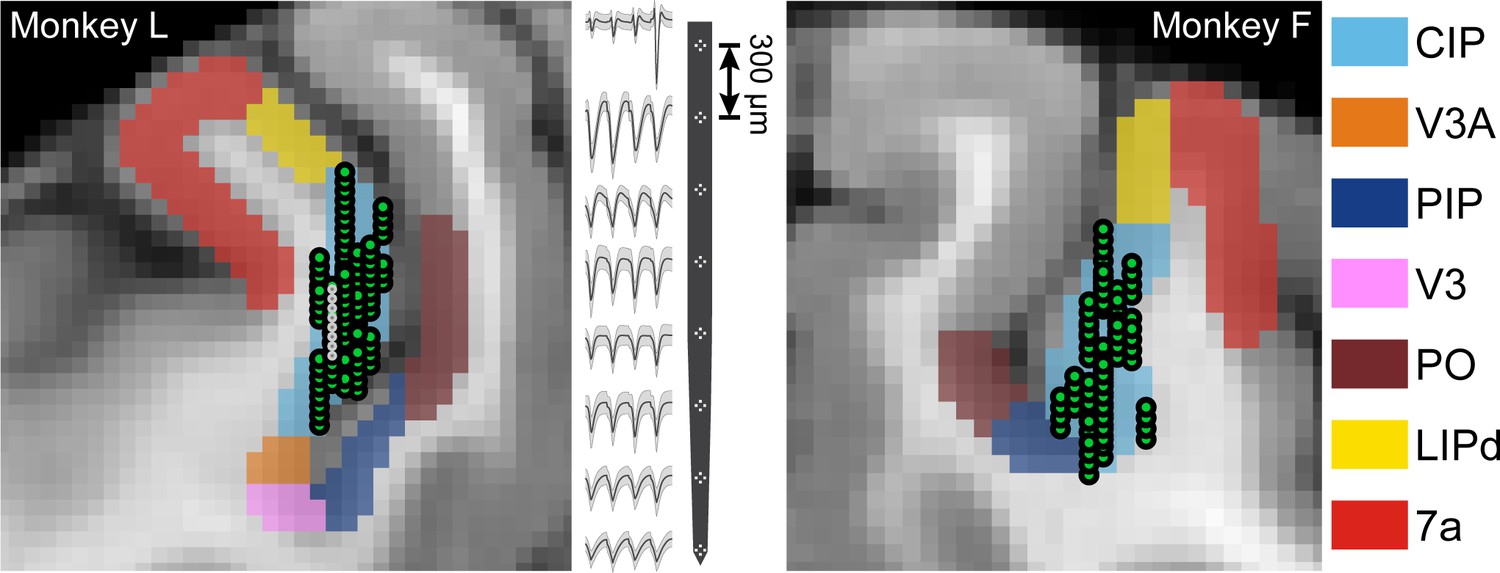
Neuronal recordings.
Coronal MRI sections showing the estimated boundaries of CIP (light blue) and neighboring regions (see Materials and methods). All recording locations (green circles) are shown projected along the anterior-posterior (AP) axis onto a single section (Monkey L: AP = −7 mm; Monkey F: AP = −5.5 mm). Spike waveforms from an eight-tetrode recording (locations marked by smaller white circles in the MRI) are shown for Monkey L.
Figure 3 with 1 supplement
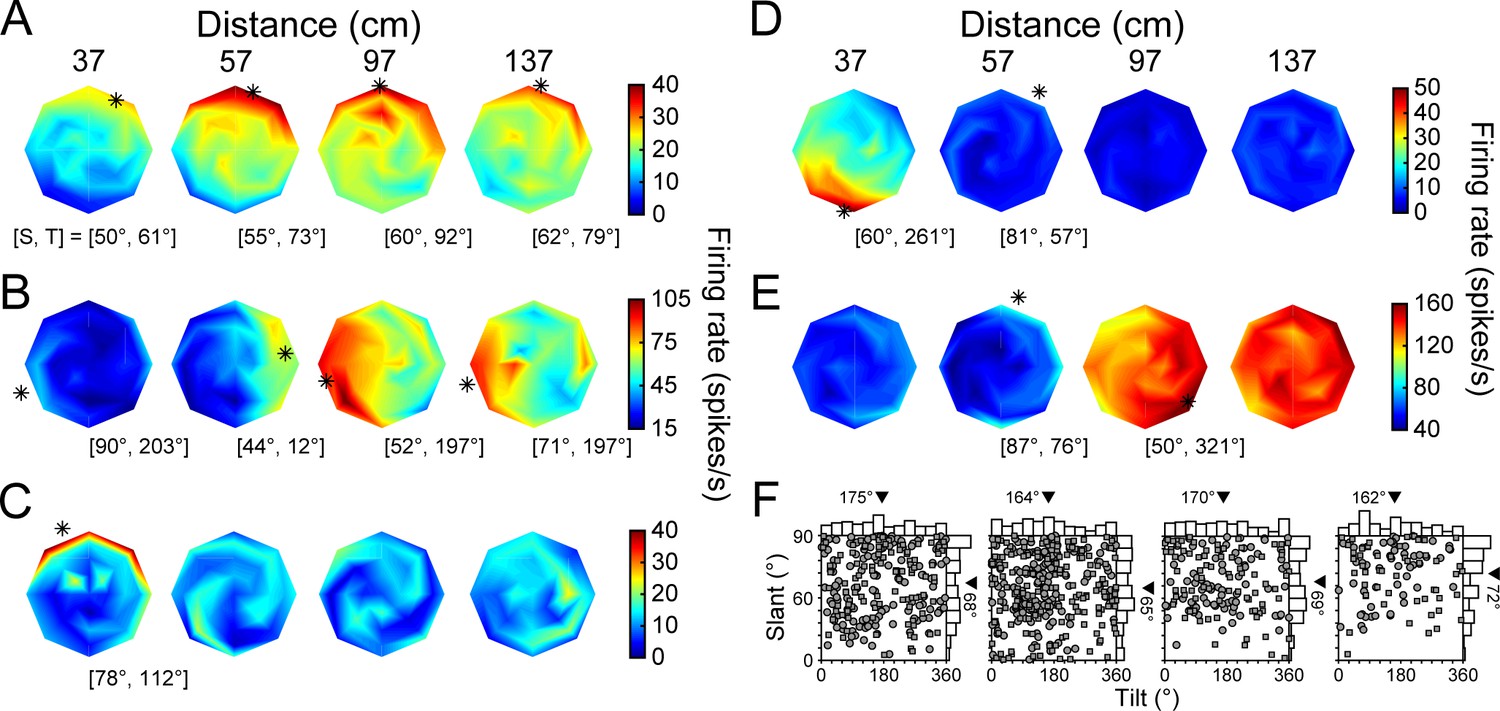
3D orientation tuning at each distance before the onset of choice-related activity.
(A-E) Five example neurons. Heat maps show firing rate as a function of tilt (T) and slant (S), plotted using the coordinates illustrated in Figure 1B. Red hues indicate higher firing rates. Asterisks mark preferred orientations from Bingham fits (tuned cases only) (Rosenberg et al., 2013). Some asterisks are off of the discs because the largest tested slant was 60°. (A) High tolerance neuron (Tolerance = 0.88). (B) Intermediate tolerance neuron (Tolerance = 0.53). (C) Low tolerance neuron (Tolerance = 0.34). (D) Low tolerance neuron (Tolerance = 0.24). (E) Distance selective neuron with little orientation-related modulation. (F) Distribution of T and S preferences at each distance plotted using an equal area projection (Monkey L: circles; Monkey F: squares). Only tuned neurons at each distance are included: 37 (N = 242), 57 (N = 320), 97 (N = 158), 137 (N = 106) cm. Marginal histograms show the T and S distributions. Triangles mark mean values.
Figure 3—figure supplement 1
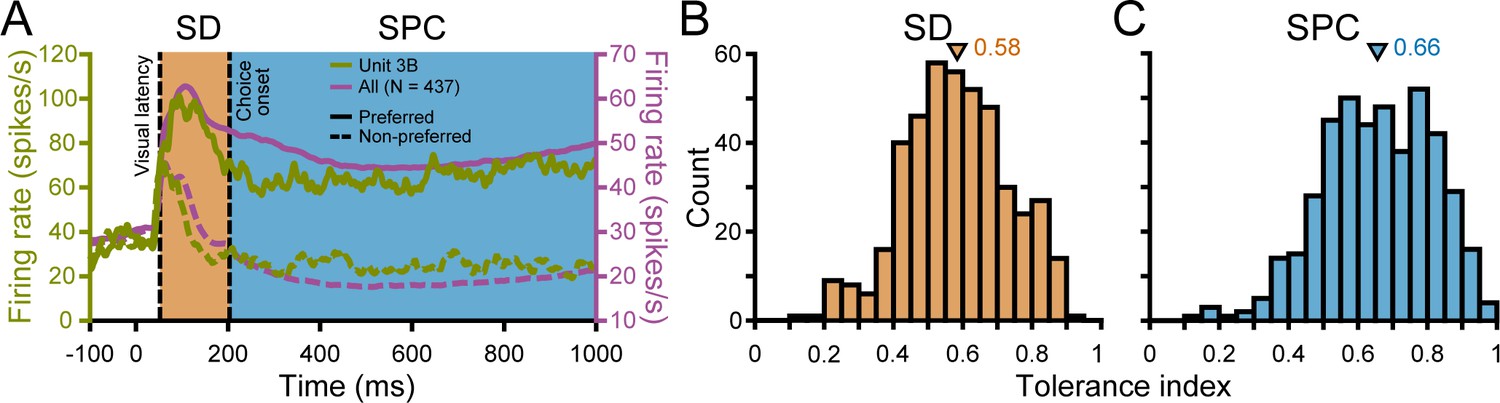
Response time course and Tolerance distributions.
(A) Spike density functions showing the responses of the example neuron in Figure 3B (green) and the population (pink, N = 437) to preferred (solid lines) and non-preferred (dashed lines) stimuli. Stimulus onset = 0 ms. Vertical dashed lines mark the median visual response latency (52 ms) and onset of choice-related activity (202 ms). Shaded regions mark the SD (orange) and SPC (blue) windows. (B) Tolerance values in the SD window (N = 437). (C) Tolerance values in the SPC window. In B,C, triangles mark mean values.
Figure 4
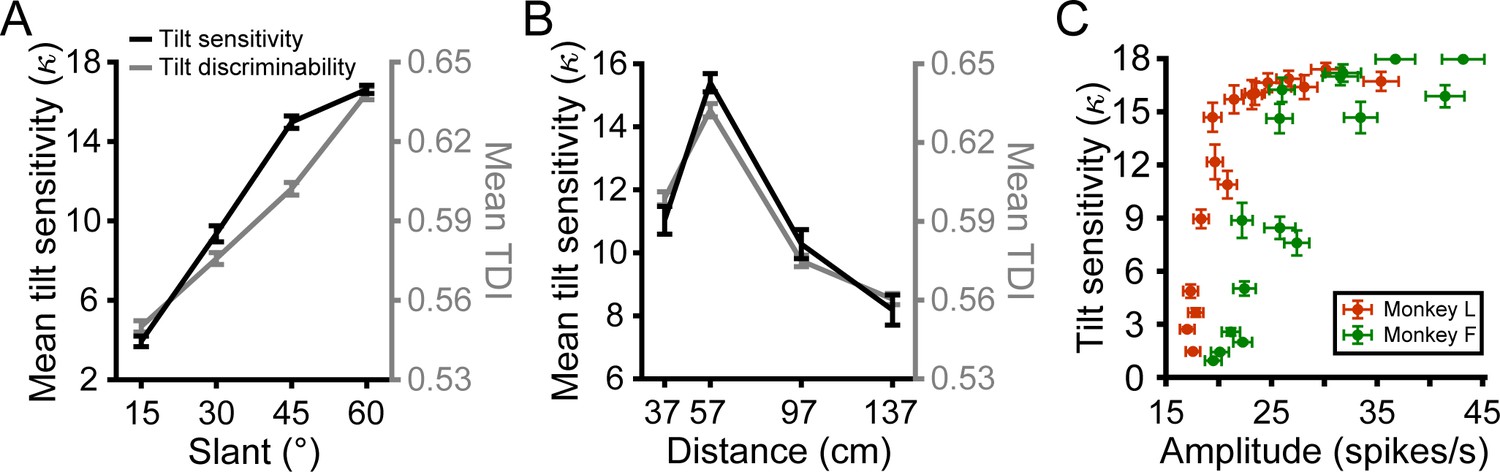
Neuronal correlates of 3D tilt sensitivity.
(A) Mean behavioral tilt sensitivity () and neuronal tilt discrimination index (TDI) values during the SD window increased with slant. Data points show mean and SEM across distances and monkeys or neurons. (B) Mean tilt sensitivity and TDI values during the SD window had an inverted U-shape relationship with distance that peaked at the fixation distance (57 cm). Data points show mean and SEM across slants and monkeys or neurons. (C) Tilt sensitivity versus response amplitude during the SD window at each slant–distance combination (Monkey L: orange; Monkey F: green). Data points show mean and SEM across sessions or neurons. Tilt sensitivity does not exceed = 18, the upper limit that can be estimated with a 45° tilt sampling interval (Chang et al., 2020).
Figure 5 with 2 supplements
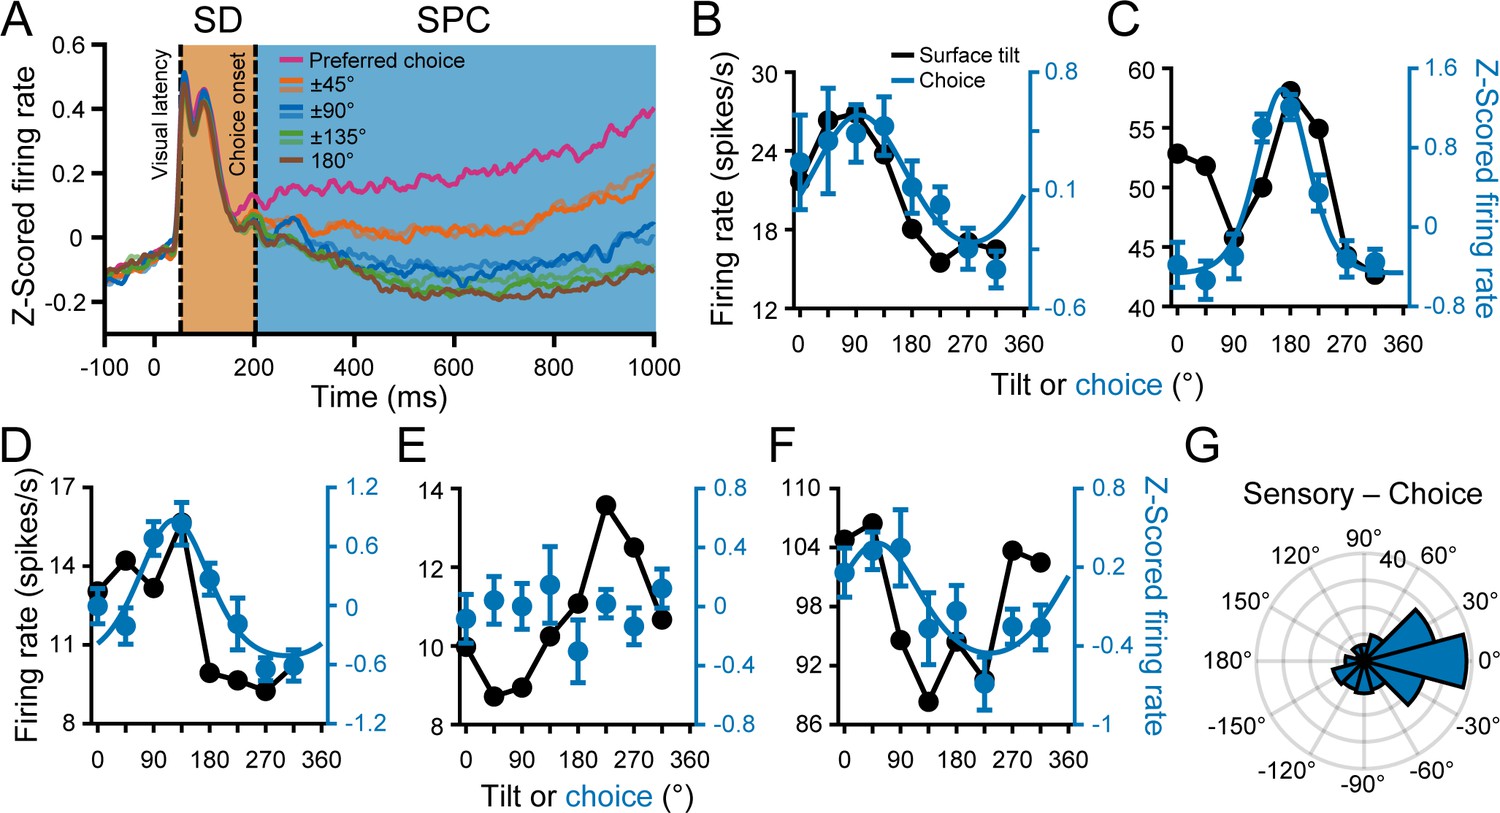
Choice tuning was parametric and aligned with the tilt preferences.
(A) Time course of choice-related activity. Curves show z-scored responses averaged over neurons for each of the eight choices relative to each neuron’s preferred choice. Stimulus onset = 0 ms. Vertical dashed lines mark the median visual response latency (52 ms) and onset of choice-related activity (202 ms). Shaded regions mark the SD (orange) and SPC (blue) windows. (B-F) Comparison of surface tilt and choice tuning for the example neurons (Figure 3A–E, same order). Black points are surface tilt responses marginalized over slant and distance (note that these responses were measured during the SD window, before the onset of choice-related activity). The tilt tuning curve in C has two peaks because the orientation preference was distance dependent. Blue points are z-scored choice responses and the curves are von Mises fits (tuned cases only). (G) Difference between the principal surface tilt (SD window only) and choice preferences (N = 166). The peak at 0° indicates that sensory and choice preferences generally aligned.
Figure 5—figure supplement 1
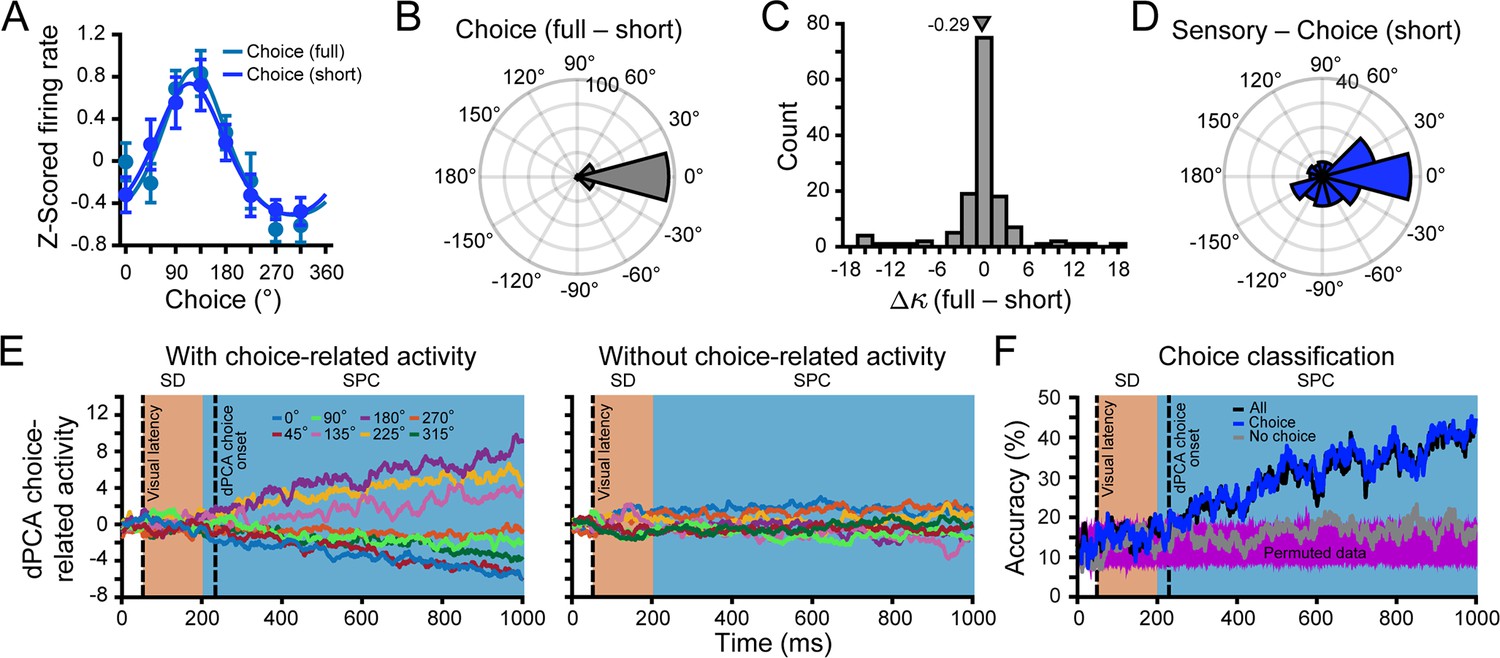
Validation of the choice-related activity results.
(A-D) Choice tuning curves computed over full and short duration SPC windows were similar. (A) Choice tuning in the full and short SPC windows for the neuron in Figure 5D. (B) Difference between choice preferences in the full and short SPC windows. The median circular difference was -1.6° and not significantly different from 0° (circular median test, p=0.09). (C) Difference between choice tuning bandwidths () in the full and short SPC windows. The mean difference was -0.29 and not significantly different from 0 (paired t-test, p=0.45). (D) Difference between principal surface tilt (SD window only) and choice preferences in the short SPC window (c.f., Figure 5G). The median circular difference was -7.0° and not significantly different from 0° (circular median test, p=0.33). (E,F) Demixed principal component (dPCA) analysis of the frontoparallel plane data (z-scored at each distance) performed for: (i) all neurons, (ii) those with choice-related activity, and (iii) without choice-related activity. Stimulus onset = 0 ms. Vertical dashed lines mark the median visual response latency (52 ms) and dPCA estimate of the onset of choice-related activity (232 ms). Shaded regions mark the SD (orange) and SPC (blue) windows. (E) Time courses showing projections of the responses onto the first choice component for neurons with (left; results were similar for all neurons) and without (right) choice-related activity. Each curve is the projection for a different choice report (colors). (F) Time course of behavioral choice classification accuracy for all neurons (black), neurons with choice-related activity (blue), and neurons without (gray). Chance level was defined using permuted data (purple). Classification exceeded chance level at 232 ms for neurons with choice-related activity (233 ms for all neurons). In contrast, performance exceeded chance level at only six sporadic time points for neurons without choice-related activity.
Figure 5—figure supplement 2

Experience-dependent association of choice reports and orientation selectivity.
The direction of choice reports had opposite effects on neuronal activity when monkeys were trained to report the plane’s near side (A,C) versus far side (B,D). Each panel shows the full 3D orientation tuning curve (left) and tuning along the top-to-bottom near axis (right; corresponding to the vertical white dashed line through the full tuning curve) for a single neuron. Following Elmore et al., 2019, choice-conditioned tuning curves along the top-to-bottom near axis were created by grouping responses according to the direction of the choice report on each trial (upward = purple, downward = orange). At least three measurements were required to include a data point in the choice-conditioned tuning curves. (A,B) Top-near preferring neurons. (A) Trained to report the near side. Responses were stronger (weaker) when the direction of the report was upward (downward). (B) Trained to report the far side (from Elmore et al., 2019). Responses were stronger (weaker) when the direction of the report was downward (upward). (C,D) Bottom-near preferring neurons. (C) Trained to report the near side. Responses were stronger (weaker) when the direction of the report was downward (upward). (D) Trained to report the far side (from Elmore et al., 2019). Responses were stronger (weaker) when the direction of the report was upward (downward). In A and C, SPC window responses were combined across all distances after separately z-scoring the responses at each distance. In B and D, the full orientation tuning curve and discrimination task data were recorded in separate experimental blocks.
Figure 6
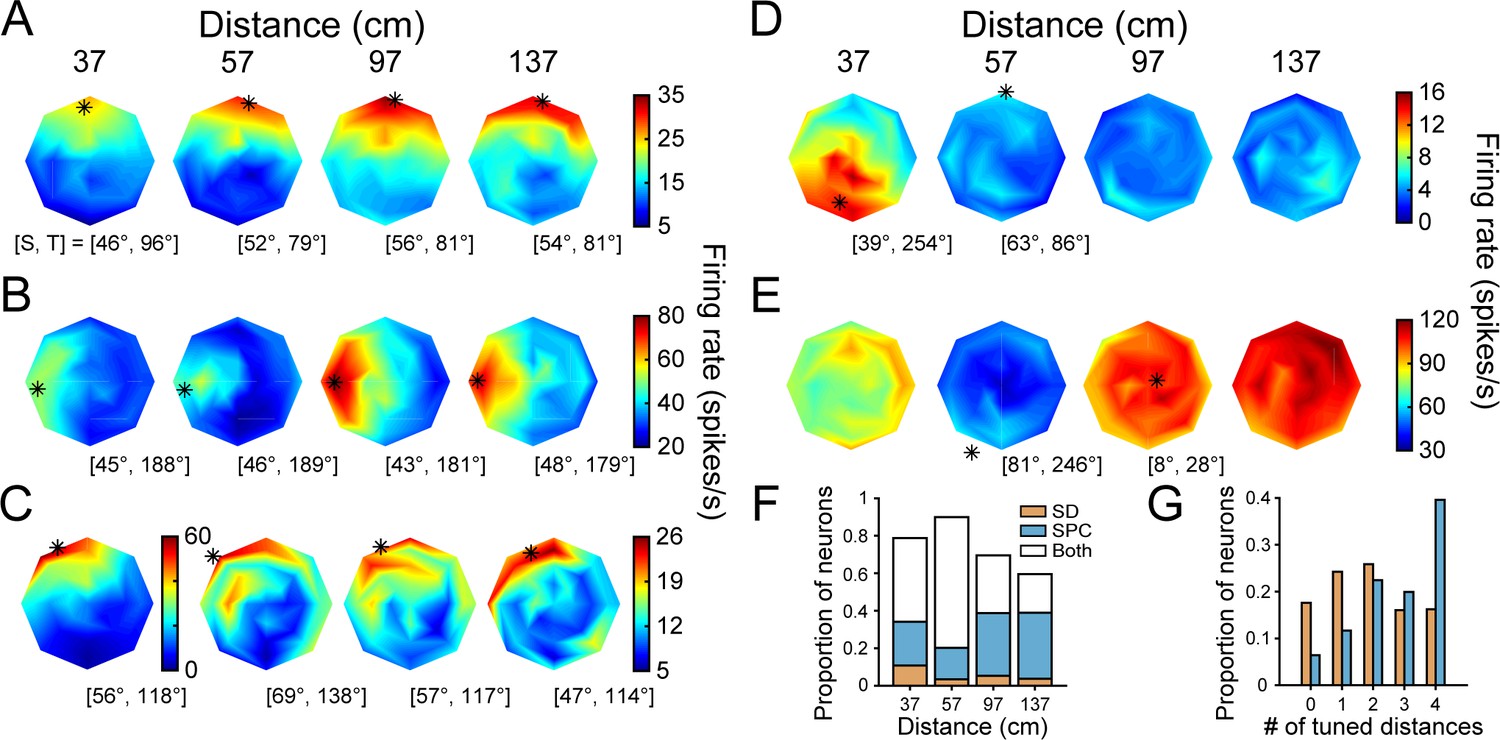
3D orientation tuning at each distance after the onset of choice-related activity.
(A-E) The example neurons (Figures 3A–E and 5B–F, same order). (A) Tolerance increased from 0.88 (SD window) to 0.96 (SPC window). (B) Tolerance increased from 0.53 to 0.88. Note the changes in selectivity at 37 and 57 cm. (C) Tolerance increased from 0.34 to 0.80. The number of distances with significant orientation tuning increased from one to four. (D) Tolerance increased from 0.24 to 0.32. (E) Distance selective neuron. (F) Proportion of neurons with orientation tuning at each distance during the SD window only (orange), SPC window only (blue), or both windows (white). The proportion of tuned neurons decreased with distance from fixation (57 cm), consistent with the behavioral sensitivity (Figures 1E and 4B). (G) Proportion of neurons with orientation tuning at each possible number of distances during the SD (orange) and SPC (blue) windows.
Figure 7 with 1 supplement
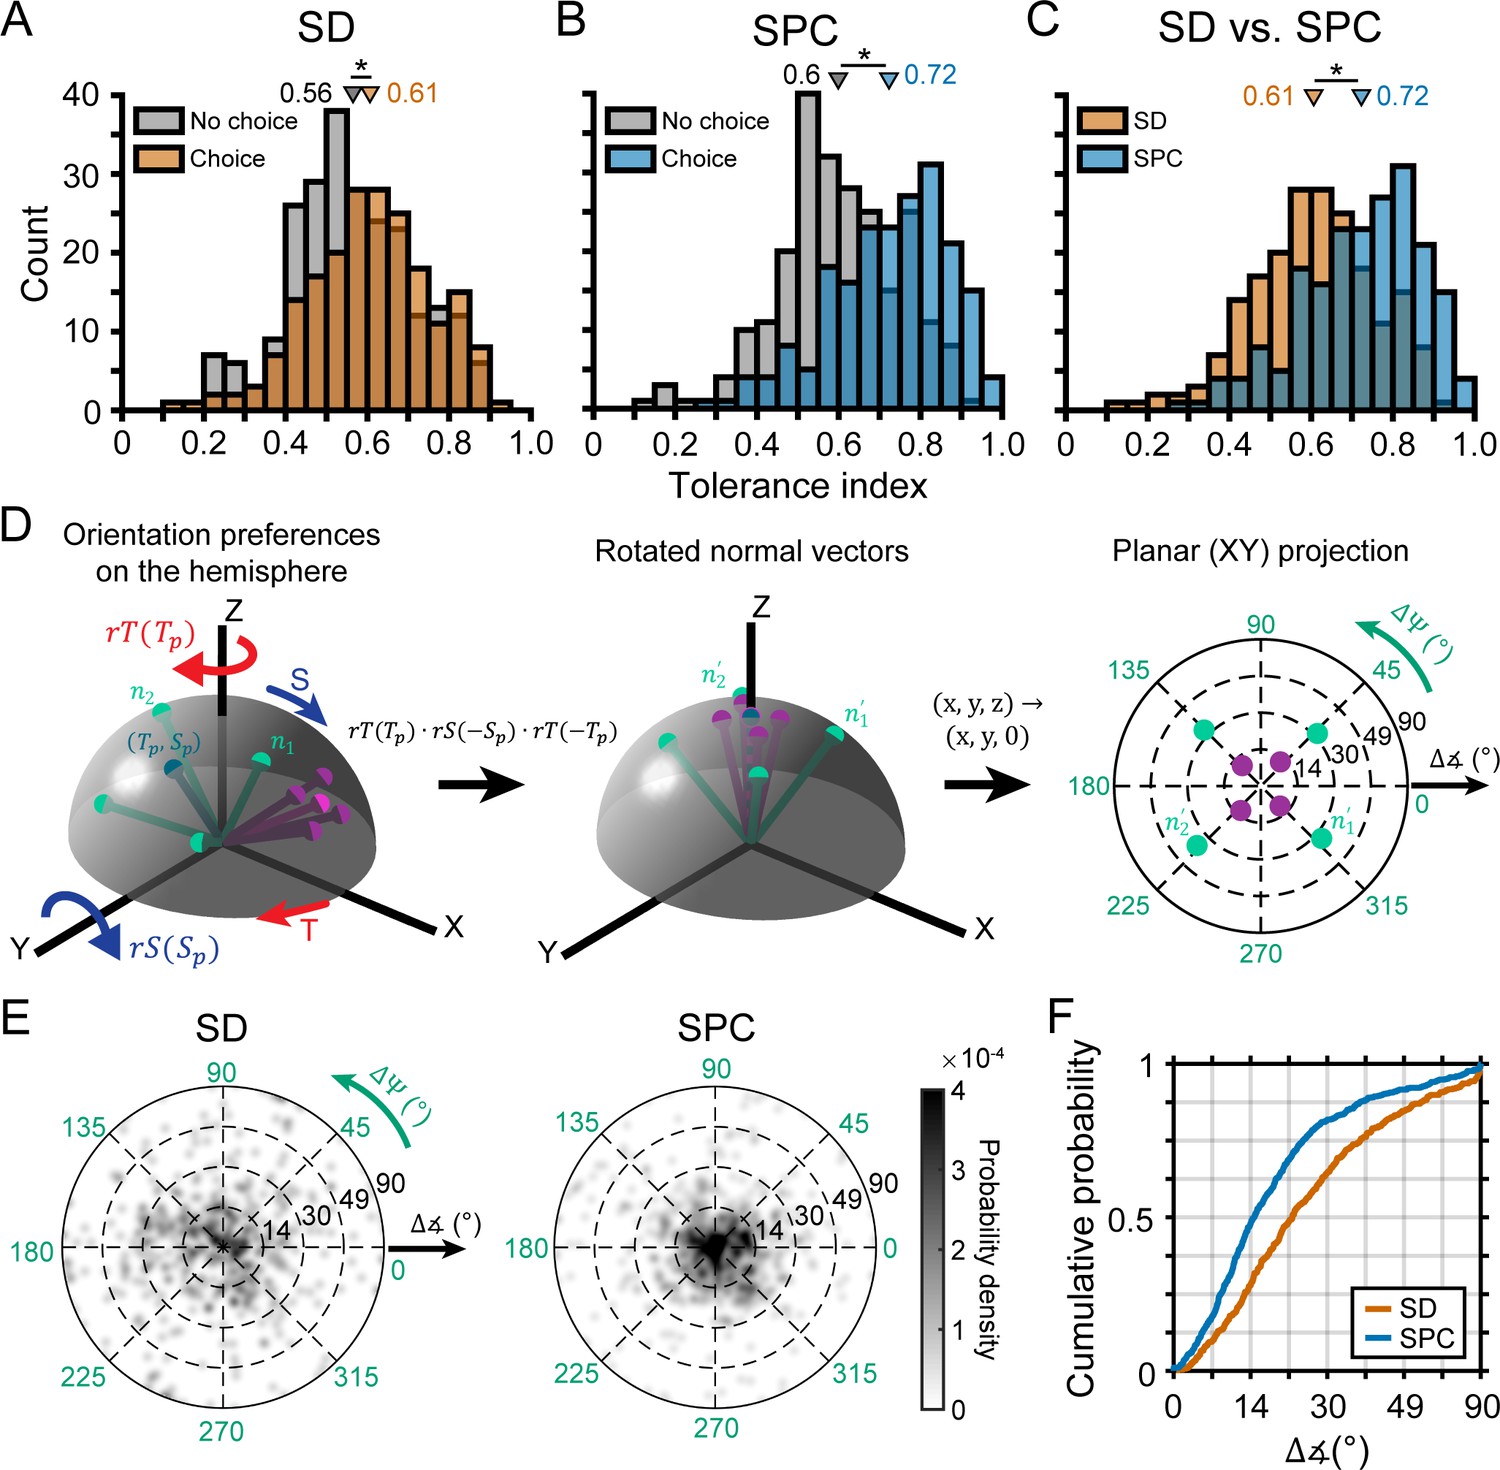
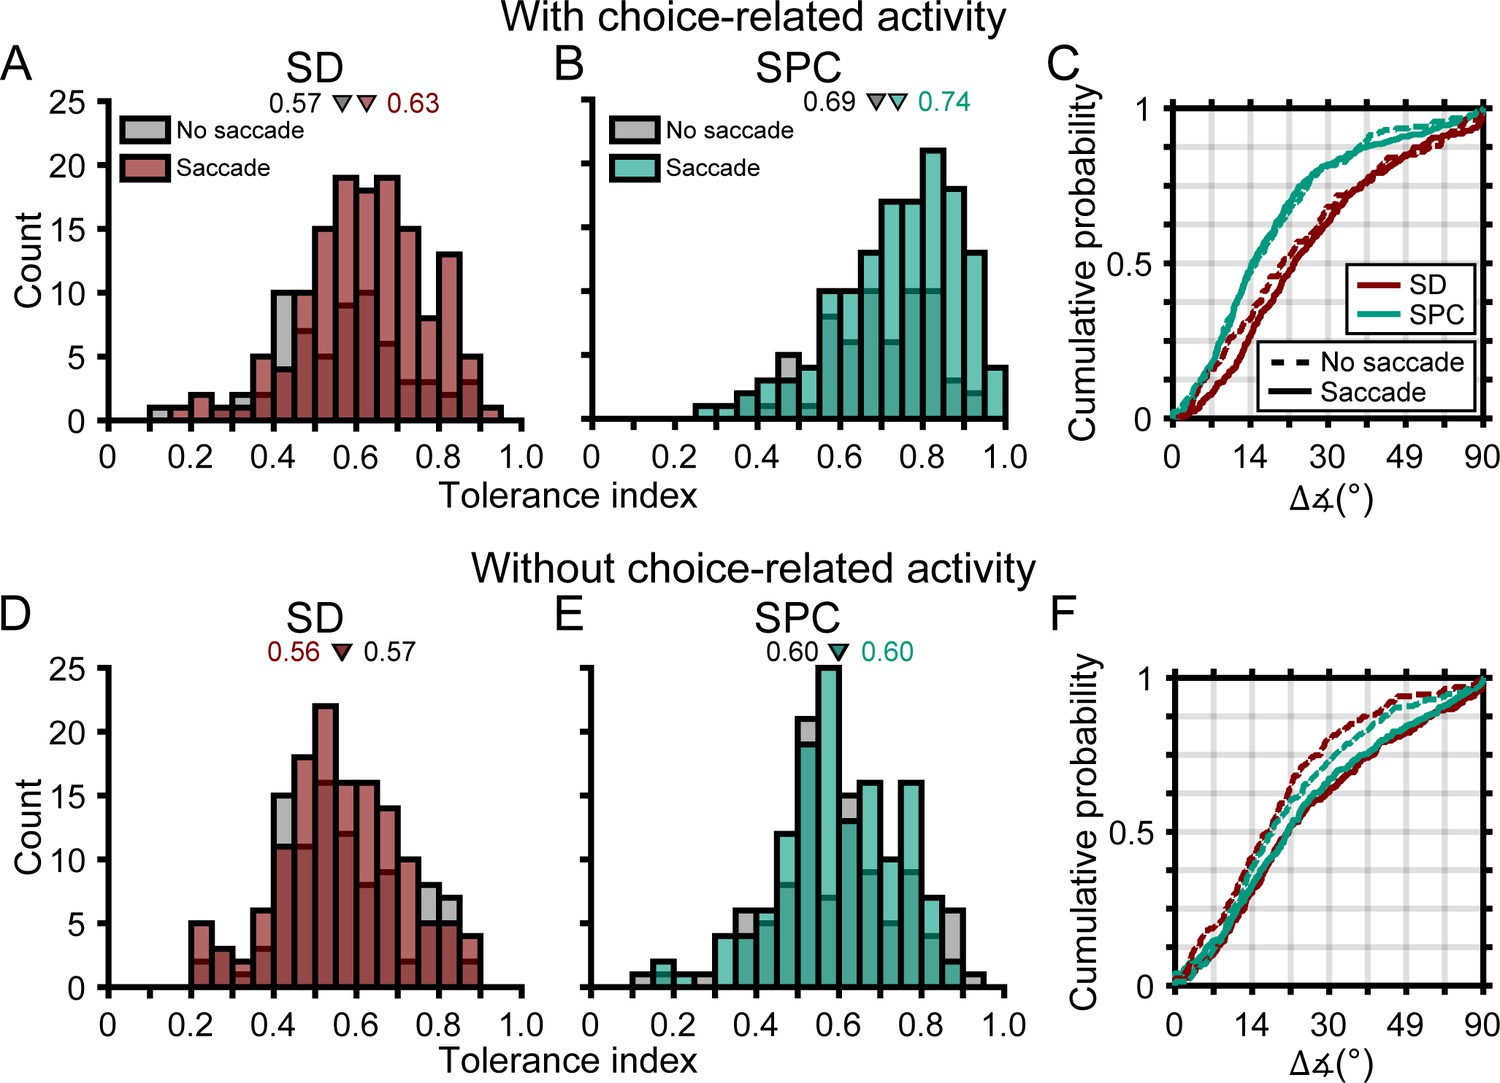
Choice-related activity was associated with more robust 3D selectivity.
(A) Tolerance values in the SD window for neurons with (orange) and without (gray) choice-related activity. (B) Tolerance values in the SPC window for neurons with (blue) and without choice-related activity. (C) Tolerance values across the SD and SPC windows for neurons with choice-related activity. In A-C, triangles mark mean values. Asterisks indicate significant differences. (D) Calculating deviations between orientation preferences. Left: Hemispherical representation of surface orientation (Rosenberg et al., 2013). Slant and tilt correspond to the elevation and azimuth, respectively. Each ball and stick corresponds to the normal vector of a planar surface (; Equation 4). Orientation preferences at four distances are shown for two hypothetical neurons with low (green) and high (purple) Tolerances (note the different spread in orientation preferences). Principal orientations (tilt = , slant = ; see Materials and methods) are shown in different shades. Middle: Normal vectors rotated to align the principal orientation with the north pole (; Equations 5-7). Right: Equatorial projection of the rotated normal vectors, providing a standardized space that describes deviations in the orientation preferences from the principal orientation (direction: ; angle: ). The origin corresponds to no difference and the outer ring to the maximum difference (90°). (E) Probability densities for the deviations in orientation preference during the SD and SPC windows (Gaussian smoothing kernel, σ = 0.025). (F) Cumulative density functions for the angular deviations (radial distances in E) for the SD and SPC windows. In C,E,F, only neurons with choice-related activity are included.
Figure 7—figure supplement 1
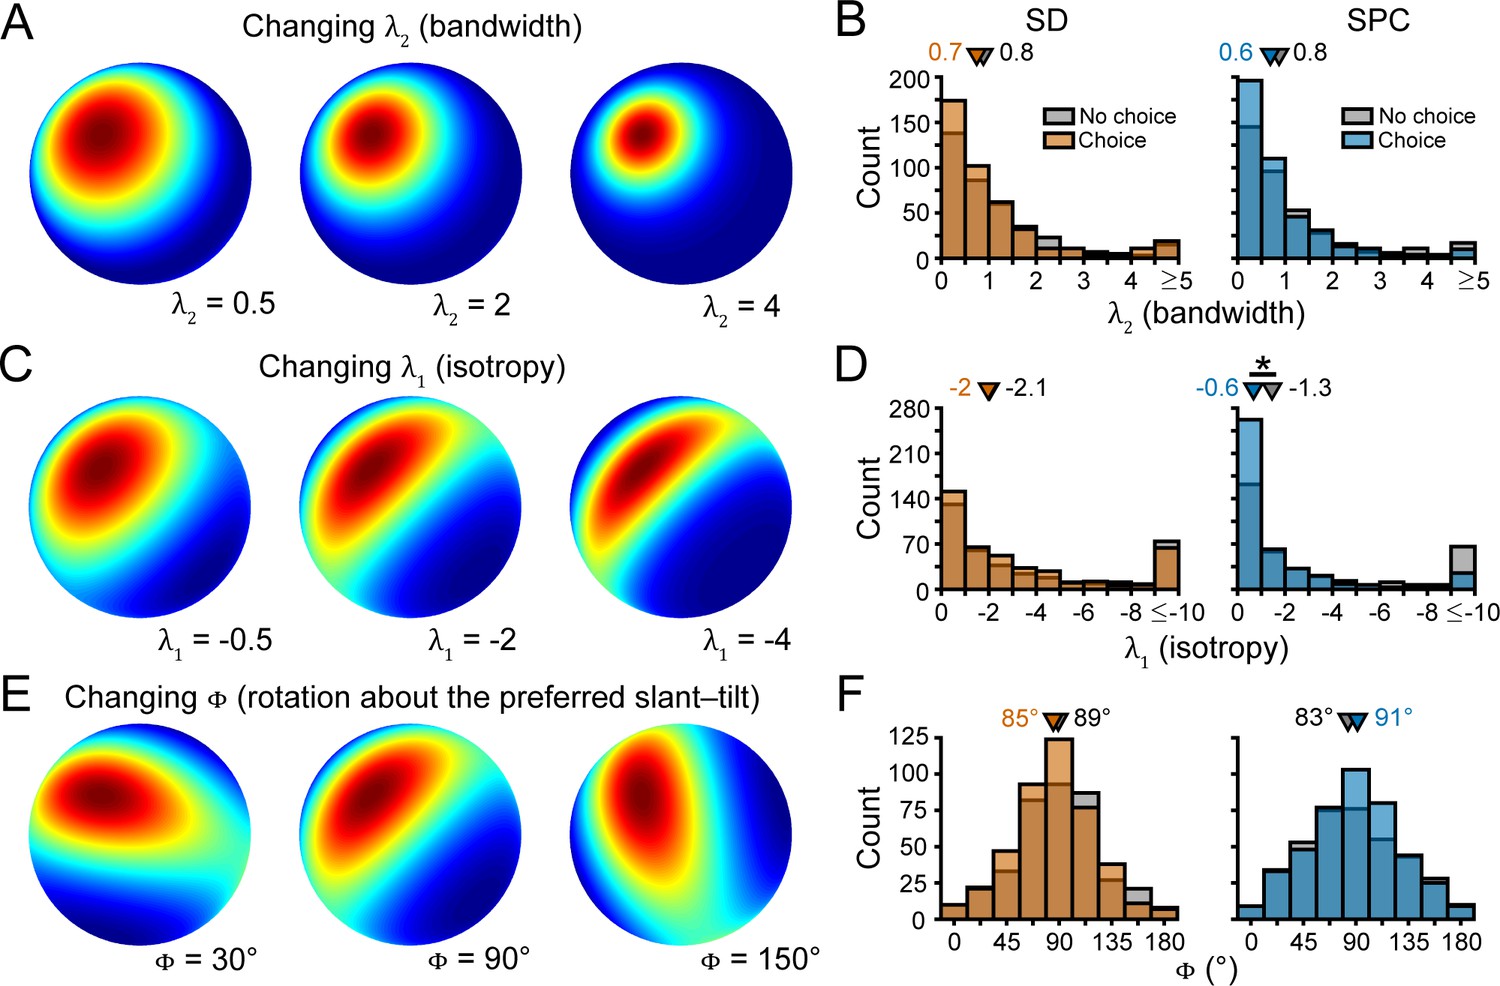
Parametric analysis of 3D orientation tuning curve shape.
Bingham functions describe the orientation tuning curves of CIP neurons (Rosenberg et al., 2013). Three parameters set the bandwidth (λ2 ≥ 0), isotropy (λ1 ≤ 0), and orient the major/minor axes (0° ≤ Φ < 180°). (A) Bandwidth (λ2). Larger positive values indicate narrower tuning. Fixed schematic parameters: λ1 = 0, Φ = undefined (since λ1 = 0). (B) Histograms of λ2 in the SD (left) and SPC (right) windows for neurons with and without choice-related activity (colors). There was no systematic relationship between bandwidth and either choice-related activity or time window. (C) Isotropy (λ1). Larger negative values indicate greater anisotropy (more elongated tuning). Fixed parameters: λ2 = 0.7, Φ = 90°. (D) Histograms of λ1. Tuning was more isotropic in the SPC window than the SD window for both subpopulations. In the SPC window, tuning was more isotropic for neurons with than without choice-related activity (indicated by the asterisk). Schematic parameters were selected to help visualize the differences in tuning (c.f., the left and middle panels of C and middle panel of E). The skew in the λ1 and λ2 distributions is consistent with previous findings. (E) Orientation of the major/minor axes of the tuning curve about the preferred slant–tilt (Φ). Fixed parameters: λ2 = 0.7, λ1 = −1.5. (F) Histograms of Φ. The distributions peaked near 90° indicating that the tuning curves generally aligned with the tilt and slant axes of the coordinate space. Histograms include parameter values for all significant orientation tuning curves (ANOVA, p<0.05; N = 811). Triangles in B,D,F mark median values.
Figure 8
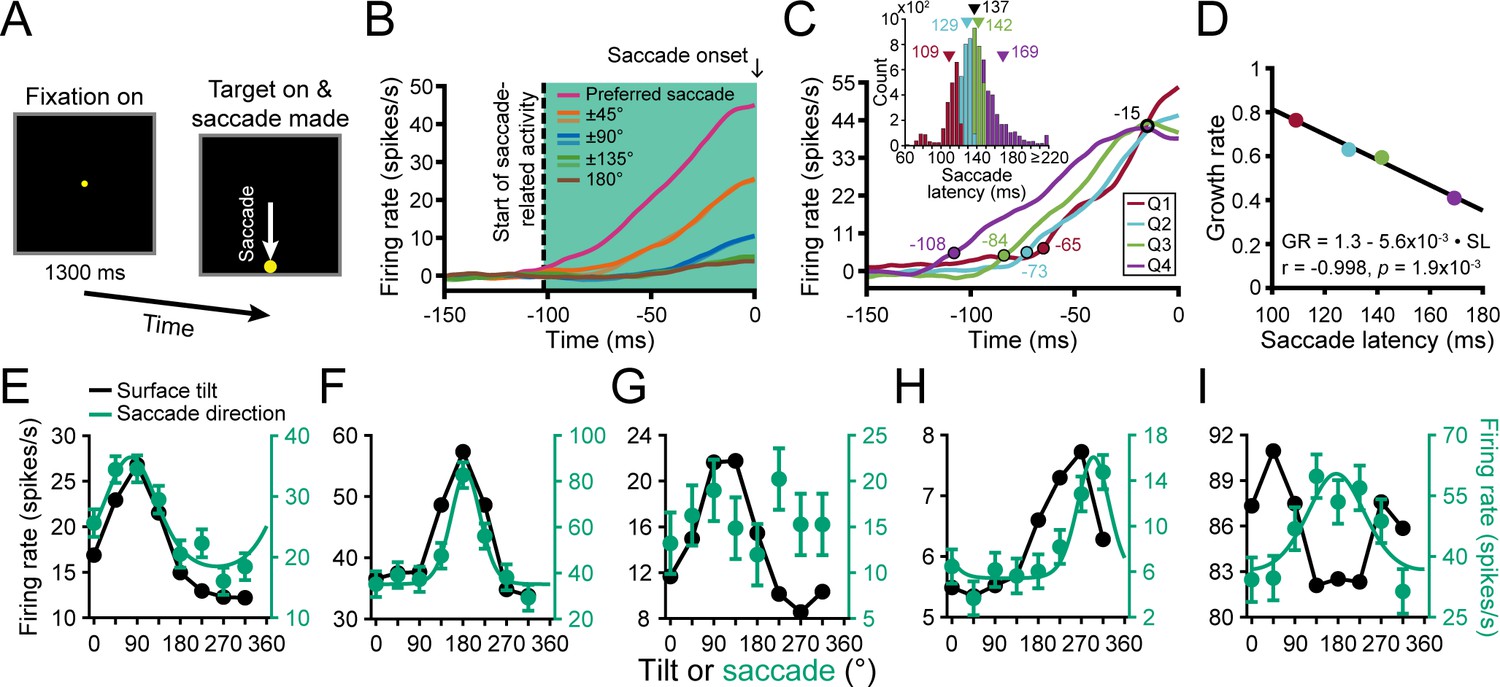
Saccade-related activity and sensorimotor associations.
(A) Saccade task. A target was fixated for 1.3 s after which it disappeared and a saccade target appeared at one of eight locations. A saccade was then made to that target. (B) Time course of saccade-related activity. Curves show responses averaged over neurons for each of the eight saccade directions relative to each neuron’s preferred direction. Saccade onset = 0 ms. Vertical dashed line marks the start of saccade-related activity (−102 ms). Shaded region marks the window used to assess saccade-related activity. (C) Time course of saccade-related activity conditioned on the saccade latency in quartiles (Q). Colored circles mark the start of activity for each quartile. Open black circle marks a putative saccade threshold. Times are indicated next to the circles. Inset shows the histogram of saccade latencies with quartiles colored. Triangles mark mean values (black for the whole distribution). (D) Inverse linear relationship between the growth rate (GR) of saccade-related activity and mean saccade latency (SL) for each quartile. (E-I) Comparison of surface tilt and saccade direction tuning curves for the example neurons (Figures 3A–E, 5B–F and 6A–E, same order). Black points are surface tilt responses marginalized over slant and distance (SD and SPC windows). Note that the tuning curve in F has a single peak rather than two (c.f., Figure 5C), reflecting an increase in the robustness of 3D orientation selectivity across distance. Green points are saccade direction responses and the curves are von Mises fits (tuned cases only).
Figure 9
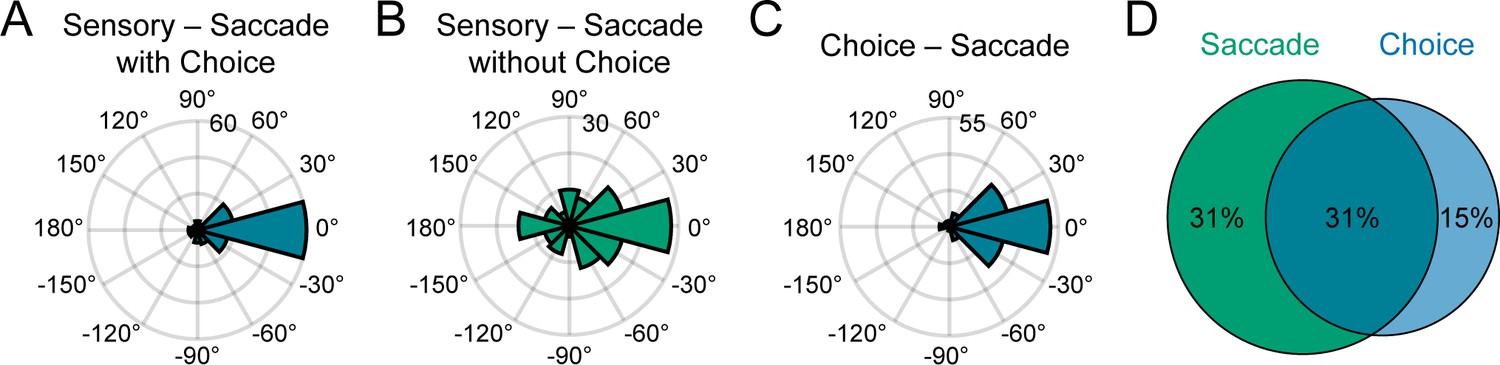
Sensorimotor and choice-motor associations.
(A) Differences between principal surface tilts and saccade direction preferences for neurons with choice-related activity (N = 135). (B) Same as A, but for neurons without choice-related activity (N = 131). (C) Differences between choice and saccade direction preferences (N = 137). (D) Venn diagram showing the percentages of neurons with saccade-related activity only (green), choice-related activity only (blue), and both (teal).
Figure 10
The robustness of 3D selectivity was associated with choice-related activity but not saccade-related activity.
(A-C) Neurons with choice-related activity. (A) Tolerance values in the SD window for neurons with (brown) and without (gray) saccade-related activity. (B) Tolerance values in the SPC window for neurons with (green) and without saccade-related activity. (C) Cumulative density functions for the angular deviations in orientation preferences for neurons with (solid lines) and without (dashed lines) saccade-related activity. (D-F) Same as A-C, but for neurons without choice-related activity. Triangles in A,B,D,E mark mean values.
Additional files
Download links
A two-part list of links to download the article, or parts of the article, in various formats.
Downloads (link to download the article as PDF)
Open citations (links to open the citations from this article in various online reference manager services)
Cite this article (links to download the citations from this article in formats compatible with various reference manager tools)
Functional links between sensory representations, choice activity, and sensorimotor associations in parietal cortex
eLife 9:e57968.
https://doi.org/10.7554/eLife.57968


