Momentary subjective well-being depends on learning and not reward
- Max Planck UCL Centre for Computational Psychiatry and Ageing Research, University College London, United Kingdom
- Wellcome Centre for Human Neuroimaging, University College London, United Kingdom
- Department of Psychology, Yale University, United States
Figures
Figure 1
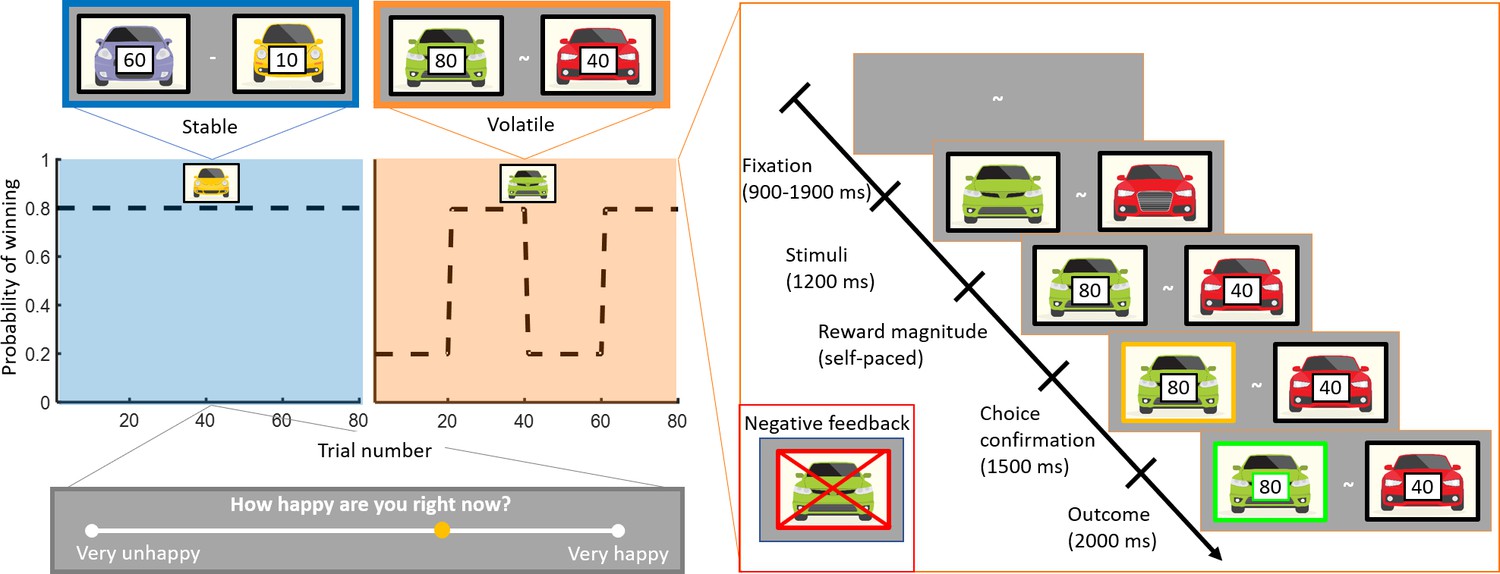
Experimental design.
Subjects (n = 75) performed a one-armed bandit reinforcement learning task, choosing repeatedly between two cars. They were instructed to maximise their cumulative points. In the stable task (80 trials), the probability to win for the best car was 80%. In the volatile task (80 trials), reward probabilities switched between 80% for one car and 80% for the other car every 20 trials. Task order was counterbalanced across subjects (see Materials and methods). The reward available for each car was randomly determined on each trial and unrelated to the probability of winning. Every three to four trials, subjects were asked to report ‘How happy are you right now?’ by moving a cursor on a line. Each trial started with a fixation symbol in the centre of the screen. Then, the stimuli were displayed but choice was not permitted. The potential reward for each car was then displayed and participants were free to choose an option without any time constraints. The chosen option was outlined by a yellow frame. Finally, the outcome was displayed. Both the car and the reward magnitude frames were green if the chosen car won the race (example shown). The car frame was red and crossed out if the chosen car lost (example shown in inset).
Figure 2
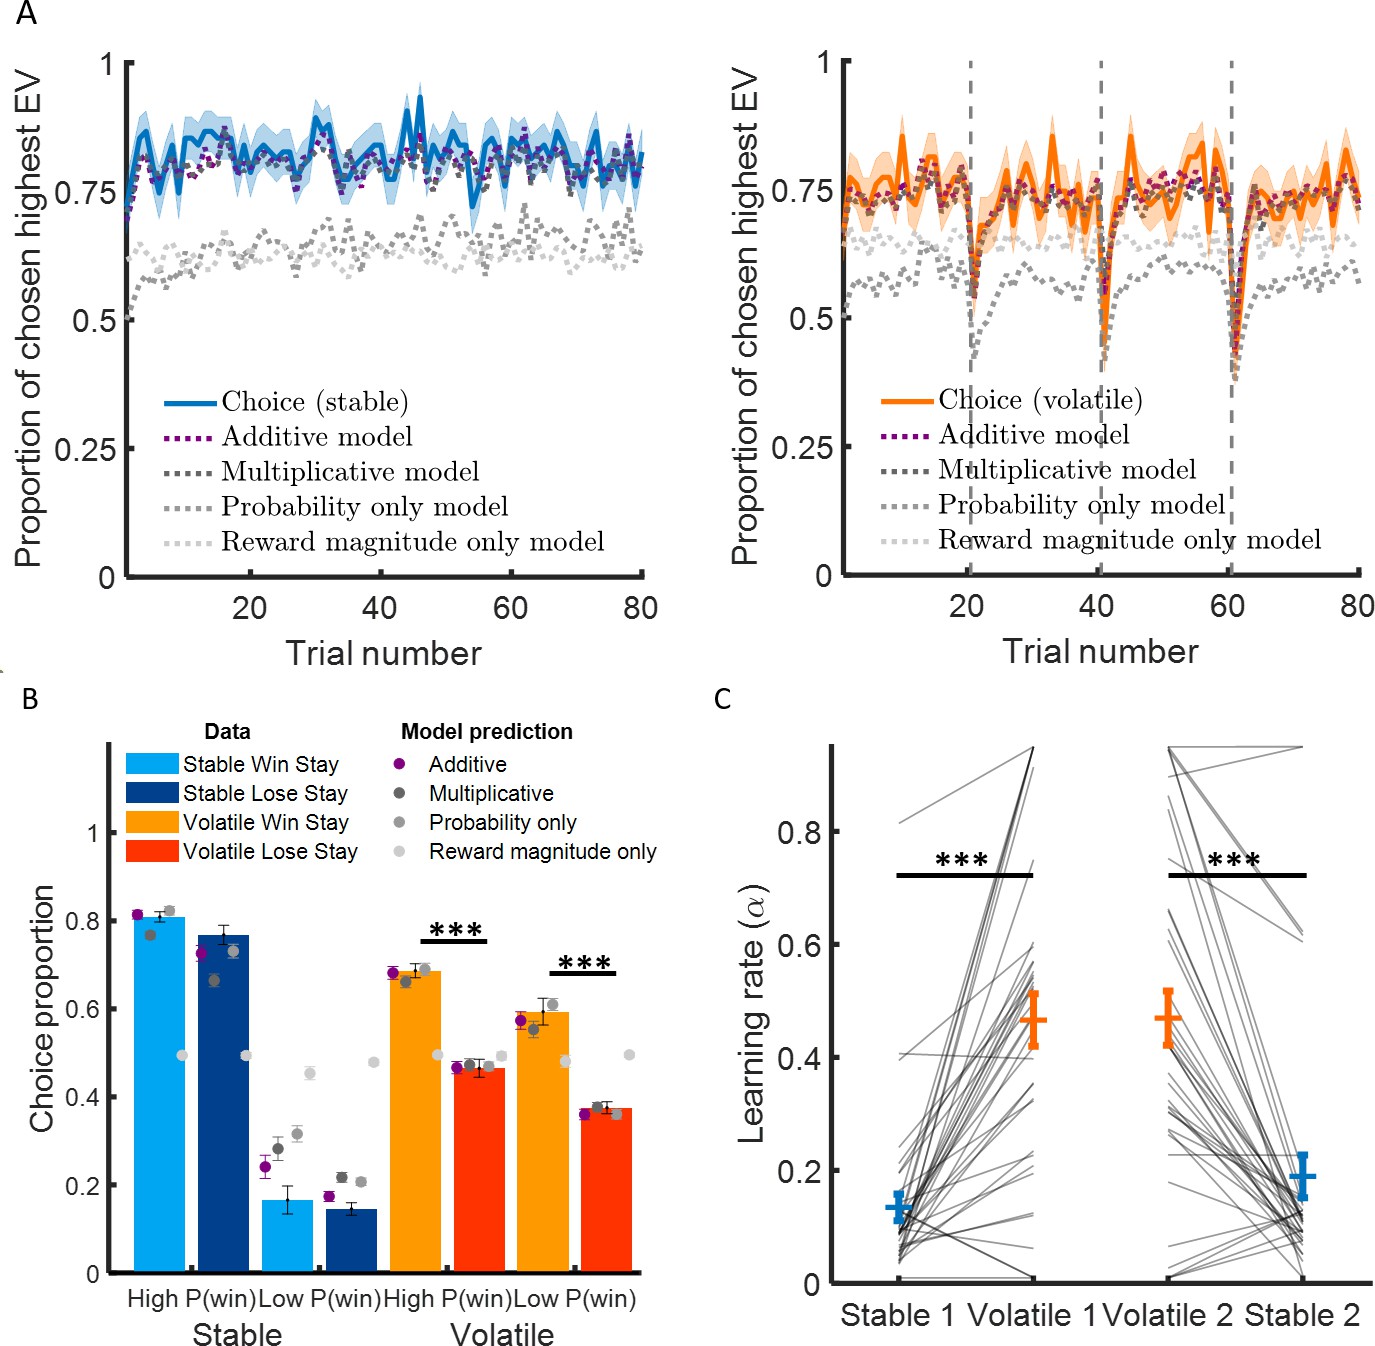
Learning rate adapts to environmental volatility.
(A) Participants chose the option with the highest expected value 82% of the time in the stable environment (blue curve, left panel) and 73% of the time in the volatile environment (orange curve, right panel). The additive model containing three parameters (a learning rate determining the sensitivity to prediction error, an inverse temperature reflecting choice stochasticity, and a relative weight for probability and reward magnitude in choice) fitted choice data well (black dashed lines) in the stable environment (mean pseudo-r2 = 0.62) and the volatile environment (mean pseudo-r2 = 0.45). (B) Participants chose more often the option with the higher probability in the stable environment compared to the volatile environment. Critically, participants stayed on the same option more often if choosing that option resulted in the car winning (light orange) compared to the car losing (dark orange) in the volatile environment compared to the stable environment (light blue and dark blue represent staying after winning and losing, respectively). This suggests that participant behaviour was more sensitive to feedback in the volatile than stable environment, as an agent with a higher learning rate would be. Additive model predictions show a similar difference in feedback sensitivity across environments (purple). (C) Learning rates were higher in the volatile environment (orange) compared to the stable environment (blue). This was true for participants completed the stable learning task before (stable 1) or after (stable 2) the volatile learning task. Error bars represent SEM. *p < 0.05, ***p < 0.001.
Figure 3 with 1 supplement
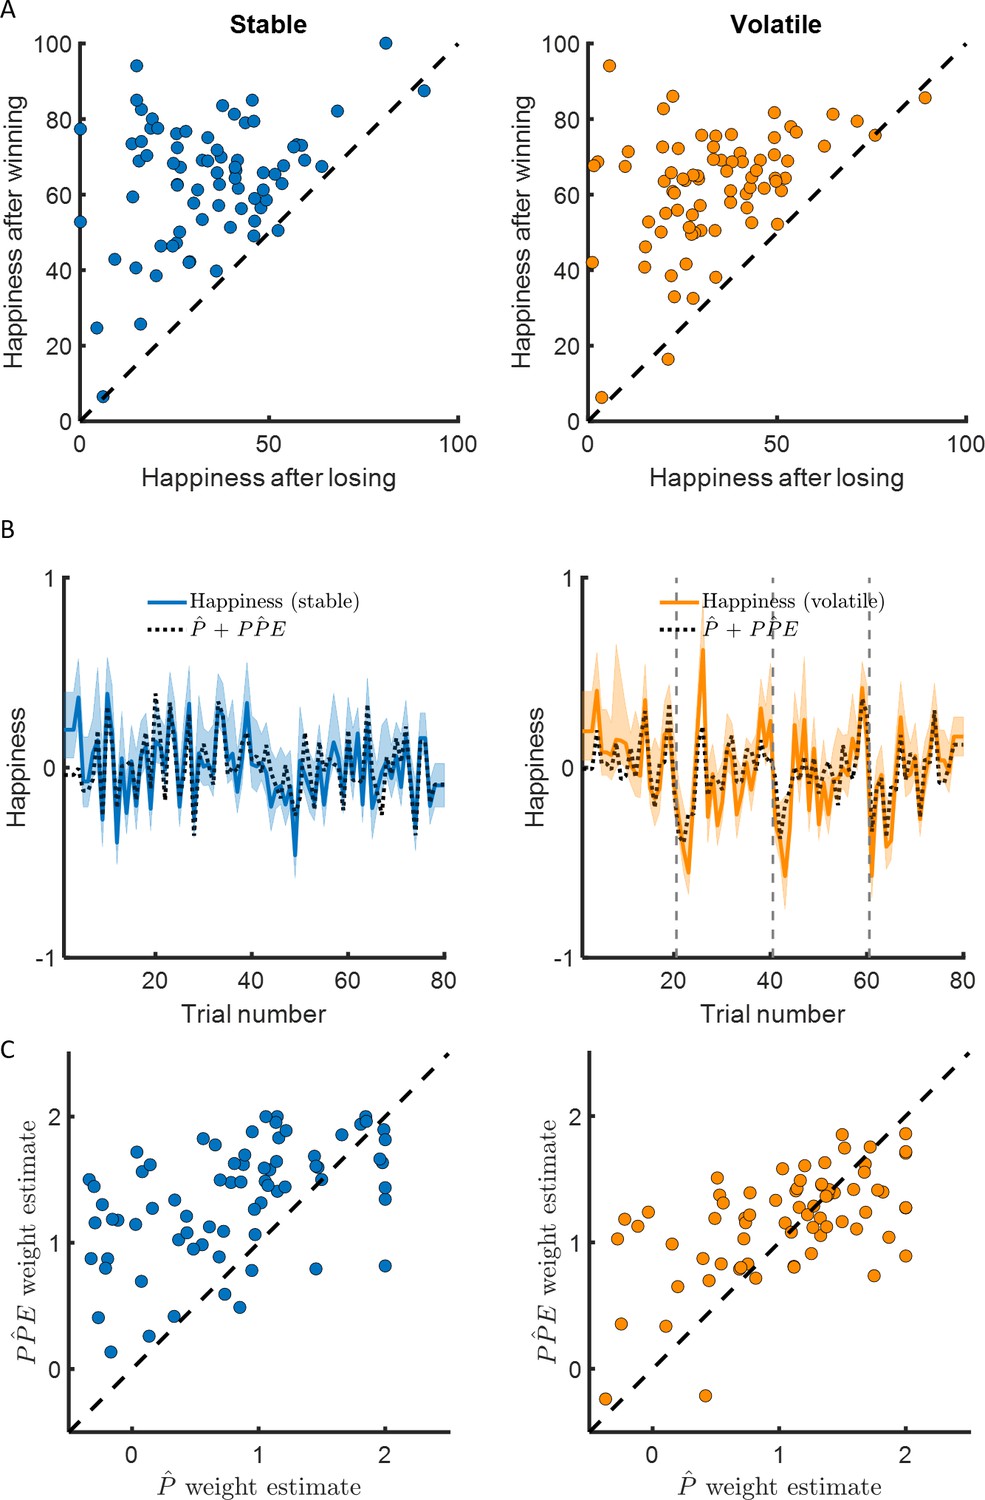
Happiness is associated with probability and probability prediction error.
(A) Most participants were happier when their chosen car won compared to when their chosen car lost (97% of participants in the stable environment, 96% in the volatile environment, in the left and right panel, respectively). (B) Momentary happiness was best explained by a model (black dotted lines) including both the chosen probability estimate and the probability prediction error (PPE) derived from the additive choice model in addition to a forgetting factor and a baseline mood parameter, for both the stable (mean r2 = 0.58) and the volatile (mean r2 = 0.62) environments. Happiness ratings were z-scored for individual participants before model fitting. The shaded areas represent SEM. (C) The chosen probability (denoted P) and the PPE parameters were significantly different from 0 for both environments. Both variables are significantly associated with changes in affective state over time. PPE weight was significantly higher than P weight in both the stable and volatile environments. See Figure 3—figure supplement 1 related to the win loss model parameters.
Figure 3—figure supplement 1
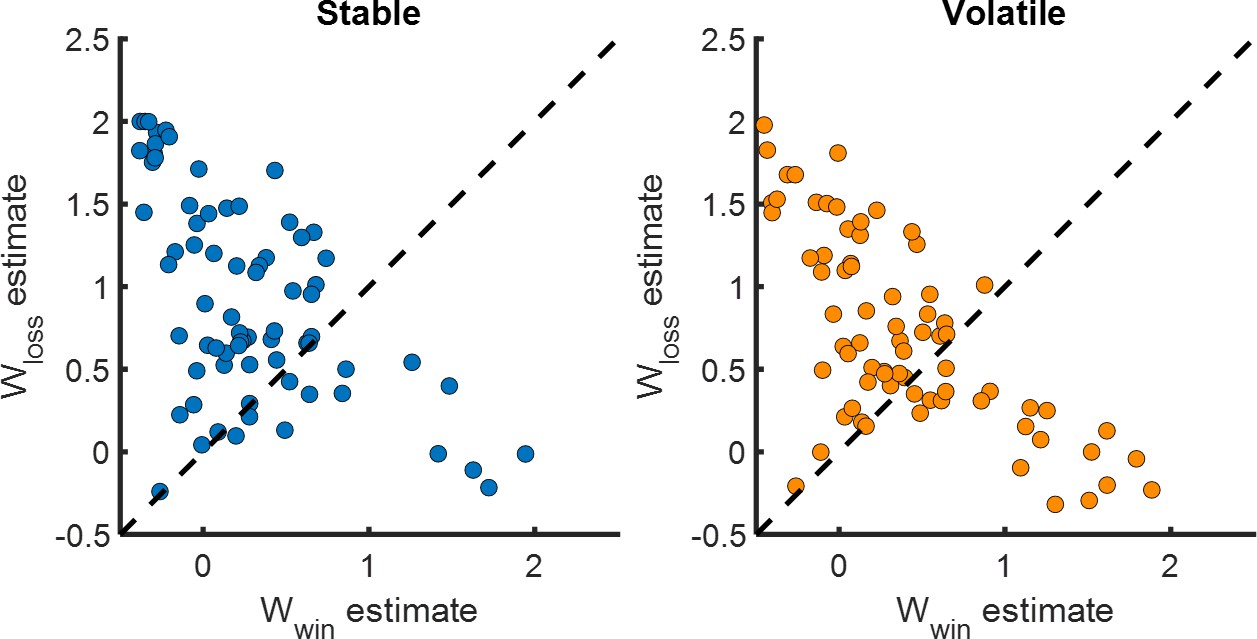
Loss weights on happiness are greater than win weights.
The win and the loss parameters were significantly different from 0 for both environments. The weight for loss was higher than the weight for win. Both variables are significantly associated with changes in affective state over time.
Figure 4 with 1 supplement
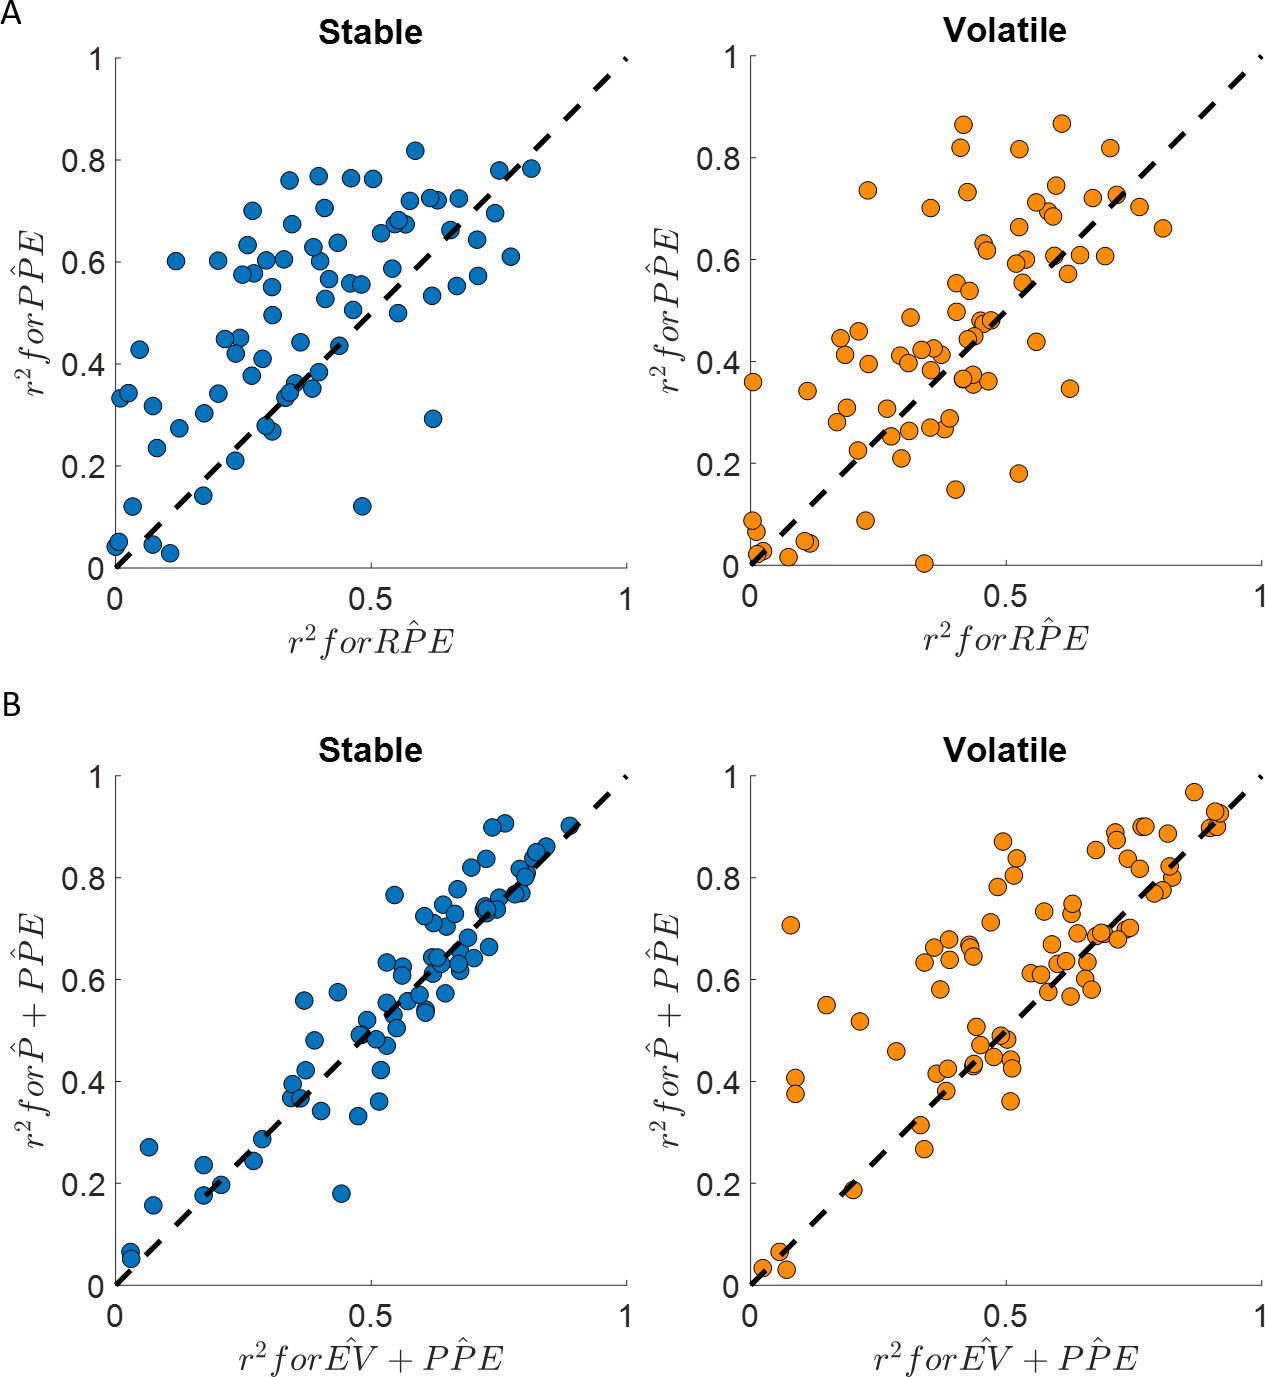
Happiness is more strongly associated with learning than choice.
(A) Comparison between the for the happiness model including a PPE term (denoted ) estimated in the additive choice model (y axis) and the r2 for the happiness model including an RPE term instead (denoted ). Both models had the same number of parameters. The model accounted for more variance in mood ratings on average in both stable (blue) and volatile (orange) learning tasks. Dots above the dashed line correspond to subjects for whom more variance in happiness is explained by the compared to the model. (B) The model including the chosen estimated probability (denoted and estimated from the additive choice model) better explained happiness ratings than a model including expected value (denoted ) for both the stable (blue) and volatile (orange) environments with both models having the same number of parameters. Dots above the dashed line correspond to subjects where more variance in happiness is explained by the compared to the model. See Figure 4—figure supplement 1 for the estimated model frequency or each model and Table 2 for other model comparison metrics.
Figure 4—figure supplement 1
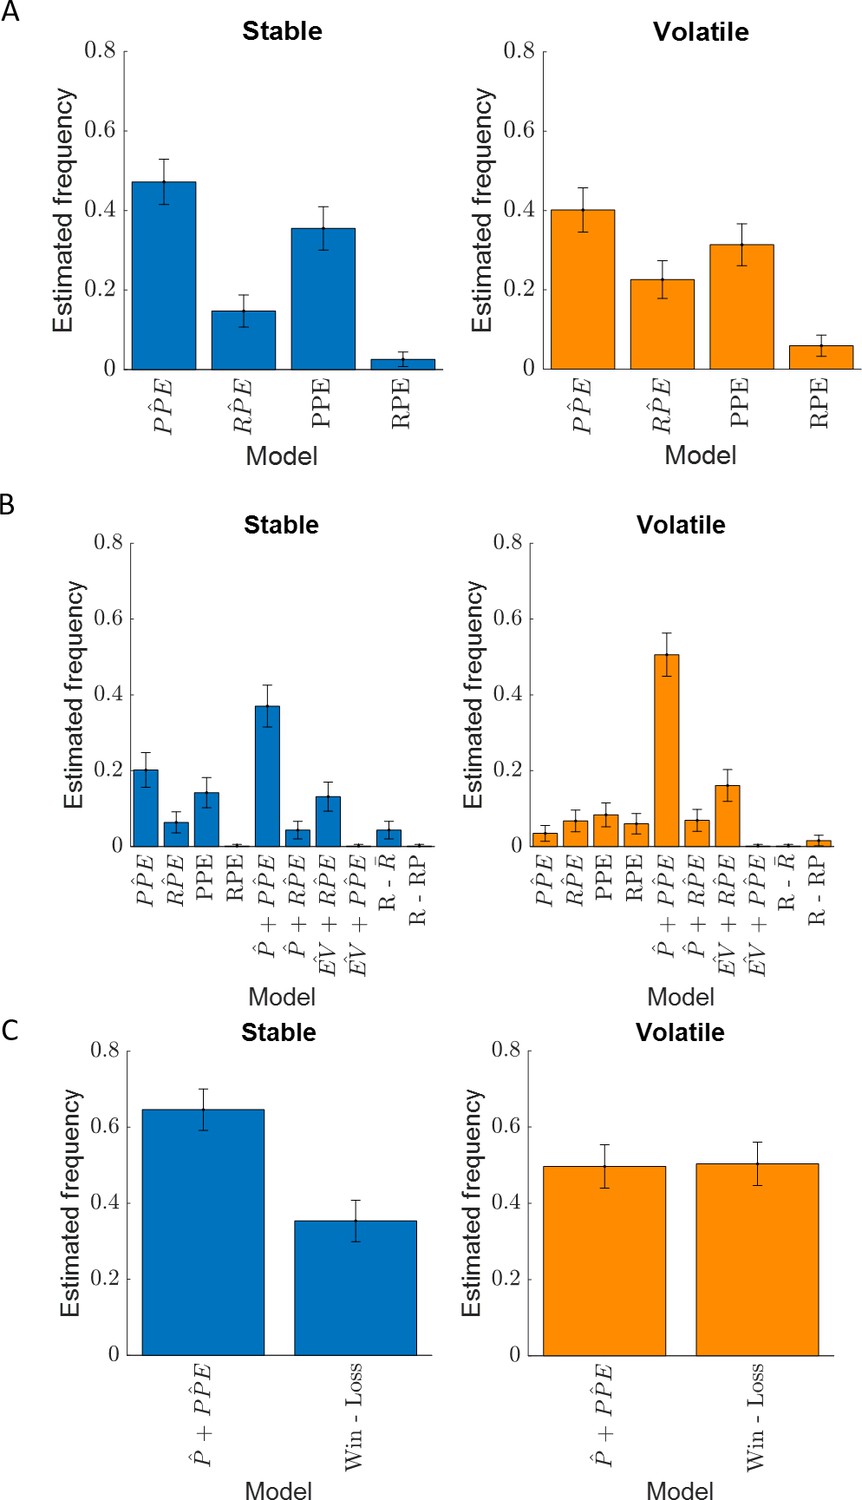
Estimated model frequency.
Error bars correspond to the estimated standard deviation. Exceedance probability (A) stable: EPPP̂E = 0.87, EPPPEmodels = 1.0, volatile: EPPP̂E = 0.81, EPPPEmodels = 1.0; (B) stable: EPP̂+PP̂E = 0.97, volatile: EPP̂+PP̂E = 1.0; (C) stable: EPP̂+PP̂E = 1.0, volatile: EPP̂+PP̂E = 0.48.
Figure 5 with 1 supplement
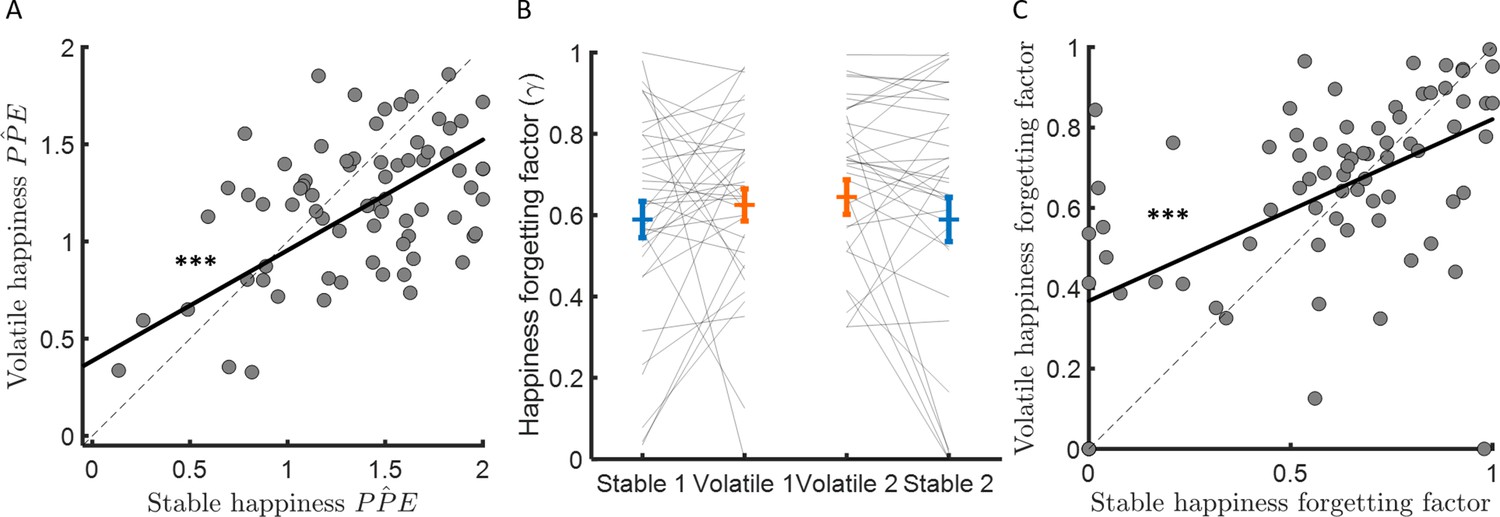
Forgetting factors are consistent across stable and volatile learning tasks.
(A) Weights for PPEs in determining happiness were consistent across environments. (B) The happiness forgetting factor did not change between stable (blue) and volatile (orange) environments, regardless of testing order. See Figure 5—figure supplement 1 for an analysis without any assumption regarding the shape of the influence decay. (C) Happiness forgetting factors were consistent across environments. Error bars represent SEM. ***p < 0.001.
Figure 5—figure supplement 1
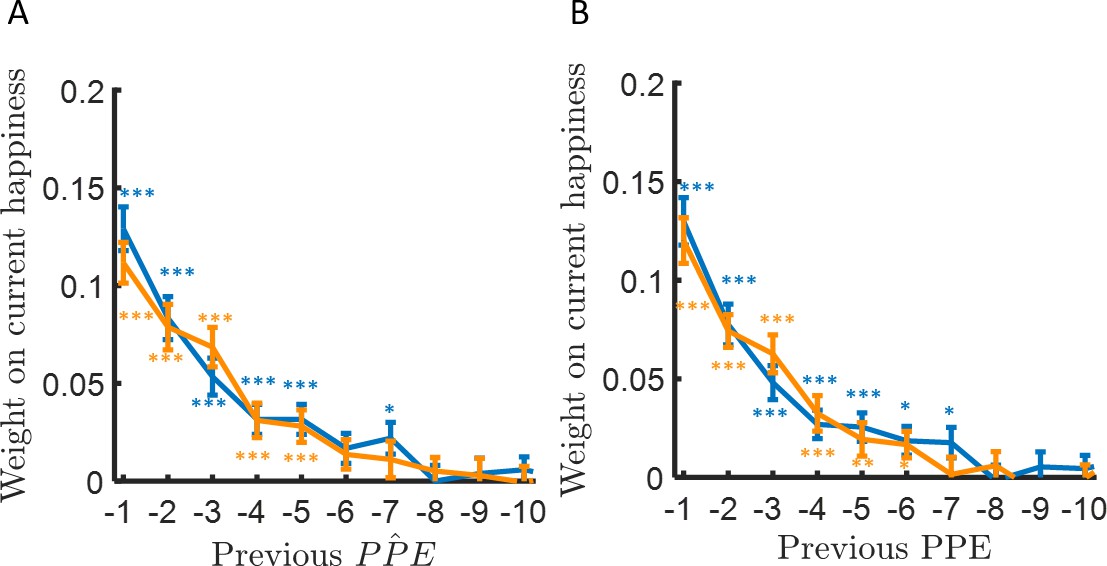
Happiness is influenced by multiple past probability prediction errors.
Each bar corresponds to the influence of the past trials on the current happiness rating in the stable (blue) and volatile (orange) environments. (A) The left panel shows the influence of probability prediction error estimated from the additive learning model (). (B) The right panel shows the influence of the objective probability prediction error (PPE). Error bars represent SEM. *p < 0.05, **p < 0.01, ***p < 0.001.
Figure 6
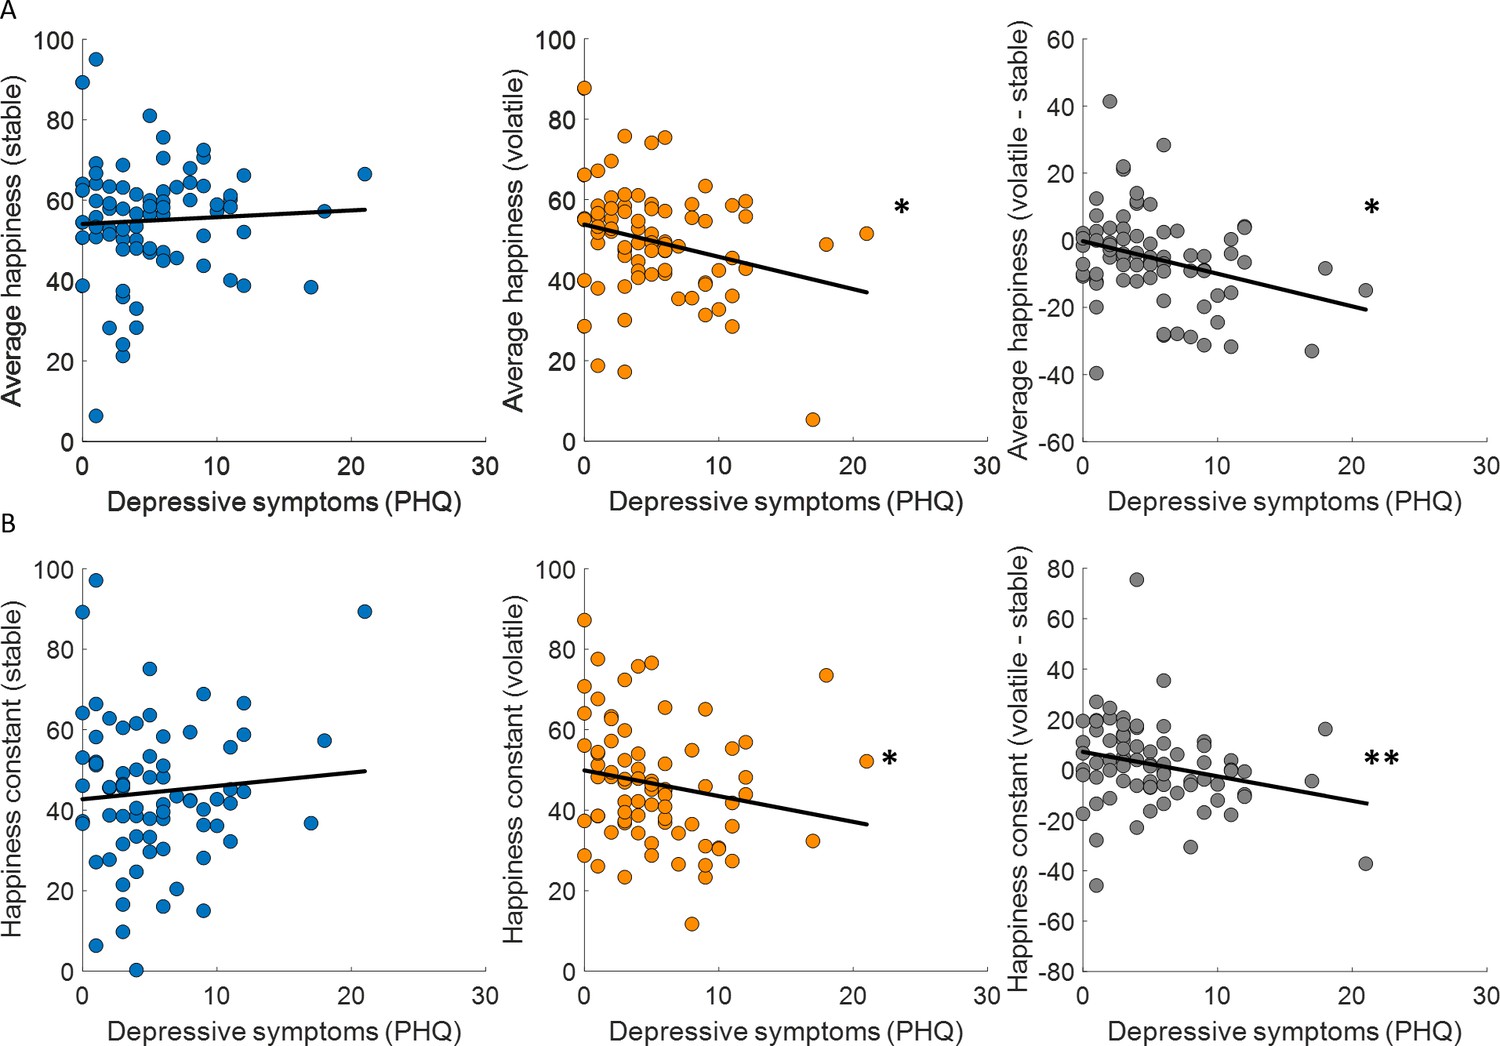
Baseline mood decreases with depressive symptoms in volatile environments.
(A) Average happiness was not correlated with depressive symptoms (PHQ) in the stable task (left panel, blue) but decreased with depressive symptoms in the volatile task (middle panel, orange). The difference in happiness between stable and volatile environments was also significantly related to depression (right panel). (B) Baseline mood parameters estimated with non-z-scored happiness ratings showed the same relationship to depressive symptoms as average happiness with lower parameters in volatile than stable environments. *p < 0.05, **p < 0.01.
Tables
Table 1
Choice model comparison results.
The ‘Additive’ model refers to a model implementing a weighted sum of probability difference and reward magnitude difference when making decisions (Donahue and Lee, 2015; Farashahi et al., 2019; Farashahi et al., 2017; Massi et al., 2018; Rouault et al., 2019). The ‘Multiplicative’ model refers to the model first used to describe behaviour in this task, which integrates reward and probability information multiplicatively (Behrens et al., 2007; Browning et al., 2015). The ‘Probability only’ model includes only the probability component of the additive model and the ‘Magnitude only’ model includes only the magnitude component of the additive model. ∆BIC refers to the Bayesian Information Criterion computed for each model compared to the additive model, the preferred model in both stable and volatile environments.
| Model | Number of parameters | Stable pseudo-r2 | Volatile pseudo-r2 | Stable BIC | Volatile BIC | Stable ΔBIC | Volatile ΔBIC |
|---|---|---|---|---|---|---|---|
| Additive | 3 | 0.62 | 0.45 | 4134 | 5605 | 0 | 0 |
| Multiplicative | 3 | 0.54 | 0.41 | 4824 | 5926 | 690 | 321 |
| Probability only | 2 | 0.35 | 0.16 | 6104 | 7635 | 1970 | 2030 |
| Magnitude only | 1 | 0.14 | 0.23 | 7473 | 6739 | 3338 | 1134 |
Table 2
Happiness model comparison results.
PPE is probability prediction error, RPE is reward prediction error, P is the probability estimate, EV is the expected value, R is reward, is the reward average, and RP is a free parameter corresponding to the reference point above and below which happiness would increase or decrease. The hat over a variable indicates that it incorporates trial-by-trial choice probability estimated from the additive choice model. ∆BIC refers to the comparison of the model scores using the Bayesian Information Criterion (BIC) compared to the model. Happiness ratings were z-scored within individuals and all models included a constant term and a forgetting factor γ in addition to the parameters indicated.
| Model | Number of parameters | Stable mean r2 | Volatile mean r2 | Stable BIC | Volatile BIC | Stable ΔBIC | Volatile ΔBIC |
|---|---|---|---|---|---|---|---|
| 3 | 0.50 | 0.44 | −698 | −559 | 184 | 587 | |
| 3 | 0.38 | 0.39 | −299 | −319 | 583 | 826 | |
| PPE | 3 | 0.48 | 0.42 | −640 | −436 | 242 | 710 |
| RPE | 3 | 0.36 | 0.36 | −223 | −212 | 658 | 934 |
| 4 | 0.58 | 0.62 | −882 | −1146 | 0 | 0 | |
| 4 | 0.56 | 0.53 | −752 | −691 | 130 | 454 | |
| 4 | 0.43 | 0.48 | −224 | −370 | 657 | 775 | |
| 4 | 0.47 | 0.51 | −370 | −504 | 511 | 641 | |
| 3 | 0.36 | 0.44 | −242 | −471 | 640 | 675 | |
| 4 | 0.35 | 0.42 | 47 | −193 | 929 | 952 | |
| Win −loss | 4 | 0.57 | 0.63 | −848 | −1181 | 34 | −35 |
Additional files
Download links
A two-part list of links to download the article, or parts of the article, in various formats.
Downloads (link to download the article as PDF)
Open citations (links to open the citations from this article in various online reference manager services)
Cite this article (links to download the citations from this article in formats compatible with various reference manager tools)
Momentary subjective well-being depends on learning and not reward
eLife 9:e57977.
https://doi.org/10.7554/eLife.57977


