Studying the biology of cytotoxic T lymphocytes in vivo with a fluorescent granzyme B-mTFP knock-in mouse
- Cellular Neurophysiology, Center for Integrative Physiology and Molecular Medicine (CIPMM), Saarland University, Germany
- Department of Molecular Neurobiology, Max-Planck-Institute of Experimental Medicine, Germany
- Diabetes Research Institute and Cell Transplant Center, University of Miami Miller School of Medicine, United States
- Department of Surgery, University of Miami Miller School of Medicine, United States
- Department of Microbiology and Immunology, University of Miami Miller School of Medicine, United States
- Department of Ophthalmology, University of Miami Miller School of Medicine, United States
- Diabetes Research Institute Federation, United States
- The Rolf Luft Research Center for Diabetes and Endocrinology, Karolinska Institutet, Karolinska University Hospital, Sweden
- Sensory and Neuroendocrine Physiology, Center for Integrative Physiology and Molecular Medicine (CIPMM), Saarland University, Germany
Figures
Figure 1 with 1 supplement

Generation of GzmB-mTFP knock-in mice.
(A) CRISPR-Cas9 strategy to generate the GzmB-mTFP-KI. wt, wild-type; KI, GzmB-mTFP-KI; numbered black boxes, Gzmb exons; red bar, Stop codon; yellow bar, GGSGGSGGS-linker; green box, mTFP coding sequence; rightward black arrow, forward genotyping primer wt; rightward green arrow, forward genotyping primer KI; leftward black arrow, reverse common genotyping primer (primers are not drawn to scale). (B) PCR of CTL lysates derived from wild-type, heterozygous and homozygous GzmB-mTFP-KI mice using oligonucleotides FP, RP and KI. (C) Western blot of lysates derived from wild-type and GzmB-mTFP-KI CTLs 4 and 5 days after activation. Anti-GzmB and anti-mTFP antibodies were used for detection, anti-GAPDH antibody served as loading control. (D) Western blot of lysates derived from naïve GzmB-mTFP-KI CTLs and 1, 2, 3, 4 and 5 days after activation with anti-CD3/anti-CD28 coated beads. Lysates from wild-type CTLs 5 days after activation were used for comparison, anti-GAPDH antibody served as loading control. (E) CTLs from GzmB-mTFP-KI mice were isolated and analyzed by FACS at the indicated days after activation. Non-activated CTLs (day 0) served as negative control.
Figure 1—figure supplement 1
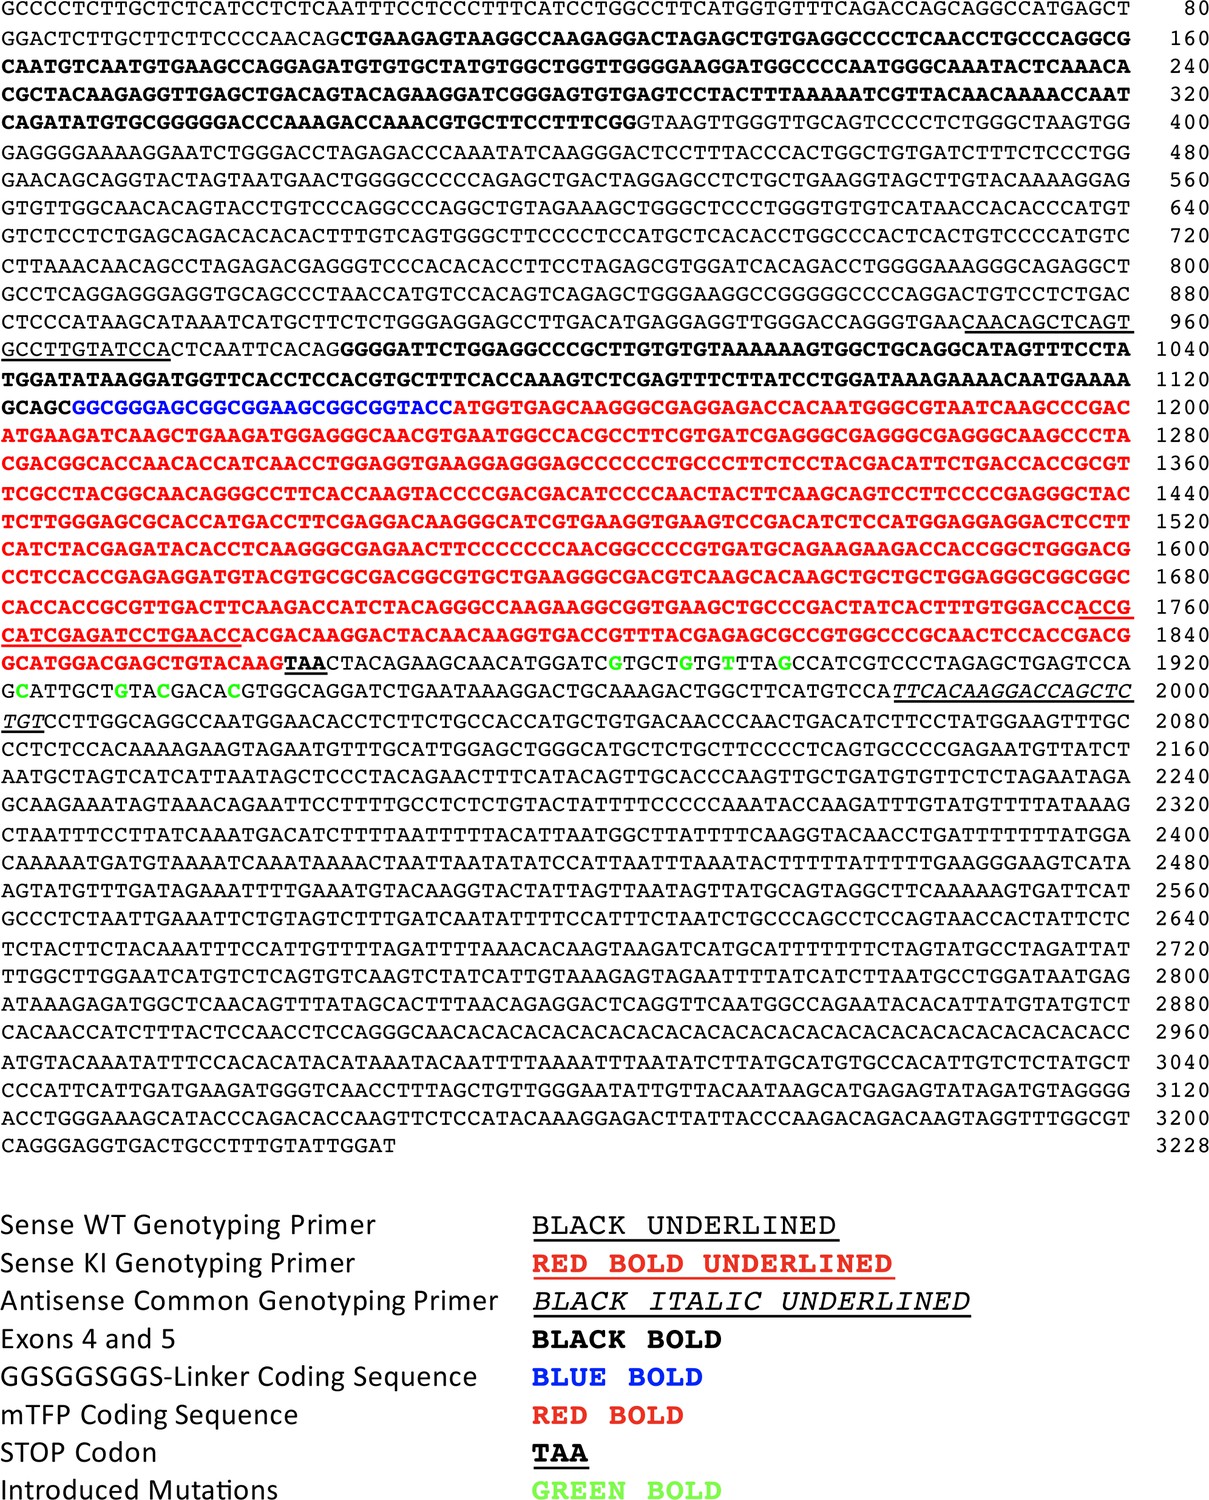
Design of the HDR fragment to generate the GzmB-mTFP-KI The HDR fragment was designed to replace the endogenous Stop codon of the Gzmb gene by sequences encoding a GGSGGSGGS-linker, mTFP and a Stop codon.
Some sites were mutated (green bold) to protect the HDR fragment against cleavage in the presence of the sgRNA used, and of sgRNAs that had initially been envisioned for this project but were ultimately not used. The proper insertion of the HDR fragment into the genome was determined by PCR. For this purpose, we used primer 36016 (5’-ATC AAA GAA CAG GAG AAG ACC CAG-3’, Exon 3) in combination with primer 33615 (5’-GGT GTT GGT GCC GTC GTA GGG-3’, mTFP) (1433 bp fragment) and primer 19524 (5’-ACC GCA TCG AGA TCC TGA ACC-3’, mTFP) in combination with primer 36017 (5’-AAT GGC TAA GCA ATC CCA TCA GG-3’, downstream of HDR1) (1565 bp fragment).
Figure 2
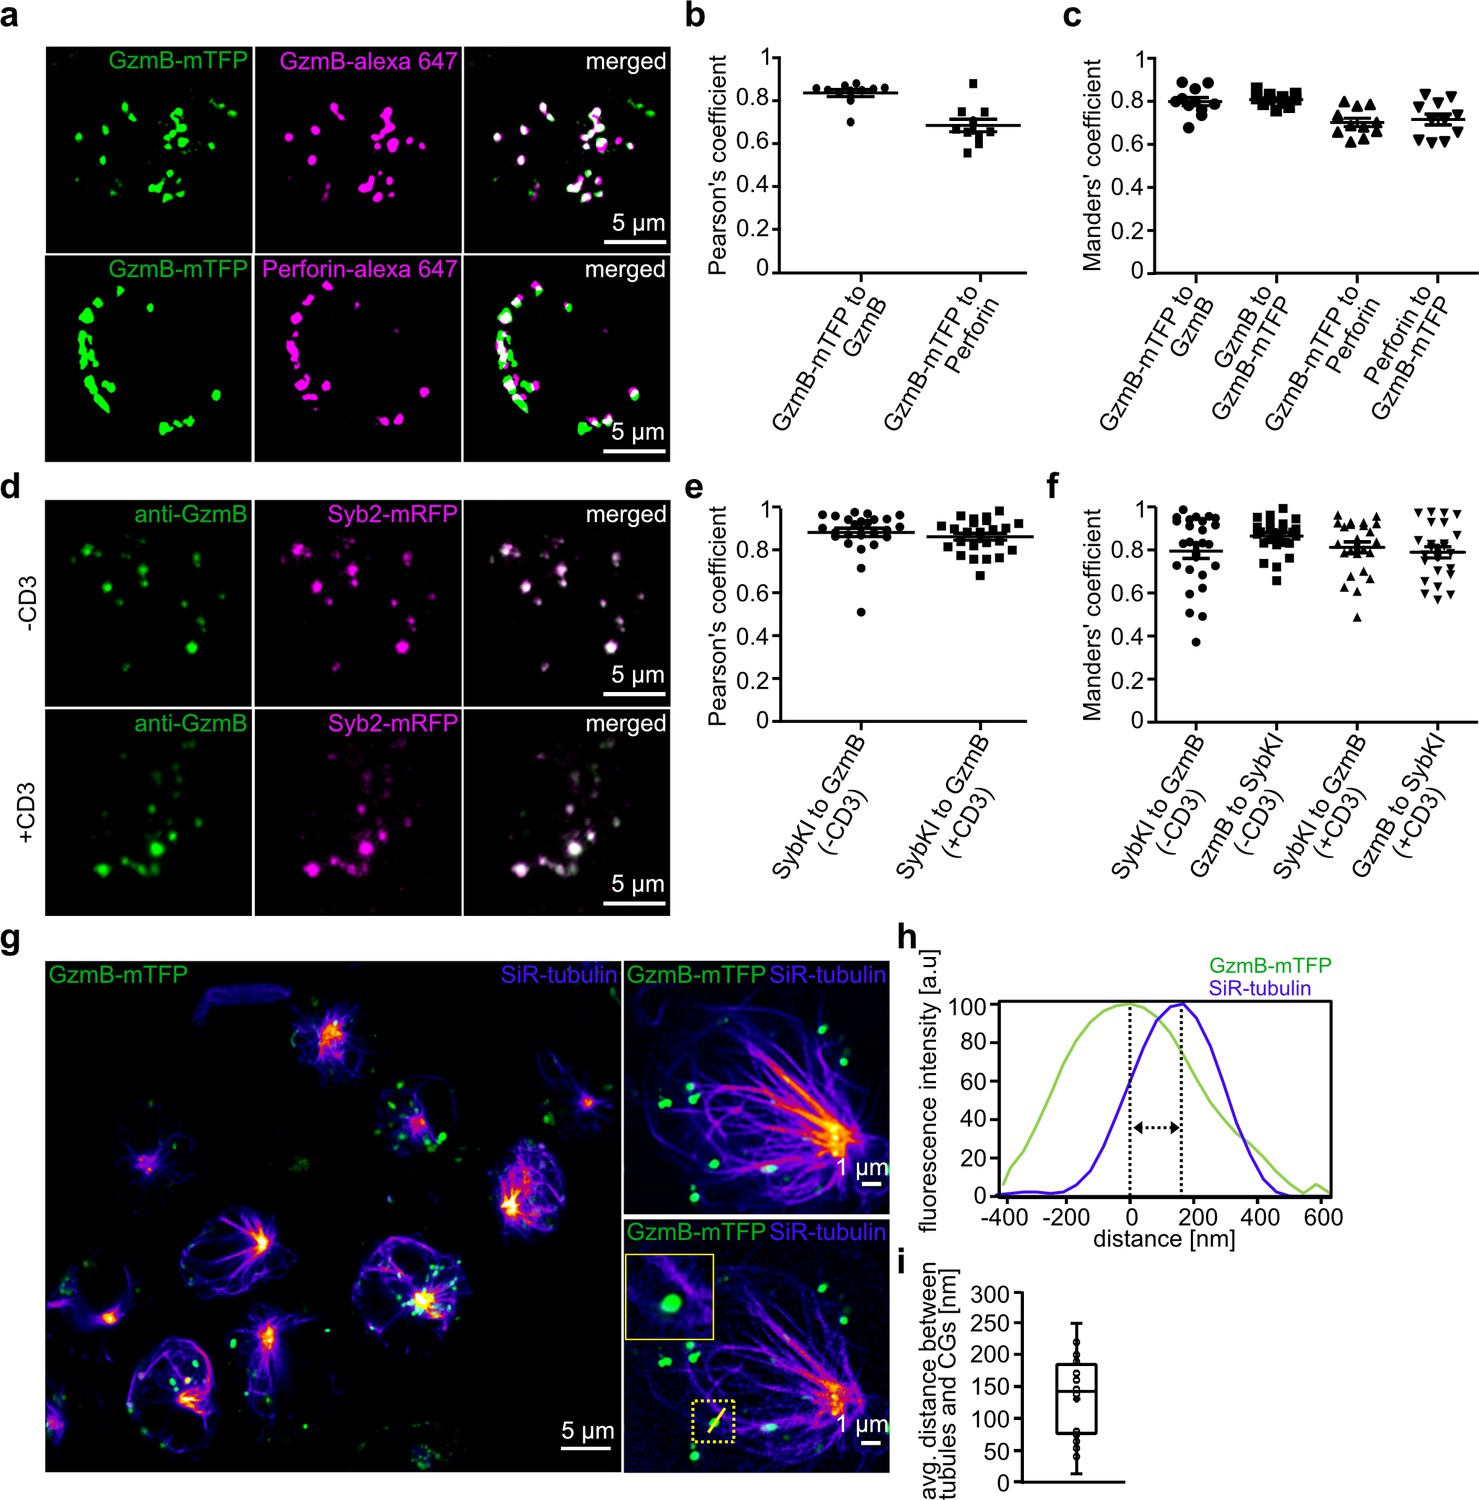
Endogenous GzmB-mTFP fluorescence co-localizes with CG markers and migrates to the IS.
(A) SIM images of primary CTLs from GzmB-mTFP-KI mice on day five after activation. CTLs were fixed and stained with Alexa647 conjugated anti-GzmB antibody (upper panel) or Alexa647 conjugated anti-perforin antibody (lower panel). (B–C) Pearson’s and Manders coefficients of corelation between GzmB-mTFP and the other CG markers. (D) SIM images of primary CTLs from Syb2-mRFP/GzmB-mTFP double KI mice on day five after activation. CTLs were fixed and examined for endogenous fluorescence in the mTFP and mRFP channels. (E–F) Pearson’s and Manders coefficients of correlation between GzmB-mTFP and Syb2-mRFP. Scale bars, 5 µm. (G) Live STED images of primary CTLs from GzmB-mTFP-KI mice labeled with SiR-tubulin and plated onto anti-CD3 coated coverslip. The transport of CG along the microtubules toward the IS is shown in the overview for all CTLs (left; Scale bar, 5 µm) and in more detail in the two exemplary CTLs (right; Scale bar, 1 µm). (H) Distance between CG and microtubule from exemplary image quantified by ImageJ software. (I) Average distance between microtubules and CGs (n = 19).
Figure 3
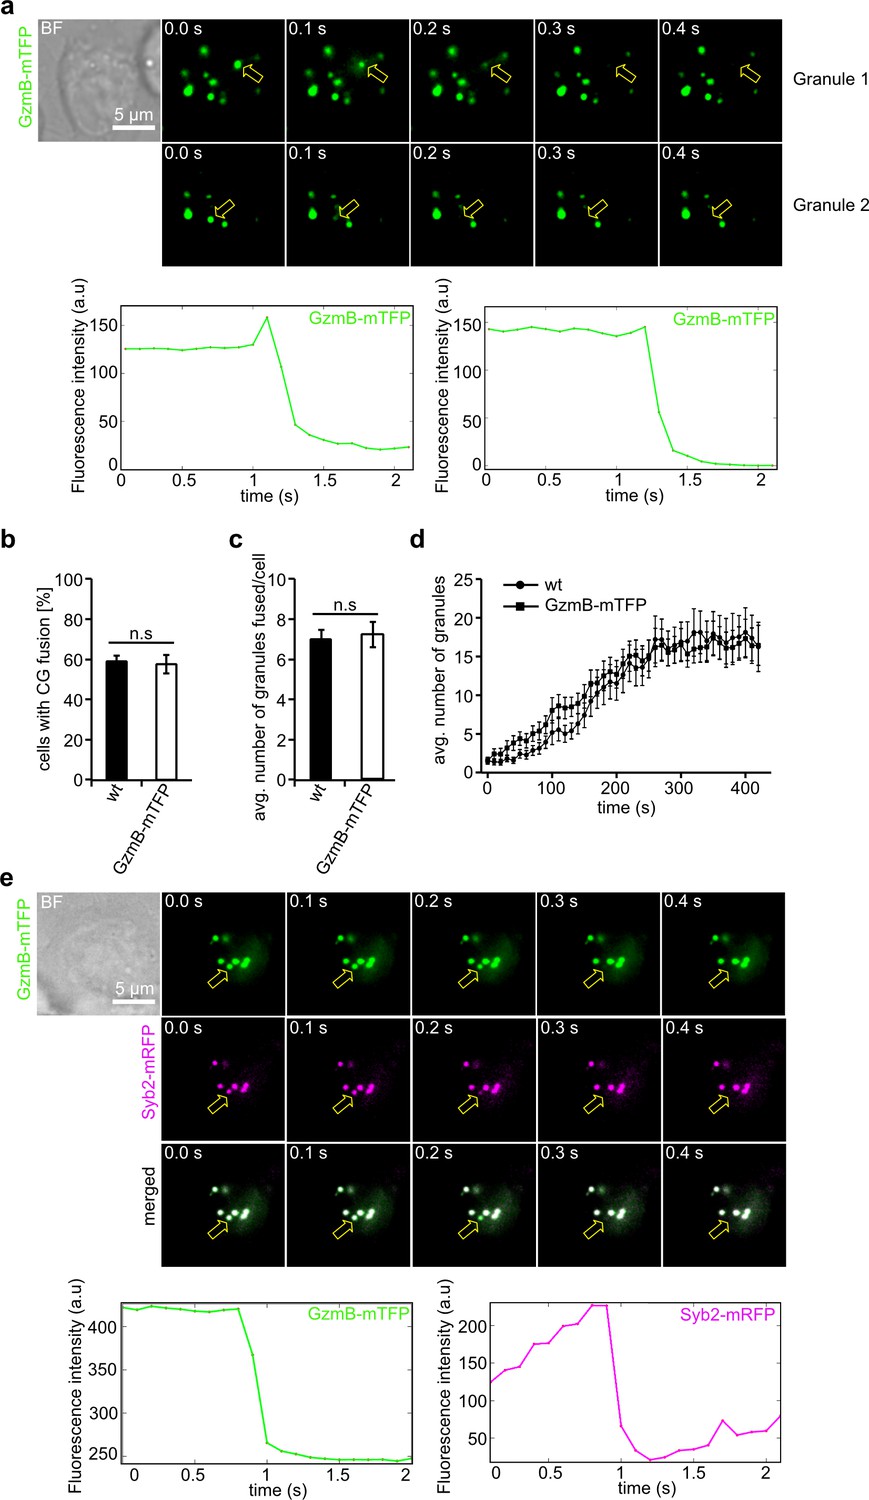
GzmB-mTFP containing cytotoxic granules fuse at the IS.
(A) Selected live-cell TIRF microscopy images of GzmB-mTFP in a CTL in contact with an anti-CD3 coated coverslip. Fusion events are indicated with open arrows (seven consecutive frames per fusion event are shown). Scale bar, 5 µm. (B) Selected live-cell, dual-channel TIRF microscopy images of GzmB-mTFP and Syb2-mRFP in a CTL derived from Syb2-mRFP/GzmB-mTFP double KI mice and in contact with an anti-CD3 coated coverslip. Fusion events are indicated with open arrows (seven consecutive frames per fusion event are shown). (C–D) Comparison between wild-type and GzmB-mTFP-KI CTLs reveals no difference in the percentage of CTLs showing fusion (C) and average number of fused CG per cell (D). (E) Mean average number of CGs appearing in the TIRF plane per cell during 7 min of measurements (N = 3, n = 10 for wt; and N = 3, n = 12 for GzmB-mTFP KI).
Figure 4
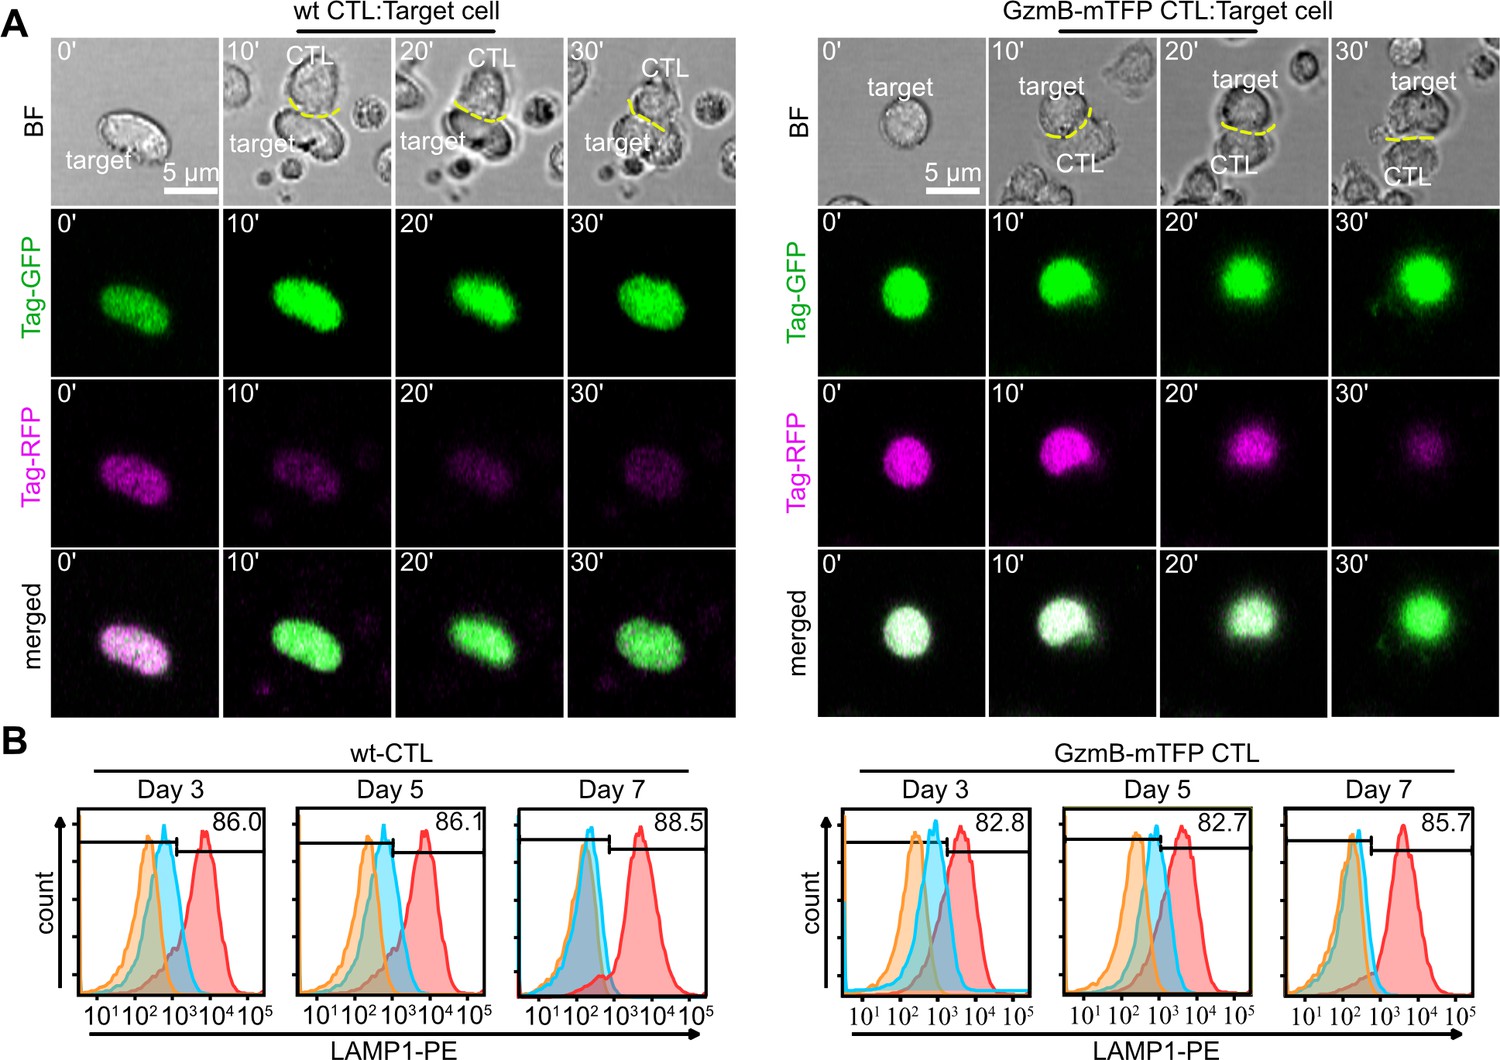
CTLs from GzmB-mTFP-KI mice kill target cells as efficient as wild-type CTLs.
(A) Live cell killing assay showing a wild-type (left) and GzmB-mTFP-KI (right) CTL in contact with P815 target cells stably expressing Casper3-GR (FRET construct containing Tag-GFP and Tag-RFP with a target cleavage site DEVD of Caspase 3 (activated via GzmB). LSM images at indicated time points show a reduction in FRET signal, indicating the killing of the target cell. Scale bars, 5 µm. (B) CTLs isolated from either wt (left) or GzmB-mTFP-KI (right) mice were assessed for degranulation capacity using FACS-based assay on day 3, 5 and 7, respectively. Data shown are representative histograms from three independent experiments. Orange areas show untreated CTLs, blue areas show constitutive secretion and red areas show stimulated secretion.
Figure 5 with 3 supplements
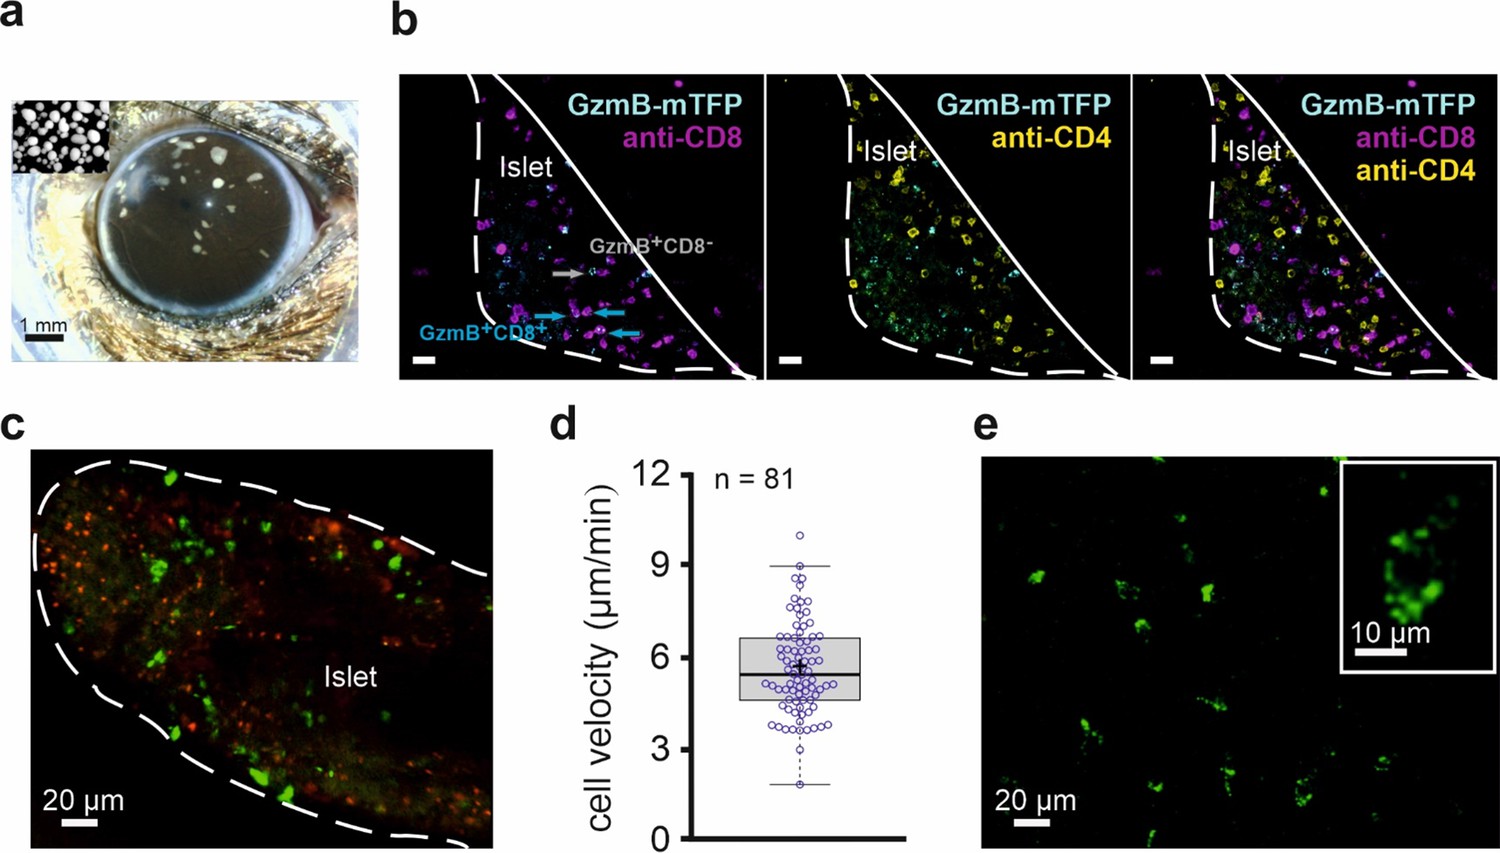
In vivo imaging of allorejection in the anterior chamber of the eye (ACE) visualized by CTLs from GzmB-TFP-KI mice.
(A) Binocular image of a mouse eye with islets of Langerhans from DBA/2 mice transplanted into the anterior chamber of the eye (ACE) 4 days prior to the image. Islets can be identified as small white spots in the range between 100–300 µm diameter located on top of the iris. Inset shows cultured islets before transplantation. (B) Confocal images of a pancreatic islet inside the ACE fixed and sliced at POD14. The outline defines the boundary of the islet of Langerhans localize on the iris. Green cells are cytotoxic T lymphocytes marked by endogenously expressed GzmB-mTFP having infiltrated the islet during the immune response. Antibody staining of CD8+ (blue) and CD4+ (magenta) T cells are shown. (C) In vivo confocal microscopy of an islet during allorejection in the ACE (POD14). White line marks the boundary of pancreatic islet toward the ACE lumen. Faint green (excitation 458 nm wavelength) and red (excitation 561 nm wavelength) signals are autofluorescence. CTLs marked by GzmB-mTFP (green, excitation 488 nm) infiltrated the islet during the immune response. (D) Velocity of 81 migrating CTLs tracked from panel (C) after imaging for >30 min. Mean is shown as a plus symbol, median as a line. See also Figure 5—video 1. (E) Two-photon image of GzmB-mTFP positive cells from the corneal area. Individual vesicles inside the CTL are easily identified (inset). See also Figure 5—video 2.
Figure 5—figure supplement 1

Longitudinal and repetitive observations of transplanted islets inside the ACE.
(A) Two-photon image at POD14 of the capillary network of a transplanted islet. Rhodamine-dextran was injected into the tail vein of the mouse 15 min before acquisition to label blood vessels. Vessels are displayed in red and GzmB-mTFP positive cells in green. For excitation the two-photon laser was tuned to 880 nm for GzmB-mTFP and 1040 nm for rhodamine-dextran. A video of the imaged islet is shown in Video 1. (B) Quantitative analysis of the number of CTLs (GzmB-mTFP positive cells) approaching the islets are displayed as a function of time. Data from 11 islets from four different animals are shown. Each animal was in vivo imaged repetitively over 4 to 5 weeks (POD7-35). (C) Series of weekly acquired confocal in vivo images of the same islet demonstrating tissue rejection. Images show maximum intensity projections of a 40 µm thick stack (11 planes) through a group of islets. Brightness of the image is heavily stretched to visualize islets by faint autofluorescence. Scale bars: 100 µm. (D) Reduction of islet volume during rejection. Stacks of islets were acquired weekly and the volume was measured in 3D by surface rendering with Imaris software. Islet volume starts to shrink at POD14, at POD28 islets were completely rejected.
Figure 5—video 1
In vivo imaging of migrating T cells during infiltration of a transplanted pancreatic islet.
Same islet as in Figure 5D. A maximum intensity projection of 11 planes covering a 40 µm thick stack over 32 min is shown. The movie was acquired with a confocal laser scanning microscope. Faint green (excitation 458 nm wavelength) and red (excitation 561 nm wavelength) signals are autofluorescence. Bright green signals are coming from lytic granules of cytotoxic cells expressing GzmB-mTFP. First part of the movie shows the overall migration pattern of GzmB-mTFP expressing CTLs. The second part starts zoomed in to the upper right area of the islet were single lytic granules in a migrating cell can be observed.
Figure 5—video 2
In vivo imaging of migrating T cells in the cornea by two-photon microscopy Same experiment as in Figure 5E.
A maximum intensity projection of 11 planes covering a 40 µm thick stack with 2 µm interval distance over 40 min is shown. The first part of the video shows the overall migration pattern of GzmB-mTFP expressing CTLs in the cornea. The second part zooms into the lower right area of the islet where single lytic granules in a migrating cell can be observed.
Author response image 1
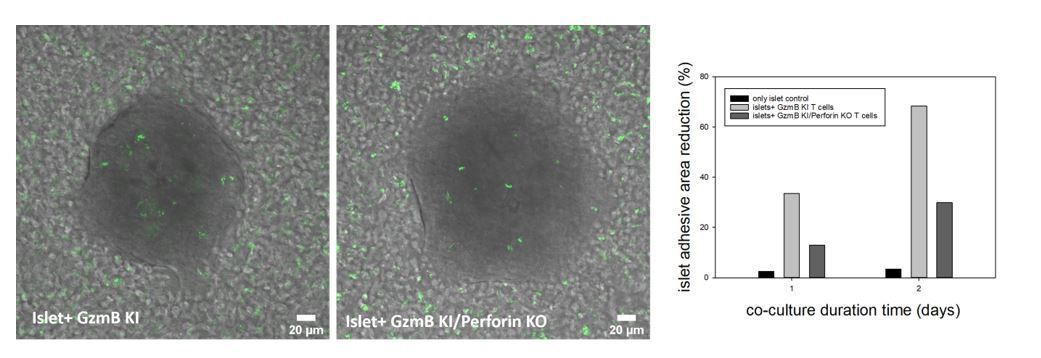
Islets of Langerhans were incubated with CTLs derived from GzmB-mTFP KI (left) and GzmB-mTFP KI/Perforin KO mice (middle) and imaged by confocal microscopy.
CTLs started to infiltrate the islets and kill them, which resulted in a detachment of islets from the culture dish. Quantification of the detachment at day 1 and day 2 of co-culture (right panel) shows a clear killing deficit in GzmB-mTFP KI/Perforin KO compared to GzmB-mTFP KI alone.
Videos
Video 1
In vivo imaging of the capillary network of a transplanted pancreatic islet.
The pancreatic islet was transplanted into the ACE 14 days prior the experiment. The movie is a maximum intensity projection of 11 planes covering a 40 µm thick stack over 37 min and was acquired with a two-photon microscope tuned to 880 nm for GzmB-mTFP (CTL marker) and 1040 nm for rhodamine-dextran (MW 70 kD; blood vessel marker).
Tables
Key resources table
| Reagent type (species) or resource | Designation | Source or reference | Identifiers | Additional information |
|---|---|---|---|---|
| Antibody | anti-GAPDH (rabbit polyclonal) | Cell Signaling Technology | Cat# 2118L; Clone-14C10 | WB (1:5000) |
| Antibody | anti-tRFP (rabbit polyclonal) | Evrogen | Cat# ab233 | WB (1:2000) |
| Antibody | anti-Granzyme B (rabbit polyclonal) | Cell Signaling Technology | Cat# 4275S | WB (1:2000) |
| Antibody | Alexa647-coupled anti-Granzyme B (mouse IgG1, κ) | BioLegend | Cat# 515405; clone-GB11 | IF (1:200) |
| Antibody | Alexa647-coupled anti-perforin (mouse, IgG2b, κ) | BioLegend | Cat# 308109; clone-dG9 | IF (1:200) |
| Antibody | Hamster anti-mouse (CD3ε) | BD Pharmingen | Cat# 553058; clone-145–2 C11 | 30 µg/ml |
| Antibody | Rat Brilliant Violet421 anti-mouse CD8a (rat, IgG2a, κ) | BioLegend | Cat# 100737; clone-53–6.7 | IHC (1:200) |
| Antibody | Rat APC anti-mouse CD4 (rat, IgG2b, κ) | BioLegend | Cat# 100412; clone-GK1.5 | IHC (1:200) |
| Antibody | Rat anti-mouse CD107a-PE (rat, IgG2a, κ) | BioLegend | Cat# 121611; clone-ID4B | FACS (1:200) |
| Recombinant DNA reagent | Casper3-GR (plasmid) | Evrogen | Cat# FP971 | |
| Recombinant DNA reagent | pMAX-Granzyme B-mCherry (mouse) | This paper | Figure 3, Available from the authors upon request | |
| Recombinant DNA reagent | pMAX-Casper3-GR (plasmid) | This paper | Figure 4A; Available from the authors upon request | |
| Biological sample (Mus musculus) | Primary CD8+ T lymphocytes | This paper | Freshly isolated from spleen of Granzyme B-mTFP knock-in mouse(8–20 weeks old); Mouse available from EMMA mouse depository |
Additional files
-
Source data 1
Chitiralaetal_Source Data.xlsx.
- https://cdn.elifesciences.org/articles/58065/elife-58065-data1-v1.xlsx
-
Transparent reporting form
- https://cdn.elifesciences.org/articles/58065/elife-58065-transrepform-v1.docx
Download links
A two-part list of links to download the article, or parts of the article, in various formats.
Downloads (link to download the article as PDF)
Open citations (links to open the citations from this article in various online reference manager services)
Cite this article (links to download the citations from this article in formats compatible with various reference manager tools)
Studying the biology of cytotoxic T lymphocytes in vivo with a fluorescent granzyme B-mTFP knock-in mouse
eLife 9:e58065.
https://doi.org/10.7554/eLife.58065


