The manifold actions of signaling peptides on subcellular dynamics of a receptor specify stomatal cell fate
- Howard Hughes Medical Institute and Department of Biology, University of Washington, United States
- Institute of Transformative Biomolecules (WPI-ITbM), Nagoya University, Japan
- Howard Hughes Medical Institute and Department of Molecular Biosciences, The University of Texas at Austin, United States
- Department of Physics, University of Washington, United States
Figures
Figure 1 with 1 supplement
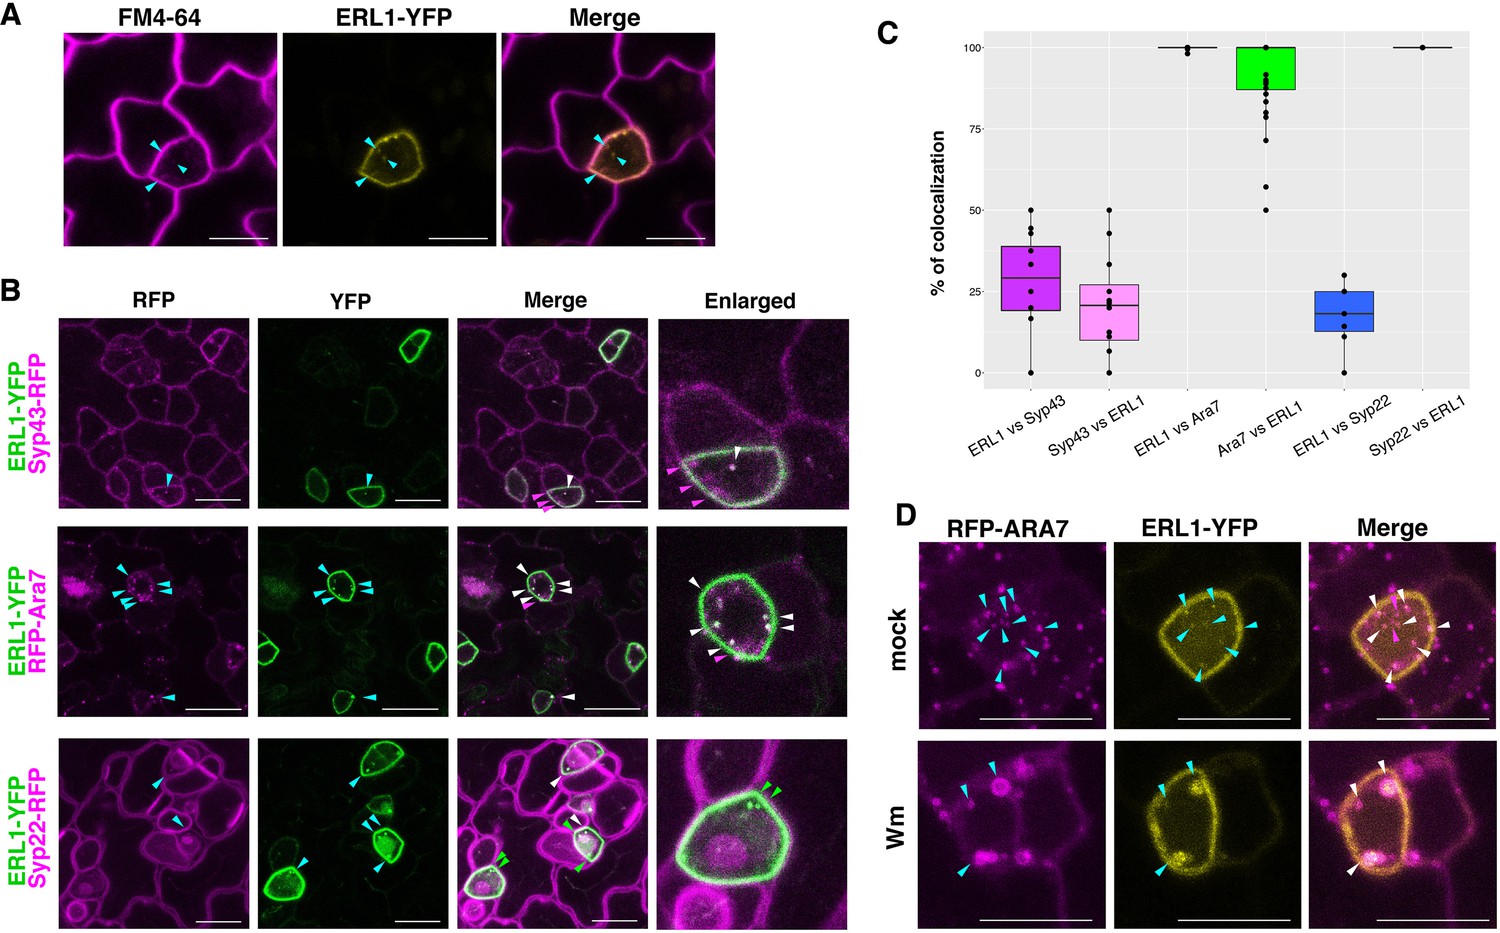
ERL1-YFP has dual localization on plasma membrane and late endosomes.
(A) Representative confocal microscope images of ERL1-YFP expression in a meristemoid (yellow) co-stained with 10 μM FM4-64 (magenta). Cyan arrowheads, ERL1-YFP endosomes co-localizing with FM4-64 stains. Scale bars = 7.5 µm. (B) Representative confocal microscope images of ERL1-YFP co-localization analysis with the TGN marker SYP43-RFP (top), the MVB/LE marker RFP-ARA7 (middle), and the MVB/LE and vacuole marker SYP22-RFP (bottom) in the abaxial epidermis of developing true leaves of the 7-day-old seedlings. Merged images are shown in the third column, with enlarged images of representative meristemoids in the right column. Arrowheads point to endosomes bearing ERL1-YFP, SYP43-RFP, RFP-ARA7, and/or SYP22-RFP: cyan, single channels; green, YFP; magenta, RFP; white, co-localization . Scale bars = 10 µm. (C) Quantitative analysis of the co-localized endosomes between ERL1-YFP and the subcellular marker proteins. Percentage of the endosomes of the former protein that co-localize with the latter protein is shown as dots. Lines in the boxplot show the median value of each group, and the boxes represent from the first to third quartiles. Number of cells analyzed, n = 40 for ERL1 vs ARA7 or ARA7 vs ERL1; n = 12 for ERL1 vs SYP43 or SYP43 vs ERL1; n = 7 for ERL1 vs SYP22 or SYP22 vs ERL1. (D) ERL1-YFP and RFP-ARA7 treated with Wm. Shown are RFP-ARA7 (left column) and ERL1-YFP (middle column) in the abaxial epidermis of developing true leaves of the 7-day-old seedlings treated with mock (top row) or 30 µM Wm (bottom row). Arrowheads point to ERL1-YFP and/or RFP-ARA7 endosomes: cyan, single channels; magenta, YFP; white, co-localization. Scale bars = 10 µm.
Figure 1—figure supplement 1
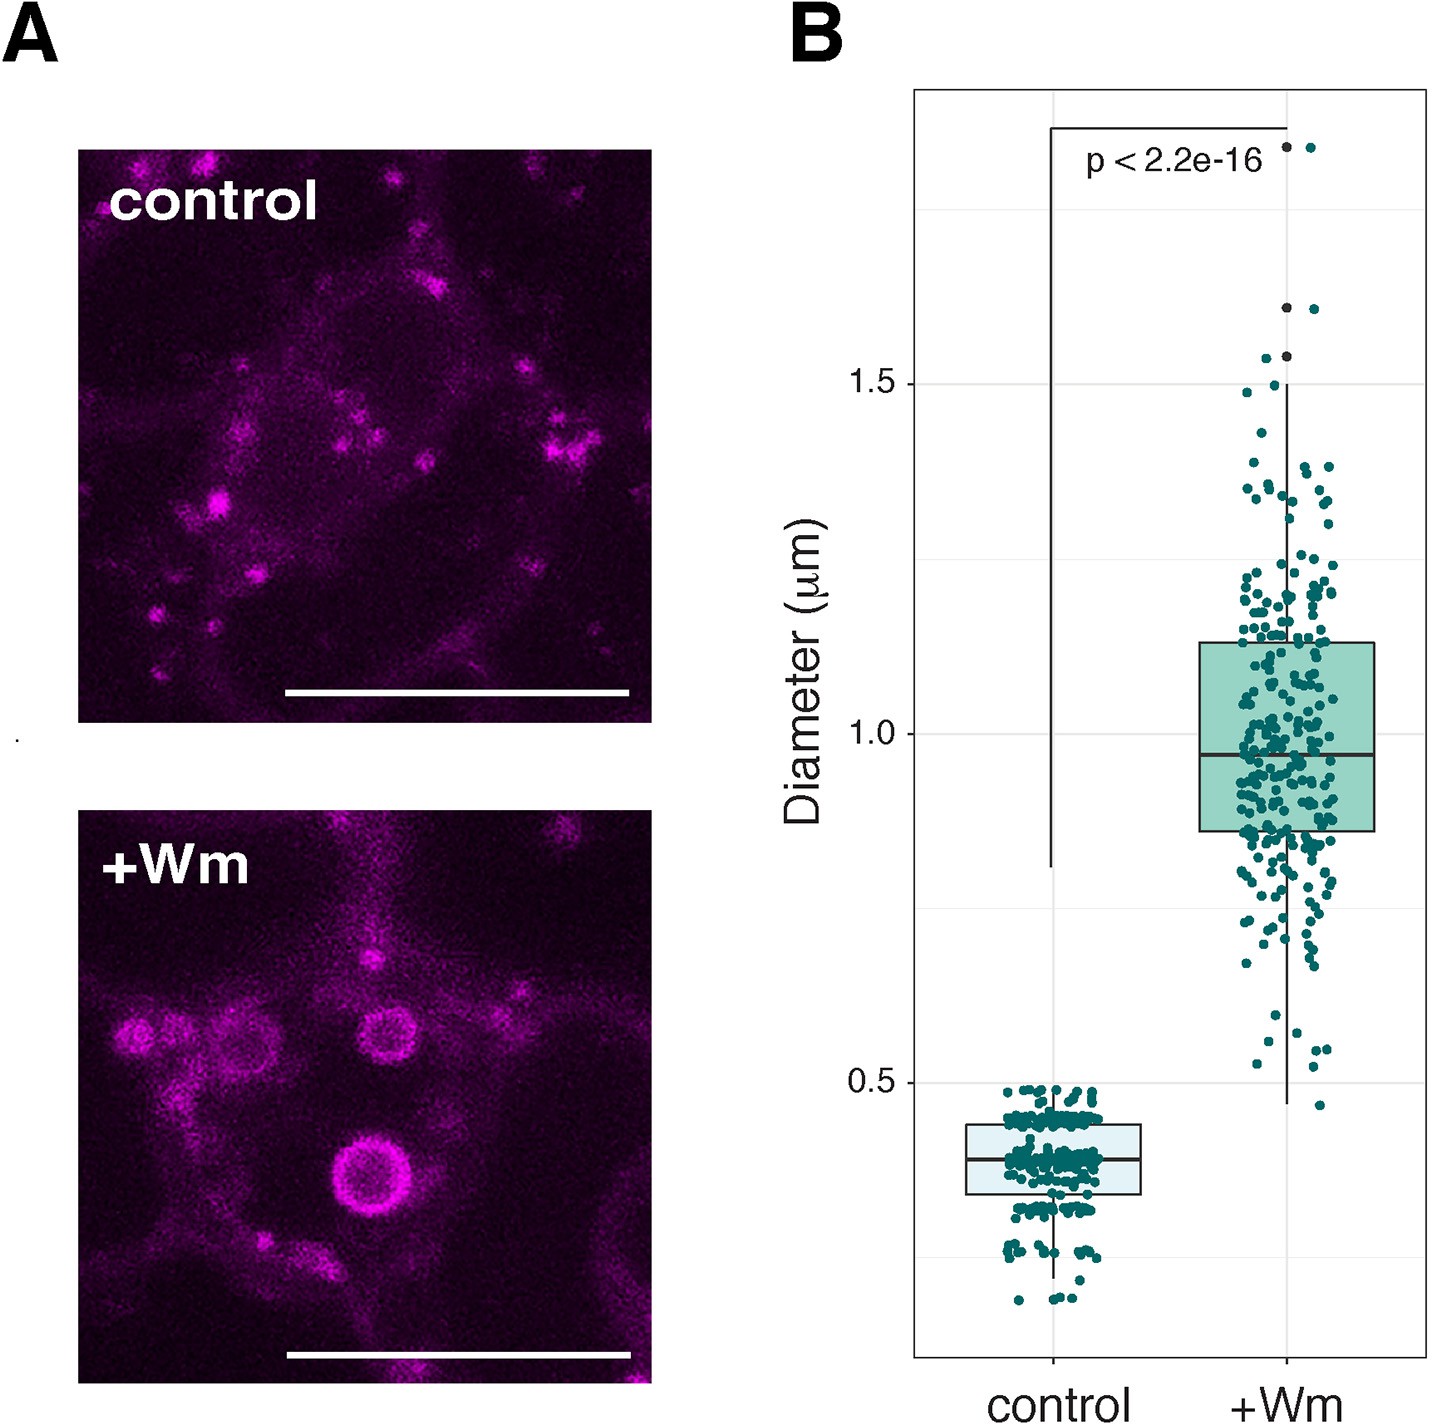
RFP-ARA7 expressing endosomes and Wm bodies.
(A) Close-up of representative confocal microscopy images of RFP-ARA7 expressing endosomes (top) and Wm bodies (bottom) in meristemoids. Large, ring-like structure of Wm bodies are visible (bottom). Scale bars, 10 μm. (B) Quantitative analysis of diameters of RFP-ARA7 expressing endosomes and Wm bodies. Dot represents the jittered exact data point. Welch's two sample t-test was performed between control vs. Wm treatment. number of endosomes/Wm bodies analyzed: n = 252 (control), n = 253 (Wm bodies).
Figure 2
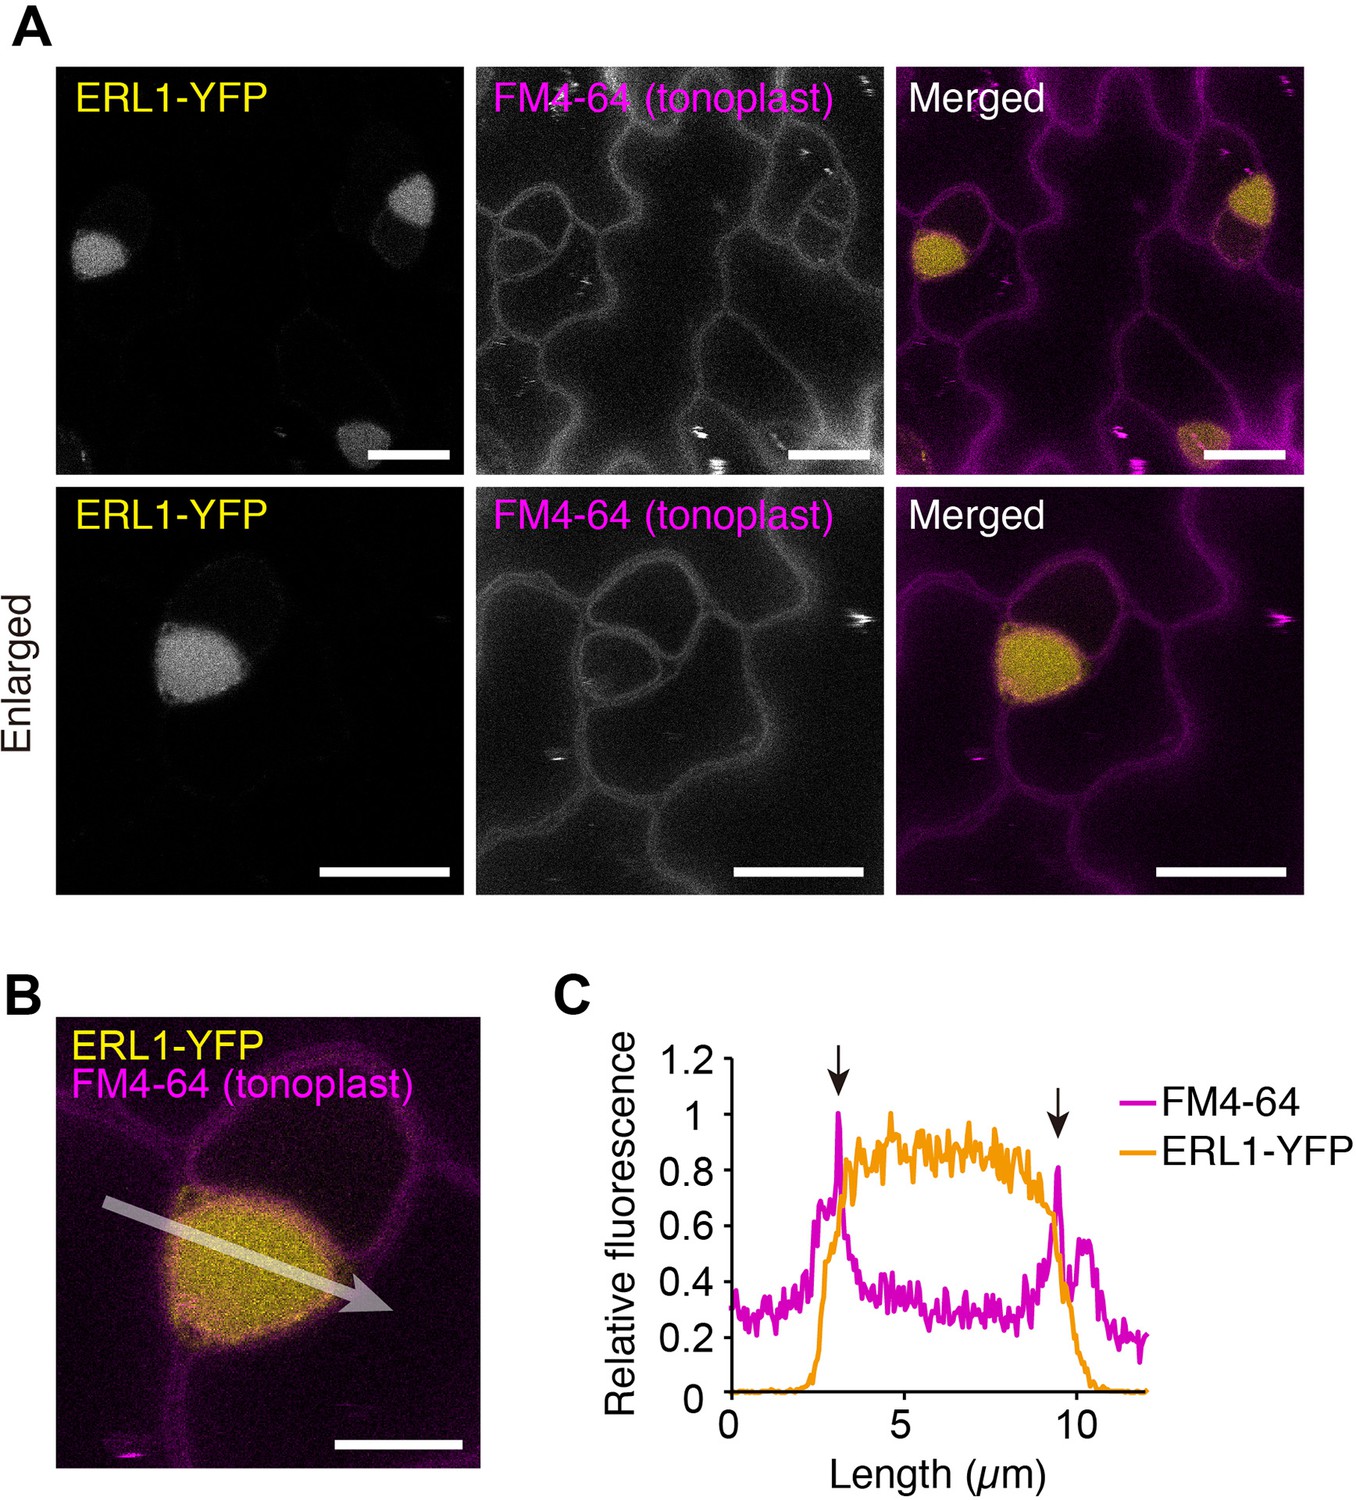
ERL1 is transported into vacuole.
(A) Representative confocal microscopy images of ERL1-YFP (yellow) and FM4-64 (magenta) in the abaxial epidermis of developing true leaves of the 7-day-old seedlings expressing ERL1pro::ERL1-YFP in erl1. The seedlings were treated with 2 μM FM4-64 for 30 min followed by incubation in water for 6 hr and subsequently incubated in 1 μM Concancmycin A for 5 hr. Tonoplast is highlighted by FM4-64. Scale bars = 10 µm. (B) Enlarged merged image of ERL1-YFP (yellow) and FM4-64 (tonoplast, magenta). Scale bars = 5 µm. (C) Line plots of ERL1-YFP (yellow) and FM4-64 (magenta) fluorescence on 10-pixel-thickness of arrow indicated in (B). Arrows indicate FM4-64 fluorescence staining the tonoplast.
Figure 3 with 1 supplement
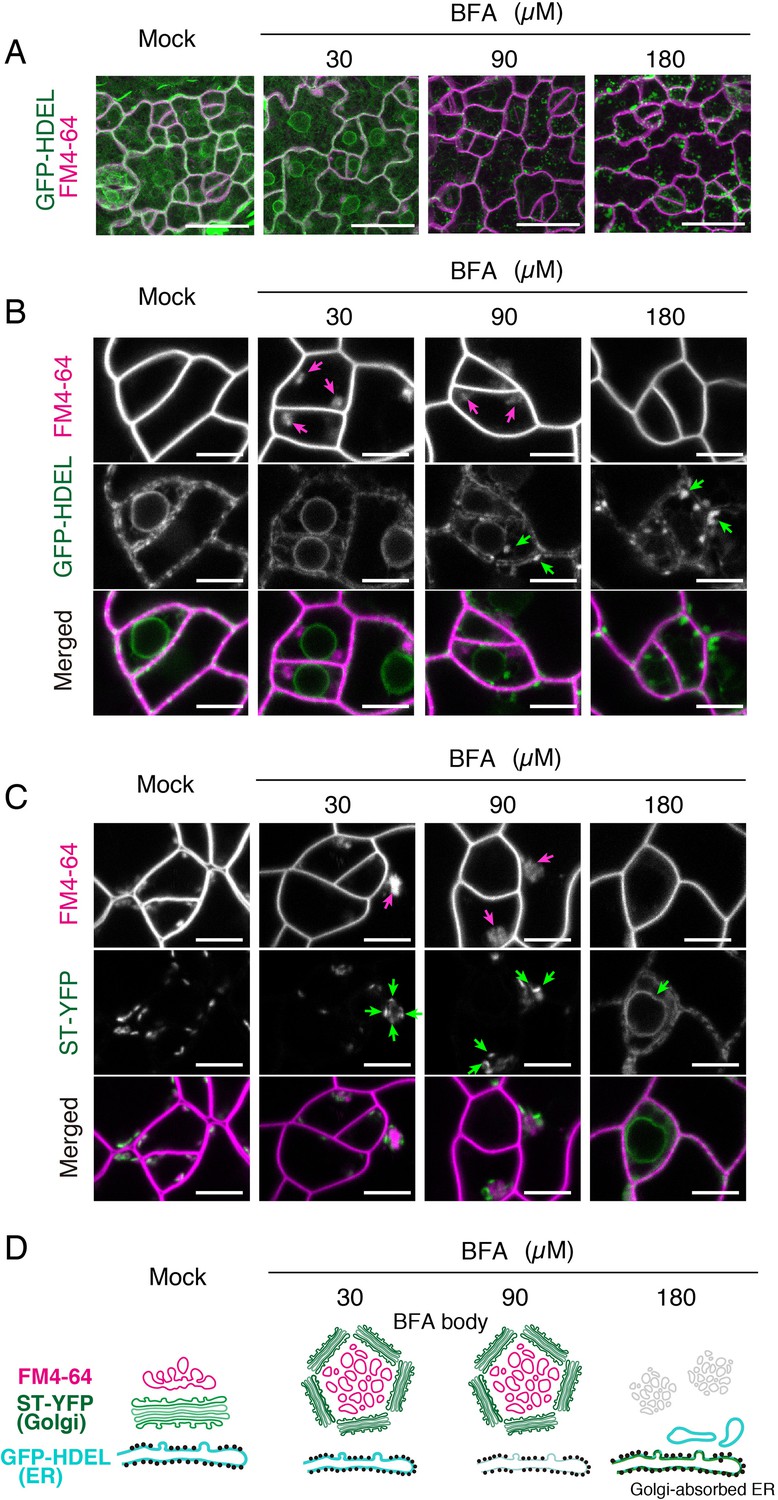
Effects of BFA on subcellular membrane structures in the meristemoids.
(A) Representative Z-stack confocal images of an ER marker, GFP-HDEL (green) and FM4-64 (magenta) in true leaf abaxial epidermis from the 7-day-old seedlings expressing CaMV35Spro::GFP-HDEL treated with 5 µM FM4-64 alone (mock) or co-treated with 30, 90, 180 µM BFA for 1 hr. Scale bars = 20 µm. BFA treatment at low concentration (30 µM) does not alter the characteristic, mesh-like ER structure inside the meristemoids and at the edge of nuclei. In contrast, high concentration of BFA results in aberrant spherical structures in the ER. (B) Representative confocal images of an ER marker, GFP-HDEL (green) and FM4-64 (magenta) treated with BFA as described in (A). BFA treatment at low concentration (30 µM) causes the formation of BFA bodies (magenta arrows) without impacting the ER structure. In high BFA concentration confers aberrant spherical ER structure (green arrows). In addition, the FM4-64 signals in the BFA bodies disappear. Scale bars = 5 µm. (C) Representative confocal images of a Golgi marker, ST-YFP (green) and FM4-64 (magenta) in true leaf abaxial epidermis from the 7-day-old seedlings expressing CaMV35Spro::N-ST-YFP treated with 5 µM FM4-64 alone (mock) or co-treated with 30, 90, 180 µM BFA for 1 hr. Scale bars = 5 µm. In a lower and medium concentration (30 and 90 µM) of BFA, Golgi (green arrows) are surrounding BFA bodies (magenta arrows). By contrast, in higher concentration (180 µM), the Golgi marker becomes collapsed (green arrow) to ER. (D) Schematic diagrams depicting probable subcellular membrane structures in the meristemoids based on confocal microscopy.
Figure 3—figure supplement 1
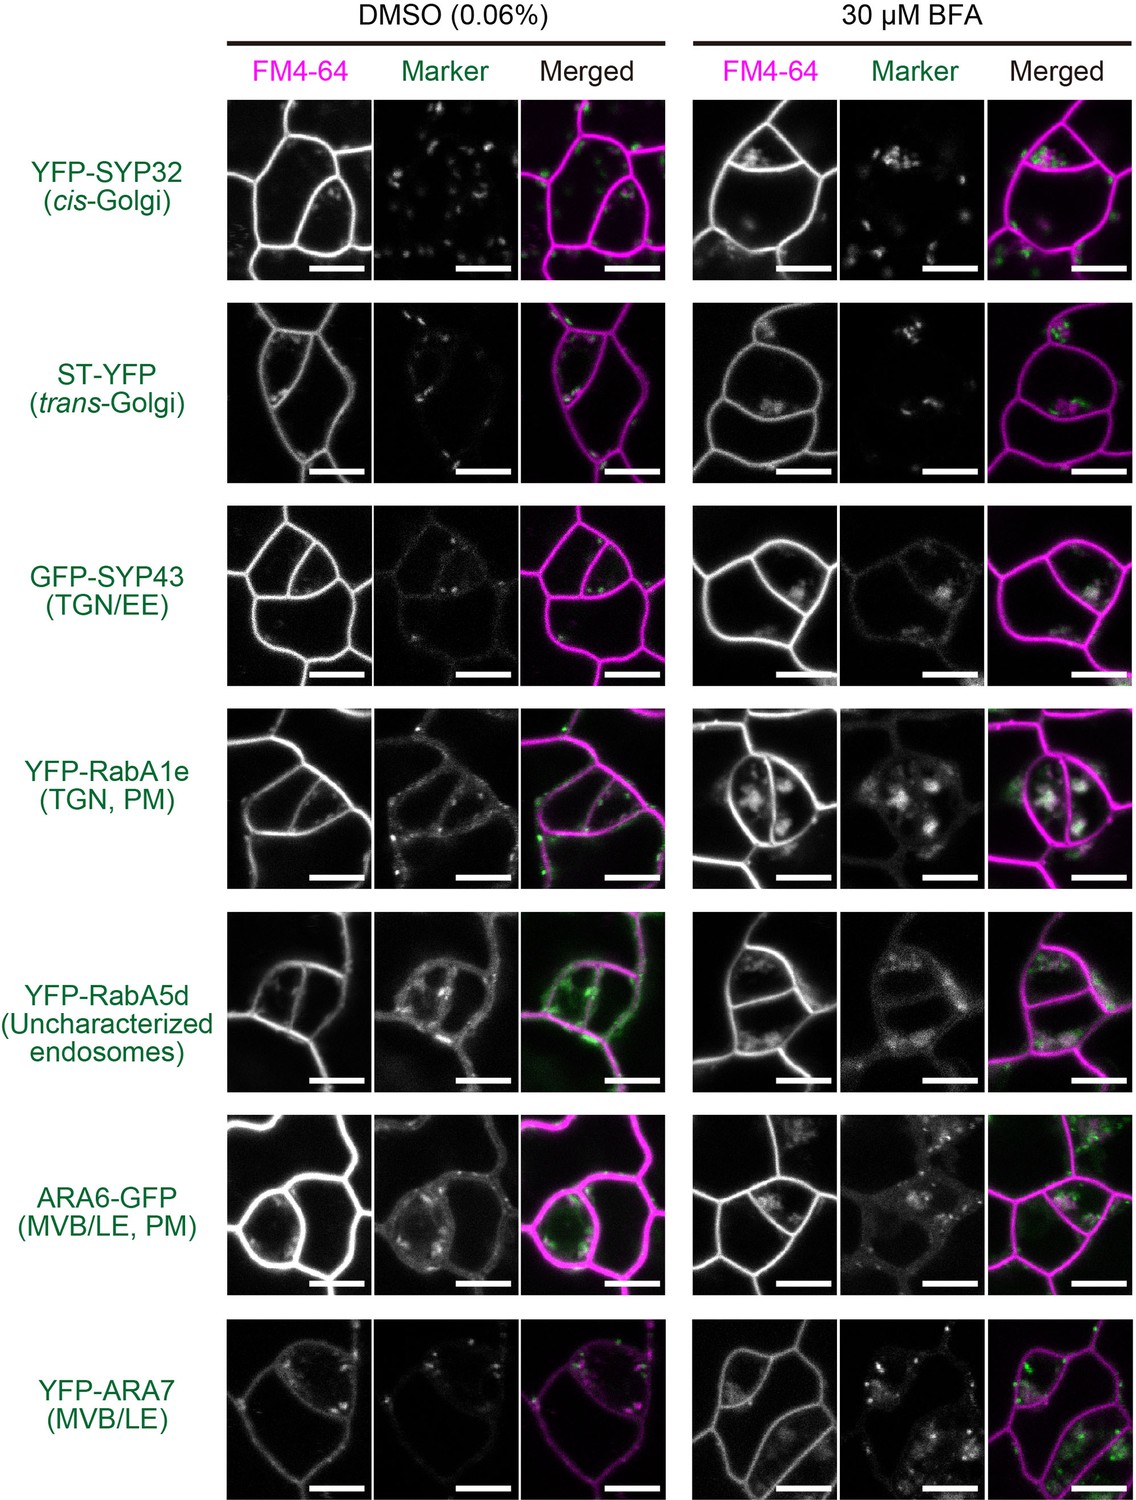
Effect of BFA on Golgi apparatus and endosomal markers at a low concentration.
Representative confocal images of Golgi apparatus- and endosomal markers (green) as well as FM4-64 (magenta, staining plasma membrane and endocytosed vesicles) in meristemoids of developing true leaf abaxial epidermis from 7-day-old seedlings. Plants were mock treated or treated with 30 μM BFA and 5 μM FM4-64 for 1 hr. Scale bars = 5 μm. TGN, trans Golgi network; EE, early endosomes; PM, plasma membrane; MVB, multi vesicular bodies; LE, late endosomes.
Figure 4 with 3 supplements
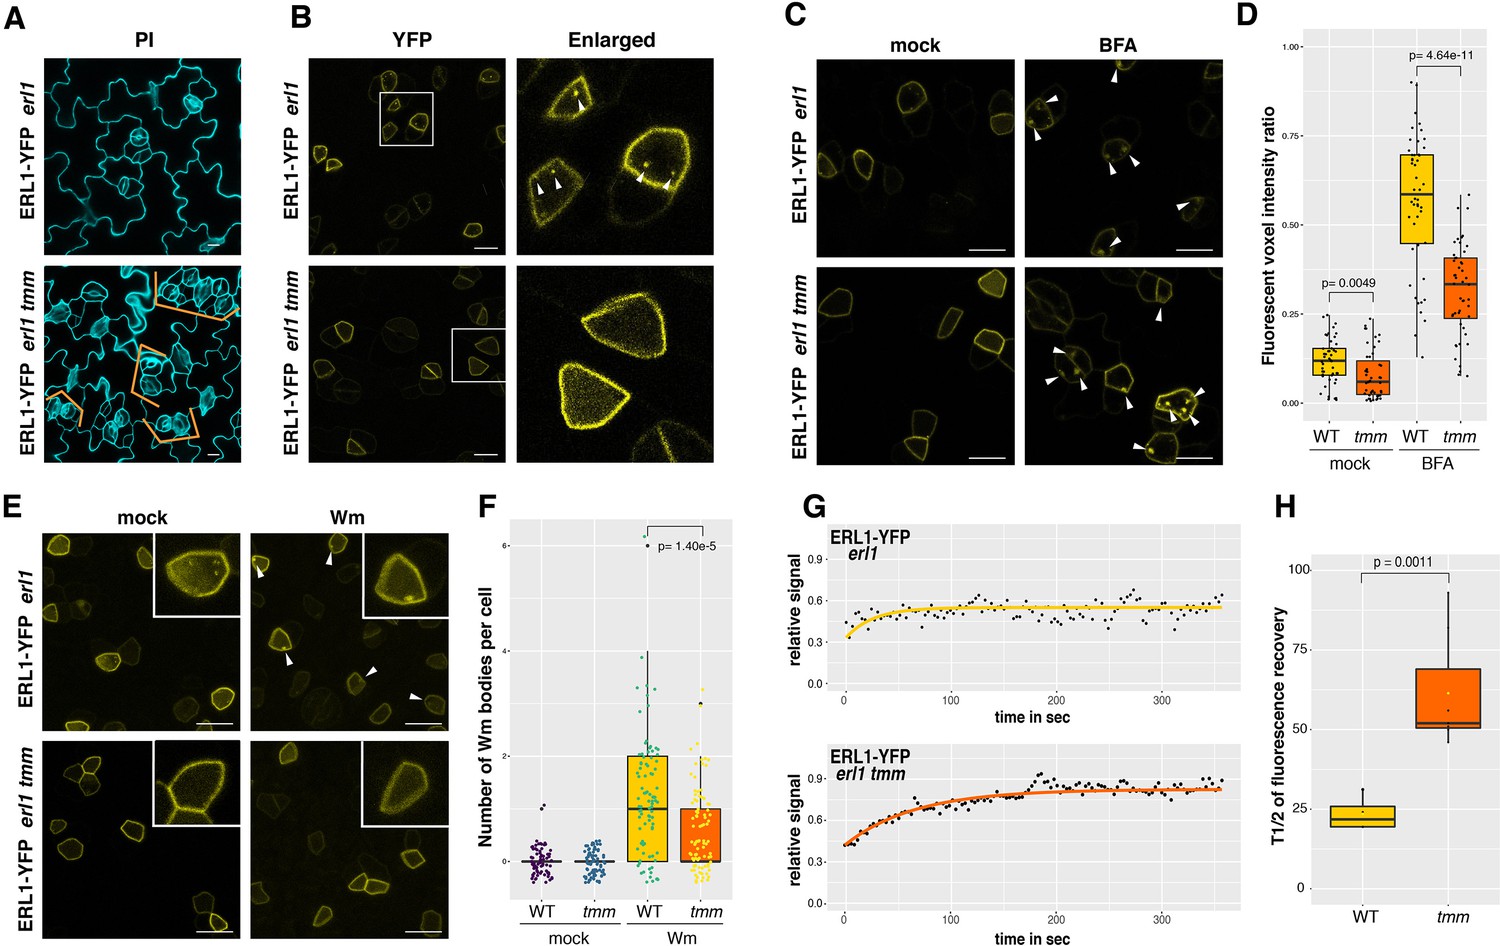
ERL1 internalization requires its co-receptor TMM.
(A) Representative confocal microscopy images of PI-stained true leaf abaxial epidermis of ERL1-YFP in erl1 (top) and in erl1 tmm (bottom), the latter shows characteristic stomatal cluster phenotype (orange brackets). Scale bars = 10 µm. (B) ERL1-YFP subcellular localization in erl1 (top row) and in erl1 tmm (bottom row) in the true leaf abaxial epidermis from the 7-day-old seedlings. Right column; enlarged images. Their stomatal phenotypes are shown in (A). Arrowheads indicate endosomes. Scale bars = 10 µm. (C) Representative confocal images of ERL1-YFP in erl1 (top row) or in erl1 tmm (bottom row) of the abaxial epidermis of developing true leaves from the 7-day-old seedlings treated with mock (left column) or 30 µM BFA (right column). Arrowheads indicate BFA bodies. Scale bars = 10 µm. (D) Quantitative analysis of the volume ratio of YFP-positive endosomes and BAF bodies per cell volume (voxels) when ERL1-YFP in erl1 (yellow) or erl1 tmm (orange) are treated with mock or 30 µM BFA. Welch’s Two sample T-test was performed for pairwise comparisons. Experiments were repeated three times. Two-way ANOVA analysis: genotype (WT, tmm), p<3.85e-14; treatment (mock, BFA), p<2.2e-16. The total numbers of cells subjected to YFP signal intensity measurements are 86, 130, 66 (WT mock); 138, 94, 131 (tmm mock); 230, 336, 109 (WT BFA); 300, 393, 211 (tmm BFA). (E) Representative images of ERL1-YFP in erl1 (top row) or in erl1 tmm (bottom row) treated with mock (left column) or 25 µM Wm (right column). Inset, an enlarged image of a representative meristemoid. Arrowheads indicate Wm bodies. Scale bars = 10 µm. (F) Quantitative analysis of the number of Wm bodies per cell when ERL1-YFP in erl1 (yellow) or erl1 tmm (orange) are treated with mock or 25 µM Wm. Lines in the boxplot show the median value, and each dot represents individual data point with jitter. Welch’s Two sample T-test was performed for pairwise comparisons. Two-way ANOVA analysis: genotype (WT, tmm), p=1.597e-6; treatment (mock, Wm), p<2.2e-16. Experiments were repeated three times. the total numbers of cells counted are 74 (WT mock); 91 (tmm mock); 82 (WT Wm); 90 (tmm Wm). (G) FRAP analyses of plasma membrane ERL1-YFP in wild type (erl1) or in tmm (erl1 tmm). Shown are representative fluorescence recovery curves plotted as a function of time and fitted to Single Exponential Fitting. ERL1-YFP in erl1 (top; yellow); ERL1-YFP in erl1 tmm (bottom; orange). (H) Quantitative analysis of the half time of fluorescence recovery of plasma membrane ERL1-YFP in erl1 (yellow) and erl1 tmm (orange). Lines in the boxplot show the median value. T-test was performed for pairwise comparisons between erl1 and erl1 tmm. n = 3 for WT and n = 9 for tmm.
Figure 4—figure supplement 1

ERL1 BFA body formation in wild-type, tmm, or dominant-negative ERL1 background in the presence of cycloheximide.
Quantitative analysis of the number of YFP+ BFA bodies in ERL1-YFP expressing meristemoids in ‘WT’, which is erl1 complemented with ERL1pro::ERL1-YFP, ‘tmm’, which is erl1 tmm seedlings expressing ERL1pro::ERL1-YFP, and ERL1ΔK, which is erl1 expressing ERL1pro::ERL1ΔK-CFP. The seedlings were pre-treated with 50 µM CHX for 1 hr, followed by treatment with either mock or 30 µM BFA for 30 min. Boxplot is used to show the quantification of the number of cells with BFA bodies. Individual data points are dot-plotted with jitter. Median values are shown as black diamond. T-test was performed to compare BFA-treated WT and each genotype. Two-way ANOVA analysis: genotype (WT, tmm, ERL1ΔK), p=0.000156; treatment (mock, BFA), p<2.2e-16. Number of cells analyzed, n = 13, 47, 34, 30, 51, 32 for WT (CHX), tmm (CHX), ERL1ΔK (CHX), WT (CHX + BFA), tmm (CHX + BFA), and ERL1ΔK (CHX + BFA). Welch’s Two Sample t-test was performed for each pairwise comparison among BFA treated samples.
Figure 4—figure supplement 2

tmm mutation does not affect general internalization and the MVB structure.
(A) Representative confocal microscopy images of ERL1-YFP (green) and FM4-64 staining (magenta) of developing true leaf abaxial epidermis from 7-day-old seedlings expressing ERL1-YFP in erl1 (top row) and erl1 tmm (bottom row). Merged images of ERl1-YFP and FM4-64 staining are shown in the third column from left, and enlarged cells are shown in the last column. Right, fluorescence intensity quantified along the line from different channels showing their co-localization. Scale bars = 10 µm. (B) Representative confocal microscopy images of ERL1-YFP (green) and RFP-Ara7 (magenta) of developing true leaf abaxial epidermis from 7-day-old seedlings expressing ERL1-YFP in erl1 tmm treated with mock (top row) or with 25 µM Wm (bottom row). Arrowheads indicate endosomes or Wm bodies. Scale bars = 10 µm. (C) Representative confocal images of ERL1-YFP (first column) and RFP-Ara7 (second column) in using developing true leaf abaxial epidermis of the 7-day-old seedlings of erl1 treated with mock/DMSO (top row) or with 25 µM Wm (bottom row). Arrowheads indicate endosomes or Wm bodies. Scale bar = 10 µm. (D) Quantitative analysis of the number of RFP-ARA7 positive Wm bodies in meristemoids in ‘WT’, which is erl1 complemented with ERL1pro::ERL1-YFP or tmm, which is erl1 tmm expressing ERL1-YFP from mock-treated or treated with 25 µM Wm. Dot represents the jittered exact data point from individual cells. Welch's two sample t-test was performed between Wm-treated WT and tmm. Two-way ANOVA analysis: genotype (WT, tmm), p=0.668; treatment (mock, Wm), p<2e-16. Number of cells analyzed, n = 74, 102, 82, 90 for mock (WT), mock (tmm), Wm (WT), Wm (tmm). (E) Quantitative analysis of the number of ERL1-YFP+ endosomes (left two) or RFP-ARA7+ endosomes (right two) in meristemoids in ‘WT’, which is erl1 complemented with ERL1pro::ERL1-YFP or tmm, which is erl1 tmm expressing ERL1pro::ERL1-YFP. Dot represents the jittered exact data point from individual cells. Welch's two sample t-test was performed for each pairwise comparison. Number of cells analyzed, n = 82, 73, 73, 82 for ERL1-YFP (WT), ERL1-YPF (tmm), RFP-ARA7 (WT), RFP-ARA7 (tmm).
Figure 4—figure supplement 3

Observed fluorescence intensity change during FRAP experiments.
Quantitative analysis of the YFP intensity of a background region (Background-grey), a region of non-photobleached ERL1-YFP (Control-blue), and a region of photobleached ERL1-YFP (FRAP-green) in erl1 complemented with ERL1pro::ERL1-YFP (A) or in erl1 tmm expressing ERL1pro::ERL1-YFP (B). 5 Images were taken every 0.453 s (minimum speed) both before and during photobleaching, and then 120 frames were taken every 3 s after photobleaching. See Videos 2 and 3 for time-lapse imaging of a representative experiment.
Figure 5 with 1 supplement
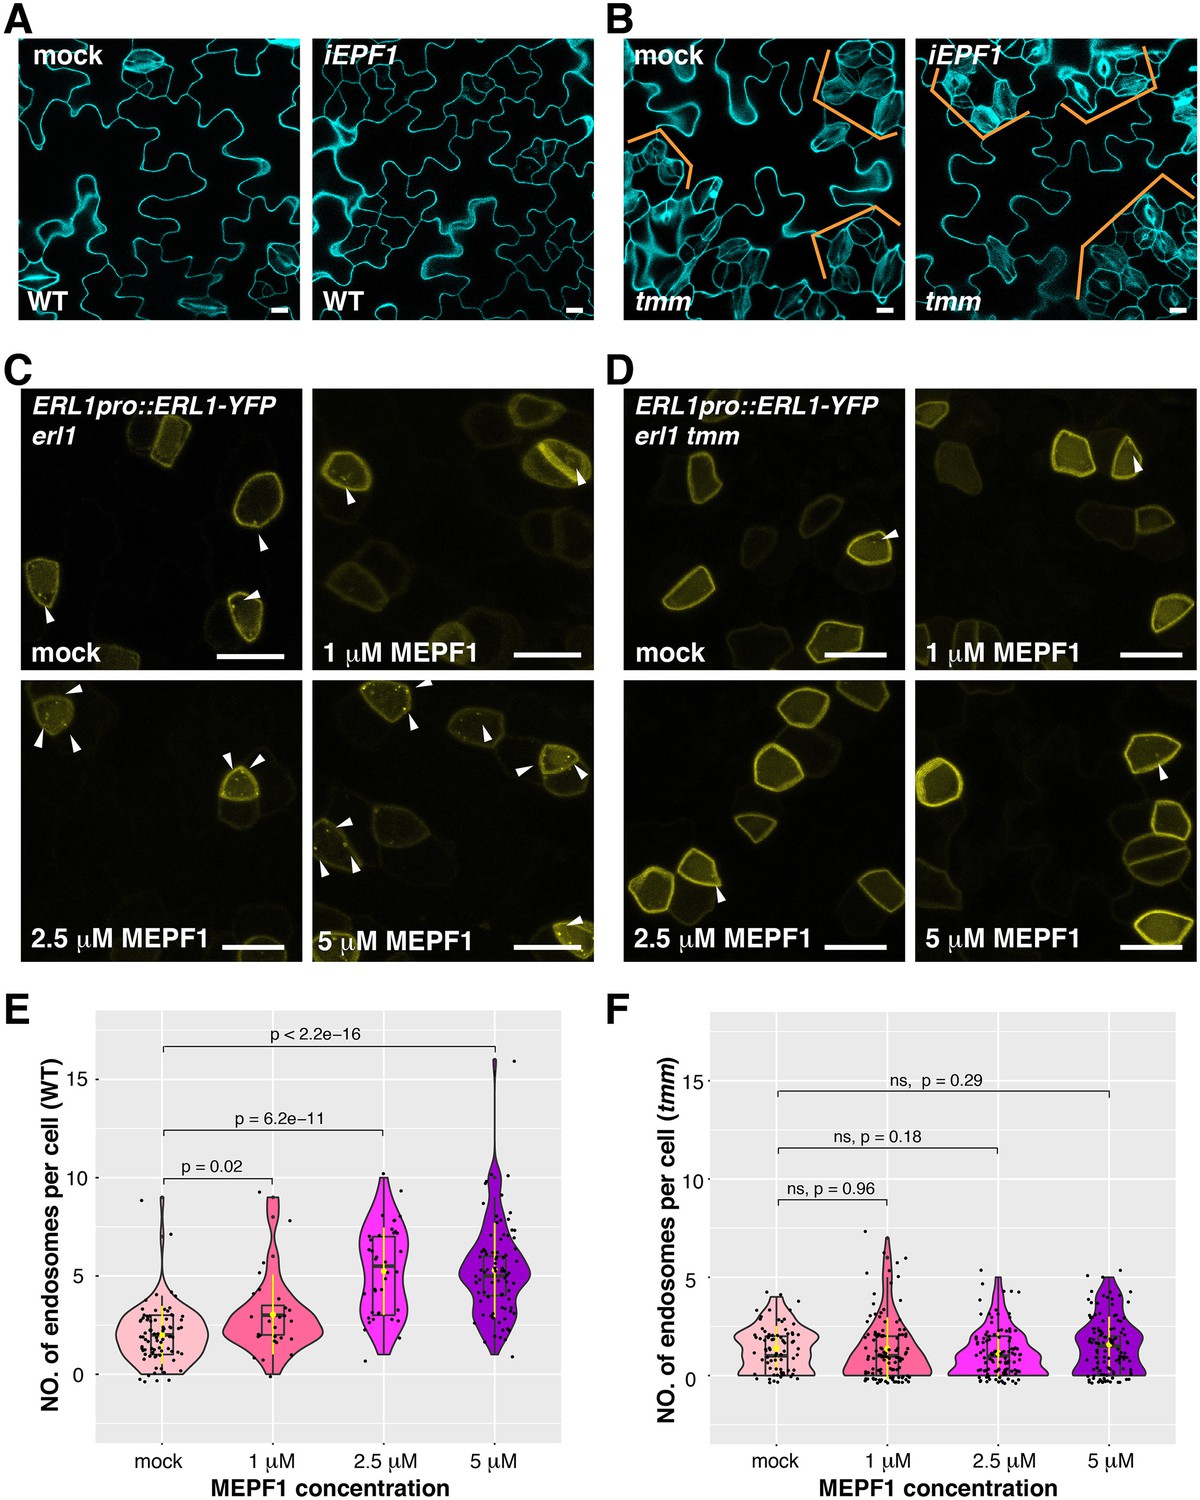
MEPF1 triggers ERL1-YFP internalization in erl1 but not in erl1 tmm.
(A) Representative confocal microscopy images of cotyledon abaxial epidermis from the 4-day-old iEPF1 seedlings treated with mock (left) or 10 µM Estradiol (right). Scale bars = 10 µm. (B) Representative confocal microscopy images of cotyledon abaxial epidermis from the 4-day-old iEPF1 in tmm seedlings treated with mock (left) or 10 µM Estradiol (right). Brackets indicate clustered stomata in both mock- and estradiol-induced samples. Scale bars = 10 µm. (C) Representative confocal microscopy images of ERL1-YFP in erl1 treated with mock (top left), 1 µM MEPF1 (top right), 2.5 µM MEPF1 (bottom left) and 5 µM MEPF1 (bottom right) are shown. Arrowheads indicate endosomes. Scale bars = 10 µm. (D) Representative confocal microscopy images of ERL1-YFP in erl1 tmm treated with mock (top left), 1 µM MEPF1 (top right), 2.5 µM MEPF1 (bottom left) and 5 µM MEPF1 (bottom right) are shown. Arrowheads indicate endosomes. Scale bars = 10 µm. (E) Quantitative analysis of the number of ERL1-YFP-positive endosomes per cell at different concentrations of MEPF1 application in erl1 shown as a violin plot. Dots, individual data points. Median values are shown as lines in the boxplot, and mean values are shown as yellow dots in the plot. Welch's two sample T-test was performed for pairwise comparisons of samples treated with the mock and different concentration of MEPF1. Number of cells analyzed, n = 79, 27, 38, 82 for treatment with mock, 1 µM, 2.5 µM, 5 µM MEPF1. (F) Quantitative analysis of the number of ERL1-YFP-positive endosomes per cell at different concentrations of MEPF1 application in erl1 tmm shown as a violin plot. Dots, individual data points. Median values are shown as lines in the boxplot, and mean values are shown as yellow dots in the plot. Welch's two sample T-test was performed for pairwise comparisons of samples treated with the mock and different concentration of MEPF1. Number of cells analyzed, n = 76, 113, 109, 114 for treatment with mock, 1 µM, 2.5 µM, and 5 µM MEPF1, respectively.
Figure 5—figure supplement 1
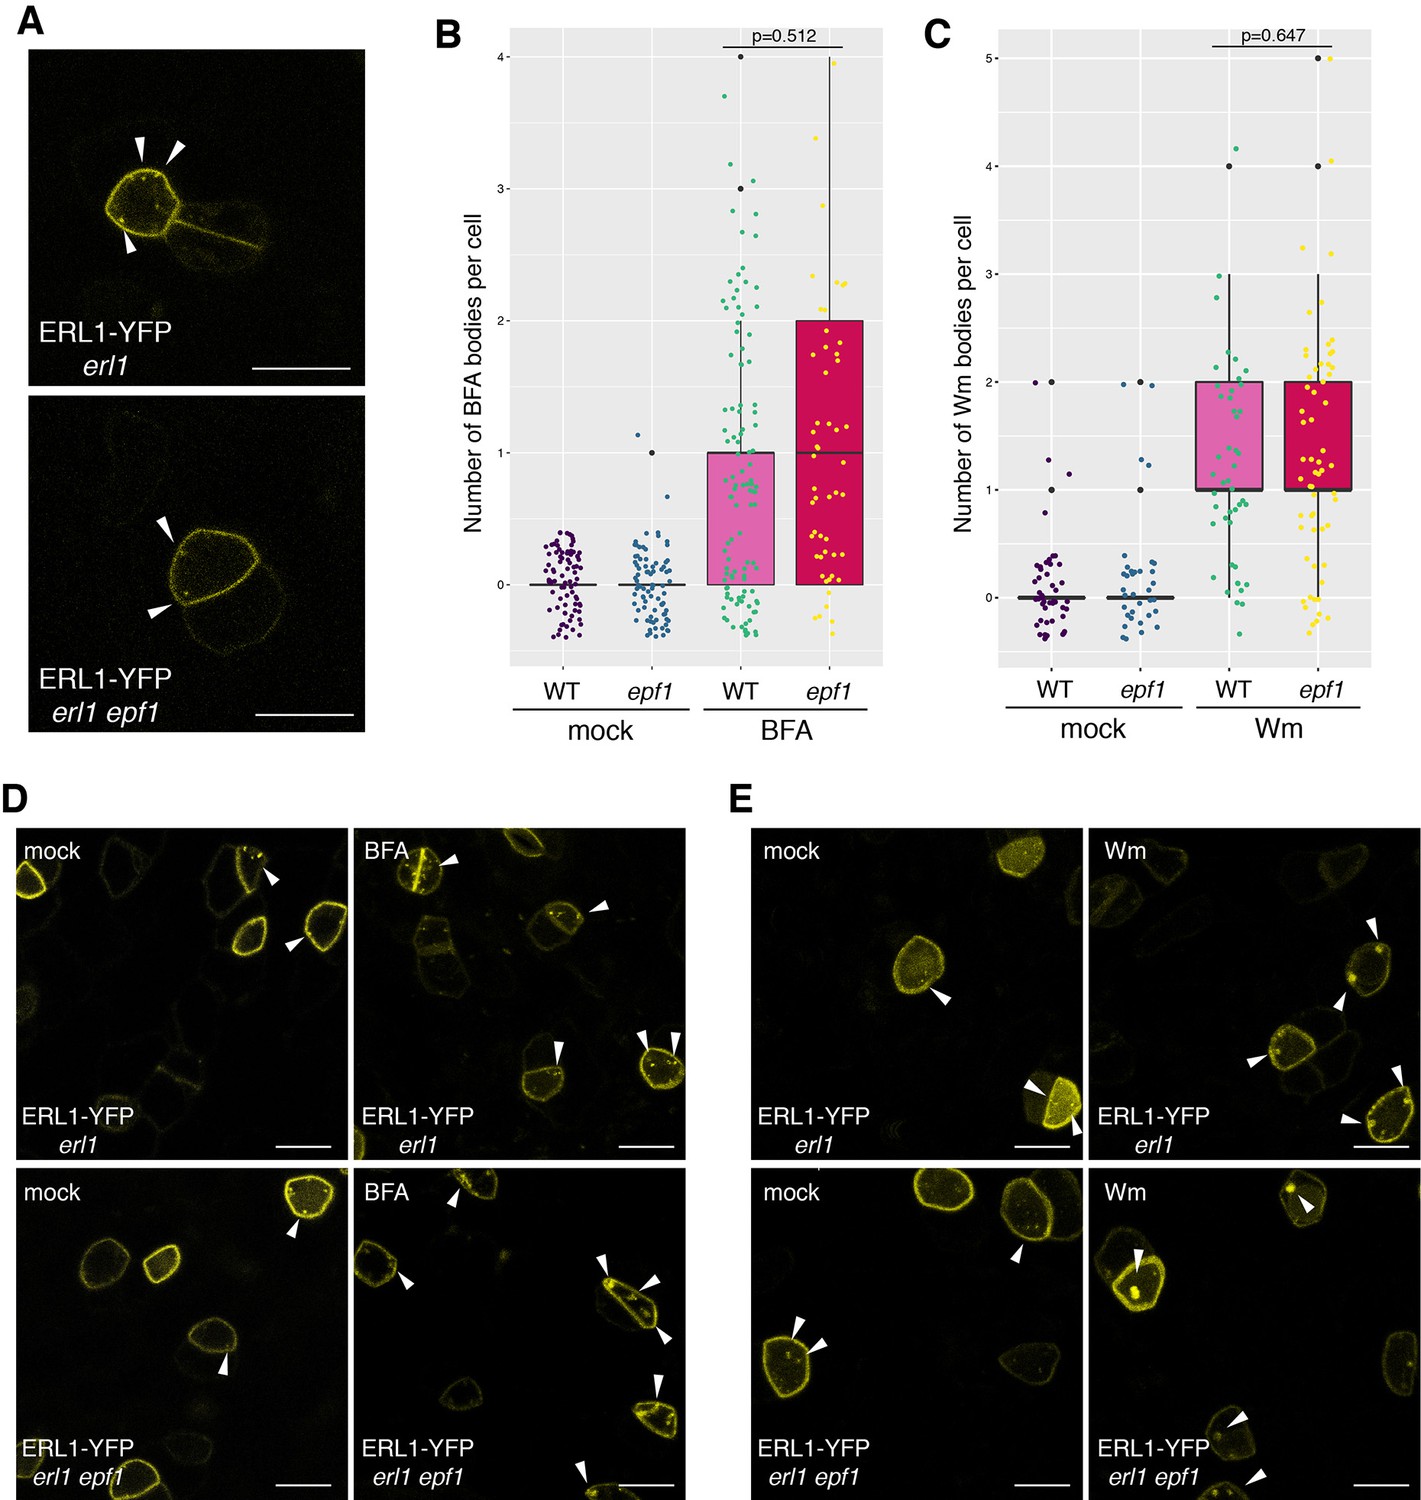
Absence of endogenous EPF1 does not affect ERL1-YFP internalization.
(A) Representative confocal microscopy images of an abaxial true leaf epidermis from 7-day-old seedling expressing ERL1-YFP in erl1 (top) and in erl1 epf1 (bottom); Arrowheads indicate endosomes. Scale bars = 10 µm. (B) Quantitative analysis of the number of YFP+ BFA bodies in ERL1-YFP expressing meristemoids in ‘WT’, which is erl1 complemented with ERL1pro::ERL1-YFP or " epf1’, which is erl1 epf1 expressing ERL1pro::ERL1-YFP from mock-treated or treated with 30 µM BFA. Dot represents the exact data point from individual cells. Welch's two sample t-test was performed between BFA-treated samples. Two-way ANOVA analysis: genotype (WT, epf1), p=0.173; treatment (mock, BFA), p<2e-16. Number of cells analyzed, n = 117, 139, 67, 51 for mock (erl1), mock (erl1 epf1), BFA (erl1), BFA (erl1 epf1). (C) Quantitative analysis of the number of YFP+ Wm bodies in ERL1-YFP expressing meristemoids in ‘WT’, which is erl1 complemented with ERL1pro::ERL1-YFP or " epf1’, which is erl1 epf1 expressing ERL1pro::ERL1-YFP from mock-treated or treated with 25 µM Wm. Welch's two sample t-test was performed between Wm-treated samples. Two-way ANOVA analysis: genotype (WT, epf1), p=0.0175; treatment (mock, Wm), p<2e-16. Number of cells analyzed, n = 50, 39, 46, 60 for mock (erl1), mock (erl1 epf1), Wm (erl1), Wm (erl1 epf1). (D) Representative confocal microscopy images of ERL1-YFP in erl1 (top row) or in erl1 epf1 (bottom row) treated with mock (left column) or 30 µM BFA (right column). Arrowheads indicate endosomes or BFA bodies. Scale bars = 10 µm. (E) Representative confocal microscopy images of ERL1-YFP in erl1 (top row) or in erl1 epf1 (bottom row) treated with mock (left column) or 25 µM Wm (right column). Arrowheads indicate endosomes or Wm bodies. Scale bars = 10 µm.
Figure 6 with 1 supplement
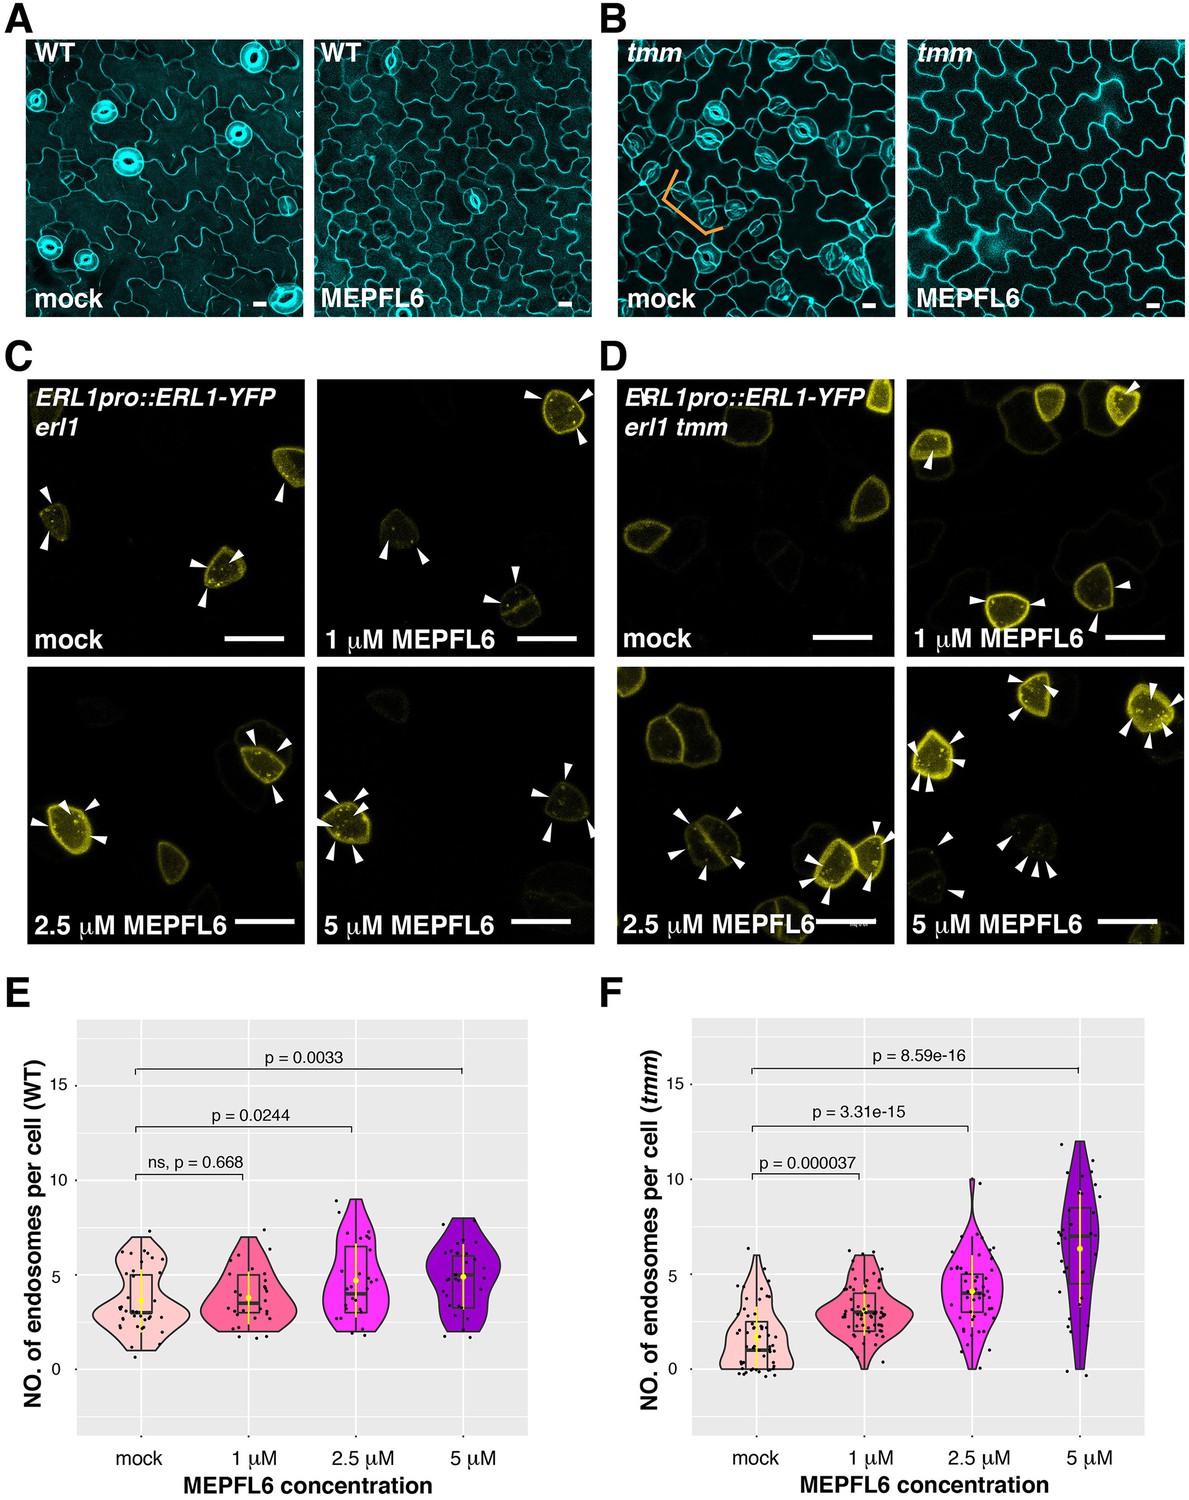
MEPFL6 triggers ERL1-YFP internalization in both erl1 and erl1 tmm.
(A) Representative confocal microscopy images of cotyledon abaxial epidermis from the 5-day-old wild type seedlings treated with mock (left) or 5 µM MEPFL6 (right). Scale bars = 10 µm. (B) Shown are representative confocal microscopy images of cotyledon abaxial epidermis from the 5-day-old tmm seedlings treated with mock (left) or 5 µM MEPFL6 (right). Scale bar = 10 µm. (C) Representative images of ERL1-YFP in erl1 treated with mock (top left), 1 µM MEPFL6 (top right), 2.5 µM MEPFL6 (bottom left) and 5 µM MEPFL6 (bottom right) are shown. Arrowheads indicate endosomes. Scale bar = 10 µm. (D) Representative images of ERL1-YFP in erl1 tmm treated with mock (top left), 1 µM MEPFL6 (top right), 2.5 µM MEPFL6 (bottom left) and 5 µM MEPFL6 (bottom right) are shown. Arrowheads indicate endosomes. Scale bars = 10 µm. (E) Quantitative analysis of the number of ERL1-YFP-positive endosomes per cell at different concentrations of MEPFL6 application in erl1 are shown as a Violin plot. Median values are shown as lines in the boxplot, and mean values are shown as yellow dots in the plot. Dots, individual data points. Welch's two sample T-test was performed for pairwise comparisons of samples treated with the mock and different concentration of MEPFL6. Number of cells analyzed, n = 37, 28, 27, 30 for treatment with mock, 1 µM, 2.5 µM, 5 µM MEPFL6. (F) Quantitative analysis of the number of ERL1-YFP-positive endosomes per cell at different concentrations of MEPFL6 application in erl1 tmm are shown as a Violin plot. Dots, individual data points. Median values are shown as lines in the boxplot, and mean values are shown as yellow dots in the plot. Welch's two sample T-test was performed for a pairwise comparisons of samples treated with the mock and different concentration of MEPFL6. Number of cells analyzed, n = 55, 63, 48, 35 for treatment with mock, 1 µM, 2.5 µM, 5 µM MEPFL6.
Figure 6—figure supplement 1
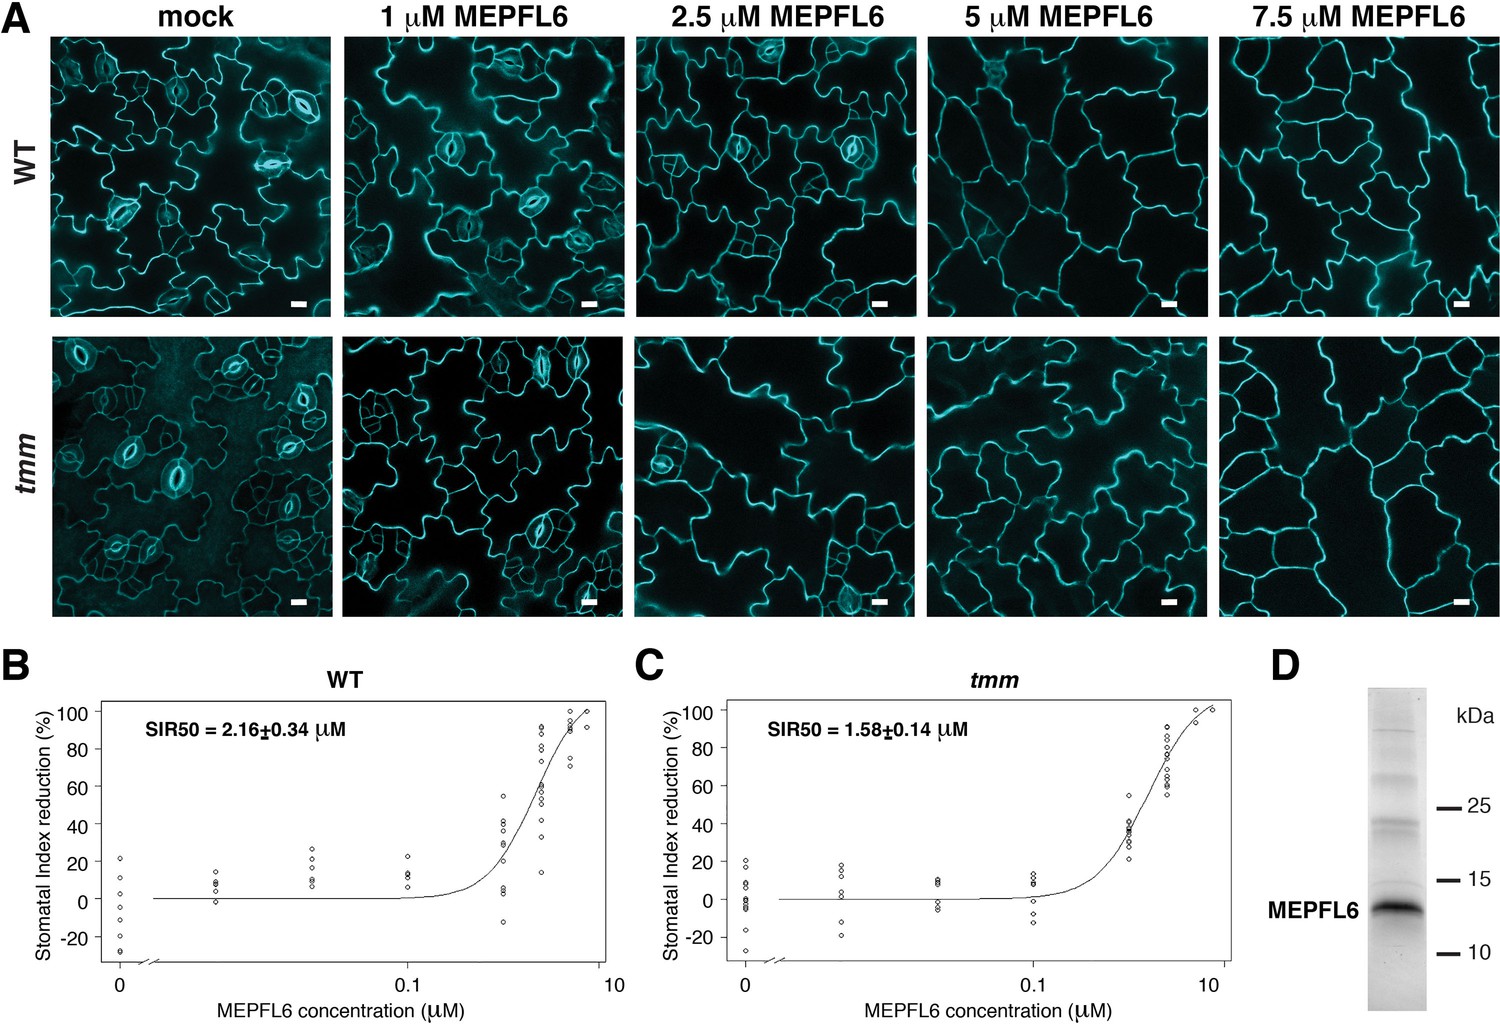
Stomatal development in tmm is more sensitive than in wild type to MEPFL6 application.
(A) Effects of recombinant MEPFL6. Shown are representative confocal images of abaxial epidermis from 5-day-old wild-type (top row) and tmm mutant (bottom row) seedlings with mock (left) and increasing concentrations of MEPFL6 (corresponding concentrations are indicated on top of each column). Scale bars = 10 µm. (B) Dose response curve of abaxial epidermis stomatal index reduction in 5-day-old wild-type seedlings to different concentrations of MEPFL6. SIR50 indicates the MEPFL6 concentration that causes 50% of Stomatal Index Reduction. n = 8, 6, 6, 6, 11, 14, 15, 12 for treatment with mock, 0.001 µM, 0.01 µM, 0. 1 µM, 1 µM, 2.5 µM, 5µ M MEPFL6. (C) Dose response curve of abaxial epidermis stomatal index reduction in 5-day-old tmm mutant seedlings to different concentrations of MEPFL6. SIR50 indicates the MEPFL6 concentration that causes 50% of Stomatal Index Reduction. n = 14, 7, 7, 8, 13, 14, 12, 12 for treatment with mock, 1 µM, 2.5 µM, 5 µM MEPFL6. (D) SDS-PAGE analysis of predicted MEPFL6-6xHis recombinant protein expressed and purified from E. coli.
Figure 7 with 3 supplements
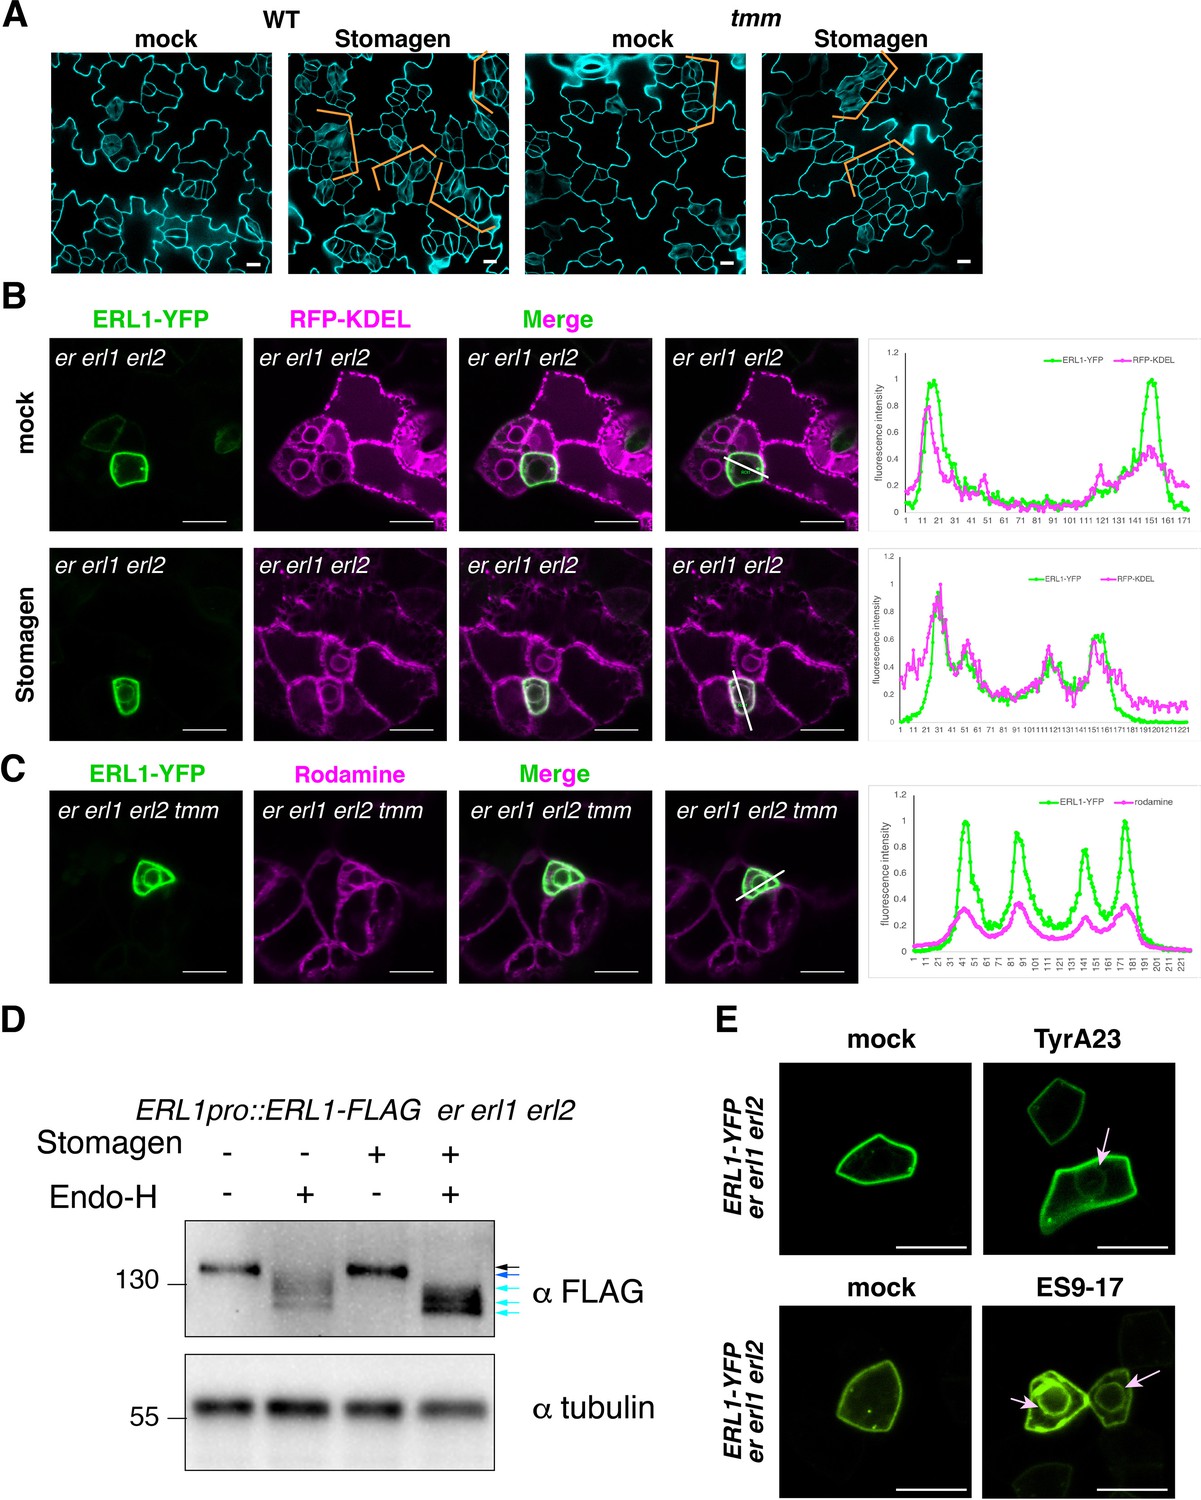
Stomagen application confers accumulation of ERL1 in endoplasmic reticulum.
(A) Representative confocal microscopy images of cotyledon abaxial epidermis from the 5-day-old wild type seedlings (top) or tmm seedlings (bottom) treated with mock (left) or 5 µM Stomagen (right). Scale bars = 10 µm. (B) Representative confocal microscopy images of ERL1-YFP (left column) and co-localization analysis with the endoplasmic reticulum marker RFP-KDEL (middle column) in the abaxial epidermis of cotyledons of the 5-day-old erecta (er) erl1 erl2 seedlings treated with mock (top row) or 5 µM Stomagen (bottom row). Right, merged images with the line slicing along which quantification analysis of the YFP intensity (green) and RFP intensity (magenta) was done; graphs are shown on the right, with two middle peaks (pointed by arrowheads) showing signals from the endoplasmic reticulum and two big peaks on both sides showing signals of the plasma membrane. Scale bars = 10 µm. (C) Representative confocal microscopy images of ERL1-YFP (left) in the abaxial epidermis of cotyledons of the 5-day-old erecta erl1 erl2 tmm seedlings stained with the endoplasmic reticulum dye Rhodamine (second left column). The merged image is shown in the third left column. Quantification analysis of the YFP intensity (green) and RFP intensity (magenta) along the line drawn in the right image is shown as a graph on the right, with two middle peaks (pointed by arrowheads) showing signals from the endoplasmic reticulum and two big peaks on both sides showing signals of the plasma membrane. Scale bars = 10 µm. (D) Immunoblot analysis of 3-day-old ERL1-FLAG erecta erl1 erl2 seedlings treated with mock or 5 µM Stomagen for 2 days and then digested without or with Endo-H. Top panel shows the ERL1-FLAG detected by α-FLAG. Lower panel shows the loading control of Tubulin detected by α-Tubulin. Black arrow, ERL1 band without digestion, blue and cyan arrows, ERL1 cut with Endo-H digestion. (E) Representative confocal microscopy images of abaxial epidermis of true leaves from ERL1-YFP in erecta erl1 erl2 seedlings treated with mock (top left) or 50 µM Tyr A23 (top right); mock (bottom left) or 100 µM ES9-17 (bottom right). Arrow indicates the ring-like structure, characteristics of endoplasmic reticulum localization, detected after treatment with Tyr A23 or ES9-17. Scale bars = 10 µm.
Figure 7—figure supplement 1
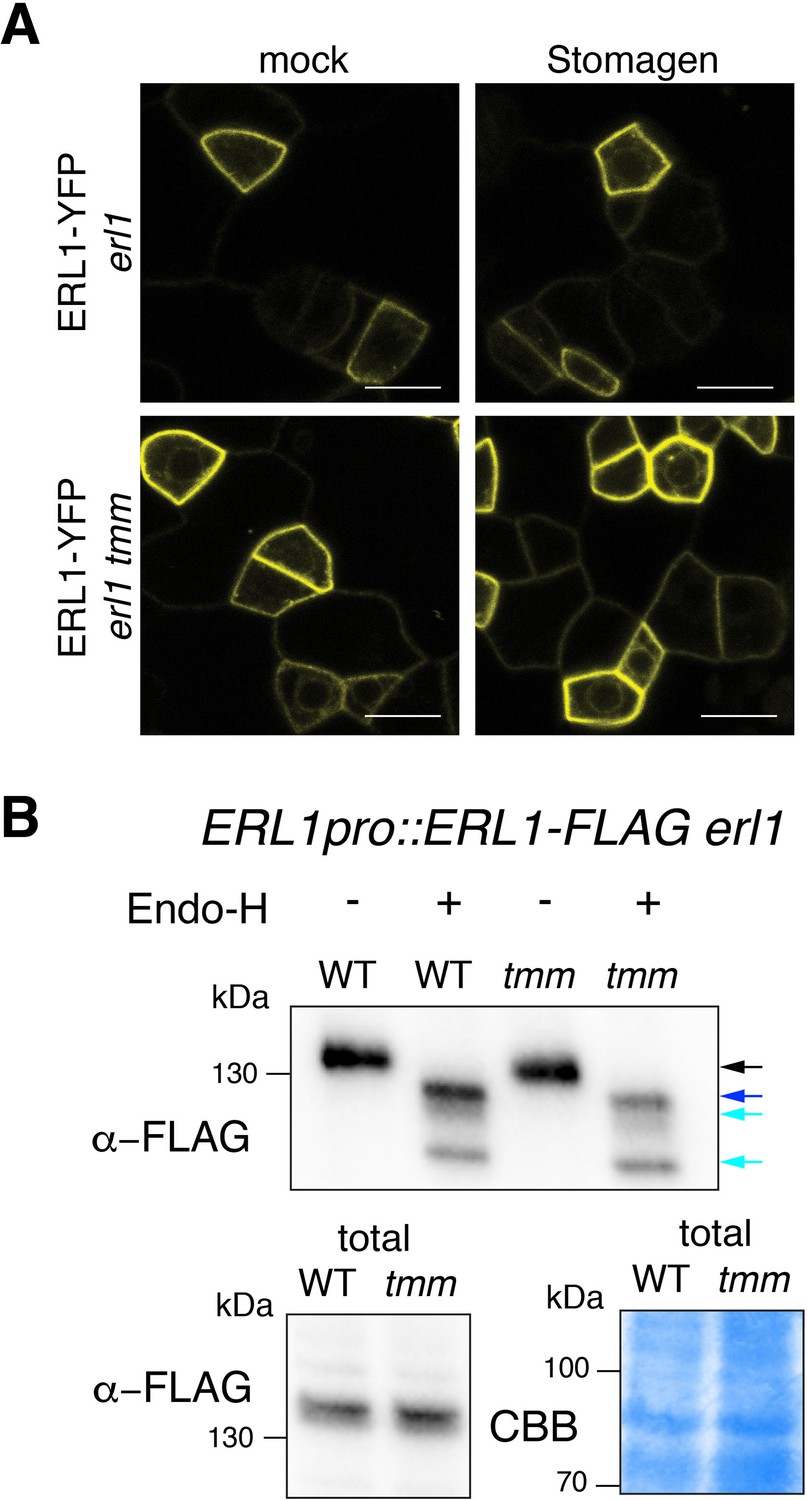
Inefficient endocytosis causes ERL1-YFP to stall in the endoplasmic reticulum.
(A) Representative confocal microscopy images of ERL1-YFP in the abaxial epidermis of true leaves of the 7-day-old erl1 seedlings (top row) or erl1 tmm seedlings (bottom row) treated with mock (left column) or 5 µM Stomagen (right column). Scale bars = 10 µm. (B) Immunoblot analysis of 7-day-old ERL1pro::ERL1-FLAG erl1 seedlings and ERL1pro::ERL1-FLAG erl1 tmm seedlings digested without or with Endo-H. Top panel shows the immunoprecipitated ERL1-FLAG without or with Endo-H digestion detected by α-FLAG. Bottom panels show the ERL1-FLAG from the total protein immune-detected by α-FLAG (left) and those detected by Commassie Brilliant Blue (CBB) staining as a loading control (right). Arrows indicate the ERL1 bands detected without (black arrow) or with (blue and cyan arrows) Endo-H digestion.
Figure 7—figure supplement 2
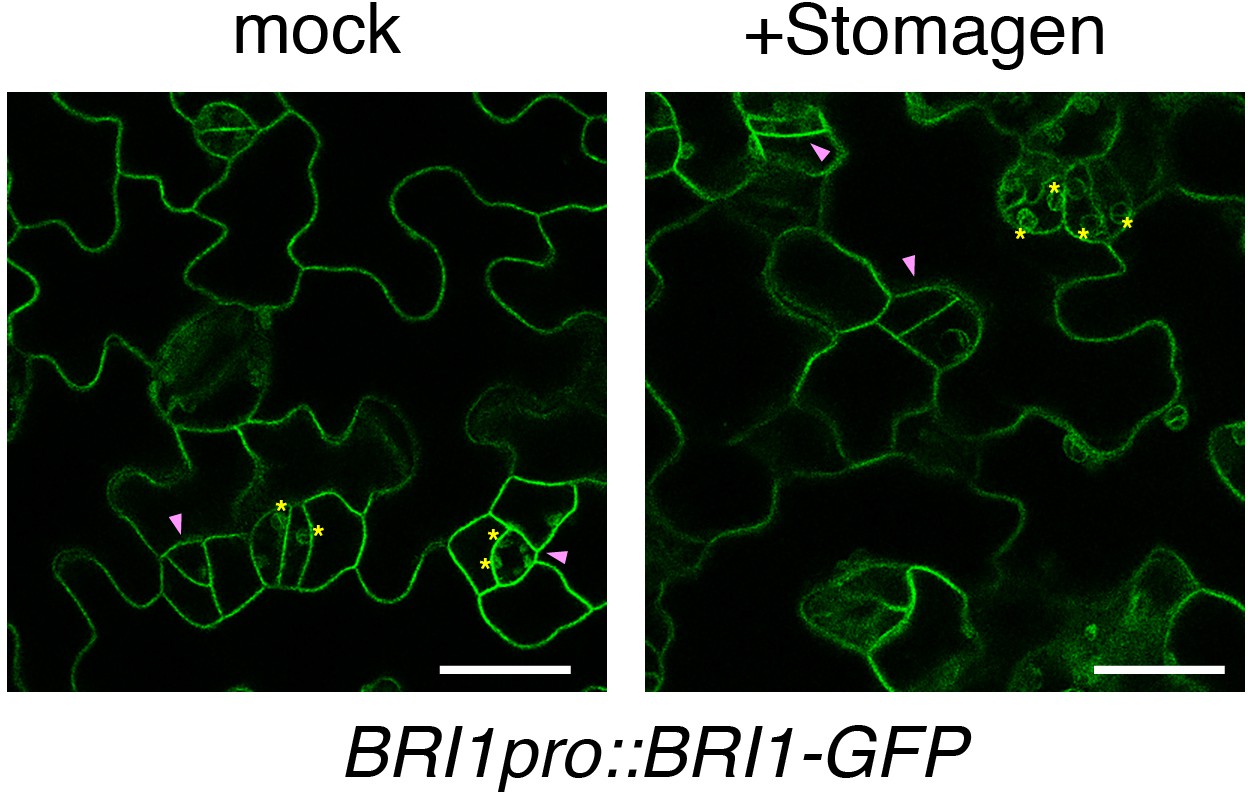
Stomagen application does not affect the subcellular localization of BRI1-GFP.
Shown are representative confocal microscopy images of cotyledon abaxial epidermis from the 5-day-old BRI1pro::BRI1-GFP seedlings treated with mock (left) or 5 µM Stomagen (right). Yellow asterisk indicates chloroplast autofluorescence. Purple arrowhead indicates GFP signal on the plasma membrane of a meristemoid. Scale bars = 25 µm.
Figure 7—figure supplement 3
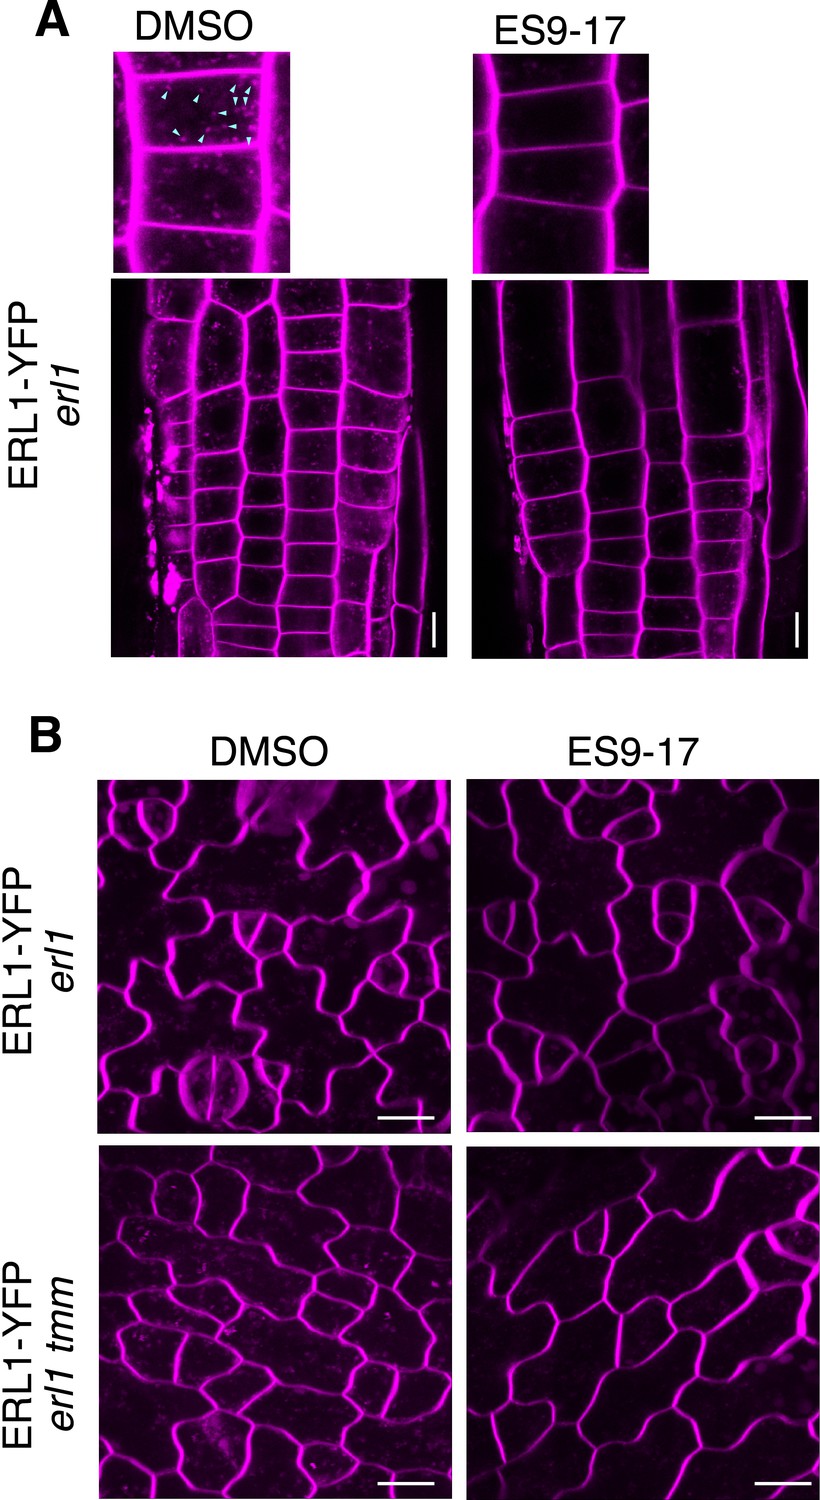
ES9-17 inhibits endocytosis of leaf epidermal cells.
(A) Primary roots of 3-day-old erl1-2 seedlings expressing ERL1-YFP treated with DMSO (left) or ES9-17 (right) followed by FM4-64 staining. Top panels, magnified images. Only red channel was used to image FM4-64. The ES7-19 treatment diminishes endocytosis (arrowheads in DMSO). Scale bar = 10 µm. (B) True leaves of 7-day-old erl1 (top) or erl1 tmm (bottom) seedlings expressing ERL1-YFP treated with DMSO (left) or ES 9–17 (right) followed by FM4-64 staining. Only red channel was used to image FM4-64. The ES7-19 treatment diminishes endocytosis. Scale bars = 10 µm.
Figure 8 with 1 supplement
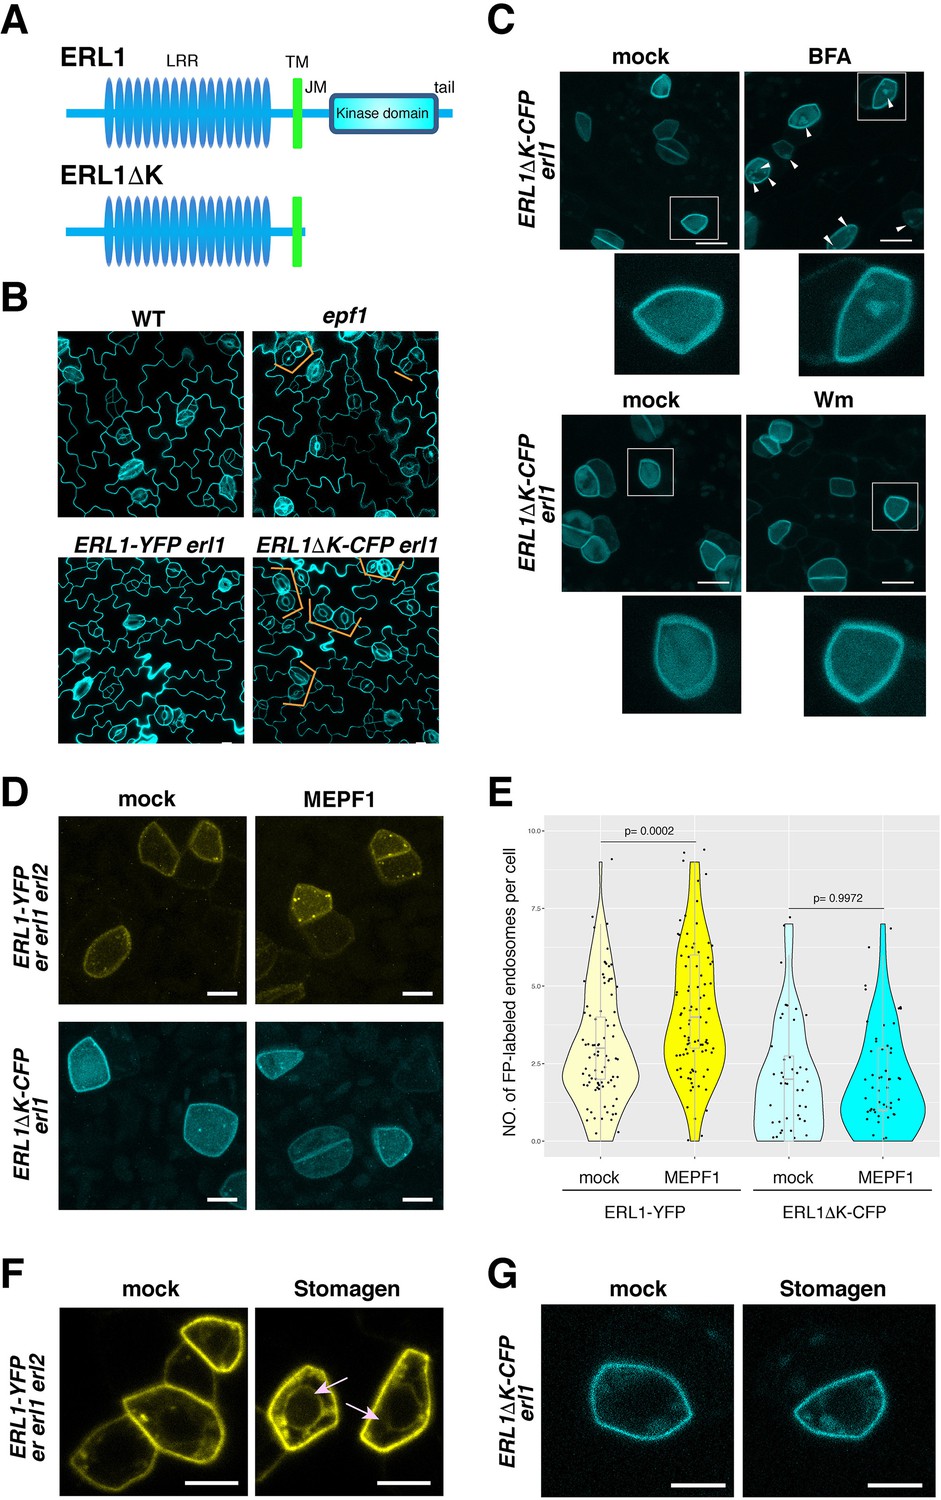
Dominant-negative form of ERL1 is compromised in subcellular trafficking.
(A) Diagram of the full-length ERL1 protein (top) and the dominant-negative ERL1 protein lacking the cytoplasmic domain (bottom). (B) Representative confocal microscopy images of cotyledon abaxial epidermis from 4-day-old seedlings of wild type, epf1, ERL1-YFP erl1 and ERL1ΔK-CFP erl1, stained by PI. Orange brackets indicate the paired stomata in epf1 and ERL1ΔK -CFP in erl1. Scale bars = 10 µm. (C) Representative confocal microscopy images of ERL1ΔK-CFP treated with mock (top left for BFA treatment), 30 µM BFA (top right), mock (bottom left for Wm treatment) and 25 µM Wm (bottom right). Inset, enlarged image of a representative meristemoid. Arrowheads indicate BFA bodies. Scale bars = 10 µm. (D) Representative confocal microscopy images of an abaxial true leaf epidermis from seedlings expressing ERL1-YFP in erecta erl1 erl2 (top) and ERL1ΔK-CFP in erl1 (bottom) treated with mock (left) or 5 μM MEPF1. Scale bars = 5 µm. (E) Quantitative analysis of the number of ERL1-YFP-positive or ERL1ΔK-CFP-positive endosomes per cell in mock or upon 5 μM MEPF1 peptide application. Dots, individual data points with a jitter (0.2). A box plot is overlaid to each violin plot, with a median shown as a line. T-test was performed for pairwise comparisons of samples treated with the mock and MEPF1. Two-way ANOVA analysis: genotype (ERL1-YFP, ERL1ΔK-CFP), p=7.081e-12; treatment (mock, MEPF1), p=0.001498. Tukey's HSD, genotype: treatment, ERL1-YFP mock: ERL1-YFP MEPF1 treatment, p=0.00045, ERL1ΔK-CFP mock: ERL1ΔK-CFP EPF1 treatment, p=0.9998. Number of cells analyzed, n = 88 (ERL1-YFP, mock), 92 (ERL1-YFP, MEPF1), 50 (ERL1ΔK-CFP, mock), 59 (ERL1ΔK-CFP, MEPF1). (F) Representative confocal microscopy images of abaxial epidermis of true leaves from ERL1-YFP expressed in erecta erl1 erl2 seedlings treated with mock or 5 µM Stomagen peptide.). Arrow indicates the ring-like structure, characteristics of endoplasmic reticulum localization. Scale bars = 5 µm. (G) Representative confocal microscopy images of abaxial epidermis of true leaves from ERL1ΔK-CFP in erl1 seedlings treated with mock or 5 µM Stomagen peptide. Scale bars = 5 µm.
Figure 8—figure supplement 1
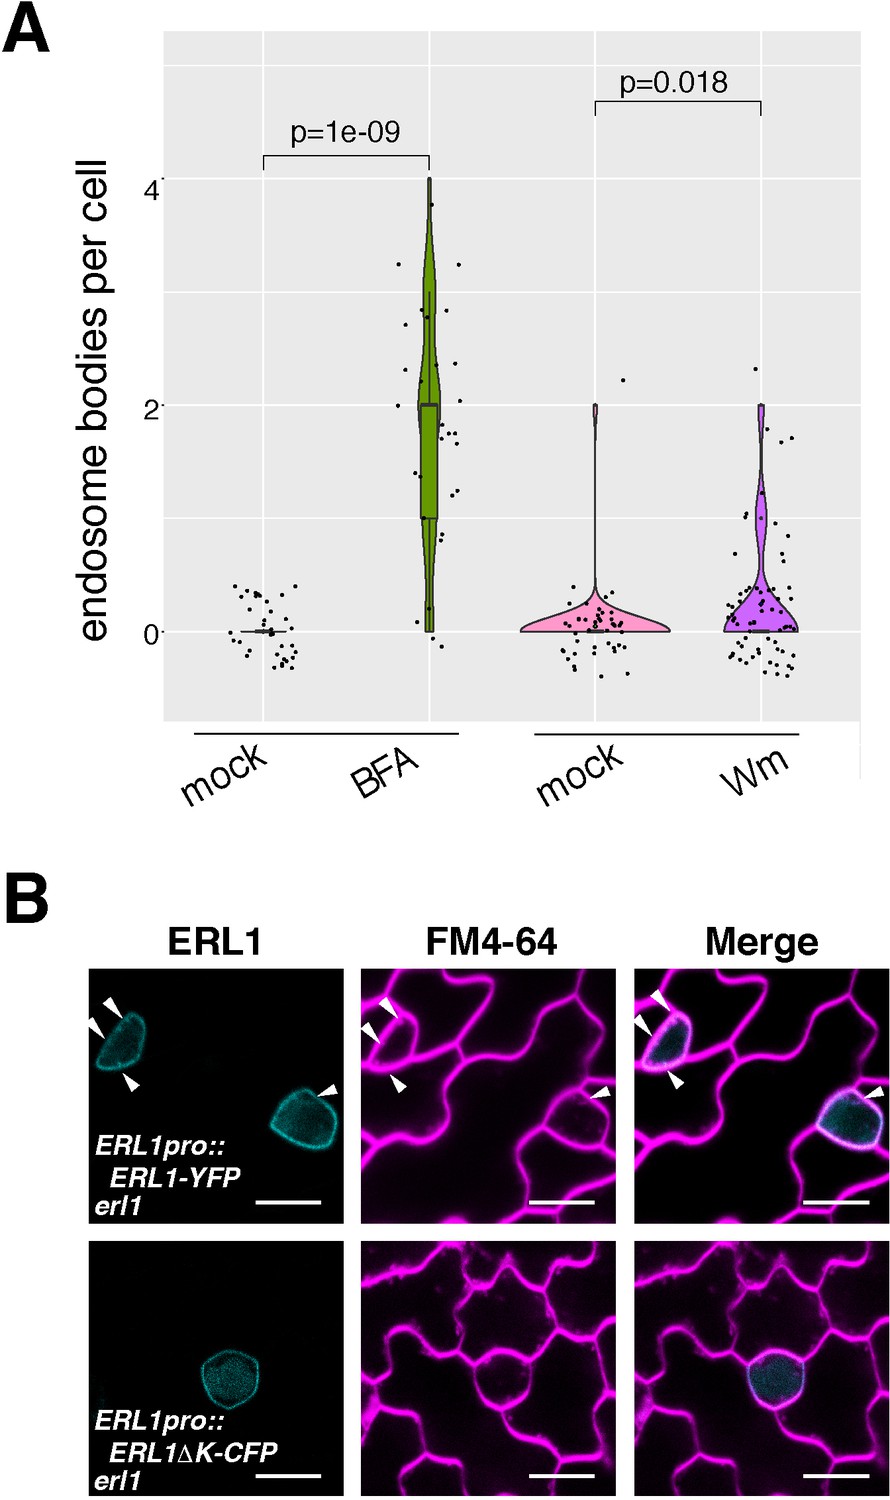
Dominant-negative ERL1ΔK-CFP is predominantly localized at plasma membrane.
(A) Quantitative analysis of the number of ERL1-YFP-positive BFA- or Wm bodies per cell shown as a violin plot. Individual data points are dot-plotted with jitter. Median values are shown as lines in the boxplot. Welch’s two sample T-test was performed for the pairwise comparison of mock and drug-treated samples. Number of cells analyzed, n = 36 for mock (BFA); n = 29 for BFA; n = 44 for mock (Wm); n = 66 for Wm. (B) Representative images of ERL1-YFP in erl1 (upper row) and ERL1ΔK-CFP in erl1 (bottom row) stained with an endocytosis monitoring membrane dye, FM4-64, in the abaxial epidermis of developing true leaves of the 7-day-old seedlings. Arrowheads indicate internalized endosomes.
Figure 9
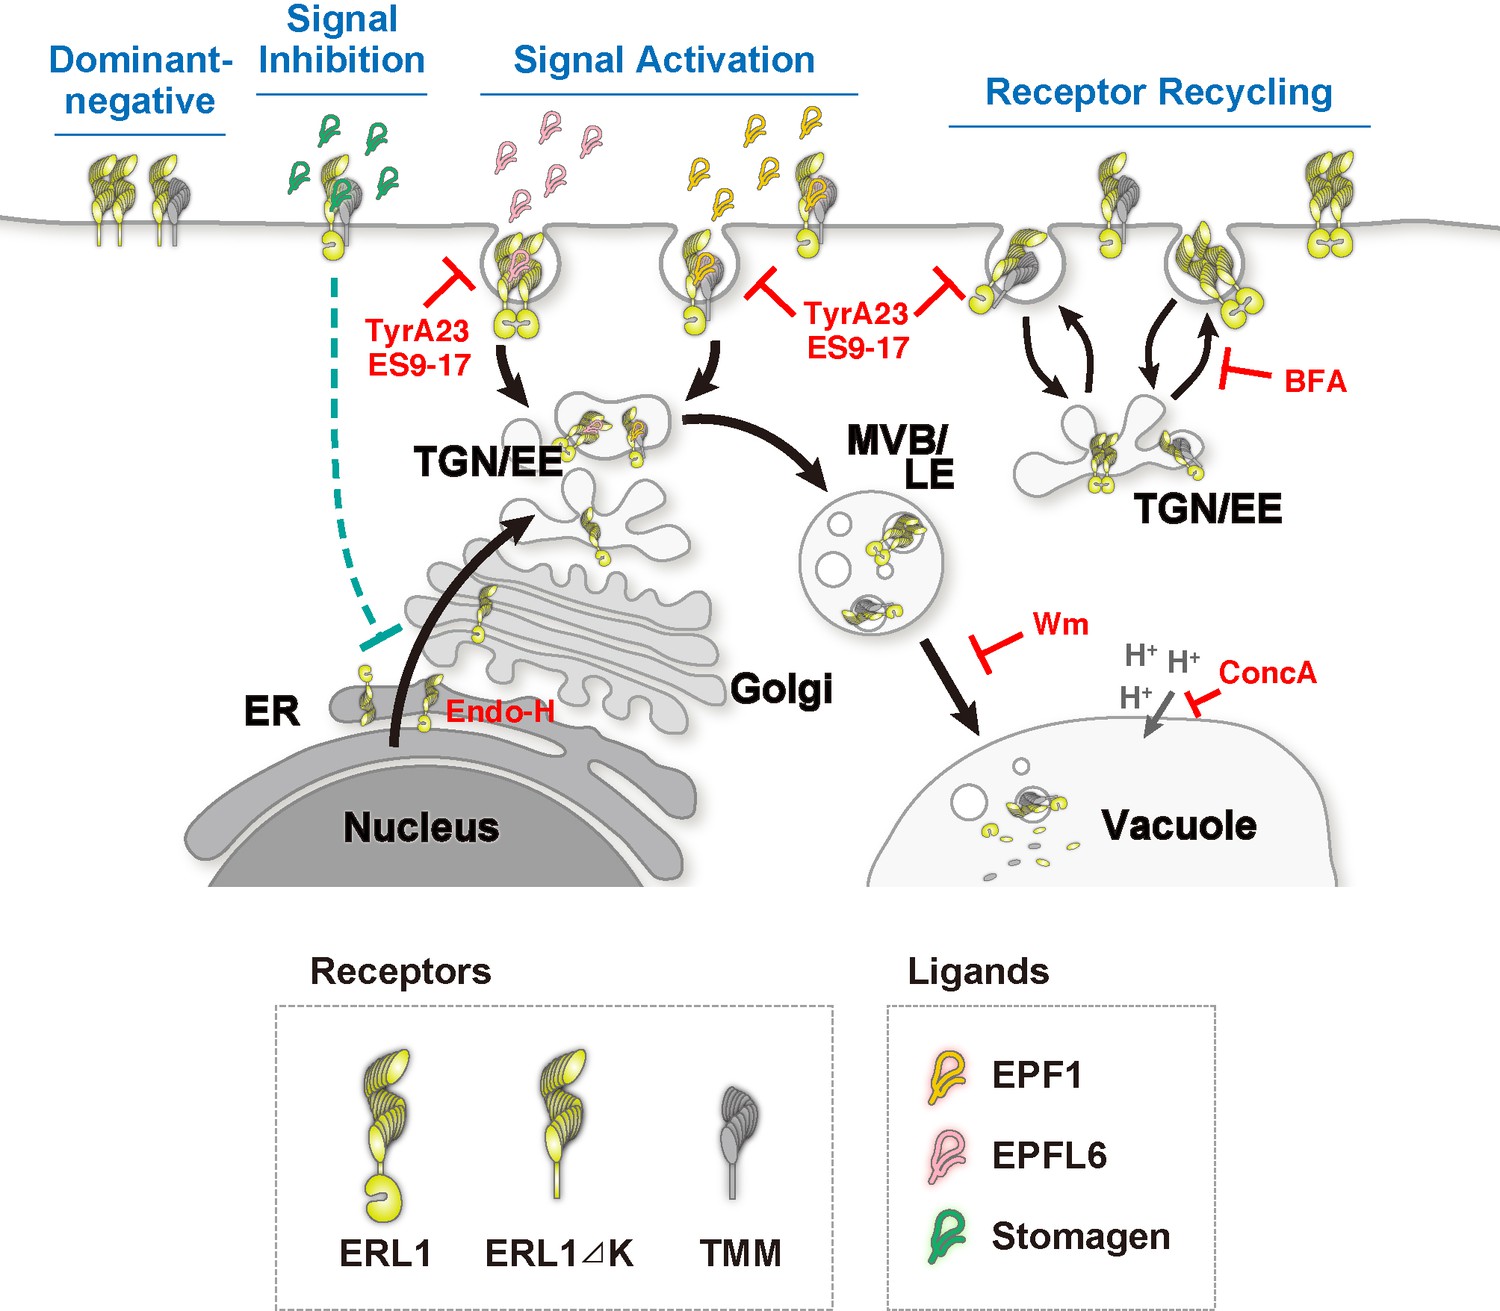
Schematic model of ERL1 subcellular dynamics triggered by diverse EPF peptides with different biological activities.
ERL1 (light green) is constitutively recycling and follows BFA-sensitive endosomal pathway (Receptor Recycling). EPF1 (orange) and EPFL6 (pink) peptide ligands both activate ERL1 to inhibit stomatal differentiation, trigger ERL1 trafficking via Wm-sensitive MVB/LE to the vacuole (Signal Activation). EPF1-triggered ERL1 trafficking requires the presence of TMM (gray). In contrast, EPFL6 triggers ERL1 trafficking in TMM-independent manner. Stomagen (dark green), which blocks ERL1 signaling, causes stalling of ERL1 in endoplasmic reticulum (ER) (Signal Inhibition). The dominant-negative ERL1ΔK is overwhelmingly plasma-membrane localized and does not undergo normal subcellular trafficking (Dominant Negative). The site of action of each inhibitor/enzyme is indicated in red.
Videos
Video 1
ERL1-YFP and RFP-Ara7.
A time-lapse movie of an Arabidopsis meristemoid co-expressing ERL1-YFP and RFP-Ara7. Images were taken every 30 s for 10 frames and presented as four frames per second.
Video 2
FRAP analysis of ERL1-YFP in erl1.
A time-lapse FRAP movie of ERL1-YFP in a meristemoid in erl1 mutant. 5 images were taken every 0.453 s (minimum speed) both before and during photobleaching, and then 120 frames were taken every 3 s after photobleaching. The movie was presented as five frames per second.
Video 3
FRAP analysis of ERL1-YFP in erl1 tmm.
A time-lapse FRAP movie of ERL1-YFP in a meristemoid in erl1 tmm mutant. 5 images were taken every 0.453 s (minimum speed) both before and during photobleaching, and then 120 frames were taken every 3 s after photobleaching. The movie was presented as five frames per second.
Tables
Key resources table
| Reagent type (species) or resource | Designation | Source or reference | Identifiers | Additional information |
|---|---|---|---|---|
| Genetic reagent (Arabidopsis thaliana) | erecta (er-105) | Shpak et al., 2005 PMID:16002616 | See Materials and method, section 1 | |
| Genetic reagent (Arabidopsis thaliana) | erl1-2 | Shpak et al., 2005 PMID:16002616 | See Materials and method, section 1 | |
| Genetic reagent (Arabidopsis thaliana) | erl2-1 | Shpak et al., 2005 PMID:16002616 | See Materials and method, section 1 | |
| Genetic reagent (Arabidopsis thaliana) | epf1-1 | Hara et al., 2007 PMID:17639078 | See Materials and method, section 1 | |
| Genetic reagent (Arabidopsis thaliana) | tmm-KO | Hara et al., 2007 PMID:17639078 | See Materials and method, section 1 | |
| Genetic reagent (Arabidopsis thaliana) | ERL1pro::ERL1-YFP in erl1-2 | Lee et al., 2012 PMID:22241782 | See Materials and method, section 1 | |
| Genetic reagent (Arabidopsis thaliana) | ERL1pro::ERL1-YFP in erl1-2 tmm | This study | See Materials and method, section 1 | |
| Genetic reagent (Arabidopsis thaliana) | ERL1pro::ERL1-YFP in erl1-2 epf1 | This study | See Materials and method, section 1 | |
| Genetic reagent (Arabidopsis thaliana) | ERL1pro::ERL1-FLAG in erl1-2 | Lee et al., 2012 PMID:22241782 | See Materials and method, section 1 | |
| Genetic reagent (Arabidopsis thaliana) | ERL1pro::ERL1-FLAG in erecta erl1-2 erl2-1 | Lee et al., 2012 PMID:22241782 | See Materials and method, section 1 | |
| Genetic reagent (Arabidopsis thaliana) | ERL1pro::ERL1ΔK-CFP in erl1-2 | Lee et al., 2012 PMID:22241782 | See Materials and method, section 1 | |
| Genetic reagent (Arabidopsis thaliana) | MUTEpro::ERL1-YFP in er-105 erl1-2 erl2-1 | Qi et al., 2017 PMID:28266915 | See Materials and method, section 1 | |
| Genetic reagent (Arabidopsis thaliana) | iEPF1 | Qi et al., 2017 PMID:28266915 | See Materials and method, section 1 | |
| Genetic reagent (Arabidopsis thaliana) | BRI1pro::BRI1-GFP | Friedrichsen et al., 2000 PMID:10938344 | See Materials and method, section 1 | |
| Genetic reagent (Arabidopsis thaliana) | UBQ10pro::YFP-SYP32 | Geldner et al., 2009 PMID:19309456 | Wave22Y | See Materials and method, section 1 |
| Genetic reagent (Arabidopsis thaliana) | UBQ10pro::YFP-ARA7 | Geldner et al., 2009 PMID:19309456 | Wave2Y | See Materials and method, section 1 |
| Genetic reagent (Arabidopsis thaliana) | UBQ10pro::YFP-RabA5d | Geldner et al., 2009 PMID:19309456 | Wave24Y | See Materials and method, section 1 |
| Genetic reagent (Arabidopsis thaliana) | UBQ10pro::YFP-RabA1e | Geldner et al., 2009 PMID:19309456 | Wave34Y | See Materials and method, section 1 |
| Genetic reagent (Arabidopsis thaliana) | SYP43pro::GFP-SYP43 | Uemura et al., 2012 PMID:22307646 | See Materials and method, section 1 | |
| Genetic reagent (Arabidopsis thaliana) | SYP22pro:: SYP22- mRFP | Ebine et al., 2011; Postma et al., 2016,PMID:21666683, 26765243 | See Materials and method, section 1 | |
| Genetic reagent (Arabidopsis thaliana) | ARA7pro::mRFP-ARA7 | Ebine et al., 2011; Postma et al., 2016,PMID:21666683,26765243 | See Materials and method, section 1 | |
| Genetic reagent (Arabidopsis thaliana) | SYP43pro:: SYP43- mRFP | Ebine et al., 2011; Postma et al., 2016,PMID:21666683,26765243 | See Materials and method, section 1 | |
| Genetic reagent (Arabidopsis thaliana) | ARA6pro::ARA6-GFP | Ebine et al., 2011 PMID:21666683 | See Materials and method, section 1 | |
| Genetic reagent (Arabidopsis thaliana) | ST-RFP | Faraco et al., 2017 PMID:28636930 | See Materials and method, section 1 | |
| Genetic reagent (Arabidopsis thaliana) | KDEL-RFP | Faraco et al., 2017 PMID:28636930 | See Materials and method, section 1 | |
| Genetic reagent (Arabidopsis thaliana) | CaMV35S::N-ST-YFP | Takagi et al., 2013 PMID:24280388 | See Materials and method, section 1 | |
| Genetic reagent (Arabidopsis thaliana) | CaMV35S::GFP-HDEL | Mitsuhashi et al., 2000 PMID:11100771 | See Materials and method, section 1 | |
| Chemical compound, drug | Brefeldin A (BFA) | Cayman Chemical | Cat. #: 11861 Lot #: 0533646–12 | See Materials and method, section 3 |
| Chemical compound, drug | Concanamycin A | Adipogen Life Sceinces | Cat. #: BVT-0237-C025 Lot #: B1105151 | See Materials and method, section 3 |
| Chemical compound, drug | Brefeldin A (BFA) | Sigma | Cat. #: B7651 | See Materials and method, section 3 |
| Chemical compound, drug | Wortmannin (Wm) | Sigma | Cat. #: W1628 | See Materials and method, section 3 |
| Chemical compound, drug | Cycloheximide (CHX) | Sigma | Cat. #: C4859 | See Materials and method, section 3 |
| Chemical compound, drug | Rhodamine B | Sigma | Cat. #: R6626 | See Materials and method, section 3 |
| Chemical compound, drug | Tyrphostin (Tyr A23) | Sigma | Cat. #: T7165 | See Materials and method, section 3 |
| Chemical compound, drug | ES9-17 | Dejonghe et al., 2019 PMID:31011214 | See Materials and method, section 3 | |
| Peptide, recombinant protein | MEPF1 | Lee et al., 2012 PMID:22241782 | pJSL11 | See Materials and method, section 2 |
| Peptide, recombinant protein | MEPFL6 | This work | pJSL79 | See Materials and method,section 2 |
| Peptide, recombinant protein | STOMAGEN | Lee et al., 2015 PMID:26083750 | See Materials and method, Section 2 | |
| Antibody | Mouse monoclonal anti-FLAG M2 | Sigma | Cat. #: F-3165 Lot #: 065K6236 | WB (1:5000 dilution) |
| Antibody | Horseradish peroxidase-conjugated goat anti-mouse IgG | GE Healthcare | Cat. #: NA931VS Lot #: 9708060 | WB (1:50,000 dilution) |
| Antibody | Mouse anti-tubulin | Millipore Sigma | Cat. #: MABT205 Lot #: 2999783 | WB (1:5000 dilution) |
| Software, algorithm | R (ver 3.4.1) | Ritz et al., 2015 PMID:26717316 | See Materials and method, section 2 and section 7 | |
| Software, algorithm | Leica LAS AF | http://www.leica-microsystems.com | See Materials and method, section 5 | |
| Software, algorithm | Fiji | https://imagej.net/Fiji | See Materials and method, section 5 | |
| Software, algorithm | Imaris 8.1 | Bitplane | See Materials and method, section 5 | |
| Software, algorithm | FrapBot | Kohze et al., 2017 www.frapbot.kohze.com | See Materials and method, section 6 | |
| Other | FM4-64 | Invitrogen/Thermo Fisher Scientific | Cat. #: T13320 | See Materials and method, section 3 |
| Other | Endo-H | NEB | Cat. #: P0703S | See Materials and method, section 4 |
Additional files
-
Source code 1
R-scripts generated and used for this study.
- https://cdn.elifesciences.org/articles/58097/elife-58097-code1-v2.pdf.zip
-
Supplementary file 1
List of DNA primers and their sequence used in the study.
- https://cdn.elifesciences.org/articles/58097/elife-58097-supp1-v2.docx
-
Transparent reporting form
- https://cdn.elifesciences.org/articles/58097/elife-58097-transrepform-v2.docx
Download links
A two-part list of links to download the article, or parts of the article, in various formats.
Downloads (link to download the article as PDF)
Open citations (links to open the citations from this article in various online reference manager services)
Cite this article (links to download the citations from this article in formats compatible with various reference manager tools)
The manifold actions of signaling peptides on subcellular dynamics of a receptor specify stomatal cell fate
eLife 9:e58097.
https://doi.org/10.7554/eLife.58097


