Specialization of the chromatin remodeler RSC to mobilize partially-unwrapped nucleosomes
- Howard Hughes Medical Institute (HHMI), Department of Oncological Sciences, Huntsman Cancer Institute, University of Utah School of Medicine, United States
Figures
Figure 1 with 2 supplements
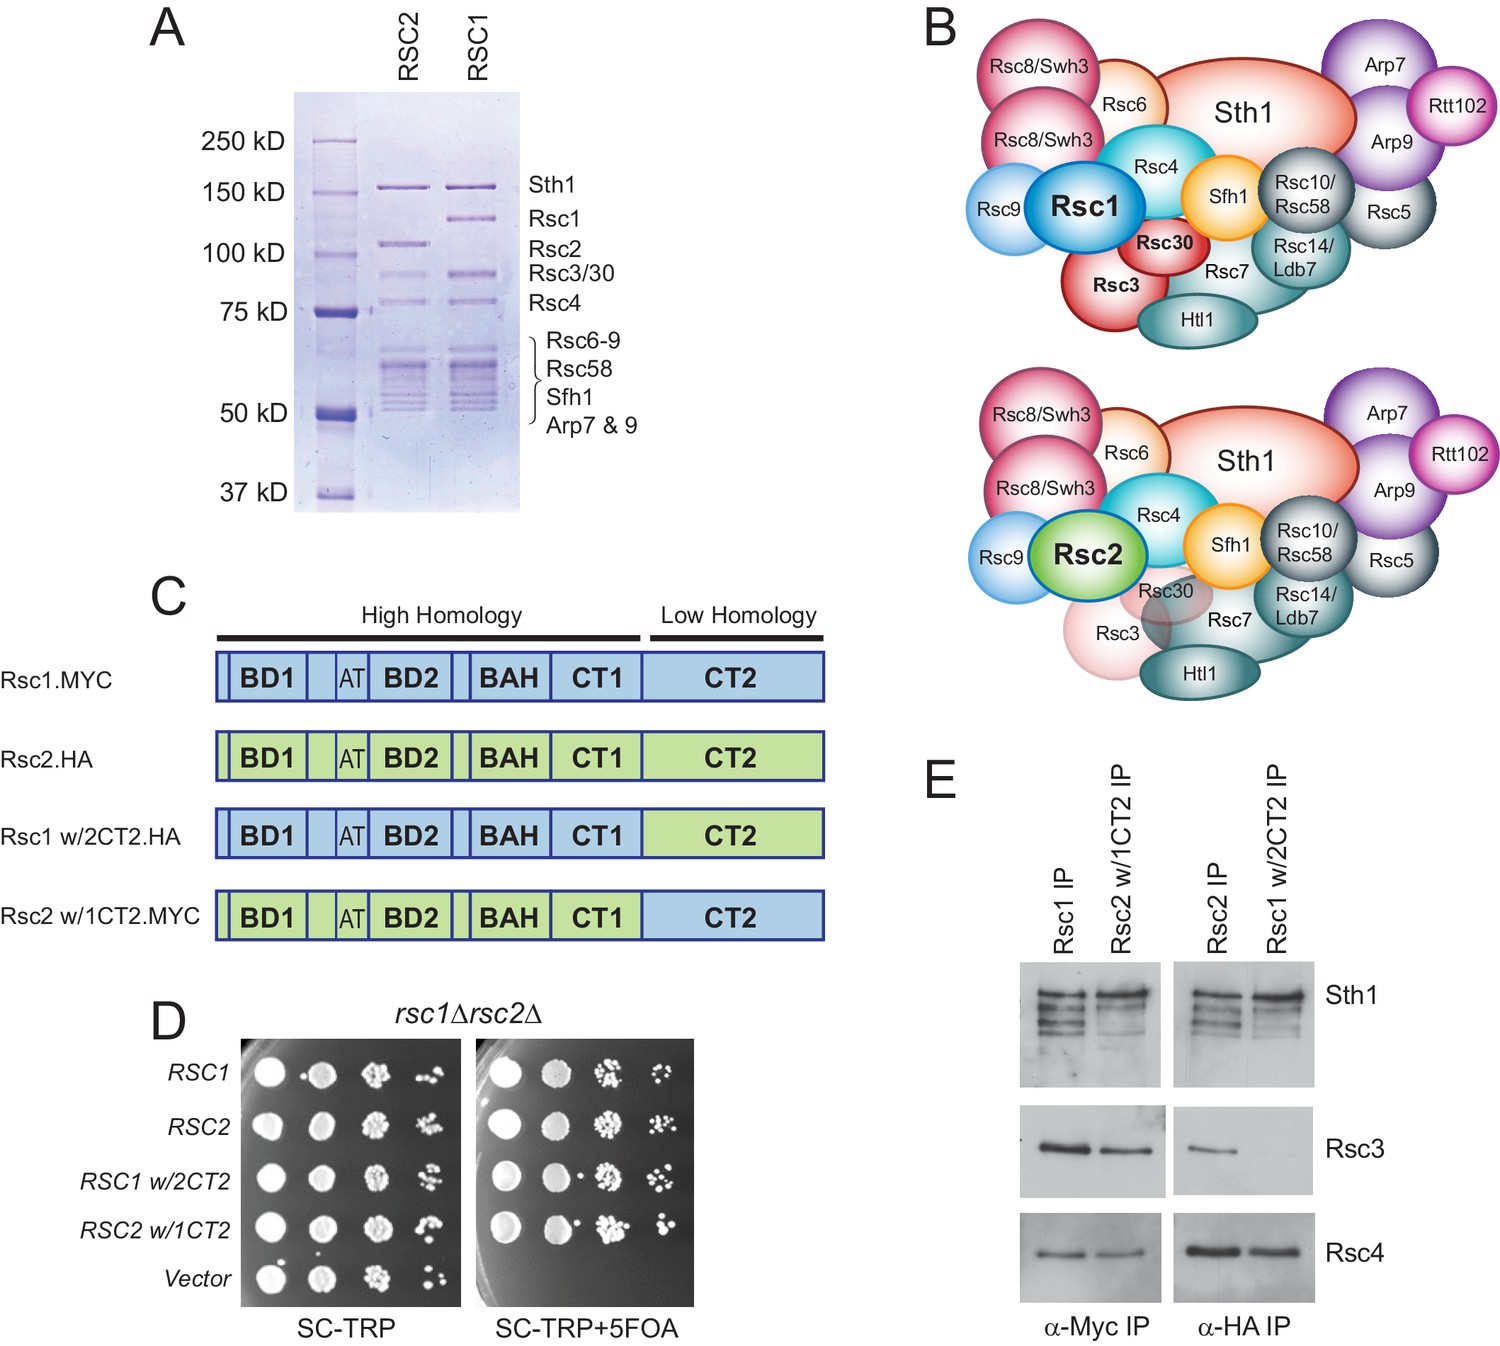
Rsc3/30 module has higher avidity for the RSC1 complex.
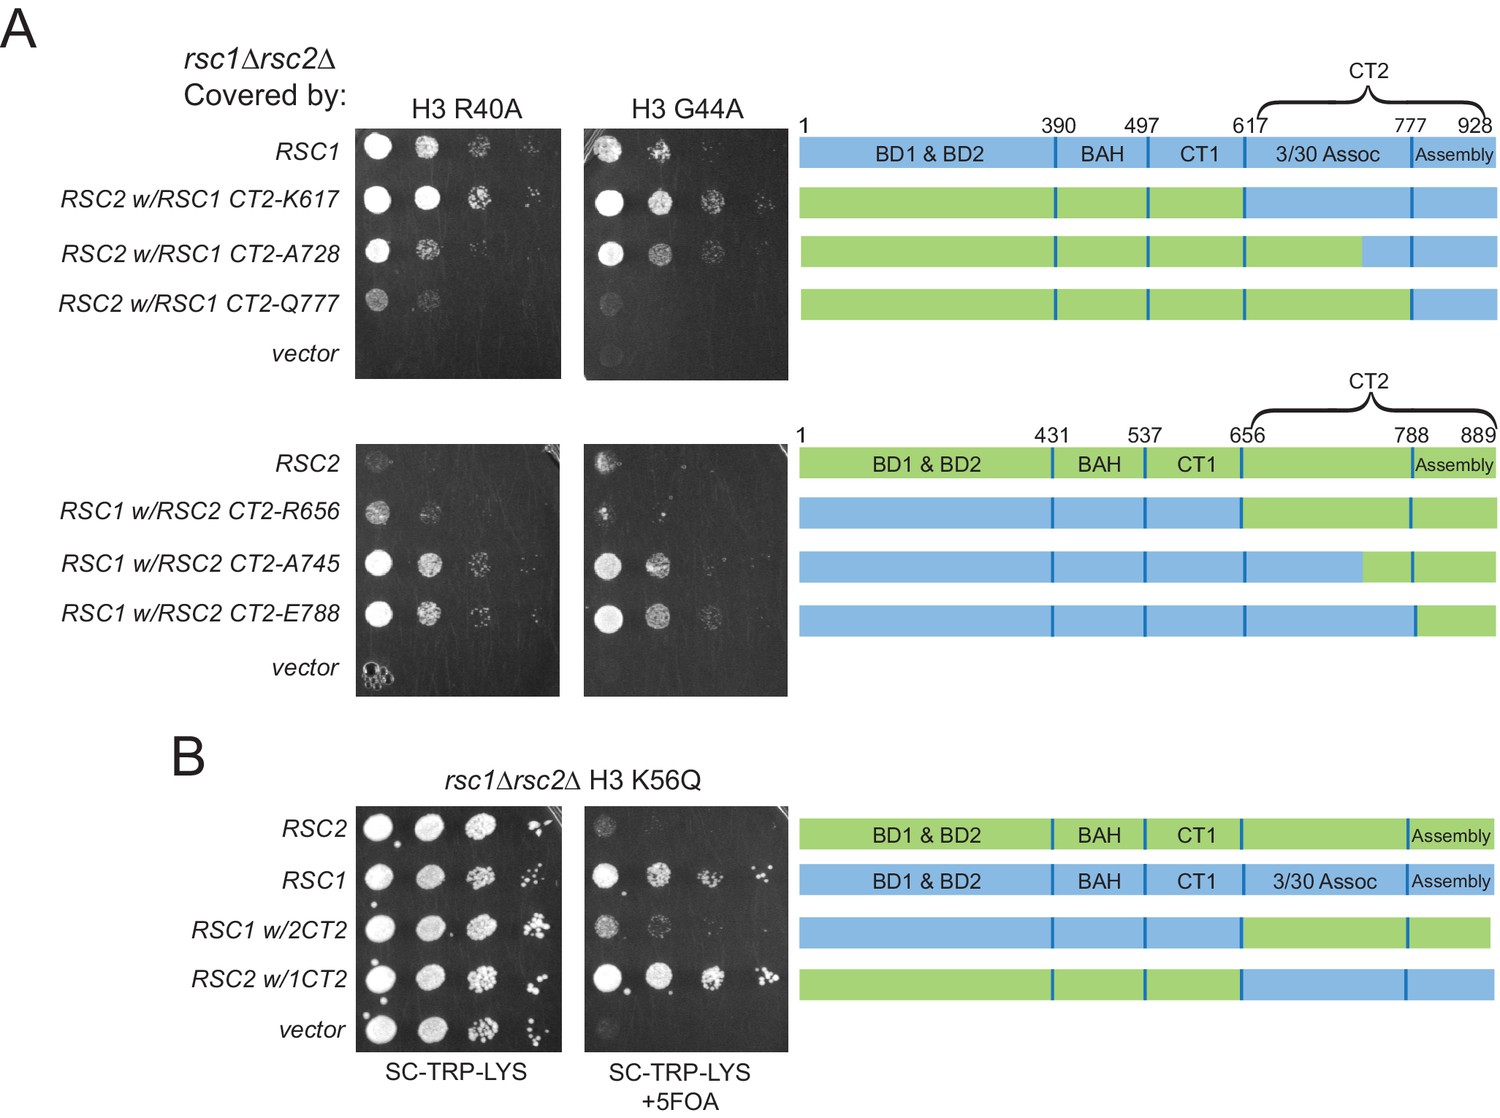
(A) Purified RSC1-TAP and RSC2-TAP complexes (2 µg) analyzed on 7.5% SDS-PAGE gel stained with Coomassie dye. (B) RSC1 and RSC2 complex compositions, with decreased opacity displaying the reduced association of the Rsc3/30 module in the RSC2 complex. (C) Domain structure and swaps of Rsc1 and Rsc2. (D) CT2 domain swaps complement for viability. TRP1-marked plasmids bearing RSC1 (p609), RSC2 (p604), RSC1 w/2CT2 (p3097), RSC2 w/1CT2 (p3098), or vector (pRS314) were transformed into rsc1∆ rsc2∆ [RSC1.URA3] (YBC800), and spotted as 10x serial dilutions to SC-TRP or to SC-TRP+5FOA to force the loss of the RSC1.URA3 plasmid. ’ w/’ indicates ‘with’. One of four biological replicates shown. (E) The Rsc3/30 module associates more strongly with the CT2 region of Rsc1. Immunoprecipitations of Rsc1, Rsc2 w/1CT2, Rsc2, Rsc1 w/2CT2 from whole cell extracts. Blots were probed with anti-Sth1, then stripped and reprobed for anti-Rsc3 and anti-Rsc4. One of three technical replicates shown. Figure 1—figure supplement 1. The Rsc3/30 module associates with the RSC1 complex at high stringency. Figure 1—figure supplement 2. Additional swaps and truncations define the region of Rsc3/30 association.
Figure 1—figure supplement 1
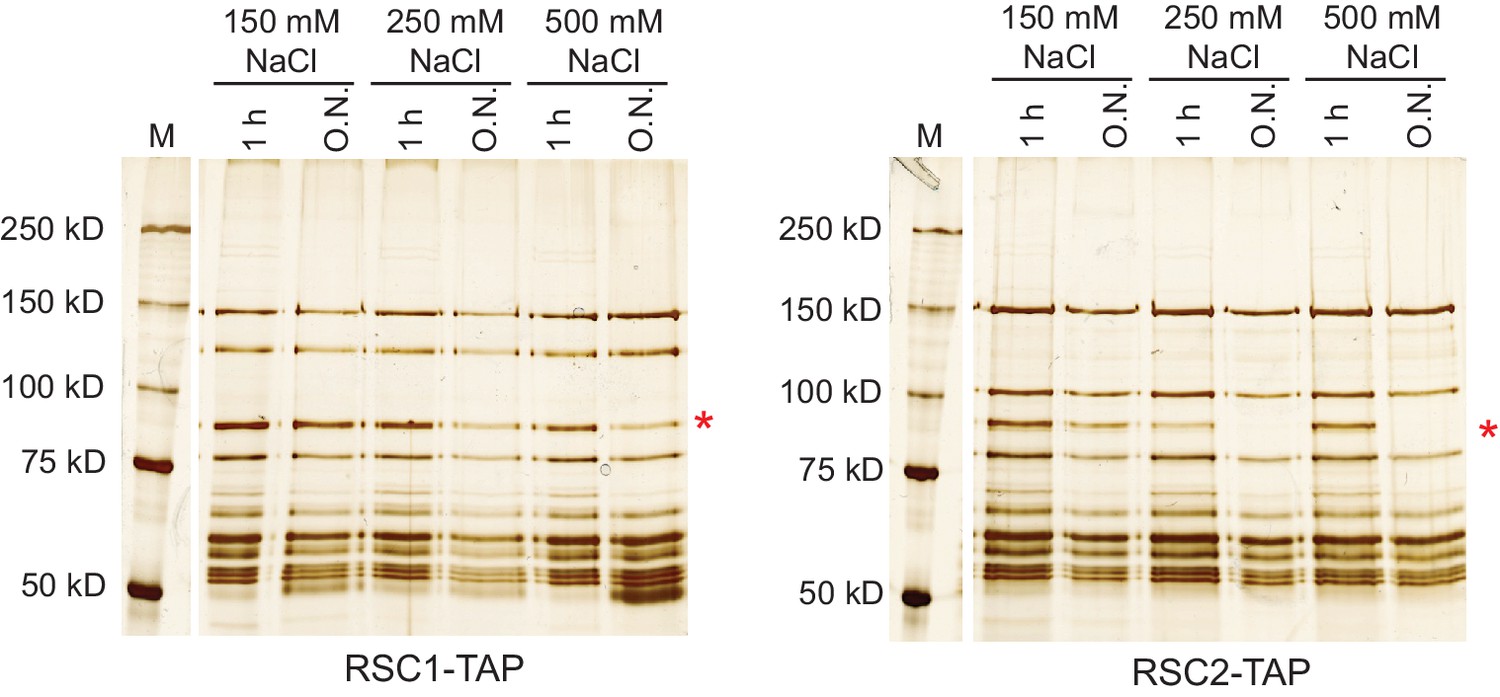
The Rsc3/30 module associates with the RSC1 complex at high stringency.
Yeast cell lysates containing RSC-TAP complexes were bound to IgG resin, the beads rinsed with lysis buffer before washing with buffer of the indicated salt concentration and duration. RSC complexes were analyzed on 6% acrylamide SDS-PAGE gels stained with silver. The Rsc3 and Rsc30 proteins run closely on denaturing gels and the doublet will often appear as a single band, marked by the asterisk (*). The marker lanes (M) are each from the adjacent gel, but were moved for depiction. Stringency testing conducted once.
Figure 1—figure supplement 2
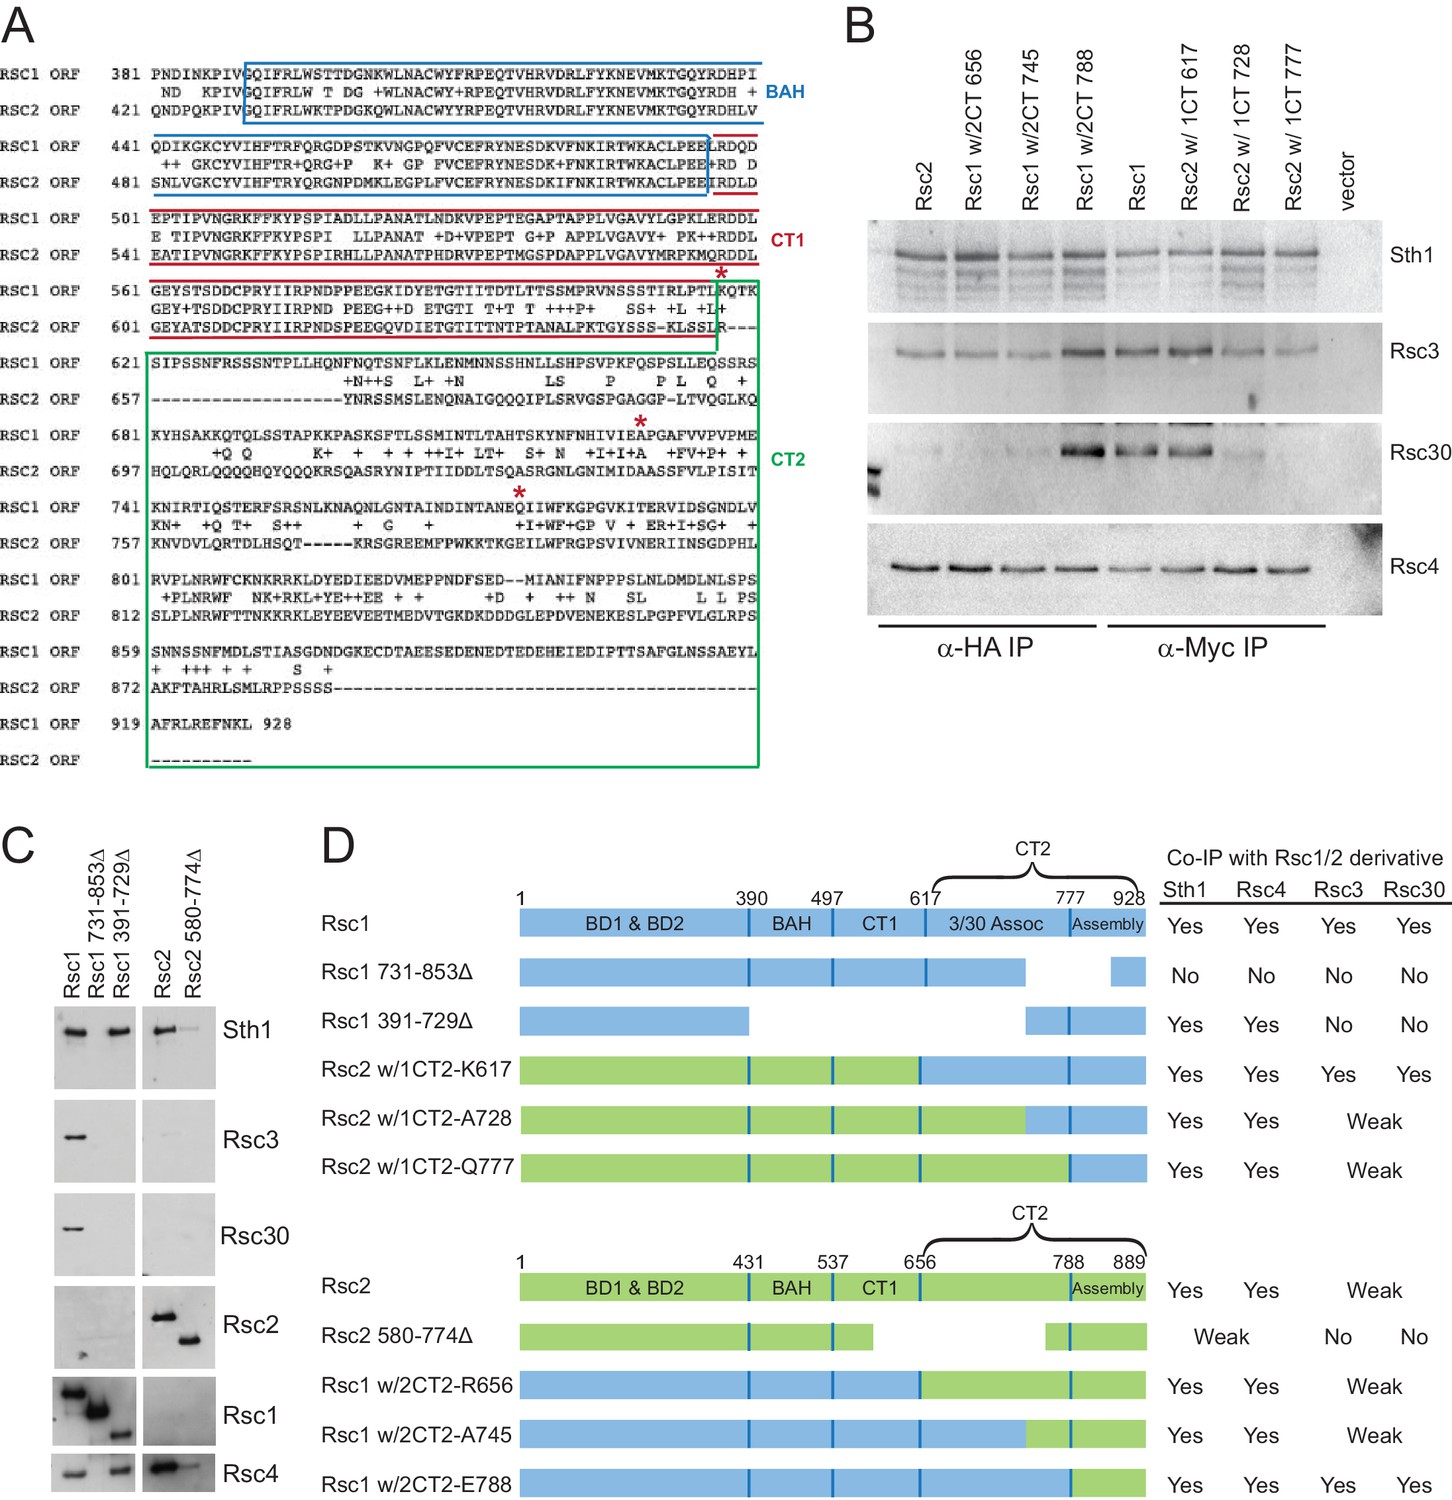
Additional swaps and truncations define the region of Rsc3/30 association.
(A) Alignment of C-terminus of Rsc1 and Rsc2, showing conservation and position of swaps (red asterisks). (B) Co-IPs of Rsc3 and Rsc30 with additional Rsc1 and Rsc2 CT swaps. Whole cell extracts prepared from rsc1∆ rsc2∆ covered by TRP1-marked plasmid containing RSC1, RSC2, or CT swap were immunoprecipitated using anti-Myc (for CT2 of Rsc1), or anti-HA (for CT2 of Rsc2) bound to Dynabeads. Western blots were probed with antibodies against Sth1, Rsc3, Rsc30, and Rsc4. One of three biological replicates shown. (C) Co-IPs of RSC members with Rsc1 or Rsc2 containing deletions within the CT2 region. Whole cell extracts prepared from rsc1∆ rsc2∆ covered by TRP1-marked plasmid containing deletions were immunoprecipitated using anti-Myc (for CT2 of Rsc1), or anti-HA (for CT2 of Rsc2) bound Dynabeads. Western blots were probed with antibodies against Sth1, Rsc3, Rsc30, Rsc2, Rsc4, and Myc. One of three technical replicates shown. (D) Summary of Rsc1 and Rsc2 Co-IPs from deletions and swaps.
Figure 2 with 3 supplements
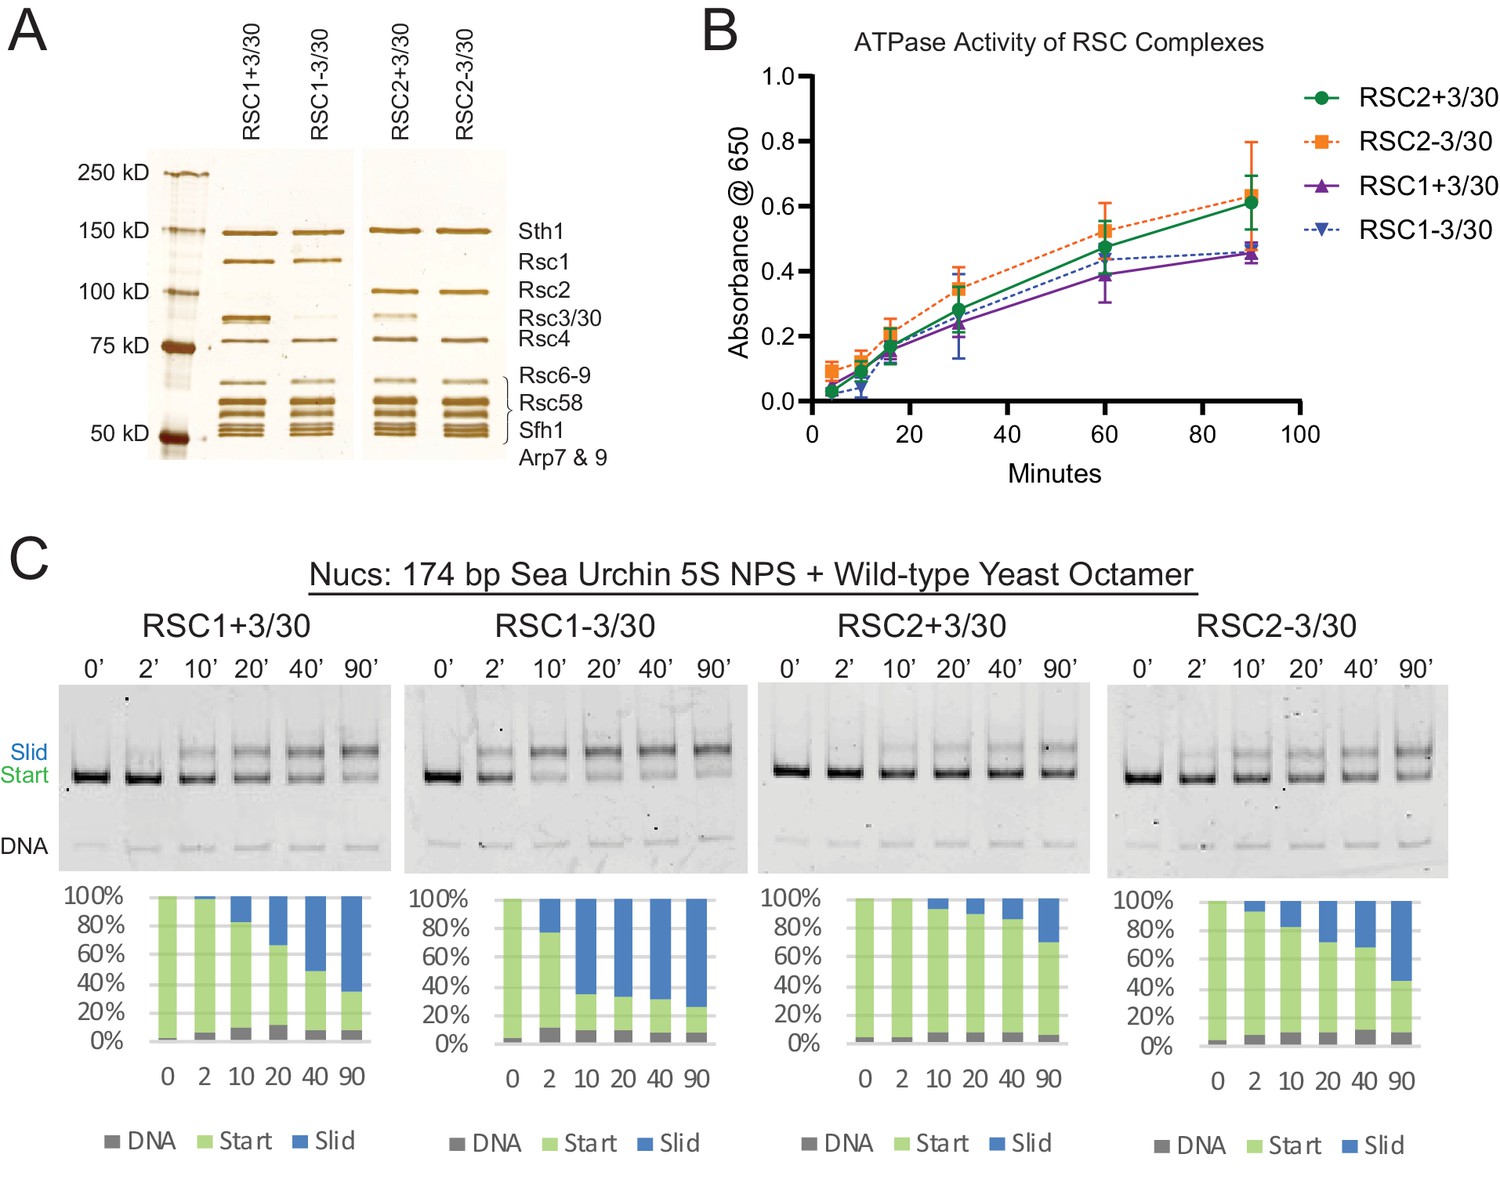
RSC1 and RSC2 complexes differ in remodeling activity on a sea urchin 5S mononucleosomal substrate.
(A) Alternative RSC1 and RSC2 complexes, with the Rsc3/30 module maintained or removed during purification. Purified RSC complexes (600 ng) were analyzed on a 6% polyacrylamide SDS-PAGE gel stained with silver. The RSC1 and RSC2 complexes are from the same gel, but were moved adjacent for the depiction. (B) ATPase time course of RSC1 and RSC2 with and without the Rsc3/30 module. Values are the mean +/- standard deviation from two separate RSC preps for each RSC complex assayed in triplicate. (C) Comparative sliding of 174 bp sea urchin 5S yeast mononucleosomes (20 nM) by RSC1 and RSC2 complexes (30 nM). The nucleosomal Start (green), Slid (blue), and free DNA (grey) bands were quantified and reported as a percent of the total signal.
-
Figure 2—source data 1
ATPase time course data.
- https://cdn.elifesciences.org/articles/58130/elife-58130-fig2-data1-v2.zip
-
Figure 2—source data 2
RSC sliding of wt 5S yNucs.
- https://cdn.elifesciences.org/articles/58130/elife-58130-fig2-data2-v2.xls
Figure 2—figure supplement 1
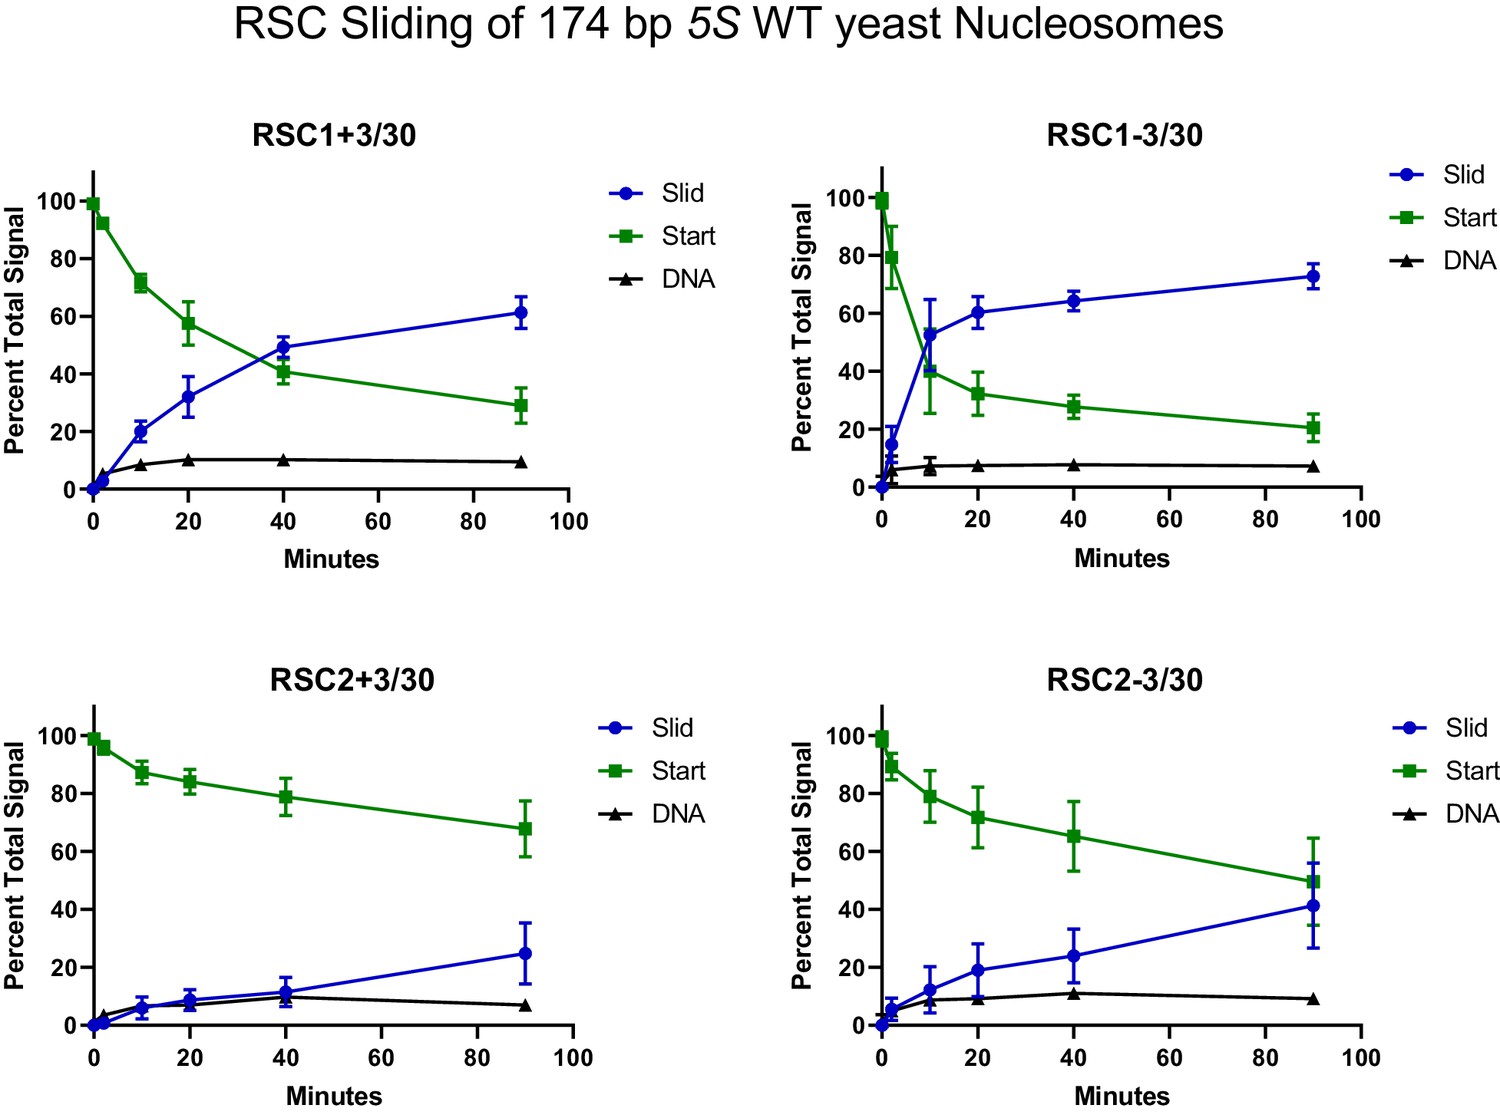
Quantification of RSC sliding 174 bp 5S wild-type yeast mononucleosomes as conducted in Figure 2C.
Mean and standard deviation for four replicates.
-
Figure 2—figure supplement 1—source data 1
Quantification of RSC sliding 5S wt yNucs.
- https://cdn.elifesciences.org/articles/58130/elife-58130-fig2-figsupp1-data1-v2.zip
Figure 2—figure supplement 2

RSC complexes without Rsc3/30 module are ATP-dependent chromatin remodelers and RSC1 and RSC2 complexes bind similarly to 174 bp sea urchin 5S mononucleosomes.
(A) RSC1 and RSC2 complexes slide mononucleosomes in an ATP-dependent manner. Mononucleosomes (20 nM) were incubated in the presence (+) or absence (-) of 1 mM ATP with 30 nM of either the RSC1-3/30 (1-3/30) or the RSC2-3/30 (2-3/30) complex for 90 min at 30°C. Experiment conducted once. (B) RSC1 and RSC2 complexes bind similarly to mononucleosomes with 174 bp sea urchin 5S DNA and wild-type yeast octamers. Nucleosomes (20 nM) were incubated with 0, 30, or 60 nM RSC for 20 min at 30°C, run on a 3.8% native polyacrylamide gel, and stained with ethidium bromide. Two technical replicates shown.
Figure 2—figure supplement 3

The RSC 5S sliding product is not the result of H2A/H2B dimer loss.
(A) Nucleosome sliding by RSC1-3/30 (30 nM) of 174 bp sea urchin 5S yeast mononucleosomes (20 nM) fluorescently labeled with Oregon Green (OG) on H2A (Q114C). The native gel was scanned for OG to detect the presence of H2A, followed by staining and scanning for ethidium bromide to detect DNA. (B) The ratio of H2A/H2B dimer to DNA was calculated for each of the Start and Slid bands and normalized to the starting nucleosomal band at the ‘0’ time point. The average and standard deviation of sliding on two separate nucleosome preps were examined. The fluorescently labeled H2A*OG yeast octamers were a gift from L. McCullough and T. Formosa.
-
Figure 2—figure supplement 3—source data 1
Quantification of RSC1 sliding H2A-OG 5S yNucs.
- https://cdn.elifesciences.org/articles/58130/elife-58130-fig2-figsupp3-data1-v2.xls
Figure 3 with 5 supplements
Mutations in the H3 αN helix are lethal in combination with rsc1∆, but not rsc2∆, and they reduce RSC remodeling of the 5S nucleosome.
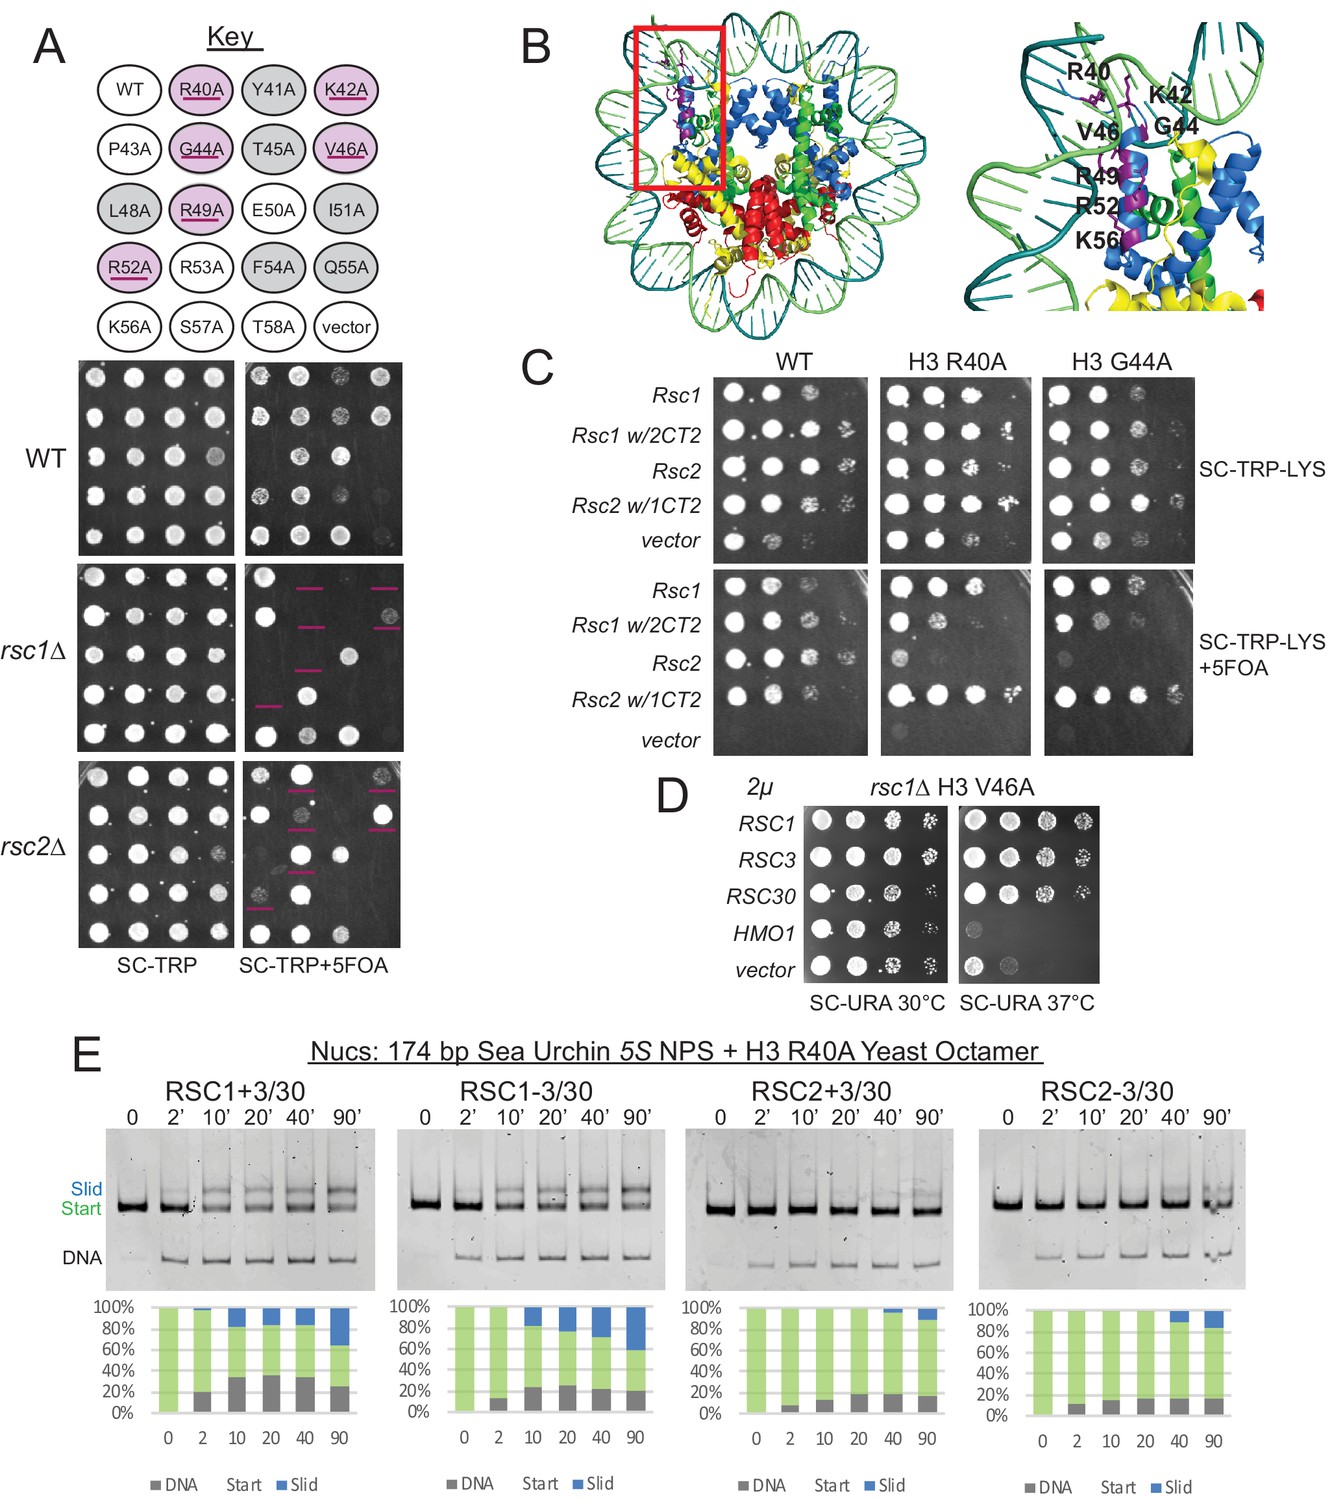
(A) Histone H3 αN helix mutations that are lethal with rsc1∆. TRP1-marked plasmids containing WT H4, and H3 mutations within the αN helix were transformed into h3-h4∆ [H3-H4.URA3] (YBC1939), rsc1∆ h3-h4∆ [H3-H4.URA3] (YBC2090) or rsc2∆ h3-h4∆ [H3-H4.URA3] (YBC3040), and spotted to SC-TRP or SC-TRP+5FOA to force the loss of the WT histone plasmid. Mutations that were lethal on their own without mutated RSC are shaded in grey. Mutations that were lethal in rsc1∆ but not rsc2∆ are shaded in purple and underlined. Transformants were grown at 30°C for 2 days. Shown is one of two biological replicates. (B) Location of the synthetic lethal rsc1∆ H3 αN helix mutations are depicted in purple on the nucleosome, PDB code 1ID3. (C) The RSC1 CT2 region complements the synthetic lethal rsc1∆ H3 αN helix mutations. rsc1∆ rsc2∆ h3-h4∆ [RSC1.URA3] with [H3.WT, R40A, or G44A-H4.WT. LYS2] (YBC3466, YBC3444, YBC3433) transformed with TRP1-marked plasmids bearing RSC1 (p609), RSC2 (p604), RSC1 w/2CT2 (p3097), RSC2 w/1CT2 (p3098), or vector (pRS314) and spotted as 10x serial dilution to SC-TRP-LYS, or SC-TRP-LYS+5FOA. Shown is one of four biological replicates. (D) High-copy RSC3 or RSC30 will partially suppress the Tsˉ phenotype of rsc1∆ H3V46A. Strain rsc1∆ h3-h4∆ [H3.V46A-H4.WT.TRP] (YBC3586) transformed with URA3-marked high copy (2μ) plasmids containing RSC1 (p705), RSC3 (p1310), RSC30 (p916), HMO1 (p3390), or vector (pRS426), and spotted as 10x serial dilutions at 30°C or 37°C. Shown is one of two biological replicates. (E) Comparative sliding and ejection of 174 bp sea urchin 5S NPS H3 R40A yeast mononucleosomes (20 nM) by RSC1 and RSC2 complexes (30 nM). The nucleosomal Start (green), Slid (blue), and free DNA (grey) bands were quantified and reported as a percent of the total signal.
-
Figure 3—source data 1
RSC sliding 5S R40A yNuc.
- https://cdn.elifesciences.org/articles/58130/elife-58130-fig3-data1-v2.zip
Figure 3—figure supplement 1
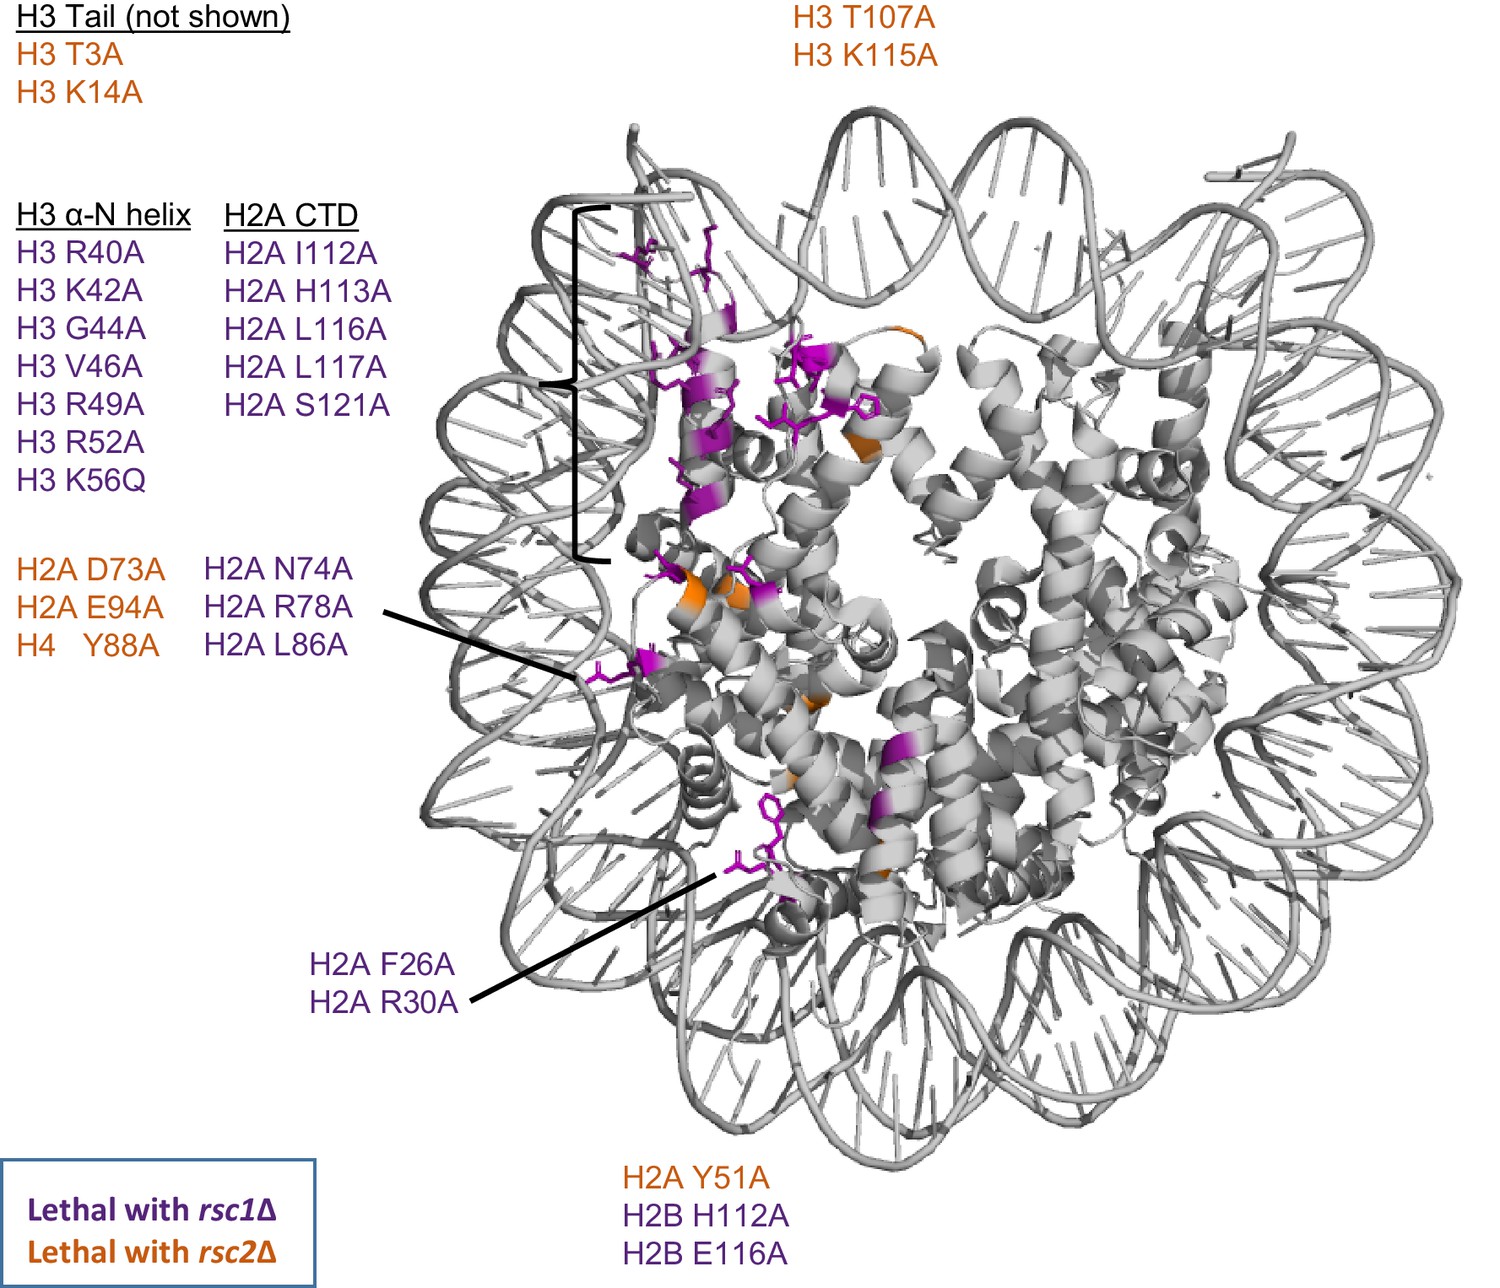
Synthetic lethal mutations in each of the four histones H2A, H2B, H3, and H4 when combined with rsc1∆ or rsc2∆ mutations.
Mutations that are specifically lethal in combination with rsc1∆ are colored purple, mutations that are specifically lethal with rsc2∆ are colored orange. PDB code 1ID3.
Figure 3—figure supplement 2
Complementation by CT2 domain swaps when combined with H3 αN helix mutations.
(A) The RSC1 CT2 region complements the synthetic lethal rsc1∆ H3 αN helix mutations. Strain rsc1∆ rsc2∆ h3-h4∆ [RSC1.URA3] [H3. R40A, or G44A-H4.WT. LYS2] (YBC3444, YBC3433) transformed with TRP1-marked plasmids bearing RSC1 (p609), RSC2 (p604), C-Terminal swaps at positions noted (p3098, p3165, p3167, p3097, p3166, p3164) or vector (pRS314) and spotted as 10x serial dilution to SC-TRP-LYS, or SC-TRP-LYS+5FOA. One of four biological replicates shown. (B) Synthetic lethality of rsc1∆ H3 K56Q is complemented by the RSC1 CT2 region. Strain rsc1∆ rsc2∆ h3-h4∆ [RSC1.URA3] [H3.K56Q-H4.WT. LYS2] (YBC3432) transformed with TRP1-marked plasmids bearing RSC1 (p609), RSC2 (p604), RSC1 w/2CT2 (p3097), RSC2 w/1CT2 (p3098), or vector (pRS314) and spotted as 10x serial dilution to SC-TRP-LYS, or SC-TRP-LYS+5FOA. One of four biological replicates shown.
Figure 3—figure supplement 3
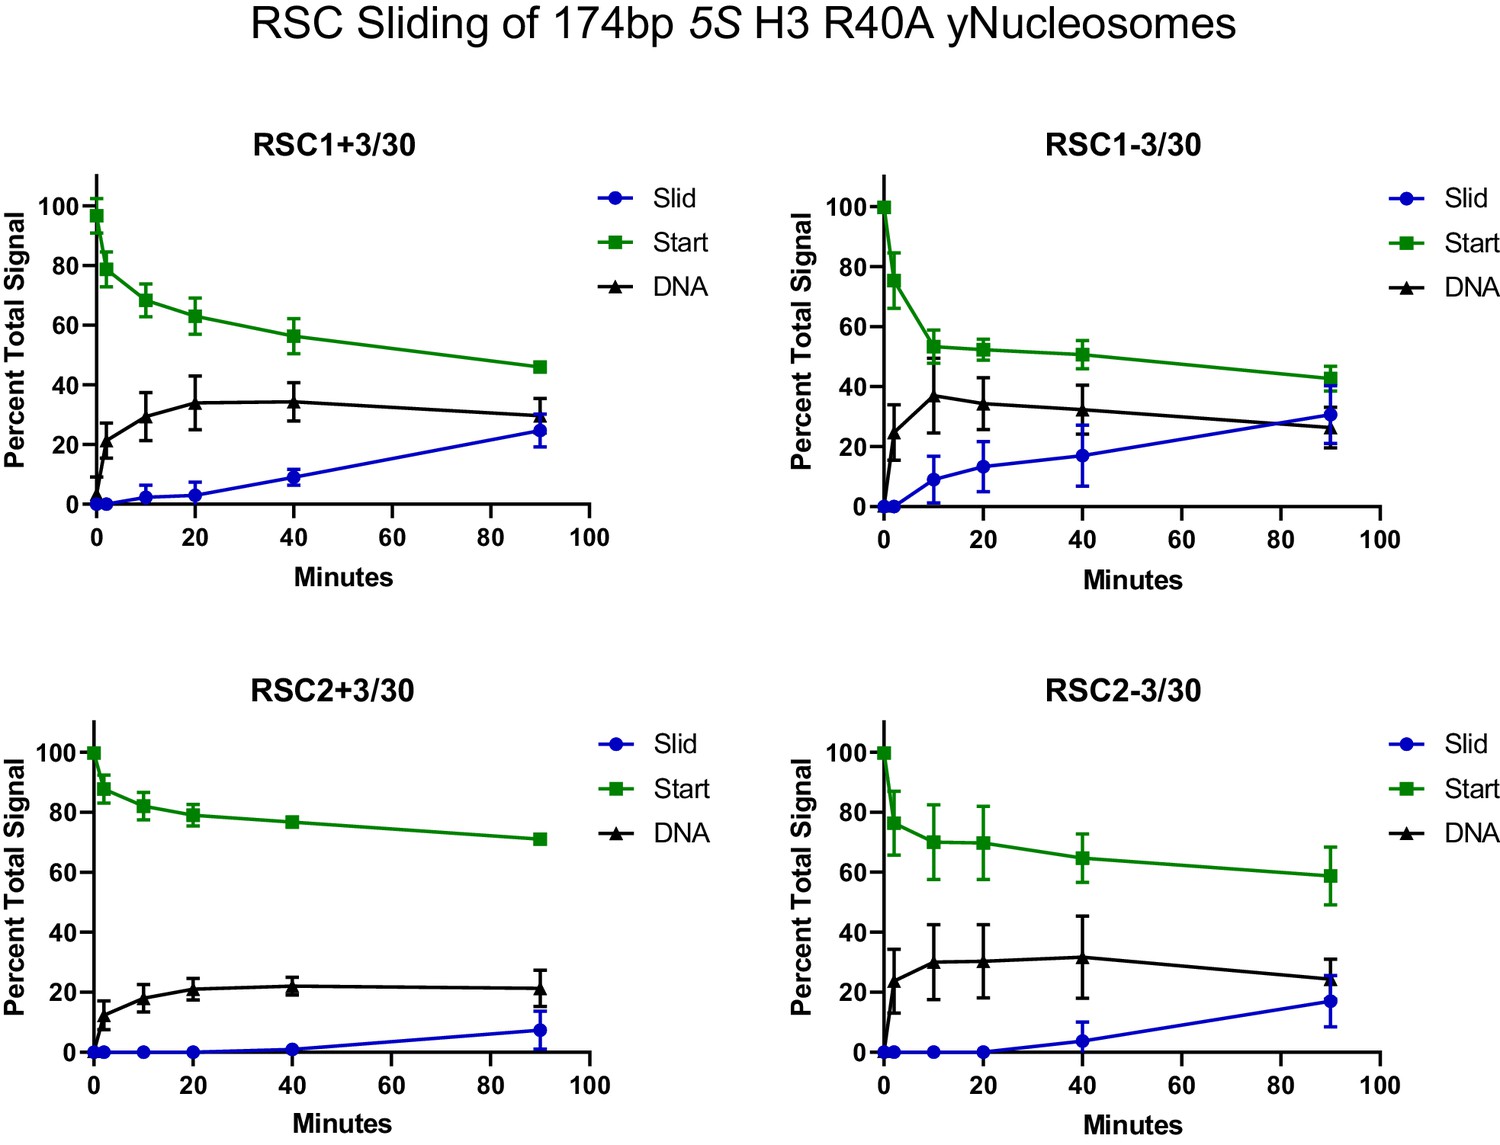
Quantification of RSC sliding 174 bp 5S H3 R40A yeast mononucleosomes as conducted in Figure 3E.
Mean and standard deviation for three replicates.
-
Figure 3—figure supplement 3—source data 1
Quantification of RSC sliding 5S R40A yNucs.
- https://cdn.elifesciences.org/articles/58130/elife-58130-fig3-figsupp3-data1-v2.zip
Figure 3—figure supplement 4

RSC1 and RSC2 complexes bind similarly to 174 bp sea urchin 5S yeast mononucleosomes with the H3 R40A mutation.
Nucleosomes (20 nM) were incubated with 0, 30, or 60 nM RSC for 20 min at 30°C, run on a 3.8% native polyacrylamide gel, and stained with ethidium bromide. Two technical replicates shown.
Figure 3—figure supplement 5
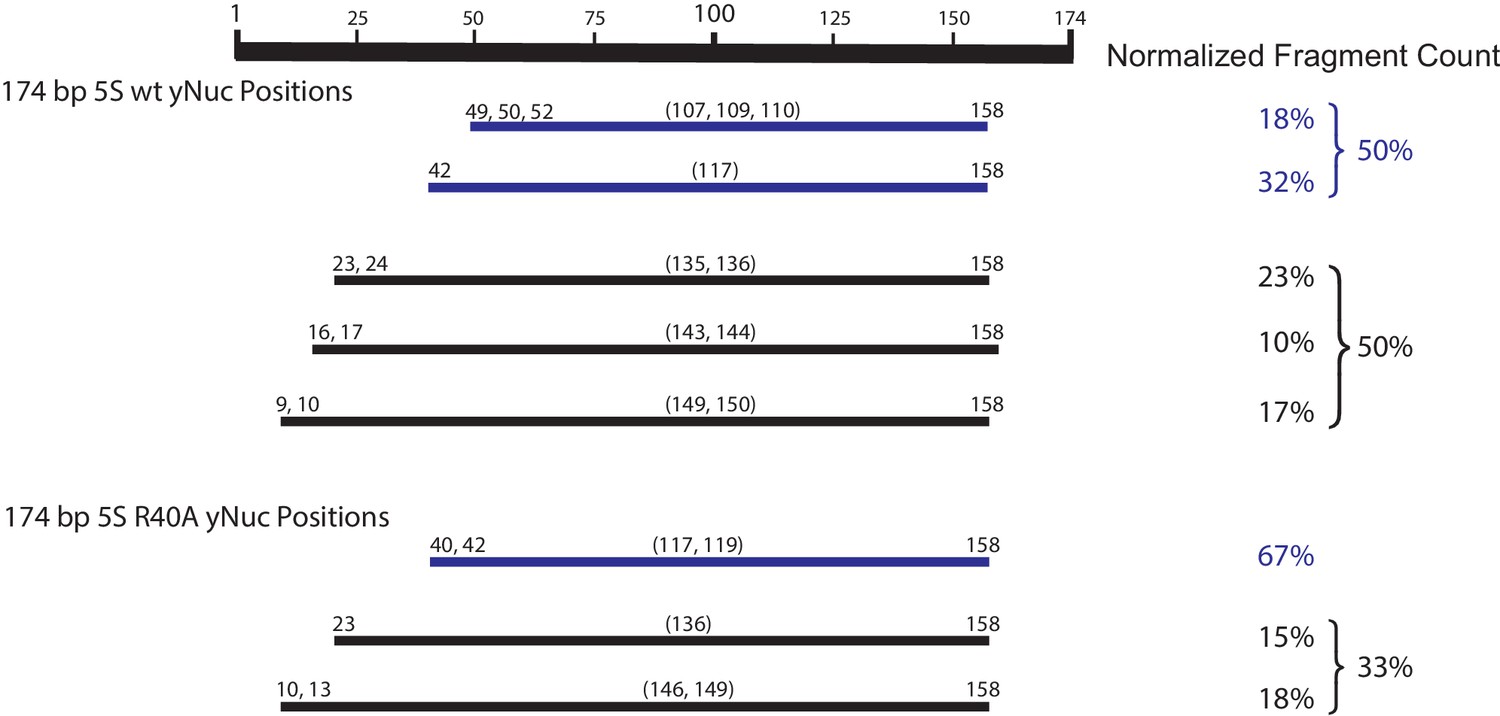
Mapping the positions of the wt and H3 R40A 174 bp sea urchin 5S yeast mononucleosomes.
Nucleosome mapping by ExoIII and S1 treatment followed by paired-end next-generation sequencing. Experiment conducted once. Partially wrapped nucleosome fragments (≤120 bp) are depicted in blue. More fully wrapped nucleosome fragments (≥128 bp) are in black.
-
Figure 3—figure supplement 5—source data 1
174 bp 5S nucleosome mapping.
- https://cdn.elifesciences.org/articles/58130/elife-58130-fig3-figsupp5-data1-v2.xlsx
Figure 4 with 6 supplements
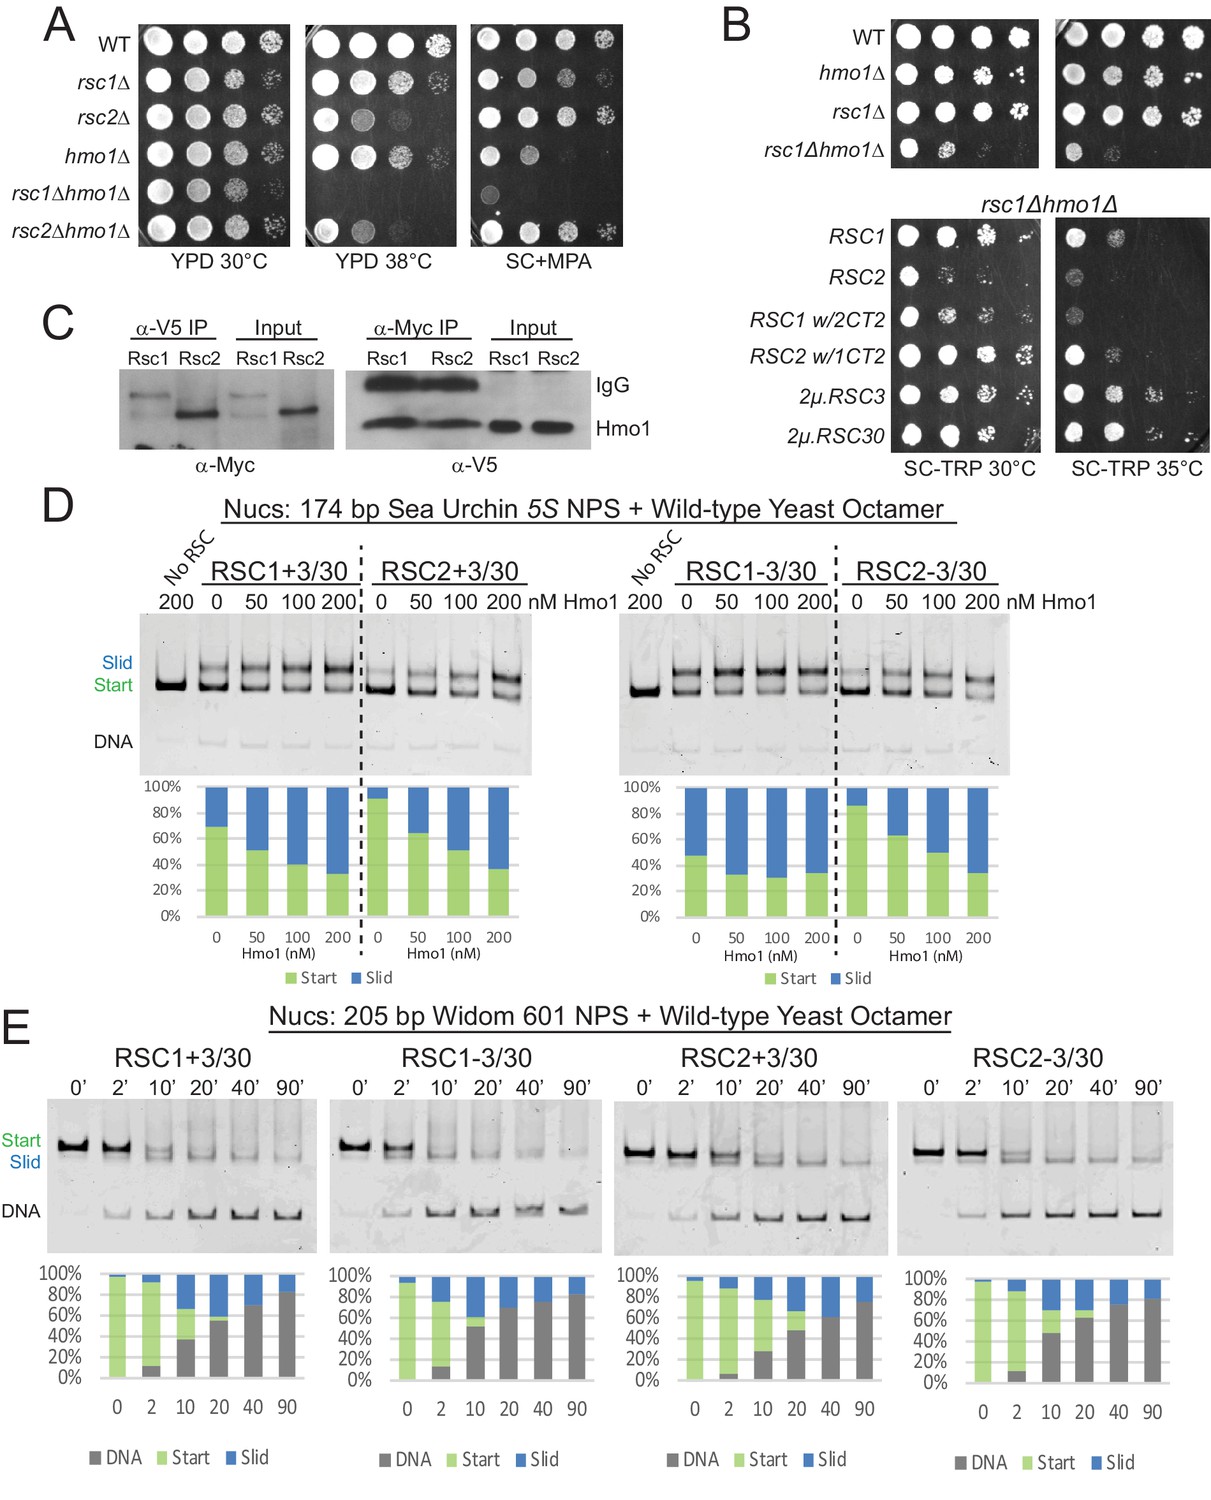
Hmo1 cooperates with RSC to remodel fragile or partially-unwrapped nucleosomes.
(A) An hmo1 null mutation is synthetically sick with rsc1Δ, but not rsc2Δ. WT (YBC604), rsc1Δ (YBC774), rsc2Δ (YBC82), hmo1Δ (YBC3509), rsc1∆ (YBC774), rsc2Δ (YBC82), rsc1Δ hmo1Δ (YBC3514), rsc2∆ hmo1∆ (YBC3515) spotted as 10x serial dilutions to YPD 30°C, YPD 38°C, and SC+20 µg/ml mycophenolic acid (MPA). One of two or more biological replicates shown. (B) The rsc1Δ hmo1Δ synthetic sickness is suppressed by high copy RSC3, RSC30, or RSC1 CT2. Strain rsc1∆ hmo1∆ (YBC3514) transformed with TRP1-marked RSC1 (p609), RSC2 (p604), RSC1 w/2CT2 (p3097), RSC2 w/1CT2 (p3098), 2µ.RSC3 (p929), 2µ.RSC30 (p911), or vector (pRS314) spotted as 10x serial dilutions to SC-TRP 30°C or SC-TRP 35°C. One of four biological replicates shown. (C) Co-IP of Rsc1 and Rsc2 with Hmo1. Sonicated chromatin extracts from RSC1.9XMYC HMO1.V5 (YBC3558) and RSC2.9XMYC HMO1.V5 (YBC3559) were immunoprecipitated using anti-Myc or anti-V5. Western blots were probed with anti-Myc or anti-V5 antibodies. One of three biological replicates shown. (D) Comparative sliding by RSC1 and RSC2 complexes (10 nM) of 174 bp sea urchin 5S yeast mononucleosomes (20 nM) pre-incubated with increasing concentrations of Hmo1 protein. Reactions were conducted at 30°C for 20 min. The Start (green) and Slid (blue) bands were quantified and reported as percent of the total signal. The free DNA band was negligible and not quantified. (E) Comparative sliding and ejection of Widom 601 yeast mononucleosomes (20 nM) by RSC1 and RSC2 complexes (10 nM). The nucleosomal Start (green), Slid (blue), and free DNA (grey) bands were quantified and reported as a percent of the total signal.
-
Figure 4—source data 1
Hmo1 enhances RSC sliding.
- https://cdn.elifesciences.org/articles/58130/elife-58130-fig4-data1-v2.zip
-
Figure 4—source data 2
RSC slides 601 wt yNucs.
- https://cdn.elifesciences.org/articles/58130/elife-58130-fig4-data2-v2.xls
Figure 4—figure supplement 1
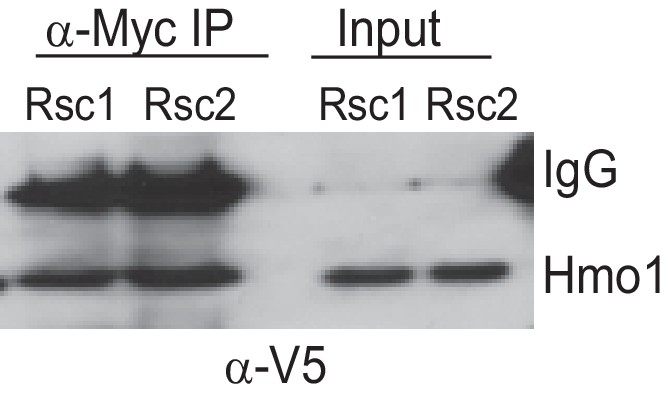
Co-Immunoprecipitation of Rsc1 and Rsc2 with Hmo1 from MNase-treated chromatin extracts.
RSC1.9XMYC HMO1.V5 (YBC3558) and RSC2.9XMYC HMO1.V5 (YBC3559) were immunoprecipitated using anti-Myc bound dynabeads. 100% of Co-IP and 5% of input were loaded on the gel. Western blots were probed with anti-V5 antibody. One of three biological replicates shown.
Figure 4—figure supplement 2
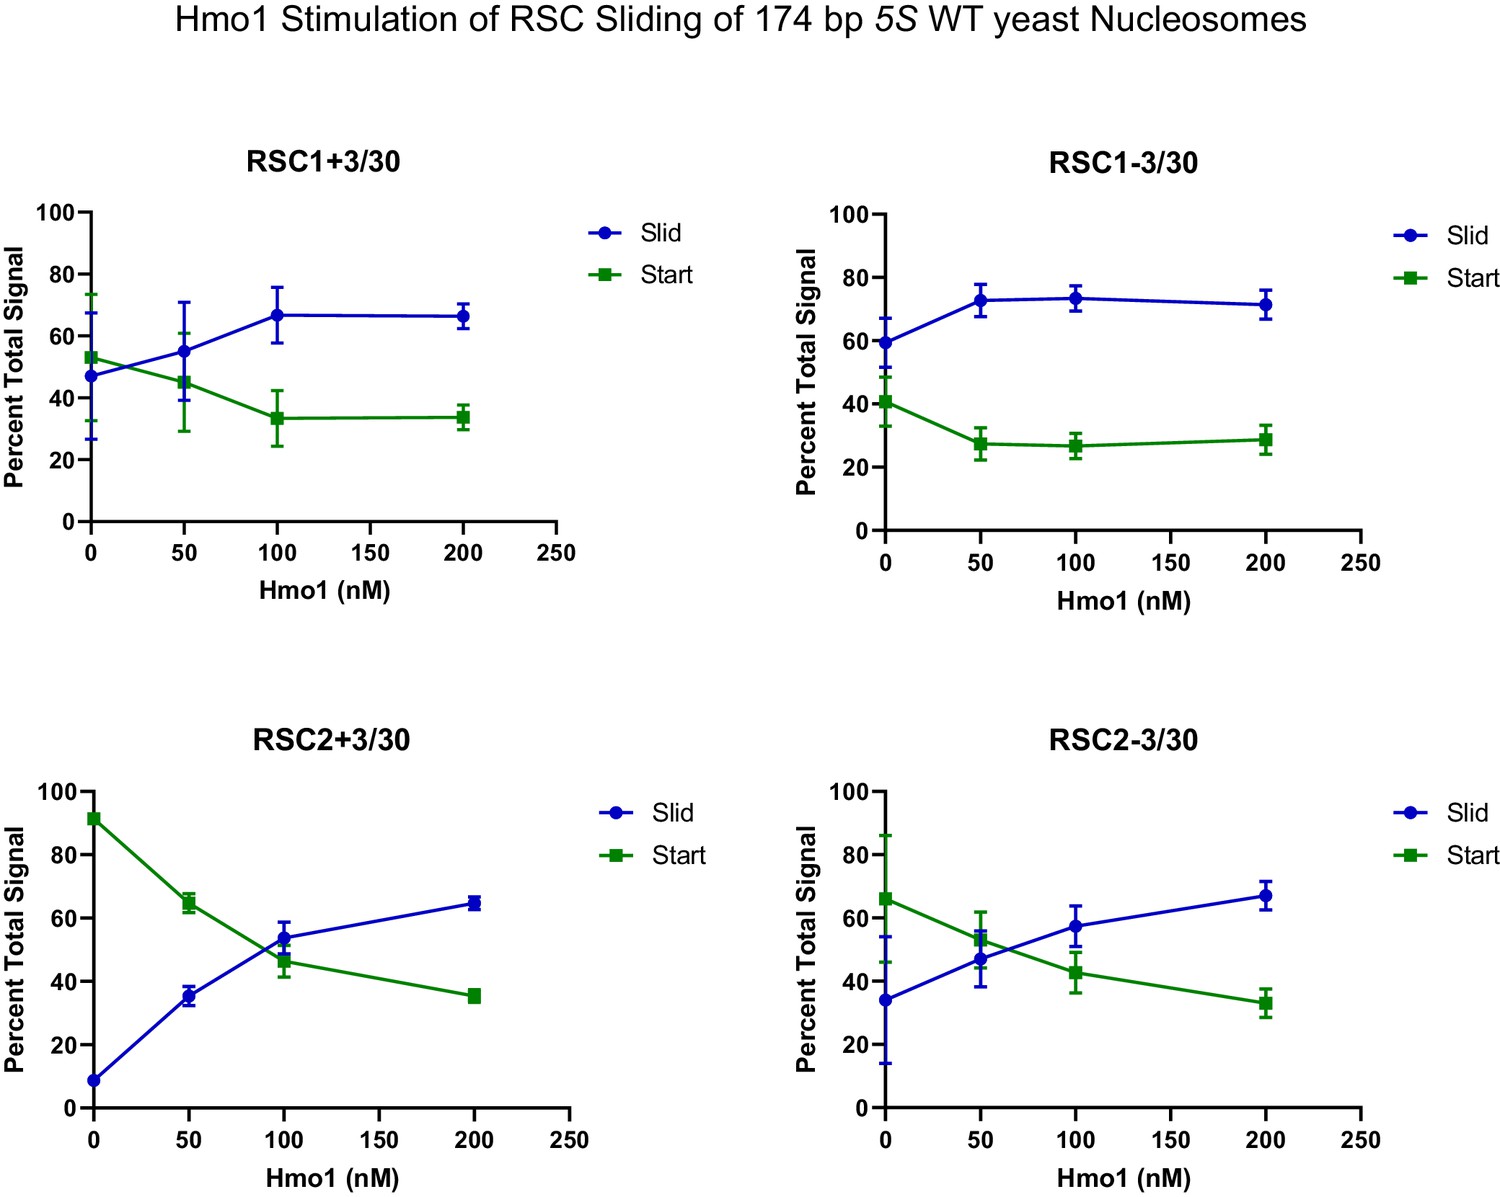
Quantification of Hmo1 stimulation of RSC sliding 174 bp 5S wild-type yeast mononucleosomes as conducted in Figure 4D.
Mean and standard deviation for three replicates.
-
Figure 4—figure supplement 2—source data 1
Hmo1 stimulates 10 nM RSC sliding of 5S yNucs.
- https://cdn.elifesciences.org/articles/58130/elife-58130-fig4-figsupp2-data1-v2.zip
Figure 4—figure supplement 3
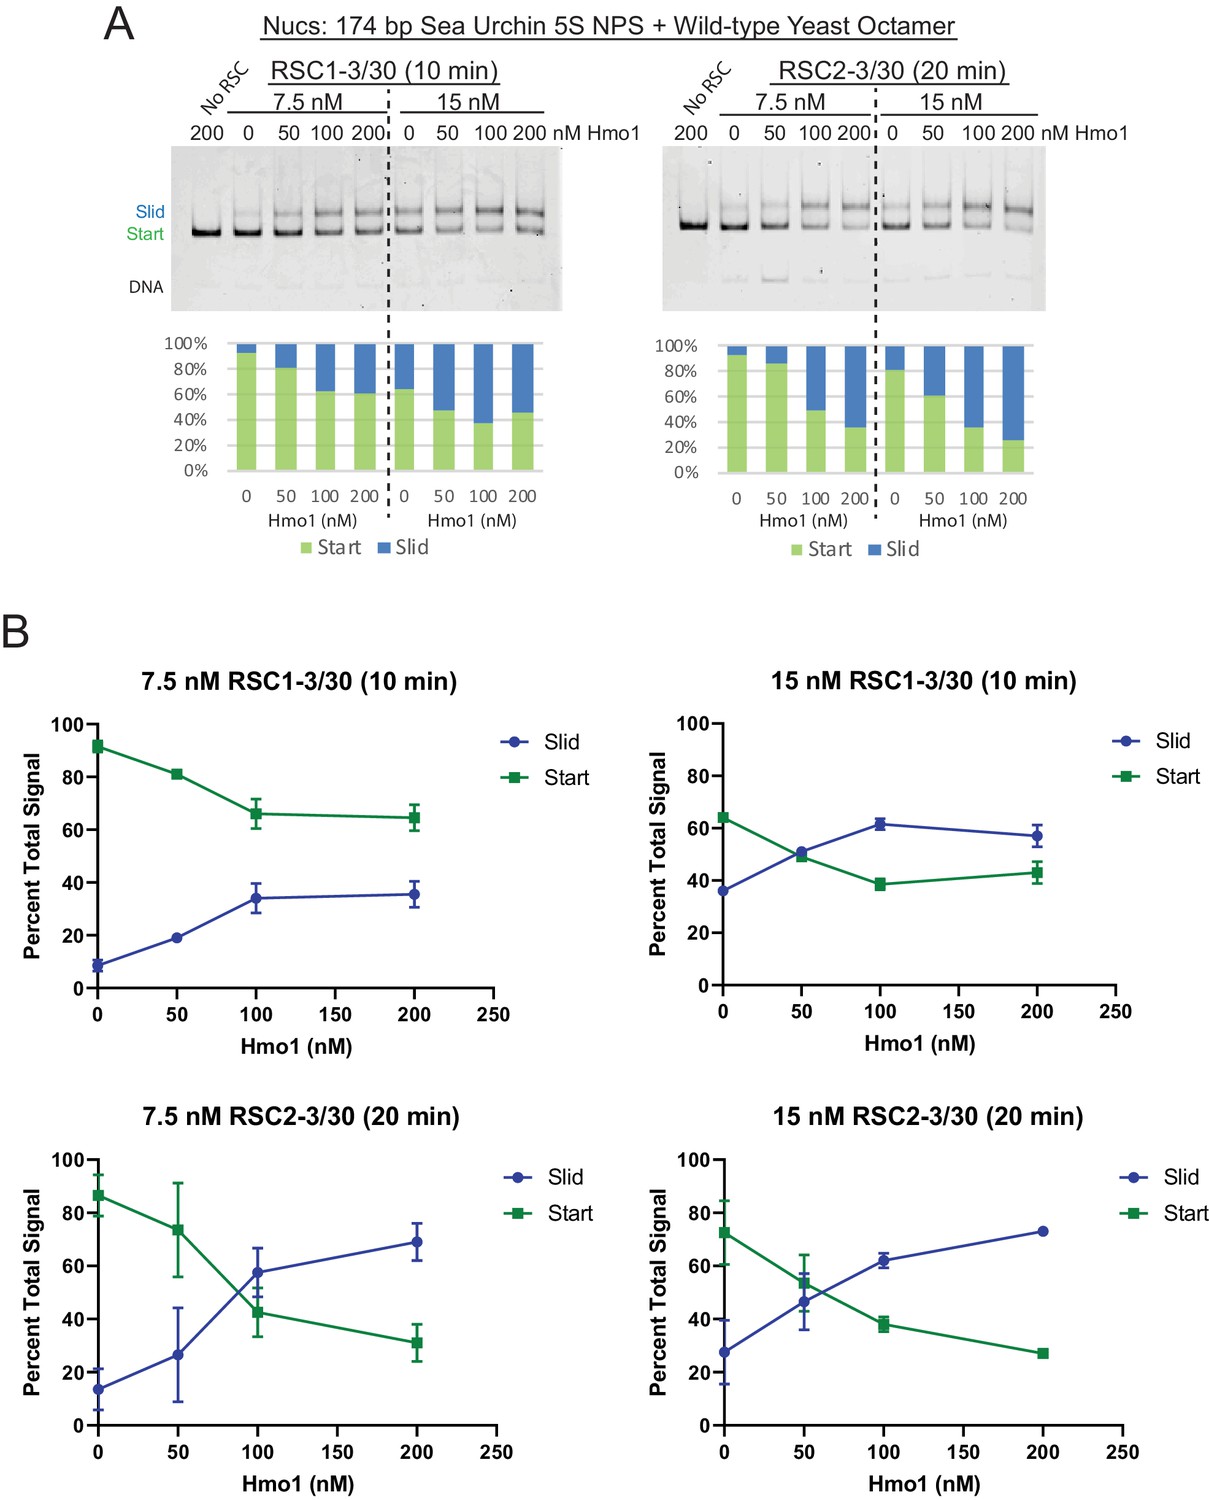
Additional sliding assays and quantification of 174 bp 5S yeast mononucleosomes with RSC and Hmo1.
(A) 174 bp 5S yeast mononucleosomes (20 nM) were pre-incubated with increasing concentrations of Hmo1. RSC concentrations and reaction times are as indicated. All reactions were conducted at 30°C. The Start (green) and Slid (blue) bands were quantified and reported as percent of the total signal. The free DNA band was negligible and not quantified. (B) Quantification of Hmo1 stimulation of RSC sliding 174 bp 5S wild-type yeast mononucleosomes. Mean and standard deviation for two replicates.
-
Figure 4—figure supplement 3—source data 1
Additional Hmo1 stimulation of RSC 5S sliding.
- https://cdn.elifesciences.org/articles/58130/elife-58130-fig4-figsupp3-data1-v2.xls
-
Figure 4—figure supplement 3—source data 2
Quantification of additional Hmo1 stimulation of RSC 5S sliding.
- https://cdn.elifesciences.org/articles/58130/elife-58130-fig4-figsupp3-data2-v2.zip
Figure 4—figure supplement 4

Quantification of RSC sliding 205 bp Widom 601 wild-type yeast mononucleosomes as conducted in Figure 4E.
Mean and standard deviation for three replicates.
-
Figure 4—figure supplement 4—source data 1
Quantification of RSC sliding 601.
- https://cdn.elifesciences.org/articles/58130/elife-58130-fig4-figsupp4-data1-v2.zip
Figure 4—figure supplement 5
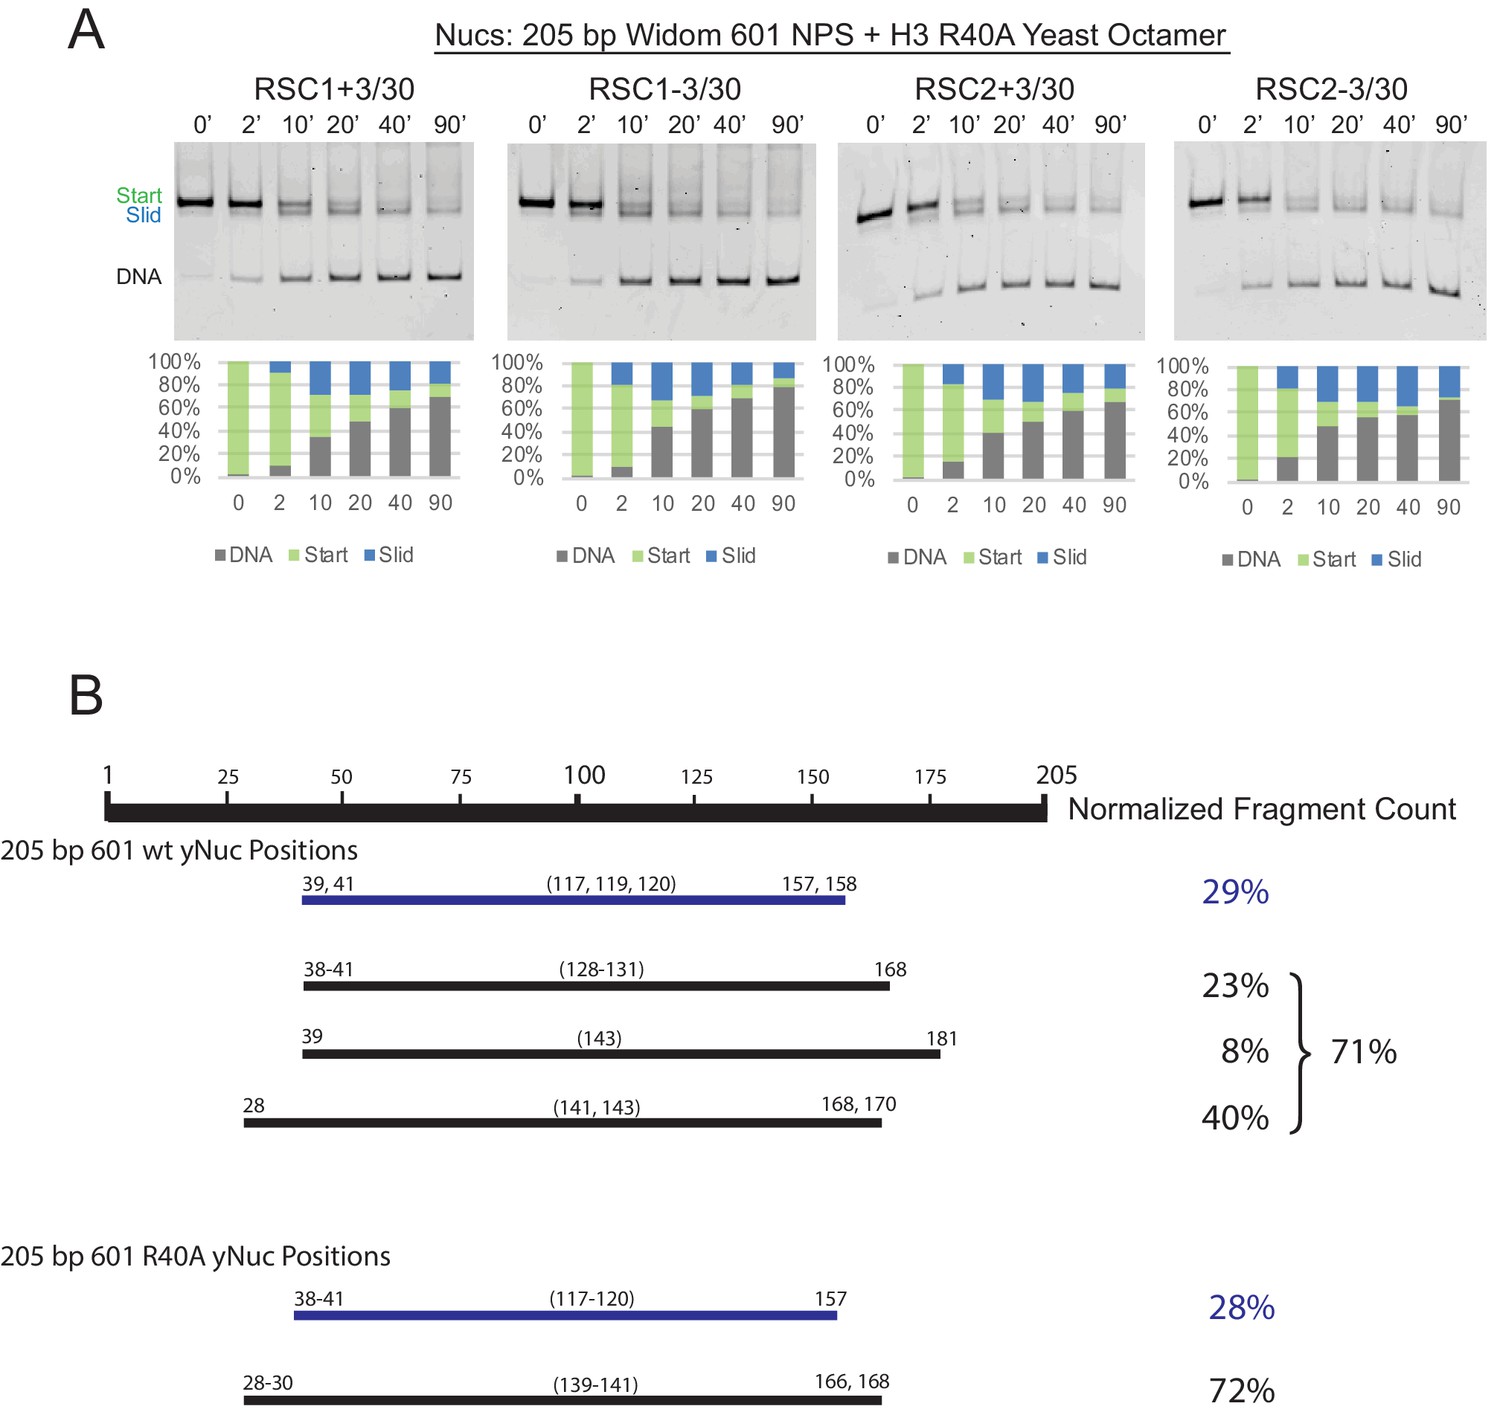
RSC1 and RSC2 slide Widom 601 H3 R40A mononucleosomes similarly.
(A) Comparative sliding of RSC1 and RSC2 complexes (10 nM) on H3 R40A 205 bp Widom 601 yeast mononucleosomes (20 nM). The nucleosomal Start (green), Slid (blue), and free DNA (grey) bands were quantified and reported as a percent of the total signal. (B) Mapping the positions of the wild-type and H3 R40A 205 bp Widom 601 yeast mononucleosomes by ExoIII and S1 treatment as in Figure 3—figure supplement 3. Partially unwrapped nucleosome fragments (≤120 bp) are depicted in blue. More fully wrapped nucleosome fragments (≥128 bp) are in black. Averages from two technical replicates.
-
Figure 4—figure supplement 5—source data 1
RSC slides 601 R40A yNuc.
- https://cdn.elifesciences.org/articles/58130/elife-58130-fig4-figsupp5-data1-v2.xls
-
Figure 4—figure supplement 5—source data 2
205 bp Widom 601 nucleosome mapping.
- https://cdn.elifesciences.org/articles/58130/elife-58130-fig4-figsupp5-data2-v2.xlsx
Figure 4—figure supplement 6
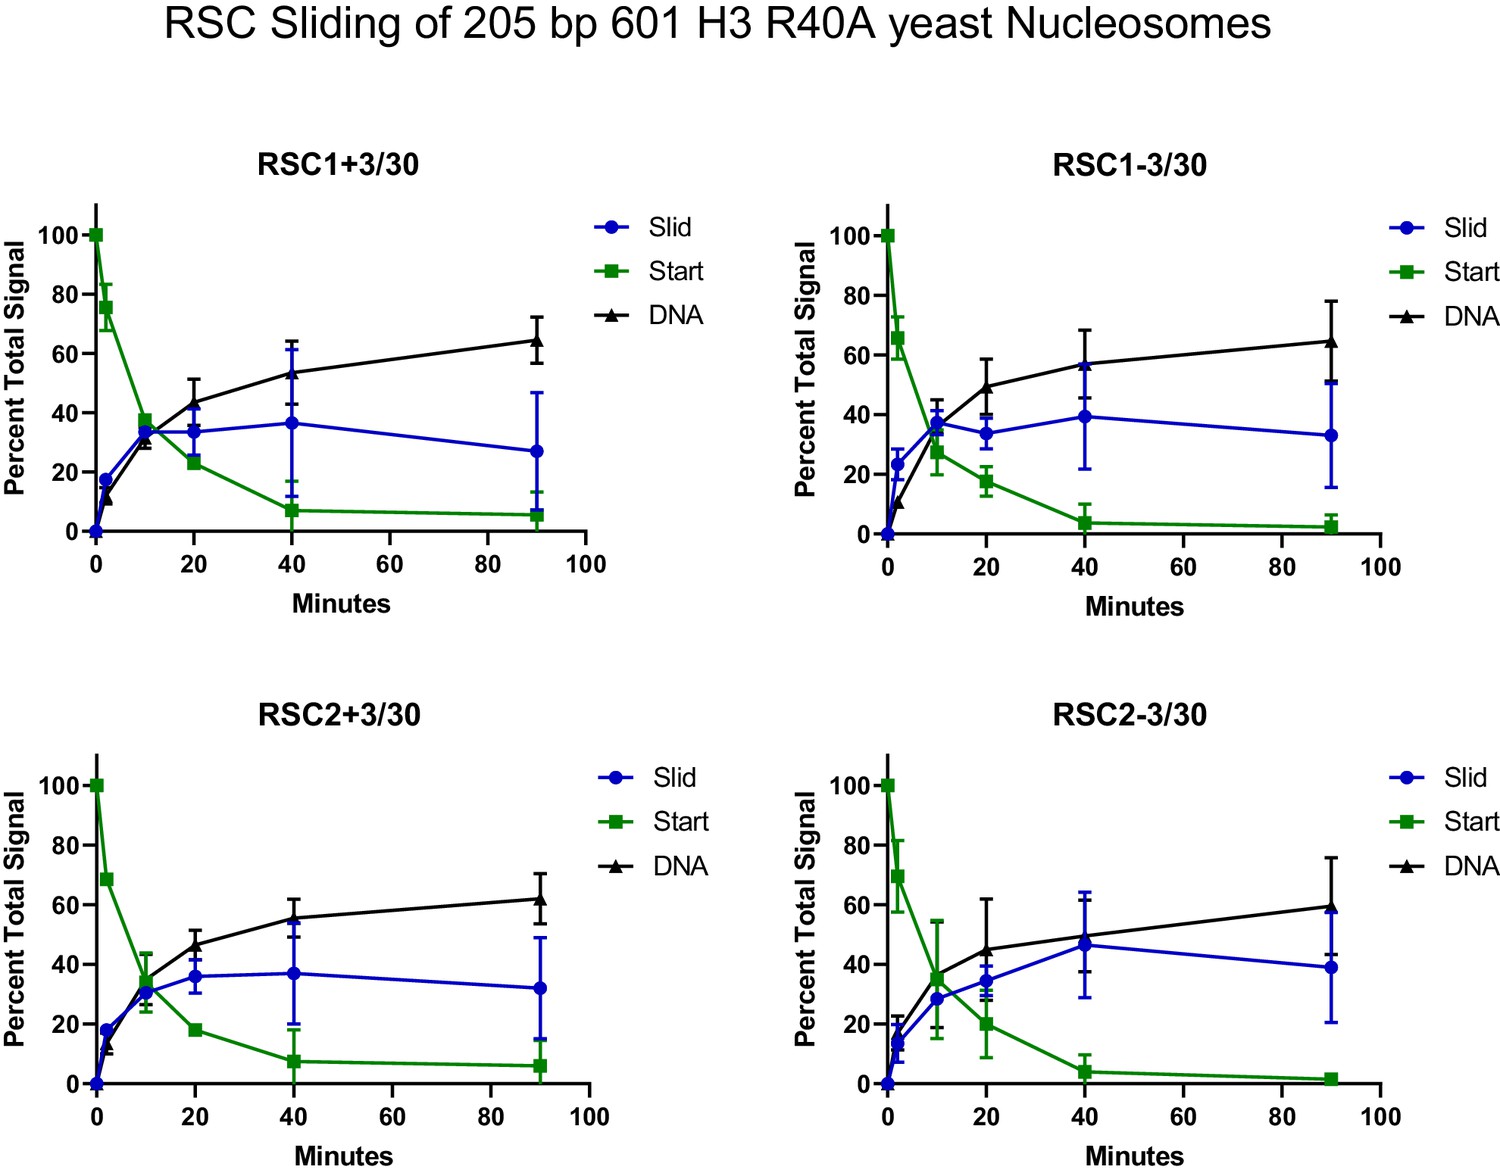
Quantification of RSC sliding 205 bp Widom 601 H3 R40A yeast mononucleosomes as conducted in Figure 4—figure supplement 5A.
Mean and standard deviation for two replicates.
-
Figure 4—figure supplement 6—source data 1
Quantification of RSC sliding R40A 601 yNuc.
- https://cdn.elifesciences.org/articles/58130/elife-58130-fig4-figsupp6-data1-v2.zip
Figure 5 with 3 supplements
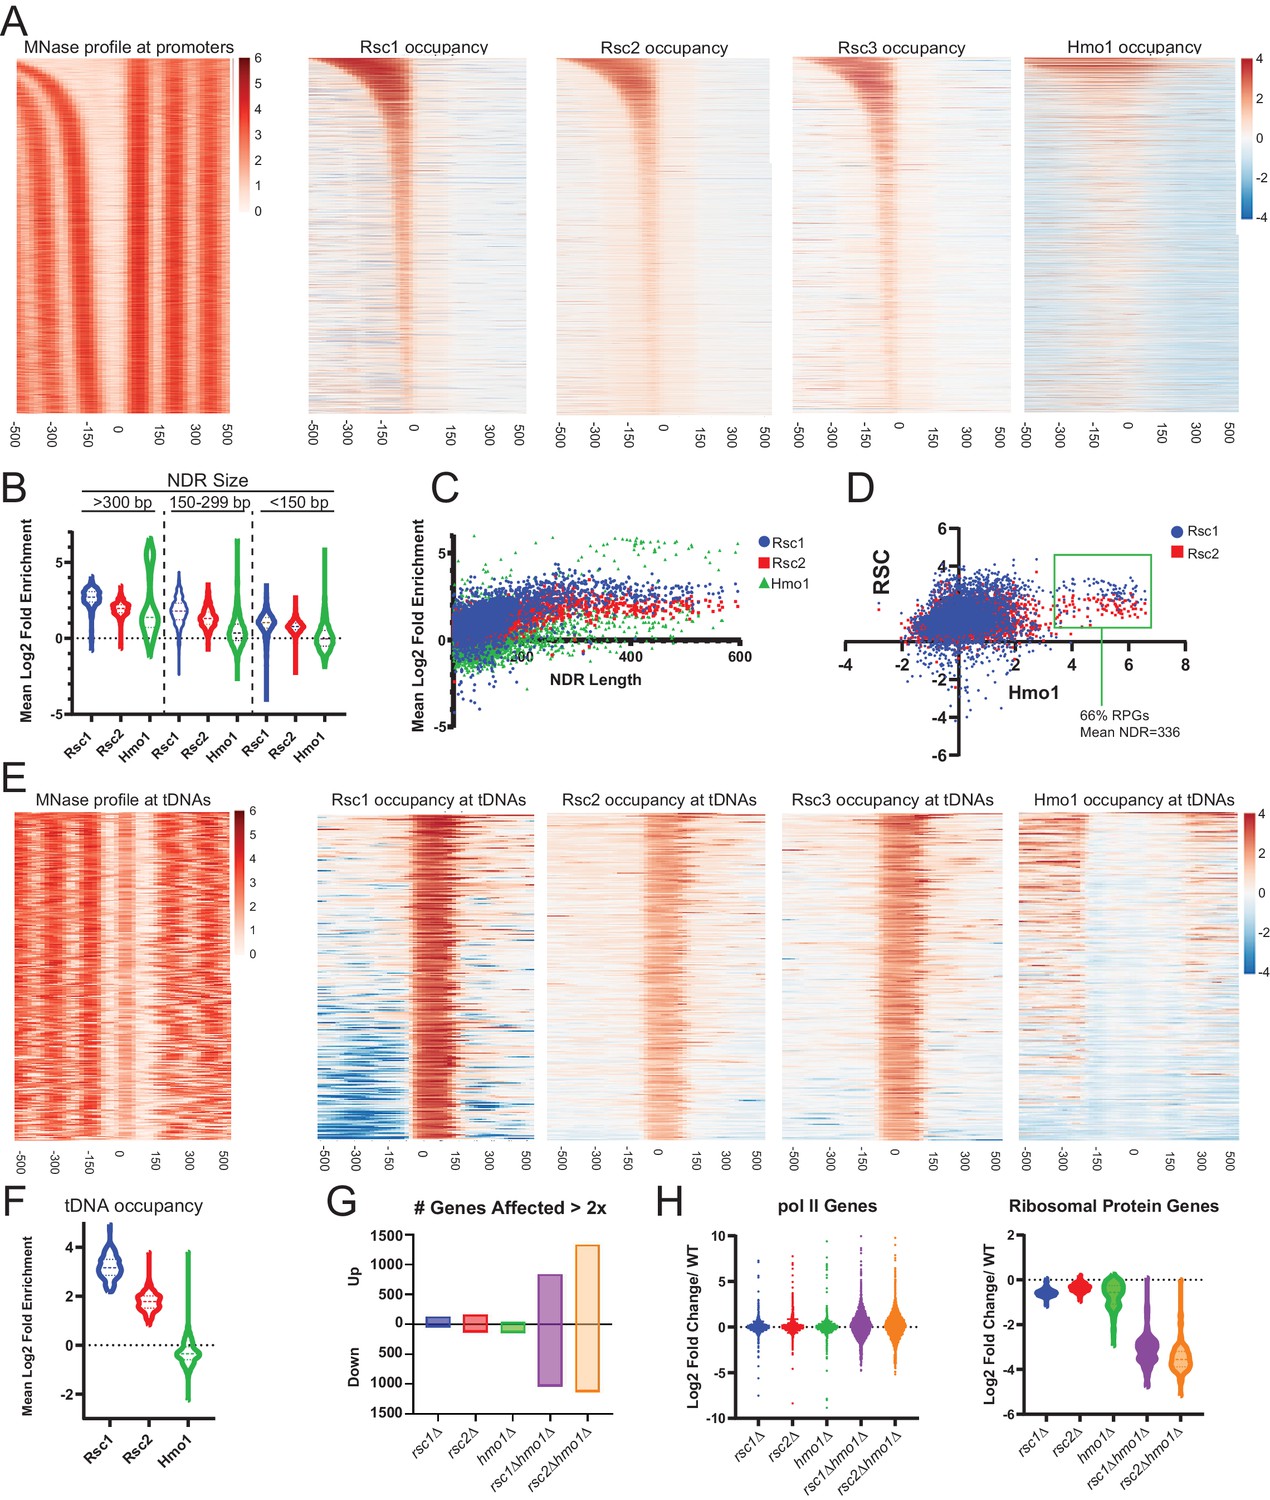
Rsc1 and Rsc2 occupy promoters with wide NDRS, with preferential occupancy of RSC1 at tDNAs.
(A) Heat maps showing enrichment of nucleosomes, Rsc1, Rsc2, Rsc3, and Hmo1 at promoters, sorted by NDR length. (B) Violin plot of Rsc1, Rsc2, and Hmo1 occupancy at promoters at three categories of NDR length. (C) Plot of Rsc1, Rsc2, and Hmo1 occupancy compared to NDR length. (D) Plot of Rsc1 and Rsc2 enrichment by Hmo1 occupancy. (E) Heat maps showing enrichment of nucleosomes, Rsc1, Rsc2, Rsc3, and Hmo1 at all tDNAs (tRNA encoding genes). (F) Violin plot of Rsc1, Rsc2, and Hmo1 mean log2 fold enrichment at tDNAs. (G) Number of genes affected by rsc and hmo1 deletions. For each mutation the number of genes up or downregulated two fold or more compared to WT, rsc1Δ (↑129↓45), rsc2Δ (↑160↓129), hmo1Δ (↑44↓132), rsc1∆ hmo1∆ (↑838↓1028), rsc2∆ hmo1∆ (↑1336↓1131). (H) Gene Expression changes. Violin plots of RNA expression for each mutation at all pol II genes (6145 genes) and at ribosomal protein genes (132 genes) as compared to WT expression. ChIP-seq and RNA-seq data shown represents averages of two and three biological replicates, respectively.
-
Figure 5—source data 1
Files for generation of occupancy heat maps.
- https://cdn.elifesciences.org/articles/58130/elife-58130-fig5-data1-v2.zip
-
Figure 5—source data 2
RSC occupancy at promoters and tDNAs.
- https://cdn.elifesciences.org/articles/58130/elife-58130-fig5-data2-v2.xlsx
-
Figure 5—source data 3
Differential gene expression.
- https://cdn.elifesciences.org/articles/58130/elife-58130-fig5-data3-v2.xlsx
Figure 5—figure supplement 1
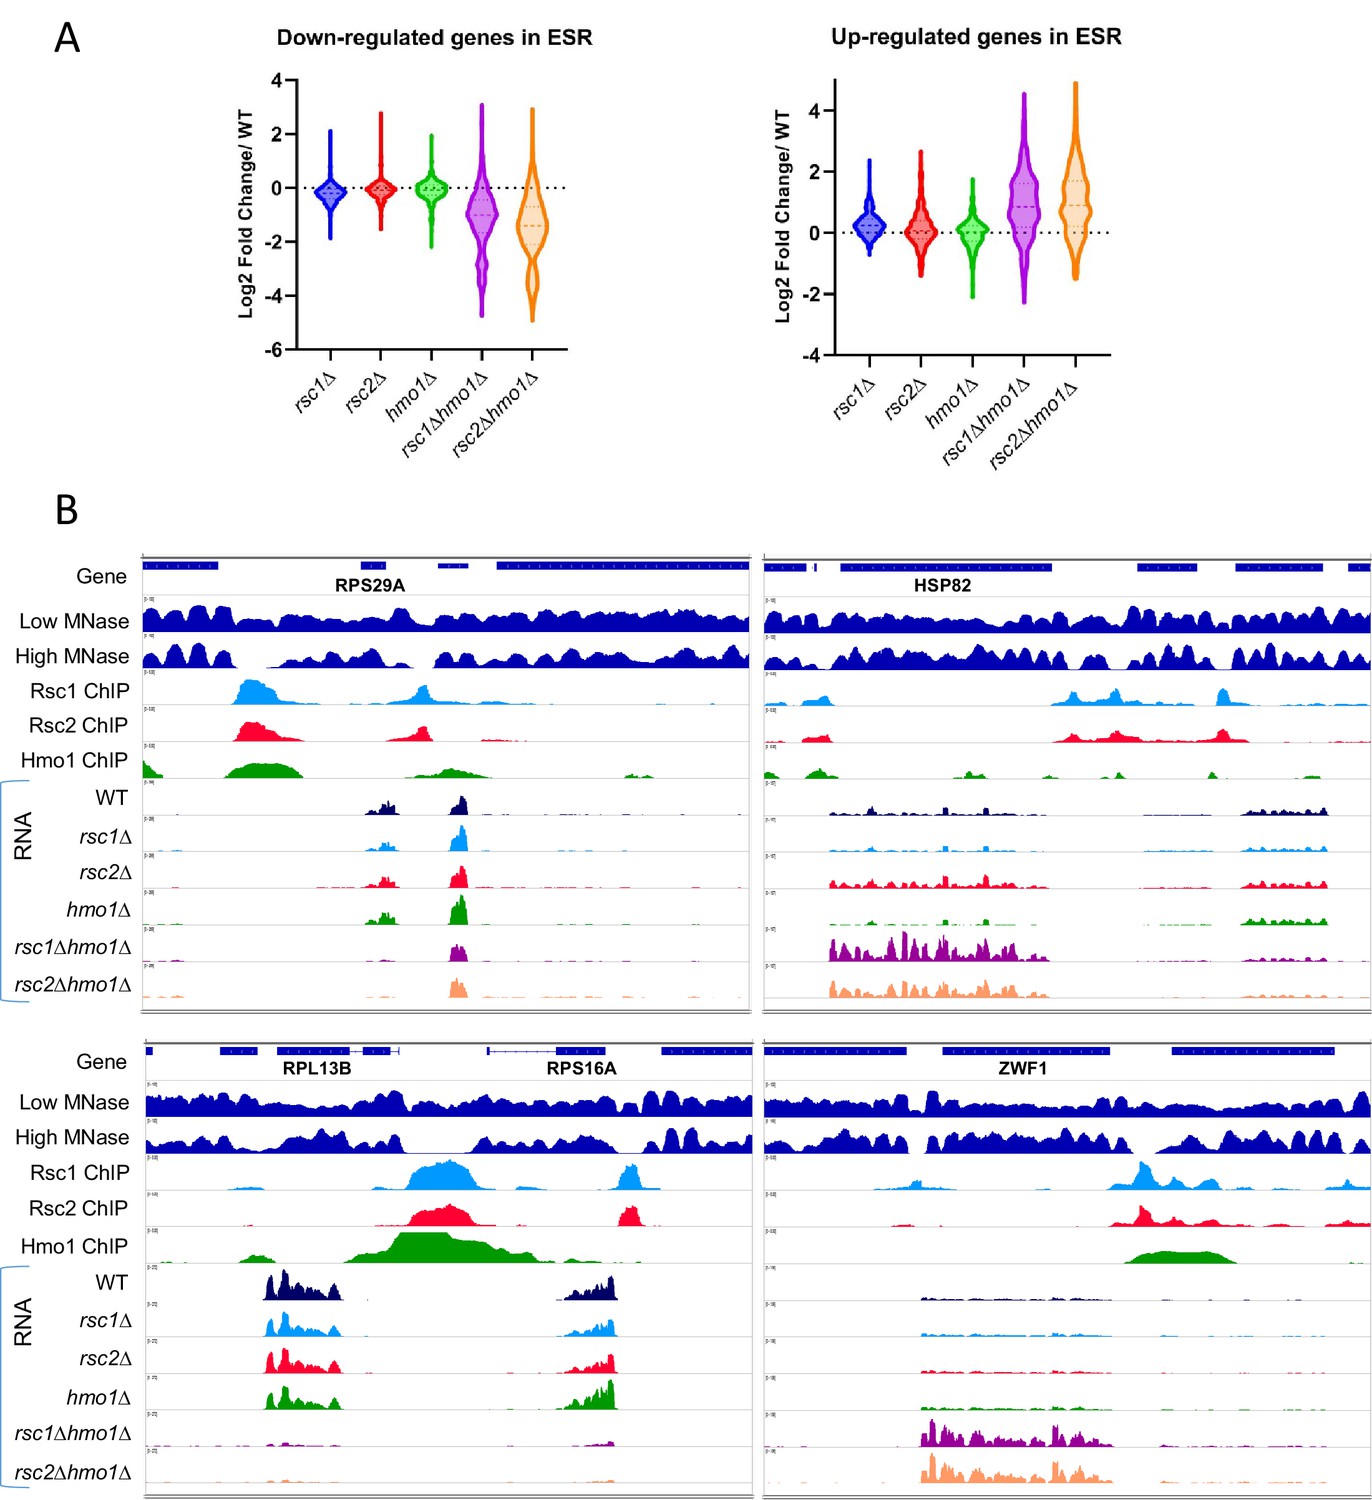
Gene expression changes in rsc1∆, rsc2∆, and hmo1∆ mutants.
(A) The effect of rsc deletions on genes involved in the environmental stress response (ESR). Violin plot showing expression changes (average of three biological replicates) in rsc mutants for genes that are up-regulated (255 genes) or down regulated (587 genes) in the ESR (Gasch et al., 2000). (B) Genome Snapshots. Shown for select genes are low- (GSM1891202) and high- (GSM1891207) MNase digested fragment coverage from Kubik et al., 2015, Rsc1 and Rsc2 ChIP Seq log2 fold enrichments, Hmo1 ChIP Seq log2 fold enrichment (GSM1509041) from Knight et al., 2014, RNASeq coverage (unstranded) from an average of three biological replicates of RNAseq for WT(YBC604), rsc1∆ (YBC774), rsc2∆ (YBC82), hmo1∆ (YBC3509), rsc1∆ hmo1∆ (YBC3514), rsc2∆ hmo1∆ (YBC3515).
-
Figure 5—figure supplement 1—source data 1
List of ESR affected genes.
Raw sequencing data is available at NCBI under SRA accession number PRJNA573112.
- https://cdn.elifesciences.org/articles/58130/elife-58130-fig5-figsupp1-data1-v2.xlsx
Figure 5—figure supplement 2
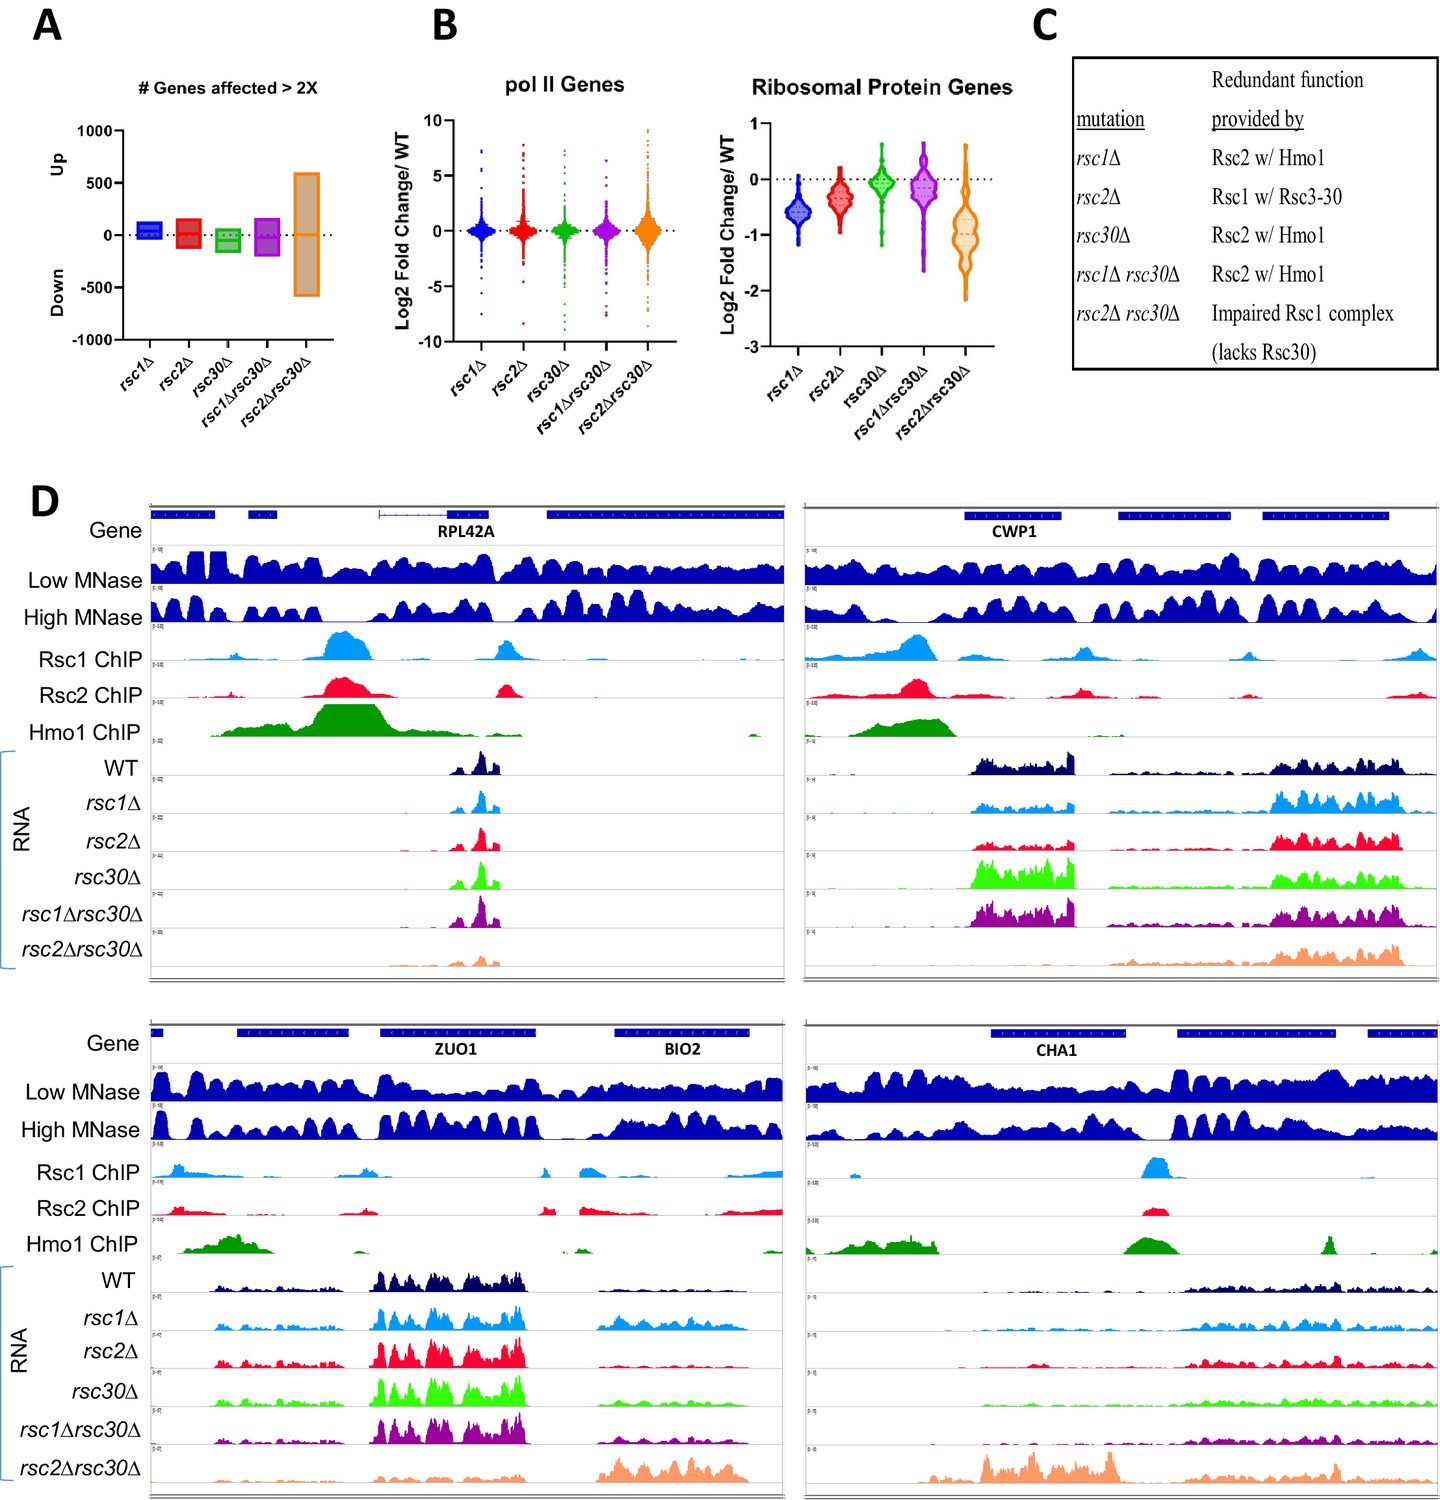
Gene expression changes in rsc1∆, rsc2∆, and rsc30∆ mutants.
(A) Number of genes affected by rsc deletions. For each mutation, the number of genes up or downregulated two fold or more compared to WT. rsc1∆ (↑129↓45), rsc2∆ (↑160↓129), rsc30∆ (↑66↓168), rsc1∆rsc30∆ (↑162↓204), rsc2∆rsc30∆ (↑601↓589). (B) Gene Expression changes. Violin plots showing log2 fold change of RNA in mutants at all pol II genes (6145 genes) and at ribosomal protein genes (132 genes) compared to WT expression. Change in expression reflects an average of three biological replicates, Figure 5—source data 3. (C) Rsc mutation redundancy relationship. (D) Genome snapshots. Shown for select genes are low- (GSM1891202) and high- (GSM1891207) MNase-digested fragment coverage from Kubik et al., 2015, Rsc1 and Rsc2 ChIP seq log2 fold enrichments, Hmo1 ChIP Seq log2 fold enrichments (GSM1509041) from Knight et al., 2014, and RNASeq coverage (unstranded) from an average of three replicates of RNAseq for WT (YBC604), rsc1∆ (YBC774), rsc2∆ (YBC82), rsc30∆ (YBC695), rsc1∆ rsc30∆ (YBC839), and rsc2∆ rsc30∆ (YBC910).
Figure 5—figure supplement 3
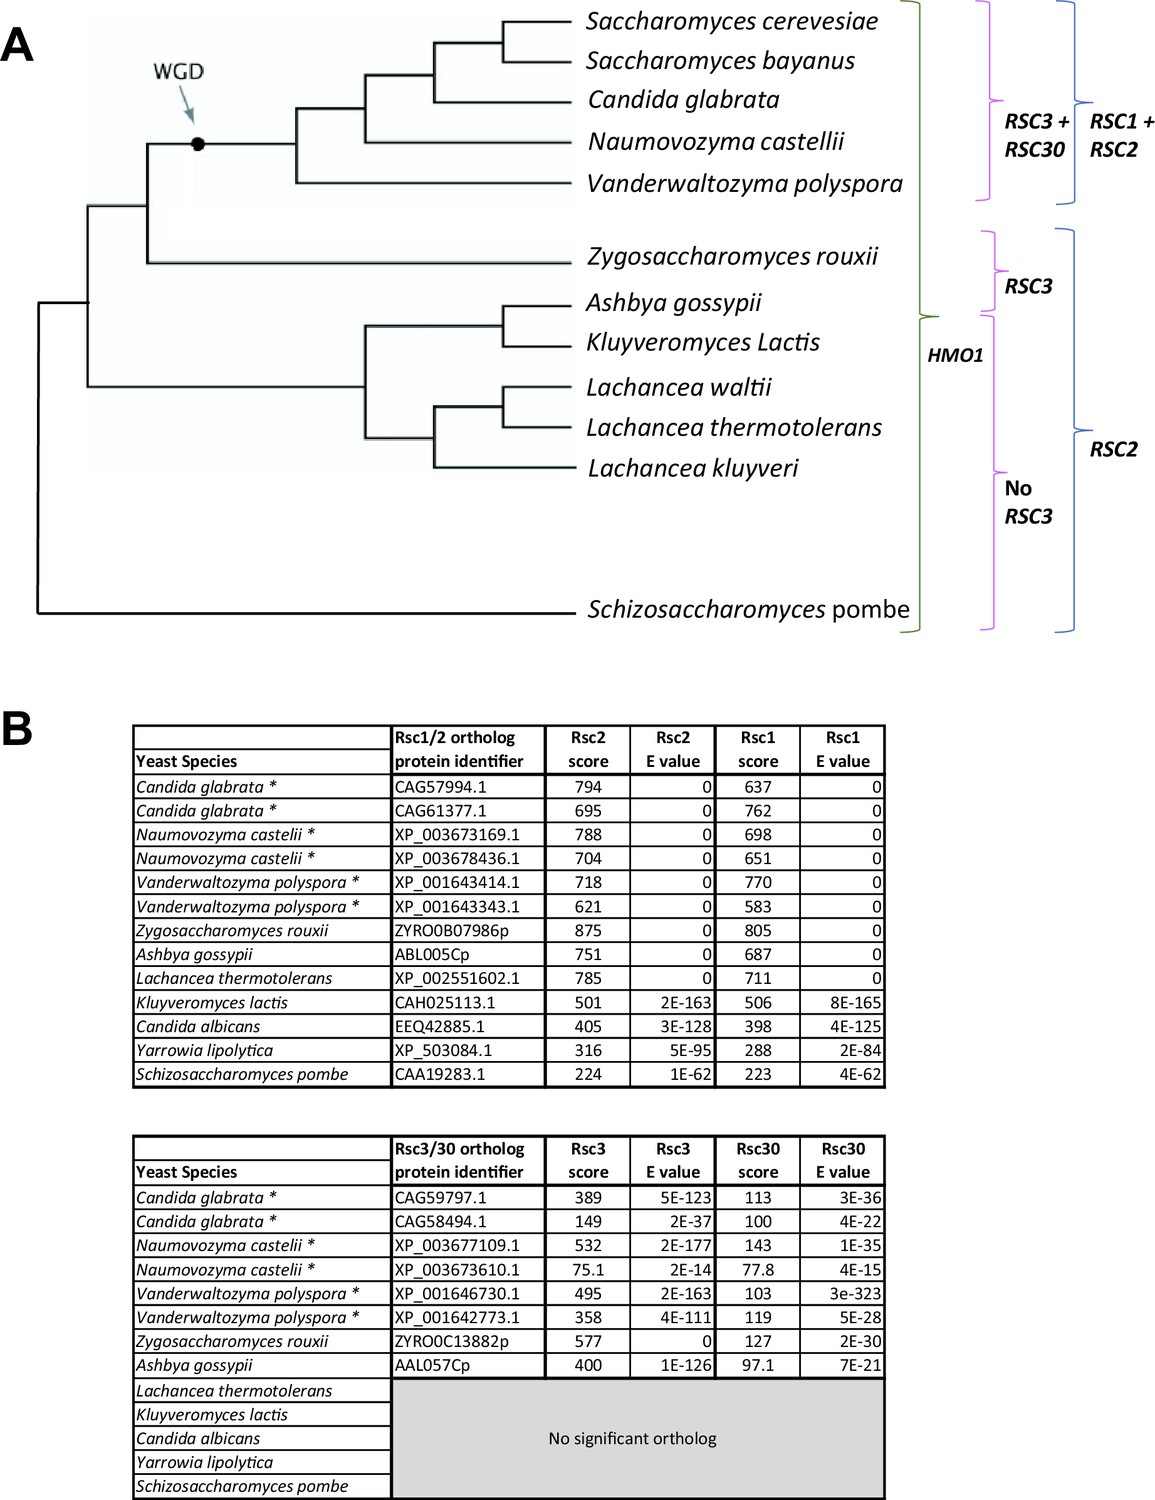
Appearance of RSC1/RSC2 and RSC3/RSC30 in yeast evolution.
(A) Phylogenetic tree adapted from OhÉigeartaigh et al., 2011 with the appearance of RSC1/RSC2, and RSC3/RSC30. WGD refers to whole genome duplication. Duplication of RSC2 and RSC3 resulted in RSC1 and RSC30 in S. cerevisiae. While the duplicated genes in other organisms may still more closely resemble RSC2 or RSC3, RSC1 and RSC30 have been used to indicate the duplicated copy. (B) Scores from NCBI Fungal Blast for RSC1/RSC2 and RSC3/RSC30 orthologs.
Figure 6
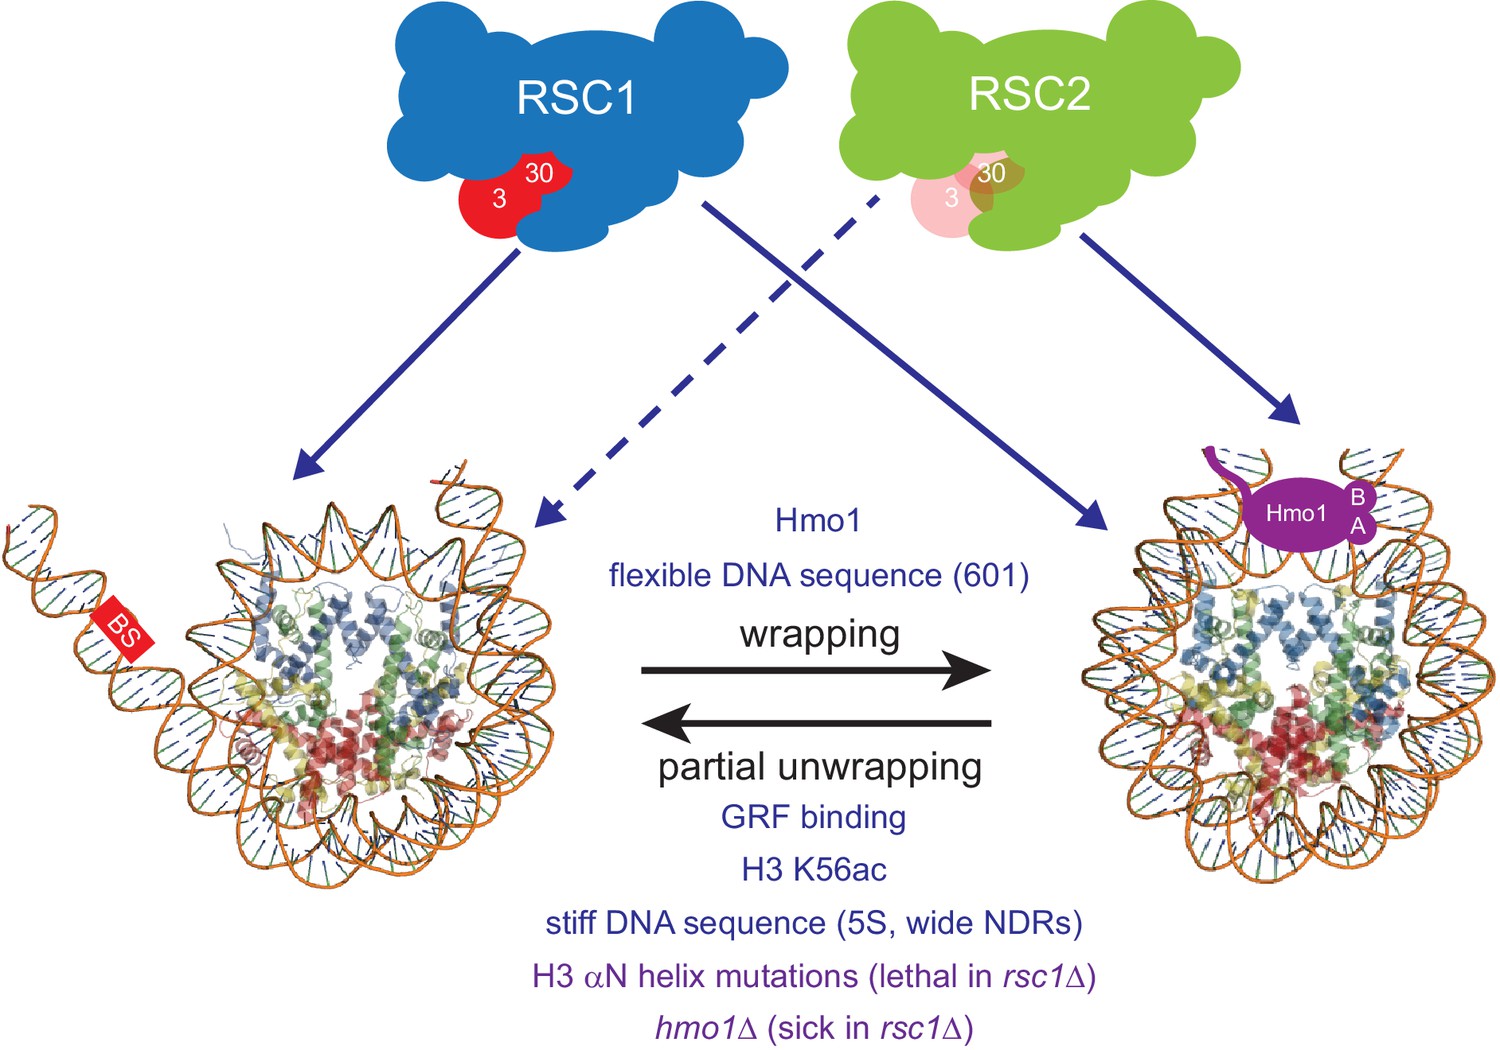
Model for RSC1 and RSC2 action on wrapped versus partially-unwrapped nucleosomes.
Here, flexible/positioning DNA sequences and the protein Hmo1 promote wrapping (Anderson et al., 2002; Iyer, 2012; Panday and Grove, 2017). In contrast, partial unwrapping can be facilitated by ‘stiff’ (AT-rich) DNA sequences, acetylation (e.g., H3 K56ac), the binding of general regulatory transcription factors (not shown) to entry/exit DNA, or by mutation of residues within/near the H3 αN helix (which normally binds entry/exit DNA) (Segal and Widom, 2009; Neumann et al., 2009; Knight et al., 2014; Ferreira et al., 2007). Whereas fully-wrapped nucleosomes are remodeled well by RSC1 or RSC2 complexes, partially-unwrapped nucleosomes are better managed and remodeled by RSC1 complexes.
Tables
Table 1
Summary of Histone H3-H4 screen with rsc1∆ and rsc2∆.
Library of TRP1-marked plasmids containing H3-H4 residues mutated to alanine were transformed into h3-h4Δ [H3-H4.URA3] (YBC1939), rsc1Δ h3-h4Δ [H3-H4.URA3] (YBC2090) or rsc2Δ h3-h4Δ [H3-H4.URA3] (YBC3040), and spotted to SC-TRP, or SC-TRP + 5FOA to force the loss of the WT histone plasmid and test for synthetic lethality. Histone mutations that were lethal on their own in WT RSC are shaded grey, lethal in combination with rsc1Δ are in bold and highlighted yellow, lethal with rsc2Δ are italicized and highlighted in blue, and residues that were lethal with both rsc1Δ and rsc2Δ are highlighted in green.
| H3 | 1 | 2 | 3 | 4 | 5 | 6 | 7 | 8 | 9 | 10 | 11 | 12 |
| A | R2A | T11A | L20A | T32A | R40A | R49A | S57A | L65A | E73A | L82A | L92A | V101A |
| B | T3A | G12A | S22A | G33A | Y41A | E50A | T58A | P66A | I74A | R83A | Q93A | S102A |
| C | K4A | G13A | K23A | G34A | K42A | I51A | E59A | F67A | Q76A | F84A | E94A | L103A |
| D | Q5A | K14A | R26A | V35A | P43A | R52A | L60A | Q68A | D77A | Q85A | S95A | F104A |
| E | T6A | P16A | K27A | K36A | G44A | R53A | L61A | R69A | F78A | S86A | V96A | E105A |
| F | R8A | R17A | S28A | K37A | T45A | F54A | I62A | L70A | K79A | S87A | E97A | D106A |
| G | K9A | K18A | P30A | P38A | V46A | Q55A | R63A | V71A | T80A | I89A | Y99A | T107A |
| H | S10A | Q19A | S31A | H39A | L48A | K56A | K64A | R72A | D81A | G90A | L100A | N108A |
| H3 | 1 | 2 | 3 | 4 | 5 | 6 | 7 | 8 | 9 | 10 | 11 | 12 |
| A | L109A | Q120A | R129A | |||||||||
| B | I112A | K121A | L130A | |||||||||
| C | H113A | K122A | R131A | |||||||||
| D | K115A | D123A | G132A | |||||||||
| E | R116A | I124A | E133A | |||||||||
| F | V117A | K125A | R134A | |||||||||
| G | T118A | L126A | S135A | |||||||||
| H | I119A | R128A | ||||||||||
| H4 | 1 | 2 | 3 | 4 | 5 | 6 | 7 | 8 | 9 | 10 | 11 | 12 |
| A | S1A | G9A | H18A | I26A | R35A | K44A | E52A | F61A | S69A | R78A | V86A | R95A |
| B | G2A | L10A | R19A | Q27A | R36A | R45A | E53A | L62A | V70A | K79A | V87A | T96A |
| C | R3A | G11A | K20A | G28A | L37A | I46A | V54A | E63A | T71A | T80A | Y88A | L97A |
| D | G4A | K12A | I21A | I29A | R39A | S47A | R55A | S64A | Y72A | V81A | L90A | Y98A |
| E | K5A | G13A | L22A | T30A | R40A | G48A | V57A | V65A | T73A | T82A | K91A | G99A |
| F | G6A | G14A | R23A | K31A | G41A | L49A | L58A | I66A | E74A | S83A | R92A | F100A |
| G | G7A | K16A | D24A | P32A | G42A | I50A | K59A | R67A | H75A | L84A | Q93A | G101A |
| H | K8A | R17A | N25A | I34A | V43A | Y51A | S60A | D68A | K77A | D85A | G94A | G102A |
| Lethal w/rsc1∆ | Lethal w/rsc2∆ | Lethal w/rsc1∆ and rsc2∆ | Lethal w/WT | |||||||||
Table 2
*DNA end to end FRET measurements on mononucleosomes containing H3 αN helix mutations from Ferreira et al., 2007 with the phenotype when combined with RSC, rsc1∆, or rsc2∆.
| Mutation | * FRET % | Phenotype |
|---|---|---|
| WT | 100 ± 6 | No phenotype |
| R40A | 71 ± 7 | Lethal w/rsc1∆ |
| Y41A | 72 ± 7 | Lethal w/WT |
| K42A | 54 ± 3 | Lethal w/rsc1∆ |
| P43A | 91 ± 3 | No phenotype |
| G44A | 68 ± 9 | Lethal w/rsc1∆ |
| T45A | 52 ± 5 | Lethal w/WT |
| V46A | 89 ± 5 | Lethal w/rsc1∆ |
| L48A | 86 ± 4 | Lethal w/WT |
| R49A | 67 ± 3 | Lethal w/rsc1∆ |
| E50A | 98 ± 6 | No phenotype |
| I51A | 81 ± 13 | Lethal w/WT |
| R52A | 78 ± 3 | Lethal w/rsc1∆ |
| R53A | 80 ± 4 | No phenotype |
| F54A | 96 ± 3 | Lethal w/WT |
| Q55A | 69 ± 11 | Lethal w/WT |
| K56A | 95 ± 4 | No phenotype |
| S57A | 102 ± 5 | No phenotype |
| K56Q | 82 ± 2 | Lethal w/rsc1∆ |
Key resources table
| Reagent type (species) or resource | Designation | Source or reference | Identifiers | Additional information |
|---|---|---|---|---|
| Gene Saccharomyces cerevisiae | Yeast Genome | UCSC | SacCer3 | |
| Strain, strain background (Escherichia coli) | BL21-CodonPlus (DE3)RIL | Agilent | Cat# 230245 | |
| Antibody | Anti-Sth1 (Rabbit polyclonal) | Cairns et al., 1996 | (1:1000) | |
| Antibody | Anti-Rsc3 (Rabbit polyclonal) | Angus-Hill et al., 2001 | (1:1000) | |
| Antibody | Anti-Rsc30 (Rabbit polyclonal) | Angus-Hill et al., 2001 | (1:1000) | |
| Antibody | Anti-Rsc2 (Rabbit polyclonal) | Kasten et al., 2004 | (1:1000) | |
| Antibody | Anti-Rsc4 (Rabbit polyclonal) | Kasten et al., 2004 | (1:1000) | |
| Antibody | Anti-HA (mouse monoclonal) | Cairns et al., 1999 | (1:1000) | |
| Antibody | Anti-Myc (mouse monoclonal) | Abcam | Cat# ab56 RRID:AB_304876 | (1:1000) |
| Antibody | Anti-V5 (mouse monoclonal) | Thermo Scientific | Cat# R960-25 RRID:AB_2556564 | (1:1000) |
| Peptide, recombinant protein | 8XHIS.HMO1 | This paper, Figure 4 | purified from E. coli BL21-CodonPlus(DE3)-RIL cells | |
| Peptide, recombinant protein | Histone H2A, Oregon green, yeast octamers | Xin et al., 2009 | ||
| Peptide, recombinant protein | Histone H3 R40A | This paper, Figure 3 | purified from E. coli BL21-CodonPlus(DE3)-RIL cells | |
| Peptide, recombinant protein | AcTEV protease | Thermo Scientific | Cat# 12575015 | |
| Peptide, recombinant protein | Micrococcal Nuclease | USB | Cat# 70196Y | |
| Peptide, recombinant protein | Exonuclease III | New England Biolabs | Cat# M0206 | |
| Peptide, recombinant protein | S1 nuclease | Thermo Scientific | Cat# 18001–016 | |
| Peptide, recombinant protein | Klenow fragment | New England Biolabs | Cat# M0212L | |
| Commercial assay or kit | NEBNext ChIP-Seq MasterMix Set | New England Biolabs | Cat# E6240L | |
| Commercial assay or kit | RNEasy | Qiagen | Cat# 74106 | |
| Commercial assay or kit | RiboPure RNA purification kit, Yeast | Thermo Scientific | Cat# AM1926 | |
| Commercial assay or kit | TruSeq Stranded Total RNA Library Prep Kit with Ribo Zero Gold | Illumina | Cat# RS-122–2301 | |
| Commercial assay or kit | BioRad protein assay reagent | BioRad | Cat# 500–0006 | |
| Commercial assay or kit | Minelute PCR purification kit | Qiagen | Cat#28006 | |
| Chemical compound, drug | 5-Fluoroorotic Acid (5FOA) | Toronto Research Chemicals | Cat# F59500 | |
| Chemical compound, drug | Mycophenolic Acid (MPA) | Calbiochem | Cat# 475913 | |
| Software, algorithm | Prism | GraphPad Software Inc | RRID:SCR_002798 | Version 8.0.2 |
| Software, algorithm | DESeq2 | Bioconductor | RRID:SCR_015687 | Version 1.21 |
| Software, algorithm | STAR | Dobin et al., 2013 | RRID:SCR_015899 | Version 2.5.4 |
| Software, algorithm | R | R Development Core Team, 2018 | RRID:SCR_001905 | |
| Software, algorithm | pHeatmap | Kolde, 2019 | RRID:SCR_016418 | |
| Software, algorithm | Novoalign | Novocraft | RRID:SCR_014818 | Version 3.8.2 |
| Software, algorithm | UMI Scripts | Huntsman Cancer Institute | See Materials and methods for github link | |
| Software, algorithm | BioToolBox packages | TJ Parnell, Huntsman Cancer Institute | See Materials and methods for github link | |
| Software, algorithm | ImageQuant TL | GE Healthcare | RRID:SCR_018374 | |
| Other | IgG Sepharose Fast Flow | GE Healthcare | Cat# GE 17-0969-01 | |
| Other | Calmodulin Affinity Resin | Agilent | Cat# 214303 | |
| Other | Nickel-NTA Agarose Beads | Qiagen | Cat# 30230 | |
| Other | Slide-A-Lyzer mini dialysis units | Thermo Scientific | Cat# 69560 | |
| Other | Dynabeads Pan Mouse IgG | Thermo Scientific | Cat#11041 |
Additional files
-
Supplementary file 1
Table of yeast strains and their genotypes used in this study.
- https://cdn.elifesciences.org/articles/58130/elife-58130-supp1-v2.xlsx
-
Supplementary file 2
Table of plasmids and DNA sequences used in this study.
- https://cdn.elifesciences.org/articles/58130/elife-58130-supp2-v2.xlsx
-
Transparent reporting form
- https://cdn.elifesciences.org/articles/58130/elife-58130-transrepform-v2.docx
Download links
A two-part list of links to download the article, or parts of the article, in various formats.
Downloads (link to download the article as PDF)
Open citations (links to open the citations from this article in various online reference manager services)
Cite this article (links to download the citations from this article in formats compatible with various reference manager tools)
Specialization of the chromatin remodeler RSC to mobilize partially-unwrapped nucleosomes
eLife 9:e58130.
https://doi.org/10.7554/eLife.58130


