Tracking the movement of discrete gating charges in a voltage-gated potassium channel
- Committee on Neurobiology and Department of Biochemistry and Molecular Biology, University of Chicago, United States
- Centro Interdisciplinario de Neurociencia de Valparaíso, Facultad de Ciencias, Universidad de Valparaíso, United States
Figures
Figure 1 with 1 supplement

The basic principles of qBBr gating charge tracking in time.
(A) Chemical structure of monobromo(trimethylammonio)bimane, a small positively charged (blue) fluorophore with the ability to conjugate to cysteine through a bromide group (yellow). (B) Size comparison of qBBr-Cys (top) to an arginine (bottom) (blue, nitrogen; red, oxygen; sulfur, yellow; gray, carbon). (C) Cartoon schematic of qBBr-tryptophan distance-based quenching with representative fluorescence data for unquenching (top), no effect (center), and quenching (bottom).
Figure 1—figure supplement 1
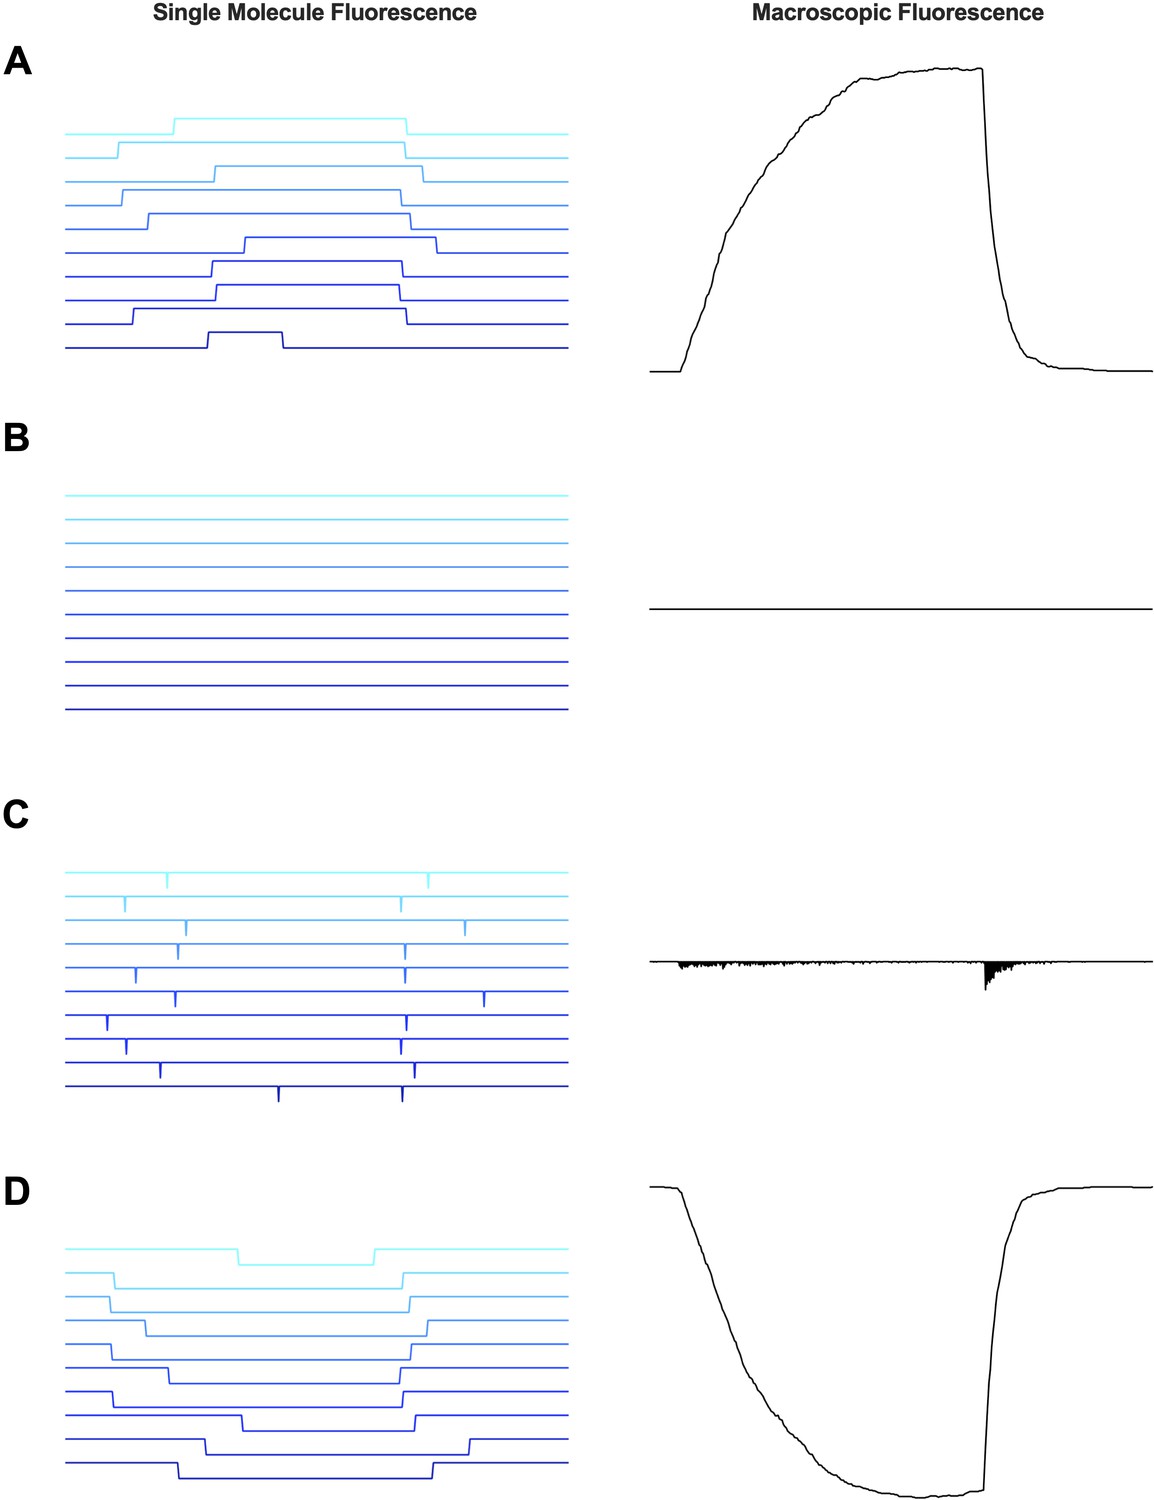
Single molecule fluorescence trace simulations in comparison to macroscopic fluorescence traces.
Simulated fluorescence traces at the single molecule scale (left) and the summed macroscopic fluorescence (right) for the tryptophan placement in an unquenching position (A), when tryptophan is at the peak of the barrier but cannot be detected (B), when tryptophan is at the peak of the barrier in the case of unlimited bandwidth (C) and placement in a quenching position (D).
Figure 2 with 1 supplement
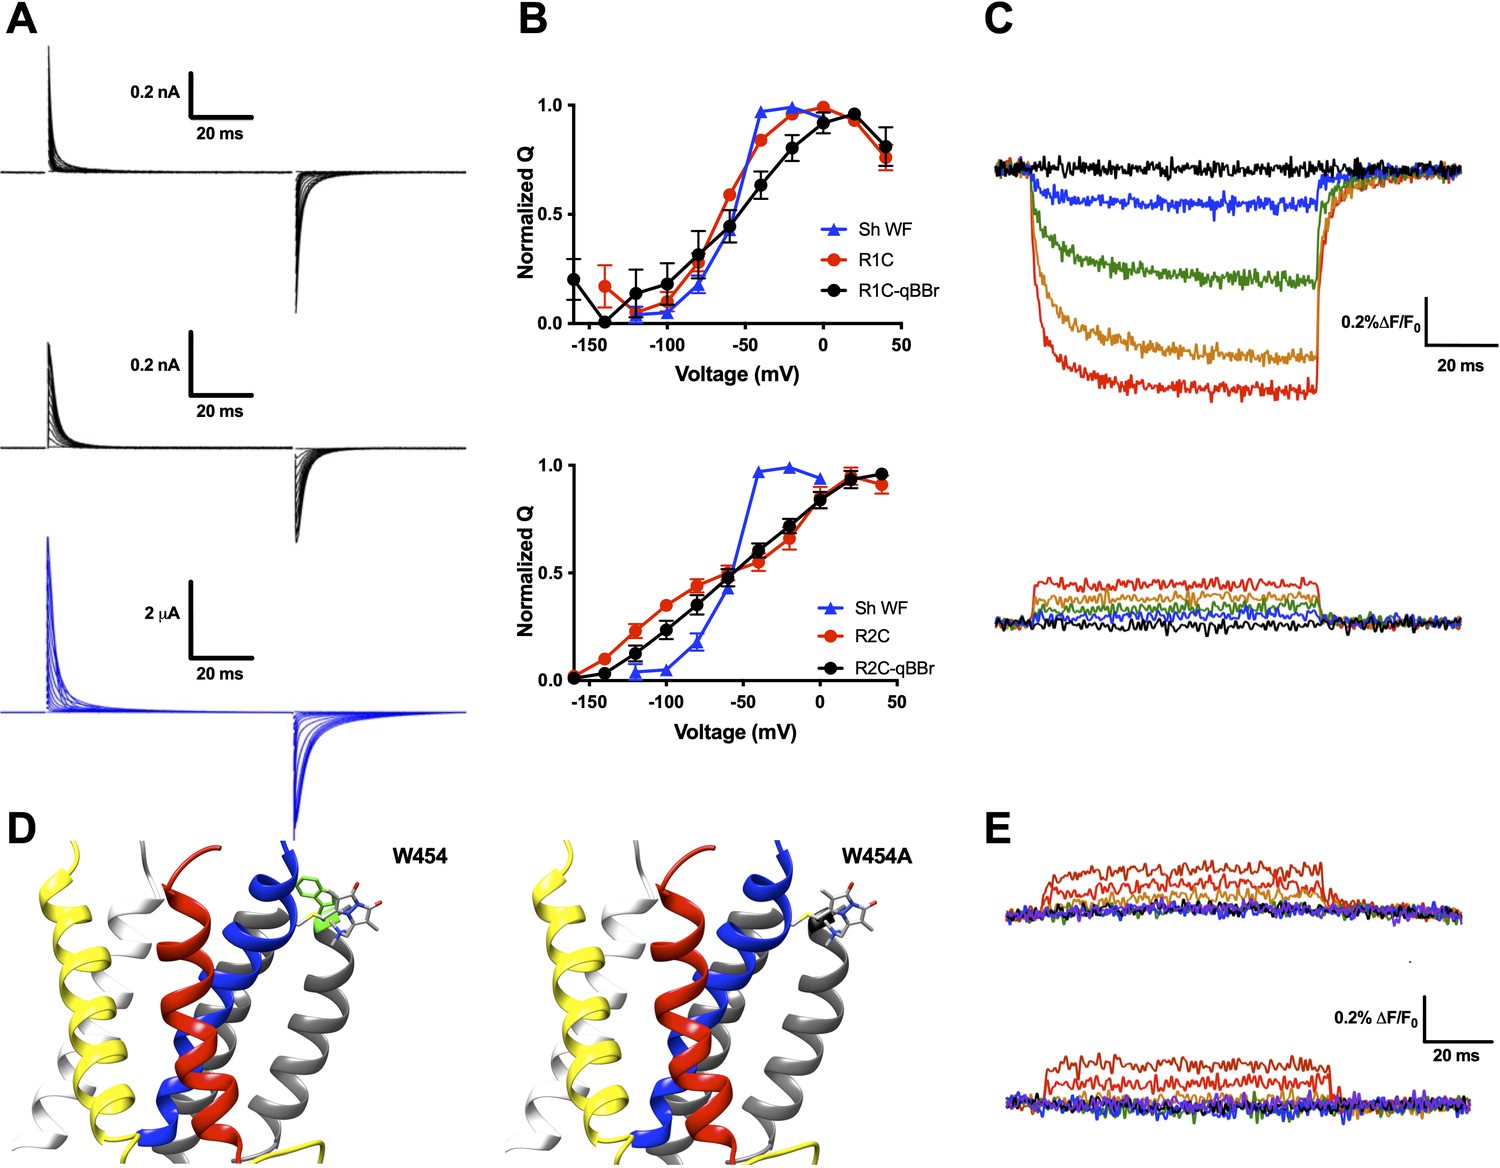
qBBr mimics a native gating charge.
(A) Representative gating current traces of Shaker R1C-qBBr (top), R2C-qBBr (middle), and Shaker W434F (bottom). (B) Normalized charge (Q) versus voltage (V) QV curves of R1C (top, red circles, n = 4), R1C-qBBr (top, black circles, n = 4), R2C (bottom, red circles, n = 5), and R2C-qBBr (bottom, black circles, n = 3), compared to Shaker W434F (blue triangles both, n = 3). Data are shown as mean ± standard error of the mean (SEM). (C) Representative fluorescence traces of R1C-qBBr (top) and R2C-qBBr (bottom). In all figures, membrane potentials during the pulse are: brown, + 80 mV; red, +40 mV; orange, 0 mV; green, −40 mV; blue, −80 mV; black, −120 mV; purple, −160 mV. (D) Structure of an active state voltage sensor showing R1C-qBBr (stick model) with the position of the in silico mutation 454 from a tryptophan (left, green) to an alanine (right) (PDB: 3LUT) (Chen et al., 2010). In all Shaker structures, transmembrane domains (S1–S6) are colored: S1, white; S2, yellow; S3, red; S4, blue; S5 and S6, gray. (E) Representative fluorescence traces for R1C-qBBr:W454A (top) and R1C-qBBr:W454F (bottom).
-
Figure 2—source data 1
Source data for normalized QVs in Figure 2B.
- https://cdn.elifesciences.org/articles/58148/elife-58148-fig2-data1-v2.xlsx
Figure 2—figure supplement 1
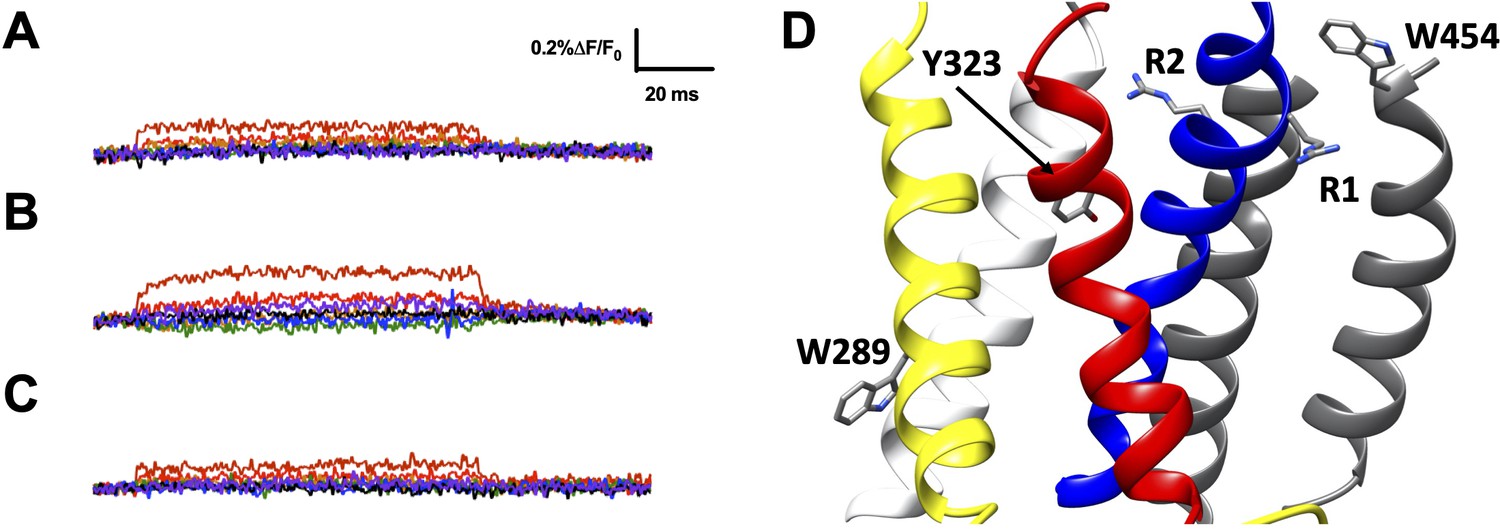
R1C-qBBr:W454A and R2C-qBBr fluorescence signals are not produced by endogenous tryptophans or tyrosines.
Representative fluorescence traces of (A) R1C-qBBr:W454A;W289F, (B) R1C-qBBr:W454A;Y323F, and (C) R2C-qBBr W289F;Y323F. In all panels, membrane potentials during the pulse are: brown, + 80 mV; red, +40 mV; orange, 0 mV; green, −40 mV; blue, −80 mV; black, −120 mV; purple, −160 mV. (D) Structure showing the positions of endogenous amino acids from A to C and the positions of R1 and R2 (PDB: 3LUT).
Figure 3

An exogenously substituted tryptophan (E247W) produces voltage-dependent fluorescence changes in R1C-qBBr:W454A.
(A) Homology structure of Shaker construct, R1C-qBBr:W454A;E247W demonstrating the tryptophan placement within the protein. (B) A representative activation family of fluorescence traces. (C) A normalized ΔF/F0 fluorescence versus voltage curve. Normalization was performed for each oocyte separately (n = 4). (D) A single exponential τ of fluorescence upon activation (n = 3). Data are shown as mean ± standard error of the mean (SEM).
-
Figure 3—source data 1
Source data for normalized ΔF/F0 versus voltage in Figure 3C and single exponential τact of fluorescence in Figure 3D.
- https://cdn.elifesciences.org/articles/58148/elife-58148-fig3-data1-v2.xlsx
Figure 4
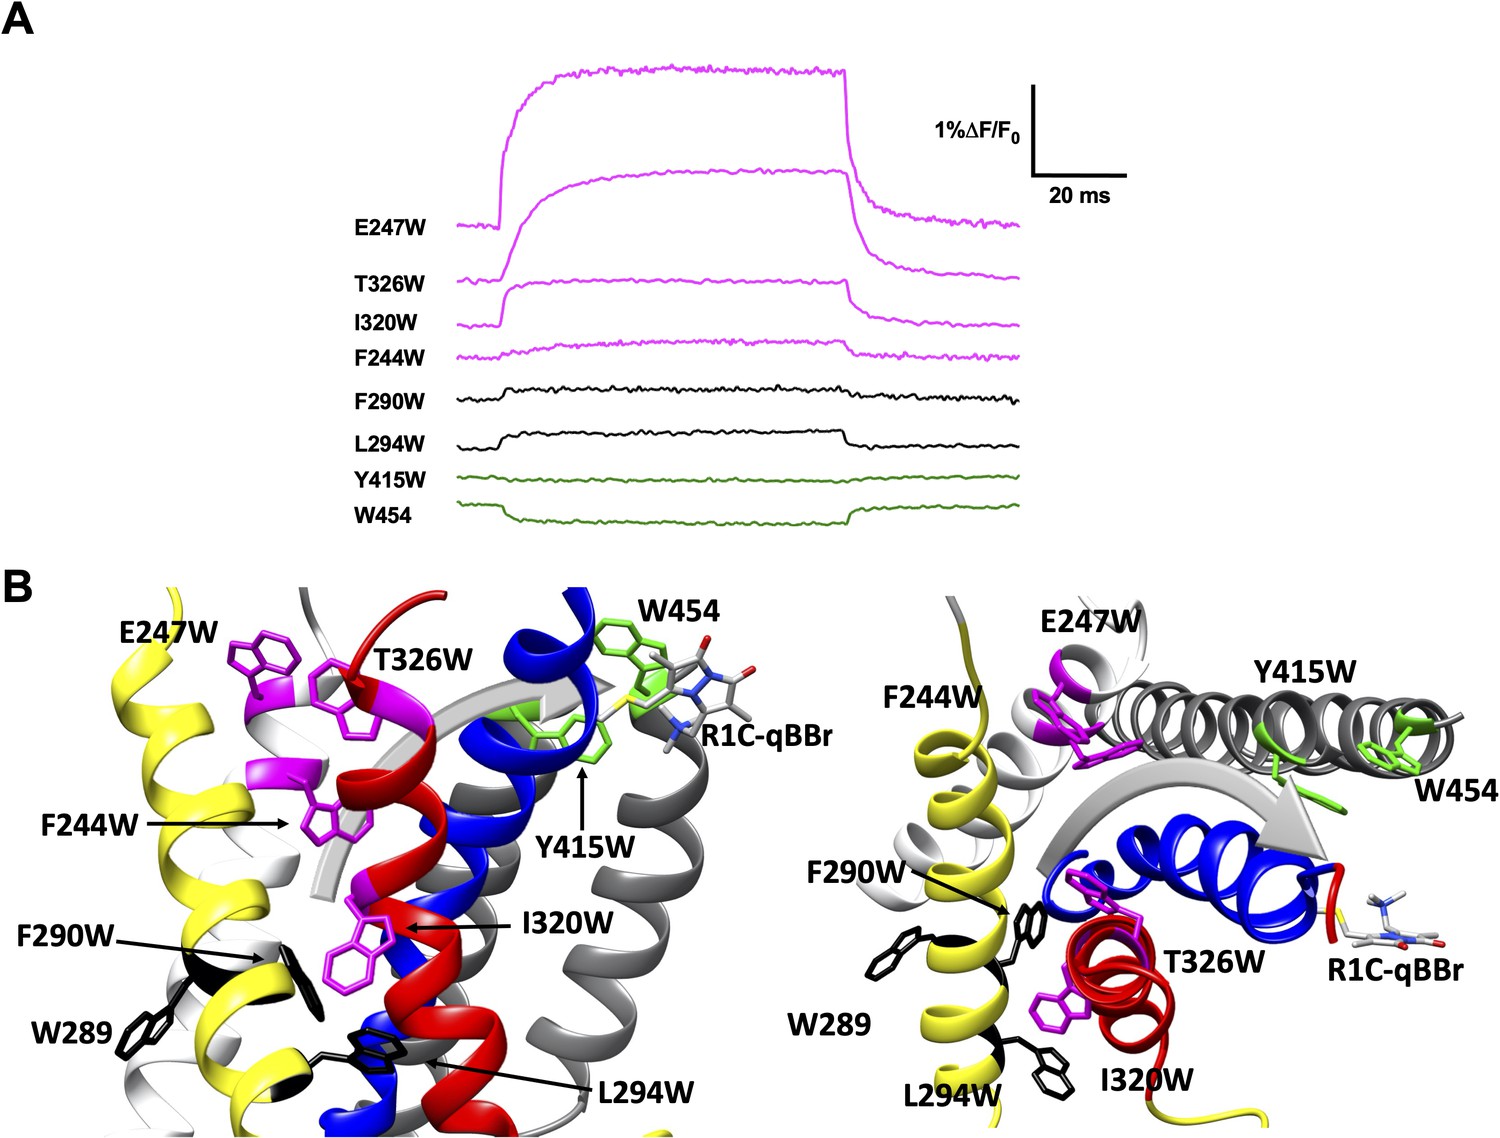
Activation pathway of R1C-qBBr:W454A mapped by several individually substituted tryptophans.
(A) Representative qBBr traces at +80 mV. As qBBr moves closer to a W, the W quenches (green) the qBBr fluorescence (Y415W and W454). When it moves further away from a W, the qBBr fluorescence is unquenched (pink; F244W, E247W, I320W, and T326W). Some W mutations have no effect (black; 289W, F290W, and L294W). (B) A summary structure of activation of R1C-qBBr, with side (left) and extracellular (right) views of the voltage-sensing domain (VSD). The activation pathway based on the W quenching/unquenching for R1C-qBBr is marked by a gray arrow.
Figure 5 with 1 supplement
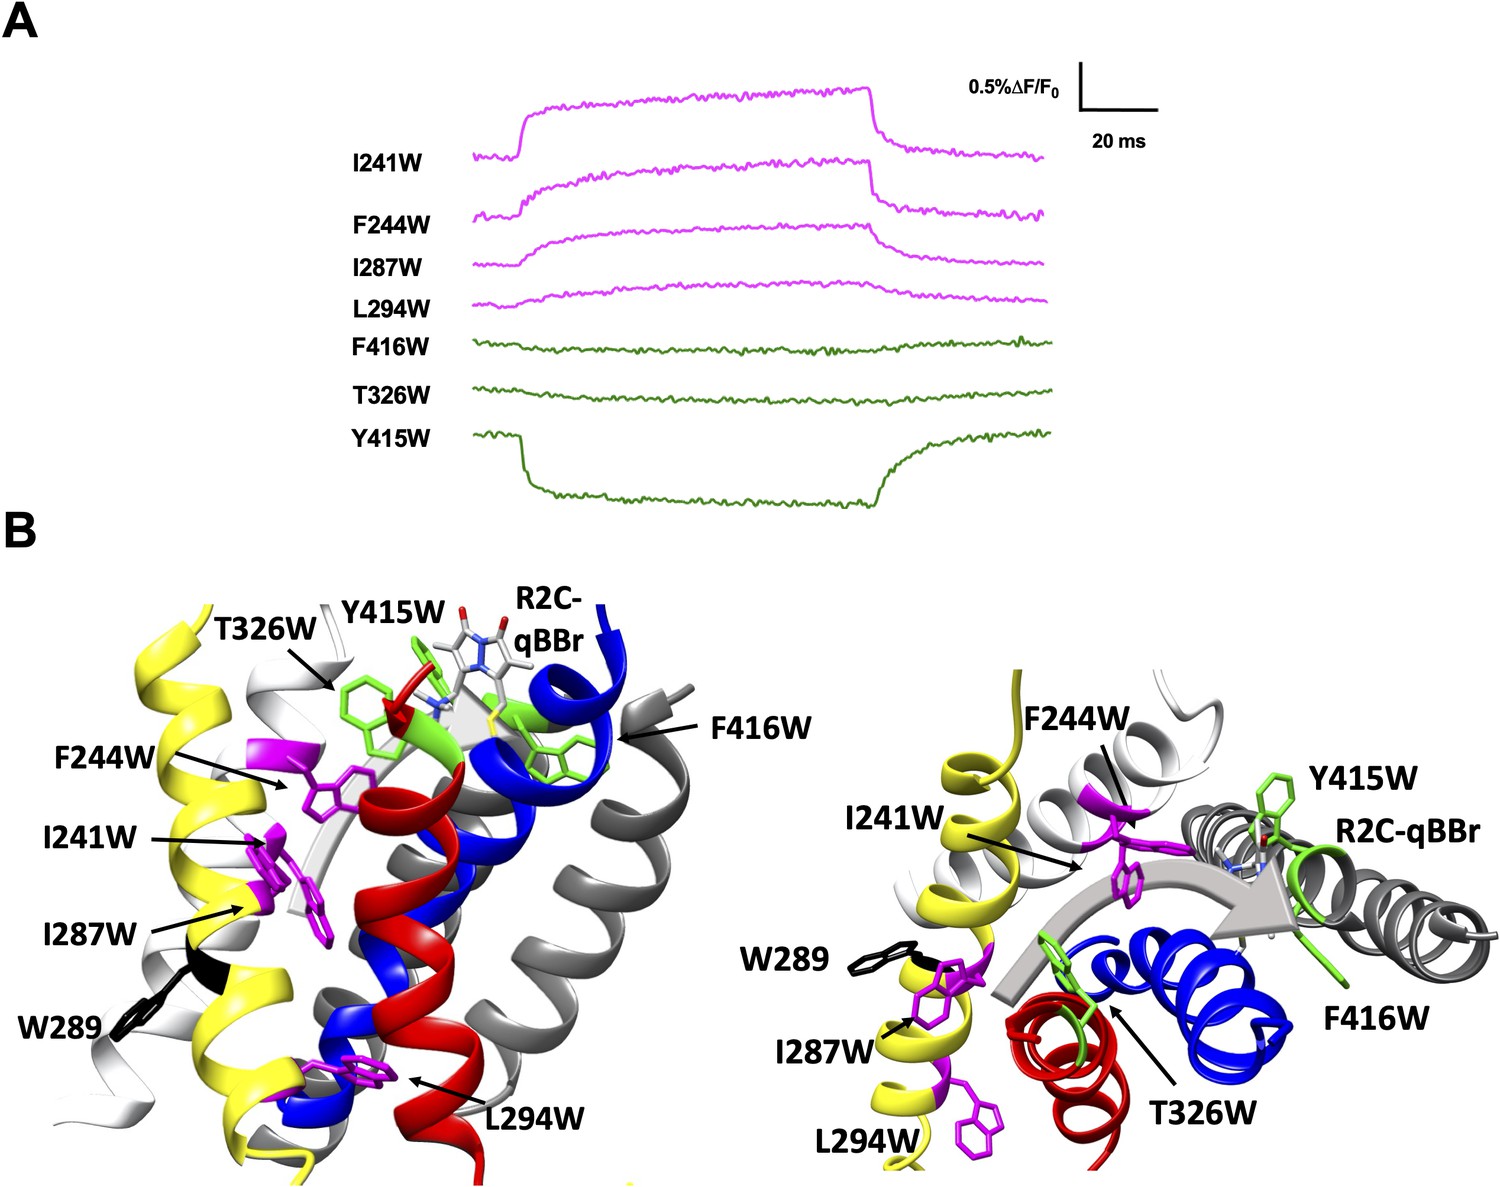
Activation pathway of R2C-qBBr mapped by several individually substituted tryptophans.
(A) Representative qBBr traces at +80 mV. As qBBr moves closer to a W, the W quenches (green) the qBBr fluorescence (T326W, Y415W, and F416W). When it moves further away from a W, the qBBr fluorescence is unquenched (pink; I241W, F244W, I287W, and L294W). Residue W289 (black) does not affect the fluorescence. (B) A summary structure of activation of R2C-qBBr with side (left) and extracellular (right) views of the voltage-sensing domain (VSD). The activation pathway based on the W quenching/unquenching for R2C-qBBr is marked by a gray arrow.
Figure 5—figure supplement 1
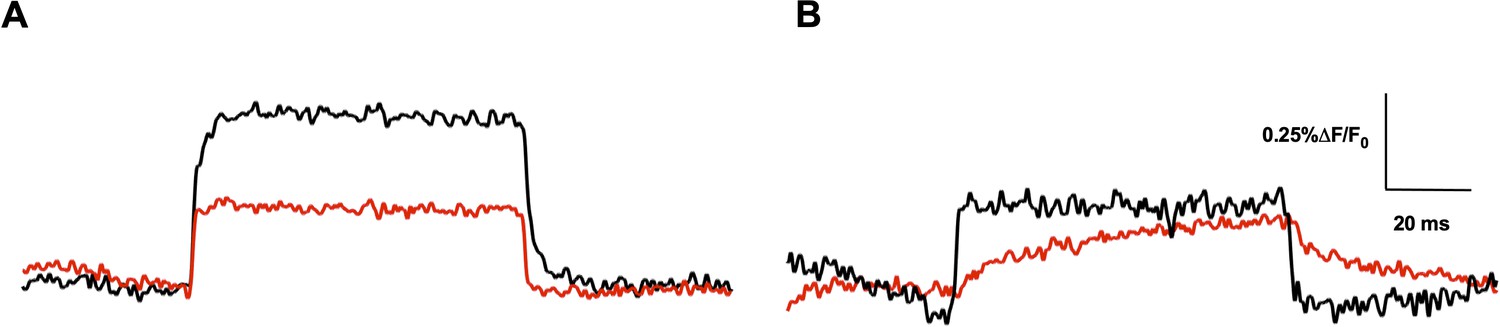
Effect of L294W in both R1C-qBBr:W454A and R2C-qBBr.
Representative fluorescence traces of qBBr labeled (A) R1C-qBBr:W454A (black) and R1C-qBBr:W454A;L294W (red) at +80 mV. (B) R2C-qBBr (black) and R2C-qBBr;L294W (red) at +40 mV.
Figure 6 with 2 supplements
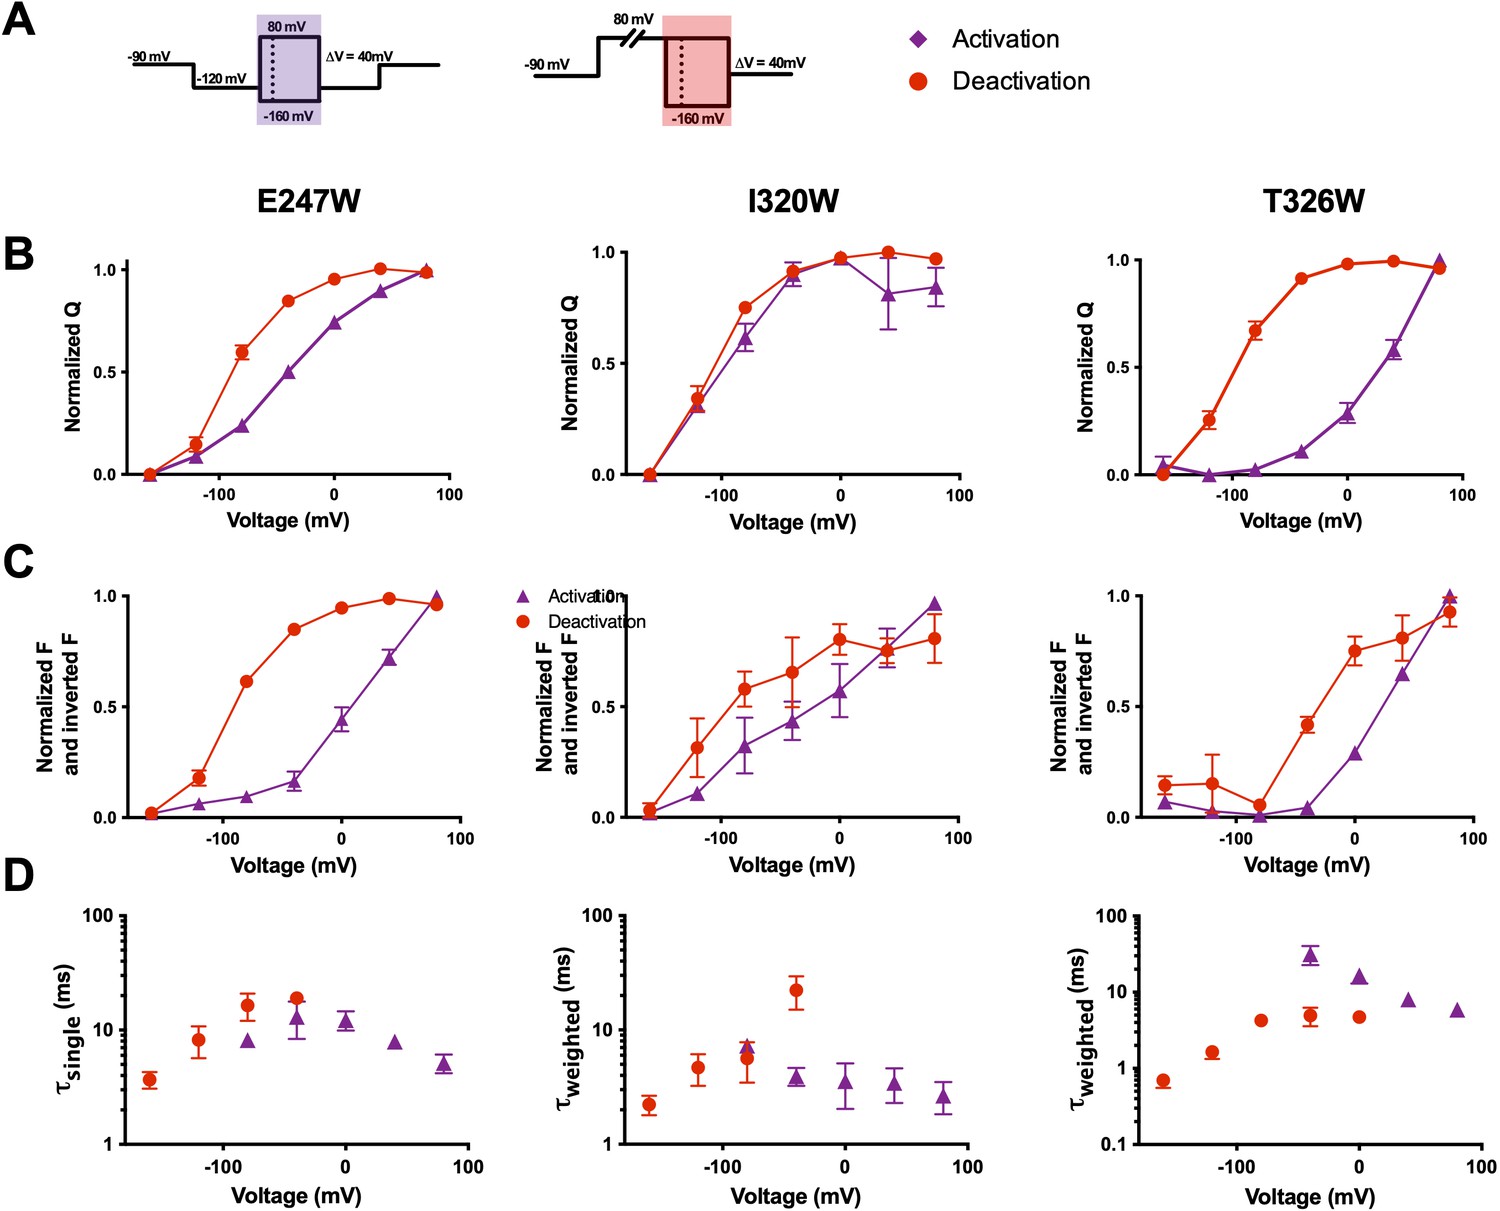
Voltage-sensing domain (VSD) deactivation transitions are followed by qBBr.
(A) Activation (purple) and deactivation (red) protocols. Shading indicates where gating and fluorescence were measured for (B–D). (B) Comparison of activation (purple triangles) and deactivation (red circles) QVs for R1C-qBBr:W454A;E247W (left, activation n = 4, deactivation n = 9), R1C-qBBr:W454A;I320W (center, activation n = 4, deactivation n = 5), and R1C-qBBr:W454A;T326W (right, activation n = 5, deactivation n = 5). (C) As in (B), but a comparison of activation and deactivation FVs, rather than QVs. (D) Comparison of single exponential τact (red circles, n = 3) to τdea (purple triangles, n = 4) of R1C-qBBr:W454A;E247W (left). Weighted τact (red circles, n = 3) to τdea (purple triangles, n = 5) of R1C-qBBr:W454A;I320W (center). Weighted τact (red circles, n = 3) to τdea (purple triangles, n = 3) of R1C-qBBr:W454A;T326W (right). Data are shown as mean ± standard error of the mean (SEM).
-
Figure 6—source data 1
Source data for normalized QVs in Figure 6A, normalized FVs in Figure 6B, and single or weighted τ of fluorescence in Figure 6C.
- https://cdn.elifesciences.org/articles/58148/elife-58148-fig6-data1-v2.xlsx
Figure 6—figure supplement 1
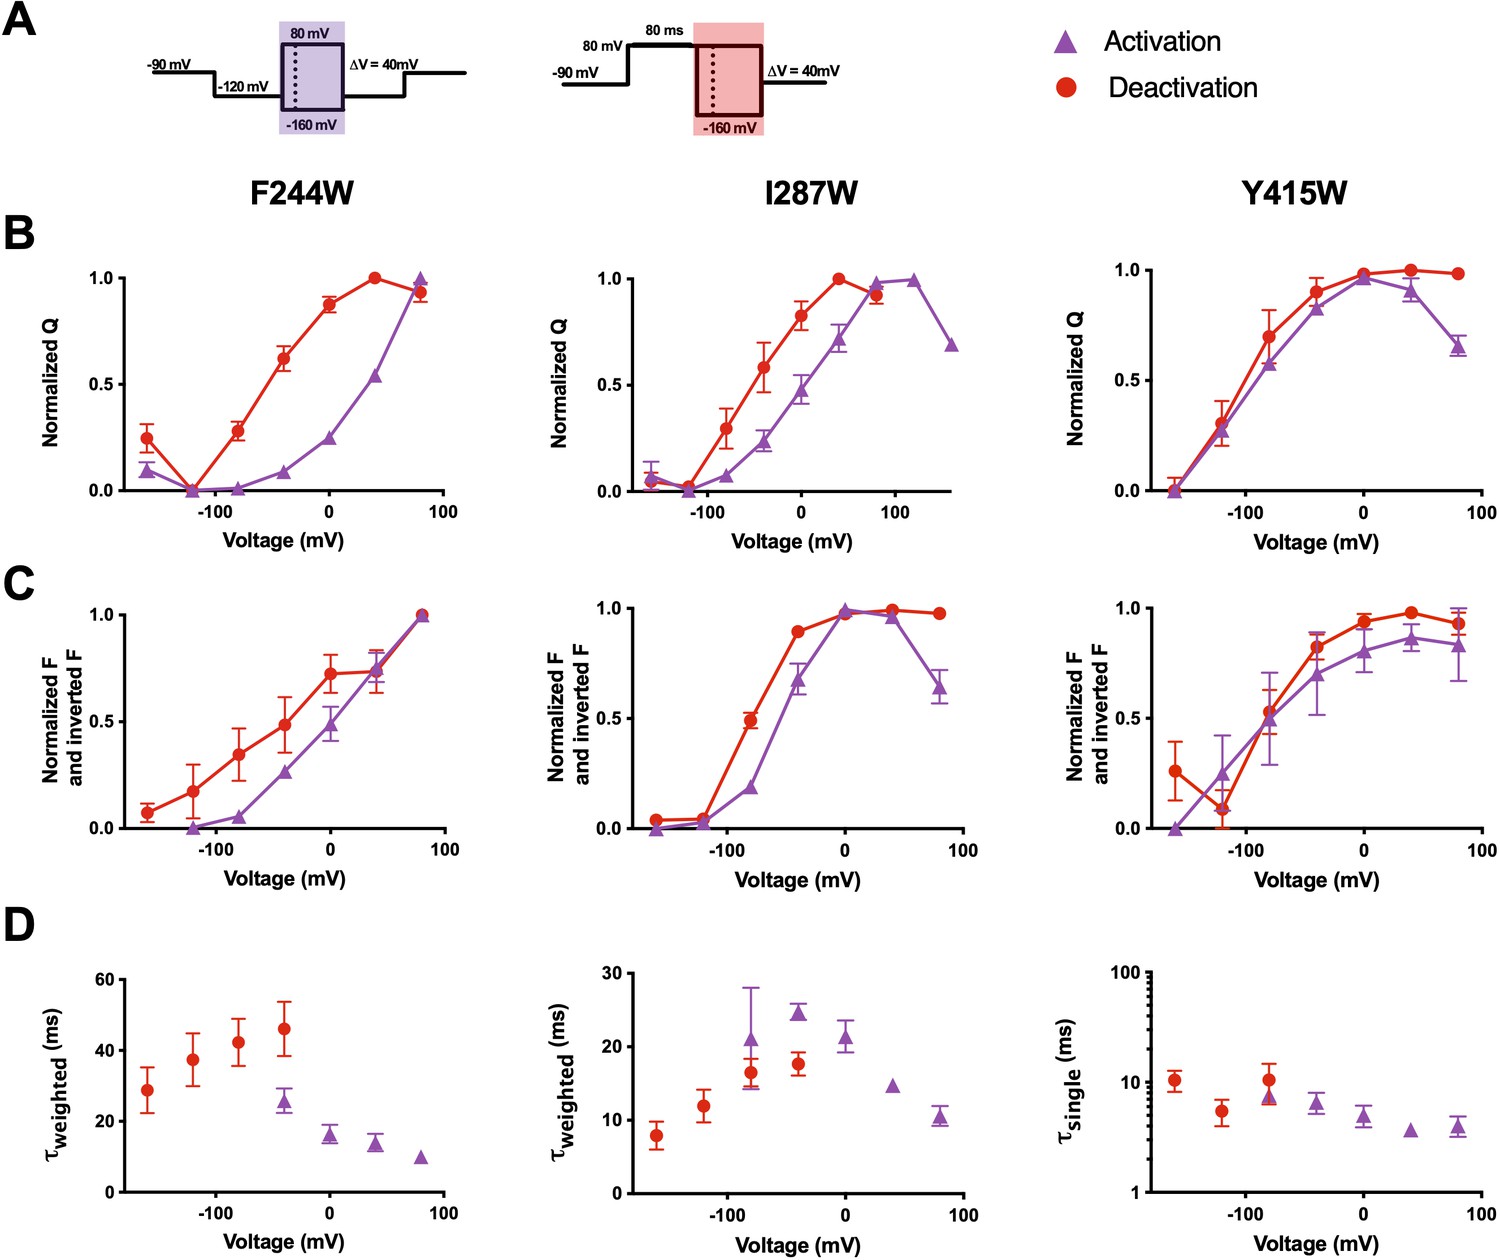
The voltage-sensing domain (VSD) deactivation path of R2C-qBBr differs from that of activation.
(A) Activation (purple) and deactivation (red) protocols. Shading indicates where gating and fluorescence were measured for (B–D). (B) Comparison of activation (purple triangles) and deactivation (red circles) QVs for R2C-qBBr:F244W (left, act n = 4,deact n = 4), R2C-qBBr:I287W (center, act n = 4, deact n = 5), and R2C-qBBr:Y415W (right, act n = 3, deact n = 3). (C) As in (B), but a comparison of activation and deactivation FVs, rather than QVs. (D) Comparison of single exponential τact (red circles, n = 6) to τdea (purple triangles, n = 3) of R2C-qBBr:F244W (left), weighted τact (red circles, n = 8) to τdea (purple triangles, n = 4) of R2C-qBBr:I287W (center), and weighted τact (red circles, n = 4) to τdea (purple triangles, n = 6) of R2C-qBBr:Y415W (right). Data are shown as mean ± standard error of the mean (SEM).
-
Figure 6—figure supplement 1—source data 1
Source data for normalized QVs in Figure 6—figure supplement 1A, normalized FVs in Figure 6—figure supplement 1B, and single or weighted τ of fluorescence in Figure 6—figure supplement 1C.
- https://cdn.elifesciences.org/articles/58148/elife-58148-fig6-figsupp1-data1-v2.xlsx
Figure 6—figure supplement 2
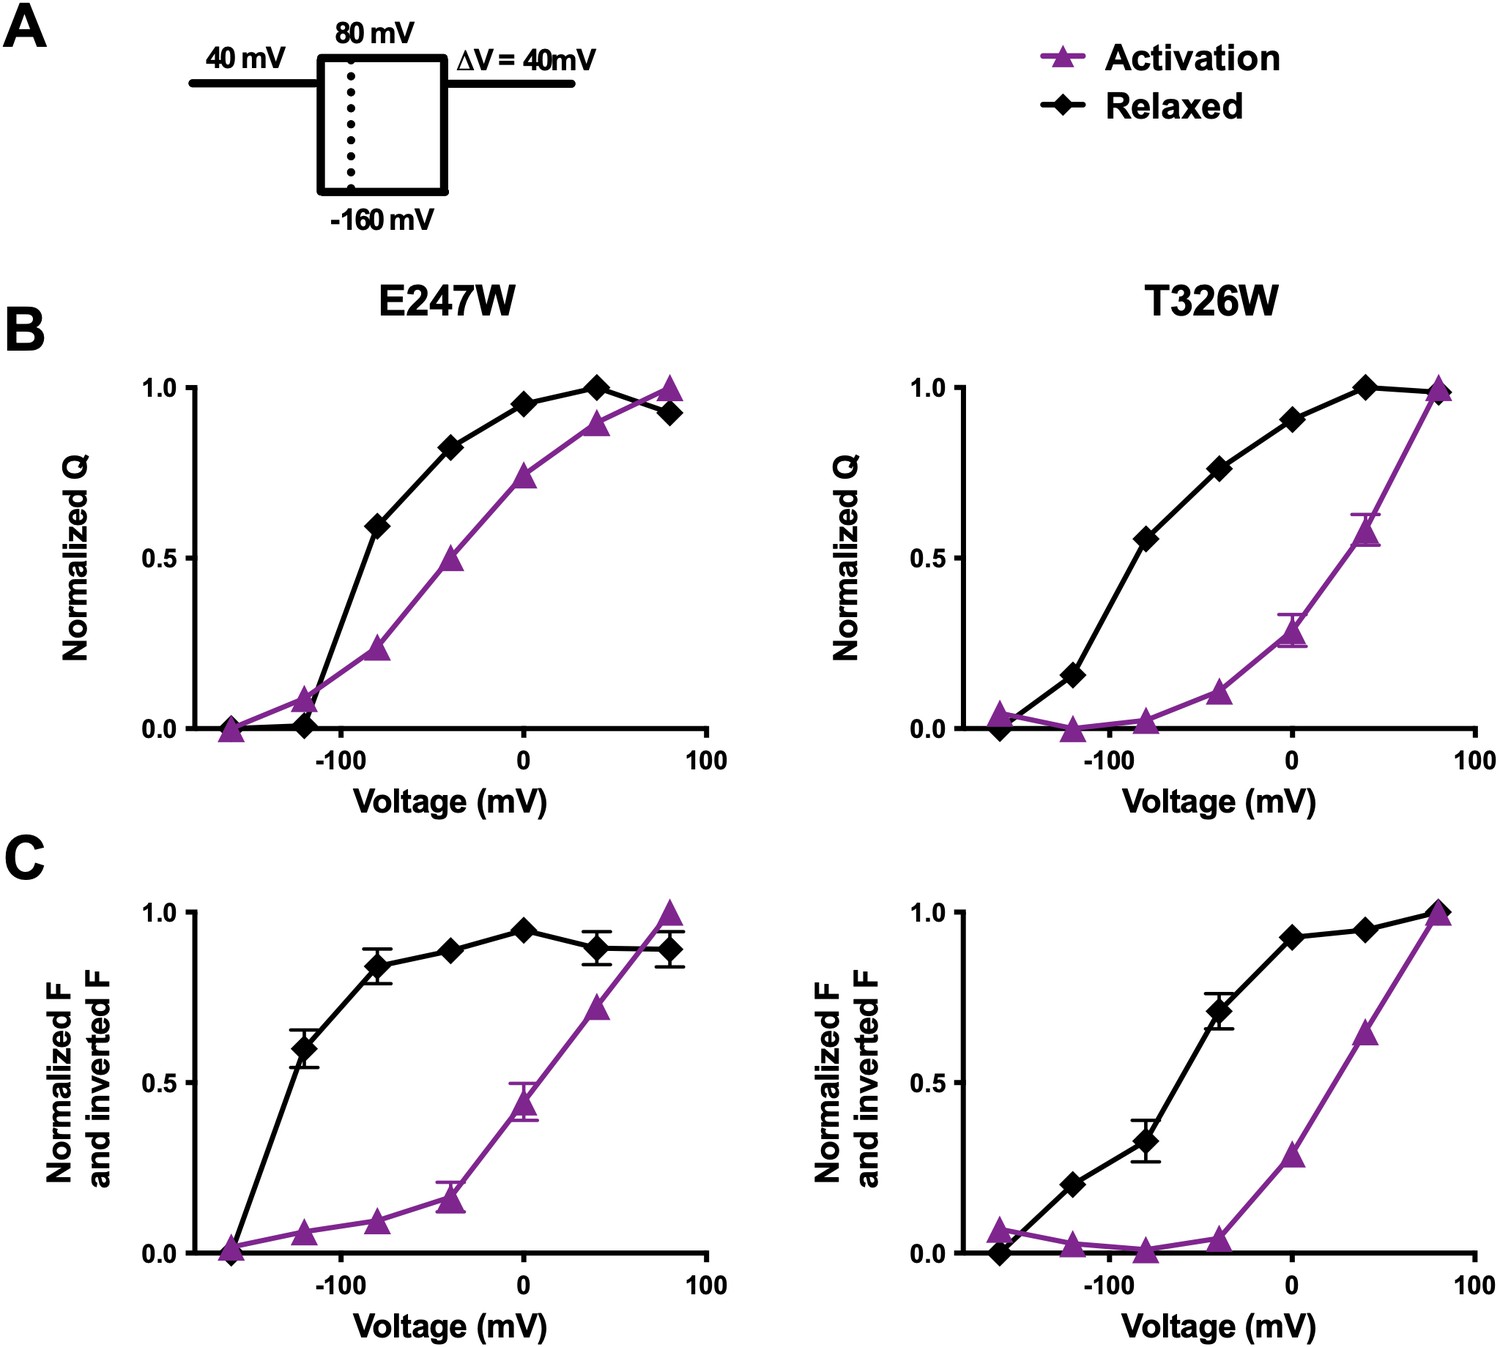
R1C-qBBr fluorescence visualizes the relaxed state.
(A) A relaxation pulse protocol. (B) Comparison of activation (purple, triangles) and derelaxation (black, diamonds) QVs for R1C-qBBr:W454A;E247W (left, activation n = 4, derelaxation n = 4) and R1C-qBBr:W454A;T326W (right, activation n = 5, derelaxation n = 4). (C) Inverted FVnormalized and FVnormalized for activation and derelaxation for R1C-qBBr:W454A;E247W (left, activation n = 8, derelaxation n = 6) and R1C-qBBr:W454A;T326W (right, activation n = 5, derelaxation n = 3). Data are shown as mean ± standard error of the mean (SEM).
-
Figure 6—figure supplement 2—source data 1
Source data for normalized QVs in Figure 6—figure supplement 2B and normalized FVs in Figure 6—figure supplement 2C.
- https://cdn.elifesciences.org/articles/58148/elife-58148-fig6-figsupp2-data1-v2.xlsx
Figure 7 with 1 supplement
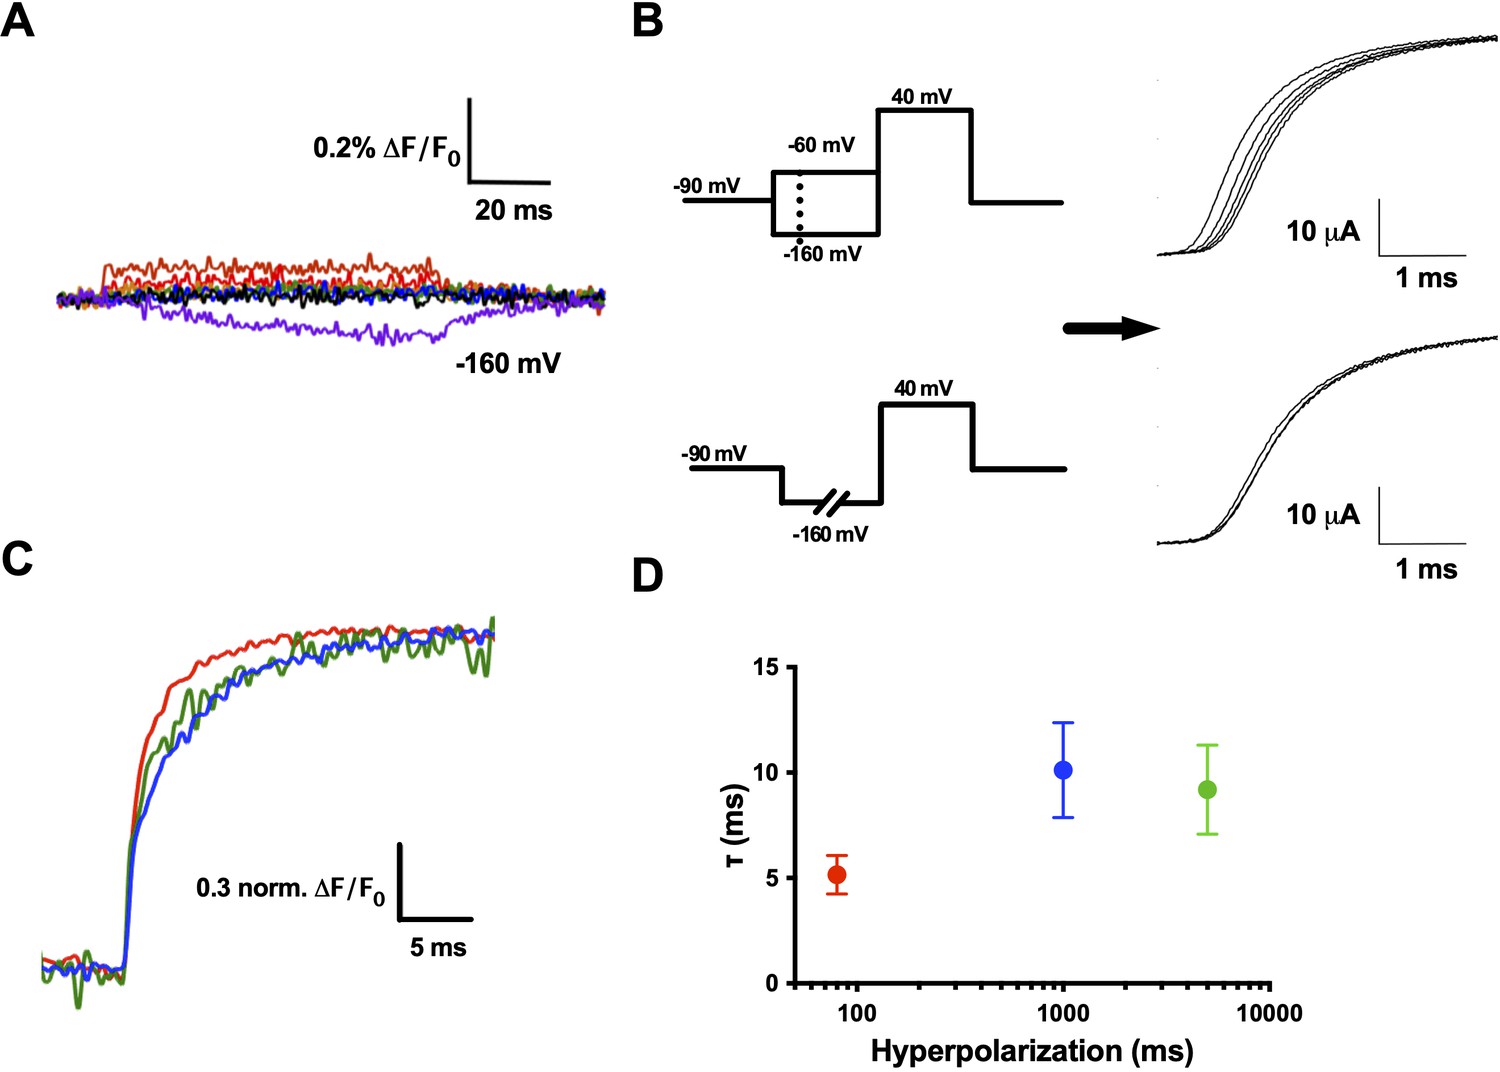
R1C–qBBr interaction with F290 provides the basis of the Cole–Moore shift.
(A) A family of fluorescence traces for R1C-qBBr:W454A;F290W from a pulse protocol as in (6A). Note the slow fluorescence response when hyperpolarized to −160 mV (purple) and the residual signals during depolarizations. (B) Two pulse protocols that induce a Cole–Moore shift: a variable voltage pulse (−80 to −160 mV, every −20 mV) before a depolarization (top) or a prolonged hyperpolarization pulse (5, 1000, and 3000 ms) before depolarization (bottom) and the resulting Cole–Moore shifts of representative Shaker ionic currents (right). (C) Representative normalized fluorescence traces for R1C-qBBr:W454A;F290W using the pulse protocol from (B, bottom),with a −160 mV prepulse with a variable duration for 80 ms (red), 1 s (blue), and 5 s (green). (D) Comparison of the τweighted of the change in qBBr fluorescence in (C) (80 ms pulses, n = 4; 1 s pulses, n = 5; 5 s pulses, n = 4). Data are shown as mean ± standard error of the mean (SEM).
-
Figure 7—source data 1
Source data for weighted fluorescence τ in Figure 7D.
- https://cdn.elifesciences.org/articles/58148/elife-58148-fig7-data1-v2.xlsx
Figure 7—figure supplement 1
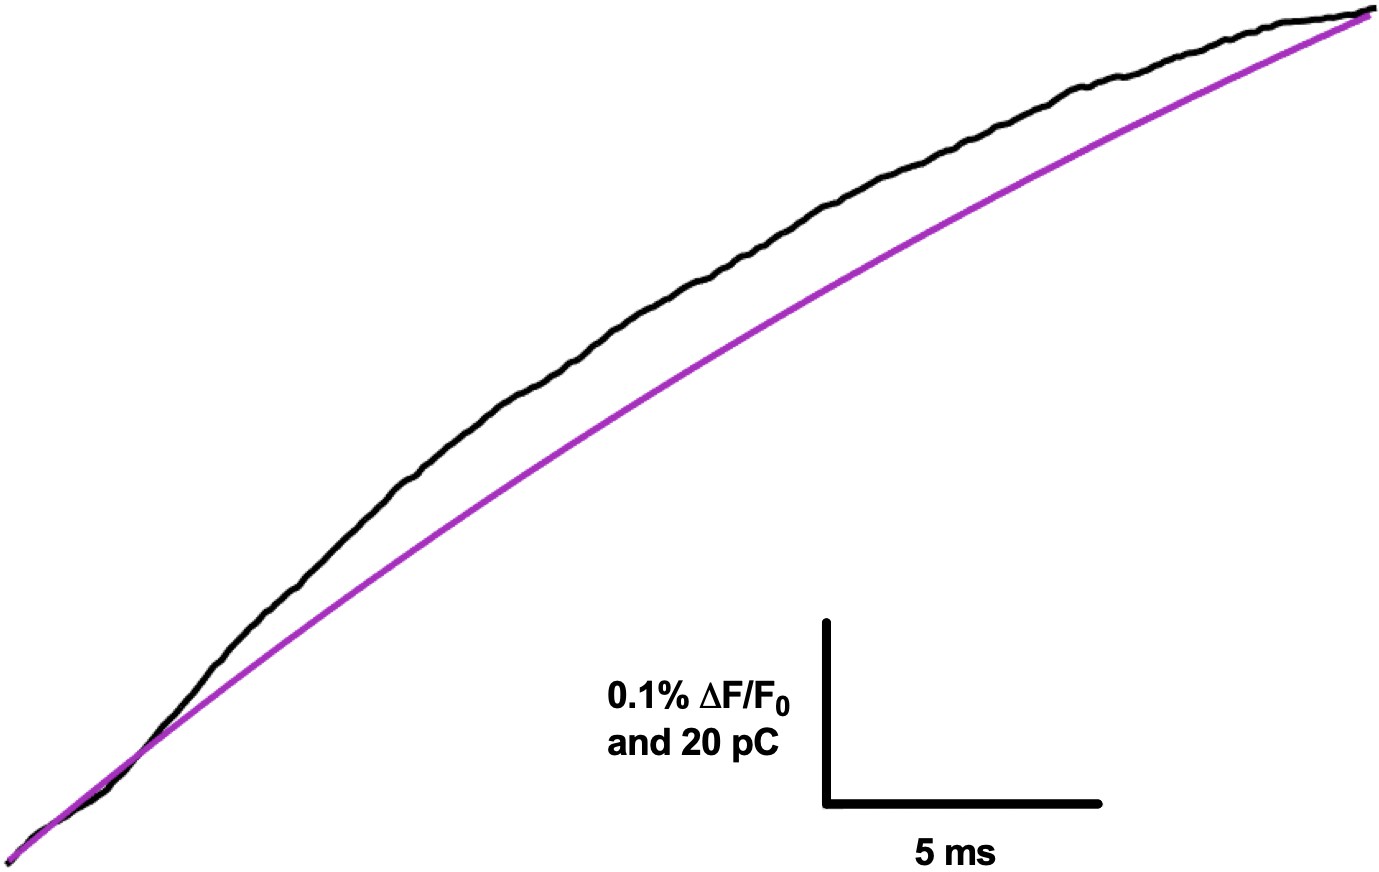
R1C-qBBr:W454A;F290W hyperpolarization-induced gating charge and fluorescence signal time course.
Data are taken from a pulse from −120 to −160 mV. The integrated gating current of all four charges moving through the electric field (gating charge, Q, black) is more rapid than the hyperpolarization-induced fluorescence signal of R1C-qBBr:W454A;F290W, shown as the single exponential fit to the inverted fluorescence signal (purple). The fluorescence signal only follows the movement of the most extracellular gating charge (R1C-qBBr). Traces are aligned to each other, but the fluorescence signal is still slower than the gating charge.
Figure 8
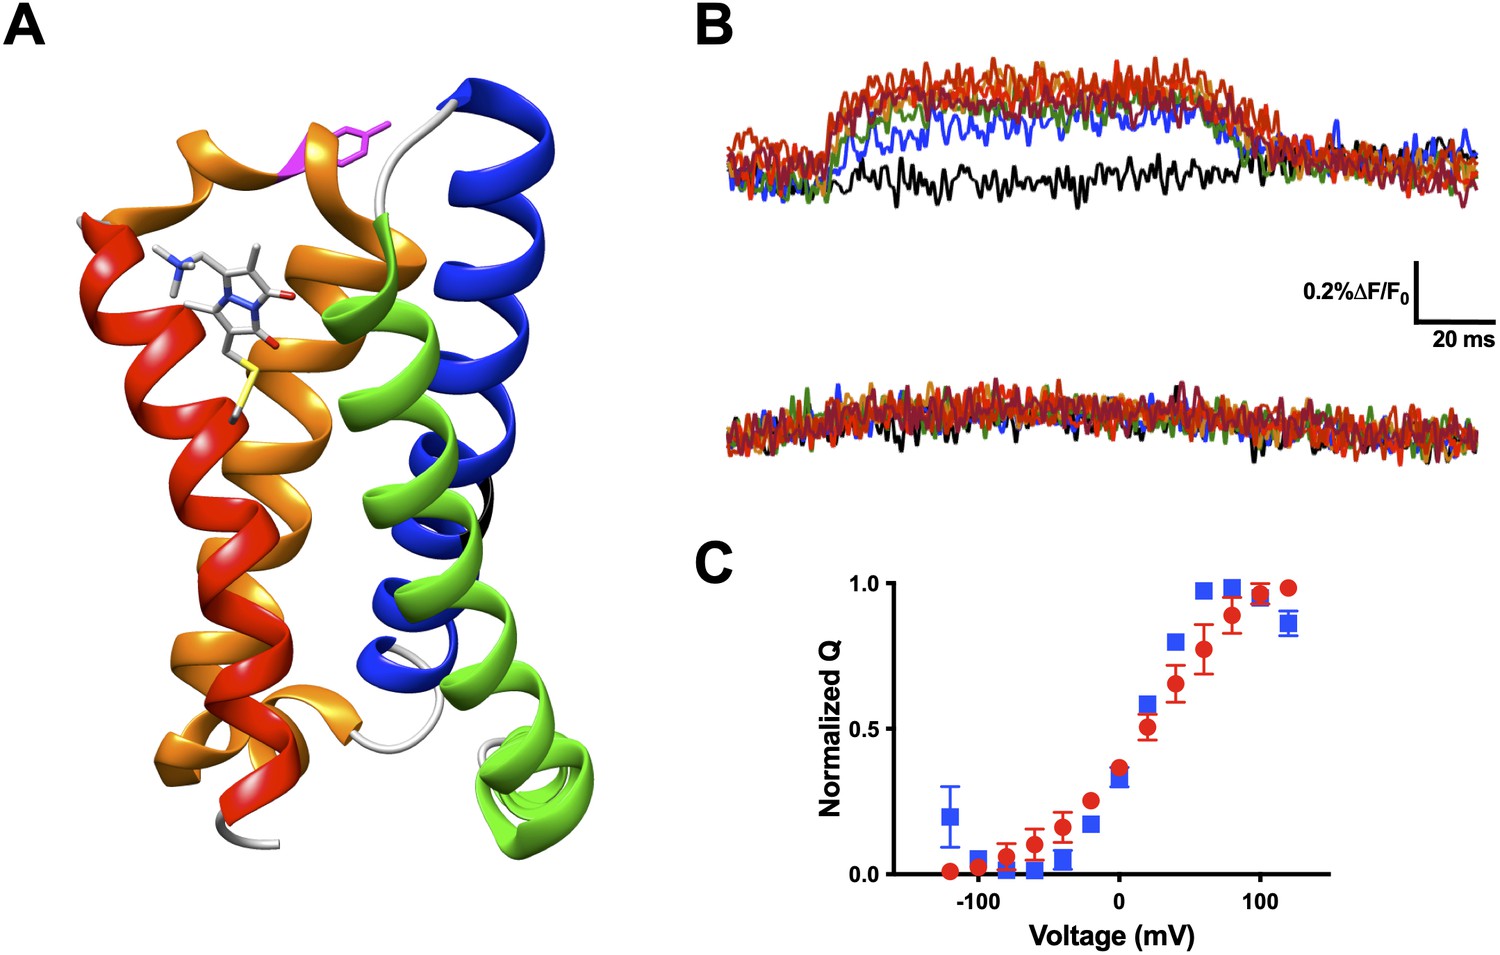
Voltage-sensitive membrane protein CiVSP is interrogable by qBBr.
(A) CiVSP structure (PDB: 4G7V) with qBBr attached at R1C and highlighting residue Y206. Transmembrane domains (S1–S4) are colored with S1, green; S2, blue; S3, orange; S4, red. (B) Representative fluorescence traces of CiVSP R217Q R1C-qBBr (top) and CiVSP R217Q R1C-qBBr:Y206A (bottom). (C) Normalized QV curves comparing CiVSP R217Q R1C-qBBr (red circles, n = 4) and CiVSP R217Q R1C-qBBr:Y206A (blue squares, n = 3). Data are shown as mean ± standard error of the mean (SEM).
-
Figure 8—source data 1
Source data for normalized QV in Figure 8C.
- https://cdn.elifesciences.org/articles/58148/elife-58148-fig8-data1-v2.xlsx
Figure 9
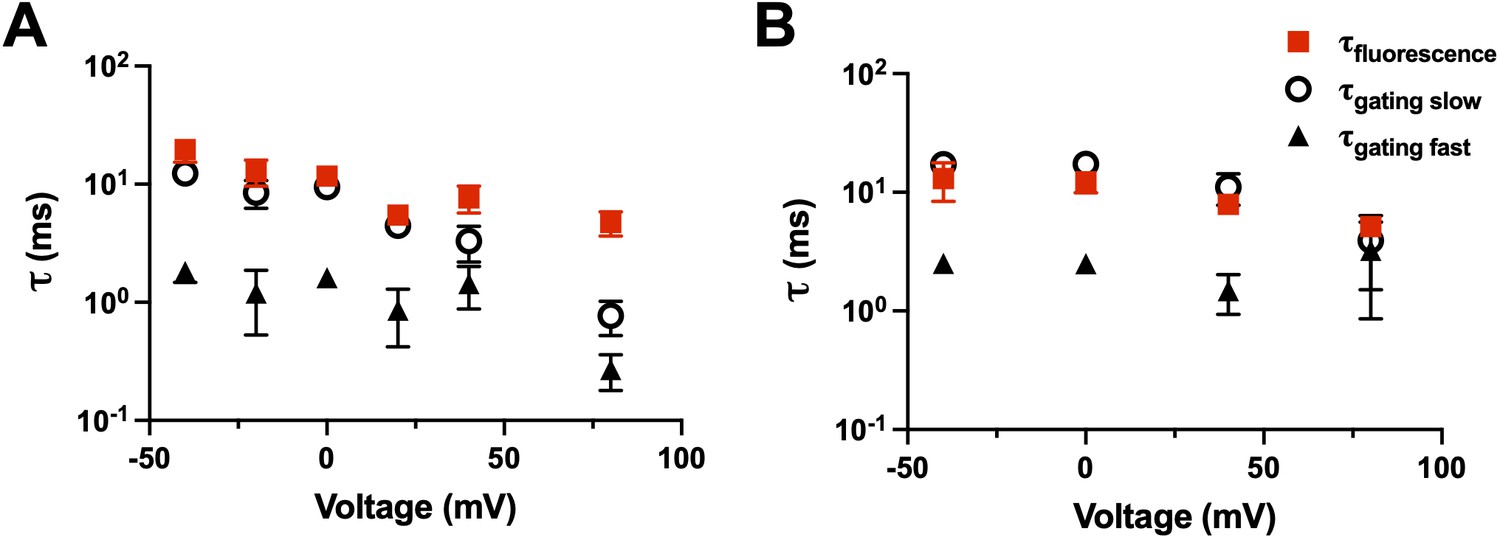
Fluorescence kinetics of qBBr.
(A) Comparison of the single exponential tau of fluorescence of R1C-qBBr (red squares) to the gating ττfast (black triangles) and the gating τslow (open circles) obtained from a double exponential fit to the gating charge (n = 4). (B) As in A, but for R1C-qBBr:W454A;E247W (n = 4).
-
Figure 9—source data 1
Source data for fluorescence and gating τ in Figures 9A and 9B.
- https://cdn.elifesciences.org/articles/58148/elife-58148-fig9-data1-v2.xlsx
Tables
Table 1
Summary ΔF/F0 of qBBr constructs.
| Construct | ΔF/F0 ± SEM at 80 mV | Fluorescence effect | N |
|---|---|---|---|
| Sh WF | N/A | N/A | 3 |
| Sh WF R1C-qBBr | −0.154 ± 0.0172 | Quench | 4 |
| Sh WF R1C-qBBr:W454A | 0.206 ± 0.037 | No effect | 5 |
| Sh WF R1C-qBBr:W454A;F244W | 0.191 ± 0.026 | Unquench | 3 |
| Sh WF R1C-qBBr:W454A;E247W | 0.930 ± 0.205 | Unquench | 8 |
| Sh WF R1C-qBBr:W454A;F290W | 0.0946 ± 0.0323 | No effect | 4 |
| Sh WF R1C-qBBr:W454A;L294W | 0.127 ± 0.086 | No effect | 4 |
| Sh WF R1C-qBBr:W454A;I320W | 0.247 ± 0.095 | Unquench | 4 |
| Sh WF R1C-qBBr:W454A;T326W | 0.448 ± 0.167 | Unquench | 6 |
| Sh WF R1C = qBBr:W454A;Y415W | −0.147 ± 0.015 | Quench | 8 |
| Sh WF R2C-qBBr | 0.168 ± 0.0241 | No effect | 5 |
| Sh WF R2C-qBBr:I241W | 0.261 ± 0.132 | Unquench | 4 |
| Sh WF R2C-qBBr:F244W | 0.454 ± 0.171 | Unquench | 4 |
| Sh WF R2C-qBBr:I287W | 0.493 ± 0.156 | Unquench | 4 |
| Sh WF R2C-qBBr:L294W | 0.183 ± 0.036 | Unquench | 3 |
| Sh WF R2C-qBBr:T326W | −0.094 ± 0.017 | Quench | 3 |
| Sh WF R2C-qBBr:Y415W | –0.851 ± 0.123 | Quench | 9 |
| Sh WF R2C-qBBr:F416W | –0.0448 ± 0.098 | Quench | 4 |
-
Summary ΔF/F0 of qBBr constructs – The ΔF/F0 for all constructs and the effect of the construct’s tryptophan on qBBr fluorescence at a depolarizing pulse to +80 mV.
-
SEM, standard error of the mean.;
Key resources table
| Reagent type (species) or resource | Designation | Source or reference | Identifiers | Additional information |
|---|---|---|---|---|
| Biological sample (Xenopus laevis, female) | Oocytes | Nasco | Cat# LM00531 | |
| Strain, strain background (Escherichia coli) | XL10-Gold Ultracompetent Cells | Agilent | Cat# 200315 | Competent cells |
| Genetic reagent (D. melanogaster) | Shaker Δ6–46W434F background template | Hoshi et al., 1990; Perozo et al., 1993 | ||
| Genetic reagent (Ciona intestinalis) | CiVSP C363S background template | Murata et al., 2005 | ||
| Commercial assay or kit | mMESSAGE mMACHINE T7 Transcription Kit | ThermoFisher | Cat# AM1344 | |
| Commercial assay or kit | mMESSAGE MACHINE SP6 Transcription Kit | ThermoFisher | Cat# AM1340 | |
| Commercial assay or kit | QuikChange II site directed mutagenesis | Agilent | Cat# 200,523 | |
| Chemical compound, dye | Monobromo(trimethylammonio)bimane (qBBr) | Sigma Aldrich | Cat# 71028;CAS# 71418-45-6 | |
| Chemical compound, dye | Bromotrimethylammoniumbimane bromide (qBBr) | Toronto Research Chemicals | Cat# B688500; CAS# 71418-45-6 | |
| Chemical compound, drug | N-Methyl-D-glucamine | Sigma-Aldrich | Cat# M2994;CAS# 6284-40-8 | |
| Chemical compound, drug | Methanesulfonic acid | Sigma-Aldrich | Cat# 471356;CAS# 75-75-2 | |
| Software, algorithm | MATLAB | Mathworks | 2014b or earlier; RRID:SCR_001622 | |
| Software, algorithm | UCSF Chimera | UCSF | 1.10.1; RRID:SCR_004097 | |
| Software, algorithm | Prism | GraphPad | 6; RRID:SCR_002798 |
Additional files
-
Transparent reporting form
- https://cdn.elifesciences.org/articles/58148/elife-58148-transrepform1-v2.docx
-
Source code 1
MATLAB scripts for analyzing data and simulating qBBr fluorescence dynamics.
- https://cdn.elifesciences.org/articles/58148/elife-58148-supp1-v2.zip
Download links
A two-part list of links to download the article, or parts of the article, in various formats.
Downloads (link to download the article as PDF)
Open citations (links to open the citations from this article in various online reference manager services)
Cite this article (links to download the citations from this article in formats compatible with various reference manager tools)
Tracking the movement of discrete gating charges in a voltage-gated potassium channel
eLife 10:e58148.
https://doi.org/10.7554/eLife.58148


