Periodic propagating waves coordinate RhoGTPase network dynamics at the leading and trailing edges during cell migration
- Edinburgh Cancer Research Centre, Institute of Genetics and Molecular Medicine, University of Edinburgh, United Kingdom
- Systems Biology Ireland, School of Medicine and Medical Science, University College Dublin, Ireland
- Institute of Theoretical and Experimental Biophysics, Russian Federation
- Conway Institute of Biomolecular & Biomedical Research, University College Dublin, Ireland
- Department of Pharmacology, Yale University School of Medicine, United States
Figures
Figure 1 with 1 supplement
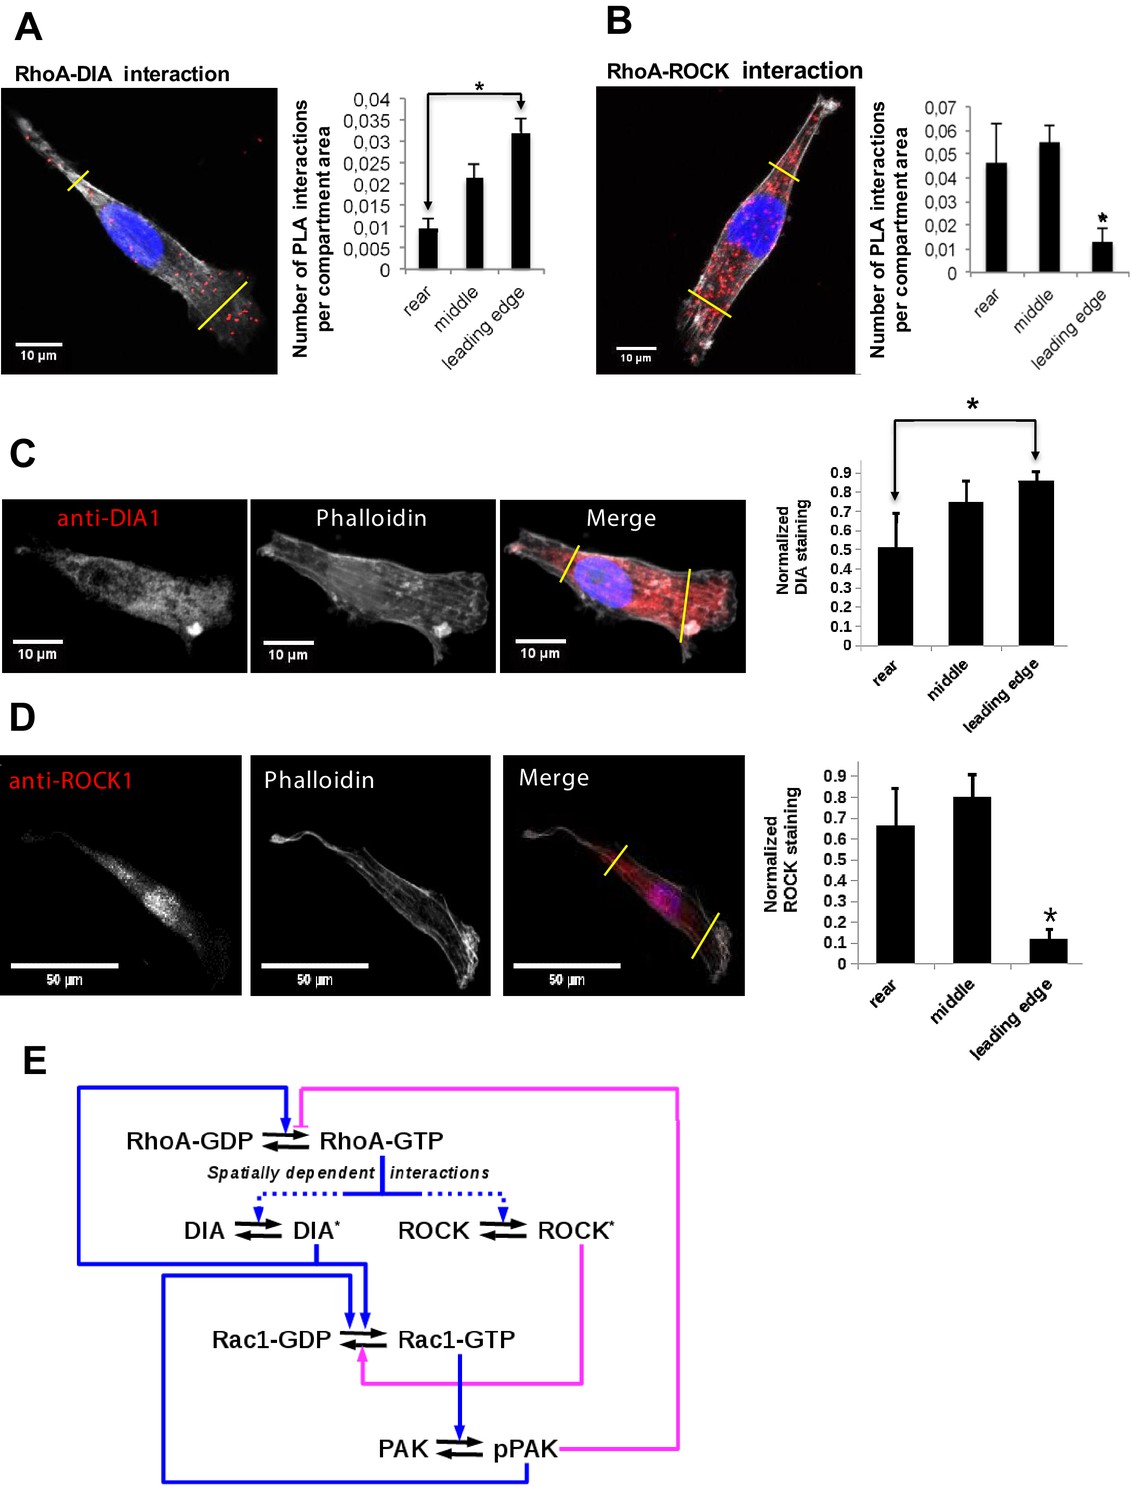
Differential localization of the RhoA-DIA and RhoA-ROCK1 protein complexes determine spatially resolved signaling topology.
(A, B) Representative PLA images. Each red spot within a cell represents a fluorescent signal from a single RhoA-DIA1 (A) or RhoA-ROCK1 (B) complex. Yellow lines indicate bounds for the leading edge, intermediate region and rear. Bar graphs at the right show the average density of these complexes in different cell regions (the rear, middle and leading edge)± S.E.M. of four independent experiments with 25 cells analyzed per experiment. The asterisk * indicates that p<0.05 calculated using unpaired t-test. (C, D) Representative images of DIA1 and ROCK1 immunostaining. Bar graphs at the right show quantified immunostaining density signals for different cellular compartments ± S.E.M. of four independent experiments with one cell analyzed per experiment. The asterisk * indicates that p<0.05 calculated using unpaired t-test. (E) A schematic wiring diagram of the RhoA-Rac1 network, showing positive (blue) and negative (magenta) feedback loops. Spatially varying RhoA interactions with its effectors DIA and ROCK are shown by dashed lines.
Figure 1—figure supplement 1
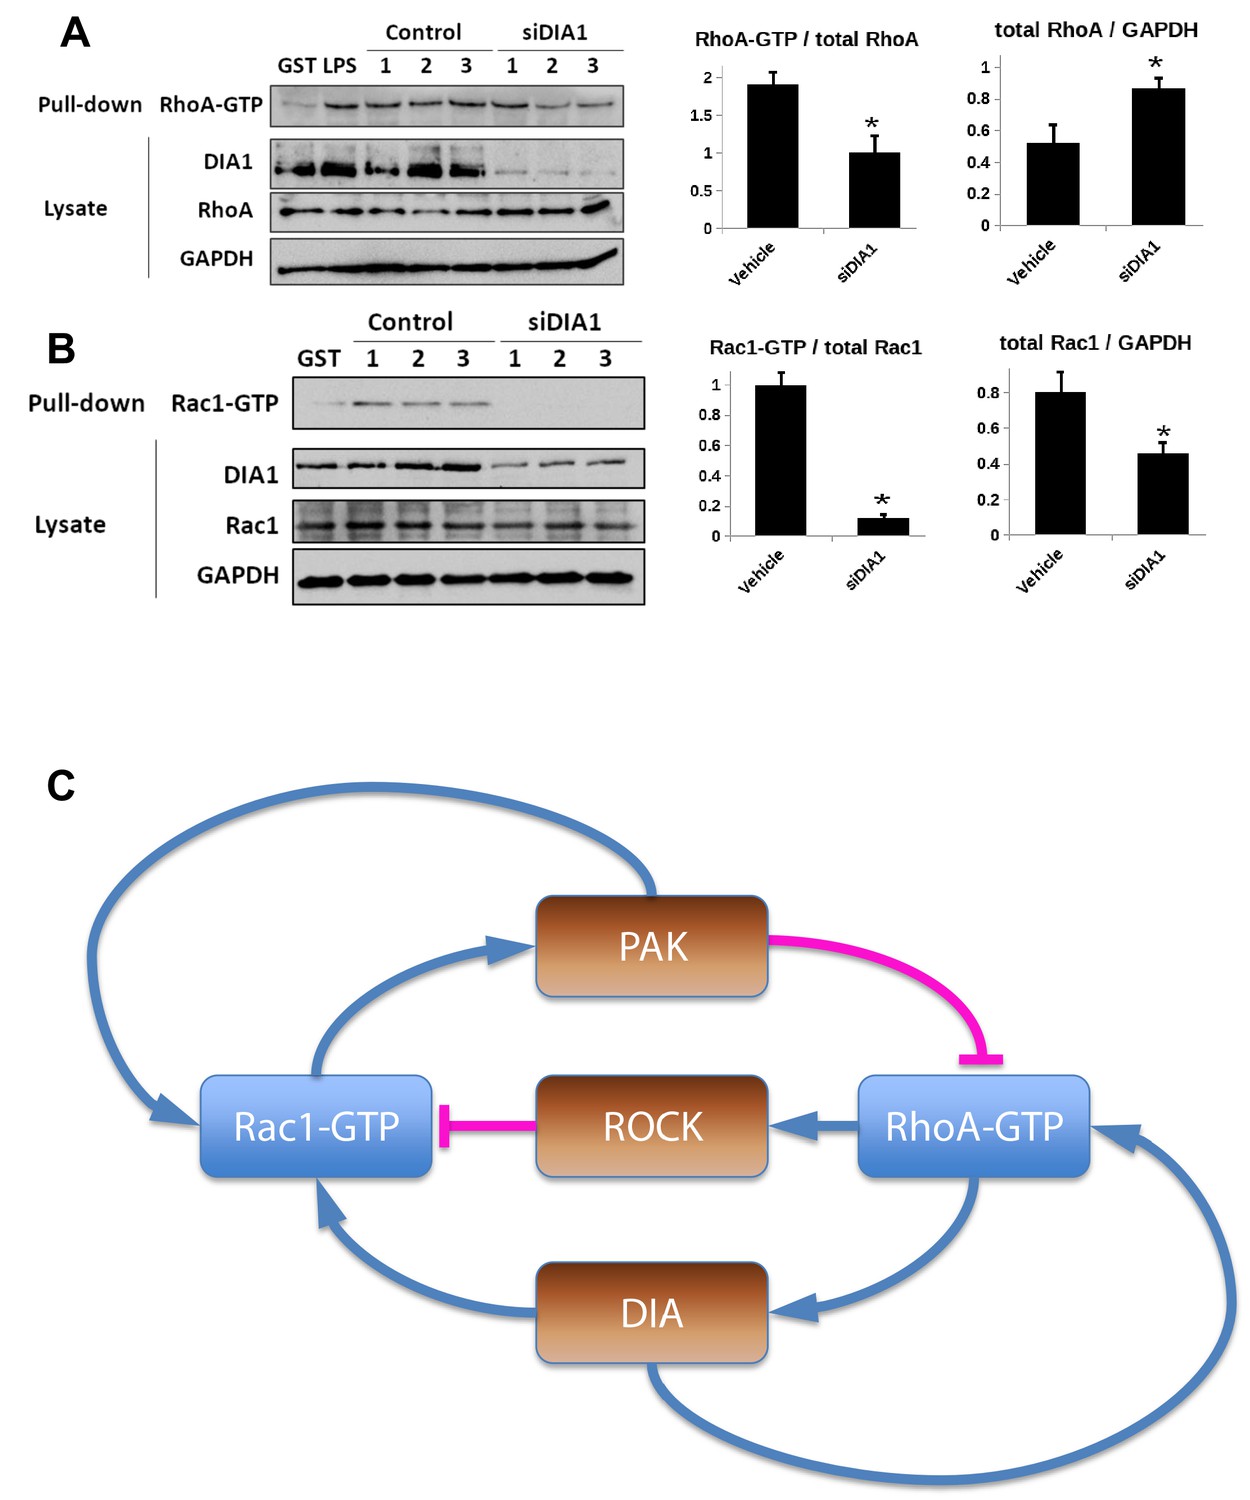
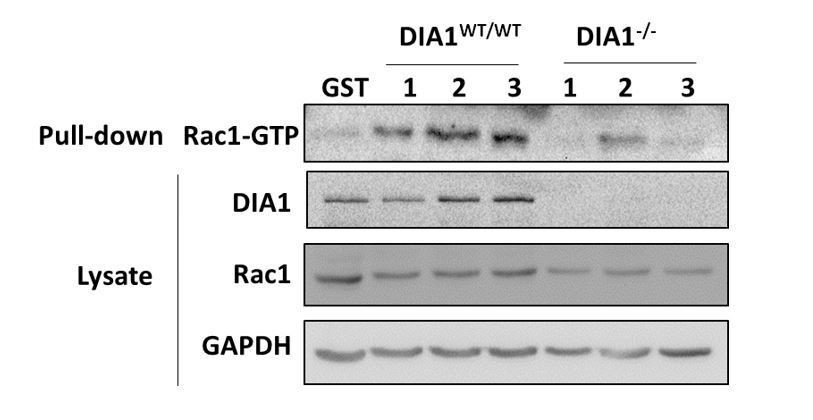
Elucidation of the topology of the RhoA GTPase network: DIA knockdown influence on the GTPase activities.
(A, B) Pulled-down active forms of RhoA (RhoA-GTP) and Rac1 (Rac1-GTP) and the abundances of DIA, RhoA and Rac1 were measured by western blot in cells transfected with non-targeting siRNA (control) or siRNA against DIA1 (siDIA1). GST beads were used as negative control, and lipopolysaccharide (LPS) treatment known to activate RhoA was used as positive control for the RhoA-GTP pull-down assay. Numbers 1, 2 and 3 indicate biological replicates. GAPDH was used as loading control. Quantified abundances of RhoA and Rac1 and their relative activities (normalized by the abundances) are shown by bar plots, Asterisks (*) indicate p<0.05 calculated using unpaired t-test. (C) Schematic diagram of positive and negative influences in the RhoA-Rac1 network.
Figure 2 with 3 supplements
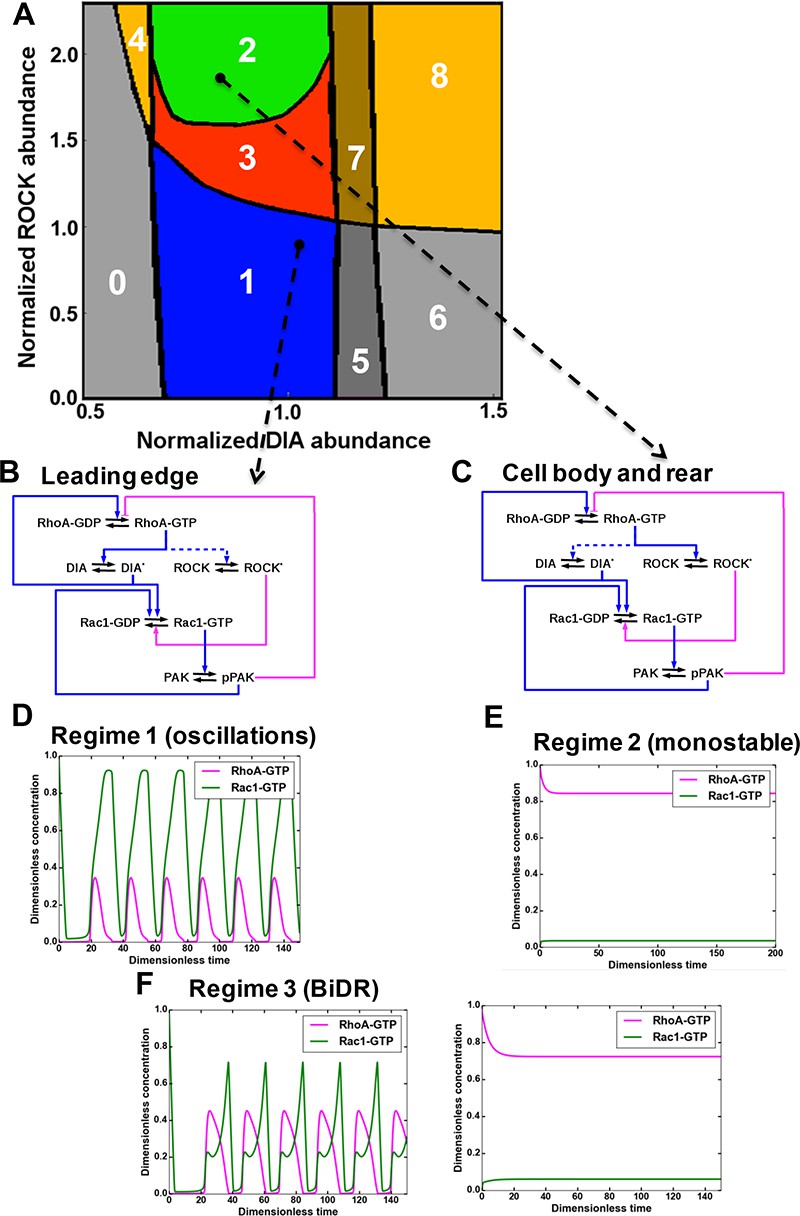
A mathematical model of the RhoA-Rac1 network predicts dramatically distinct dynamic regimes for different DIA and ROCK abundances.
(A) Distinct dynamic regimes of the RhoA-Rac1 network dynamics for different DIA and ROCK abundances. Oscillations of RhoA and Rac1 activity exist within area 1 (regime 1). In area 3, sustained GTPase oscillations and a stable steady state with high RhoA and low Rac1 activities coexist. Regimes 0, 2, 5 and 6 have only one stable steady state. Notably, regime 2 is excitable. Steady state solutions with high RhoA activity exist in areas 2–4, and 6–8. Stable steady state solutions with high Rac1 activity exist in areas 0 and 5–8. Regimes 4, 7 and 8 are bistable with two stable steady states. (B, C) Wiring diagrams of the RhoA-Rac1 network for the cell leading edge (B) and the cell body and rear (C). Dashed blue lines indicate weak activating connections. (D–F) Typical time courses of RhoA and Rac1 activity in regimes 1 (D), and 2 (E). (F) In area 3, depending on the initial state, the GTPase network evolves either to a stable steady state (right) or a stable oscillatory regime (left).
Figure 2—figure supplement 1
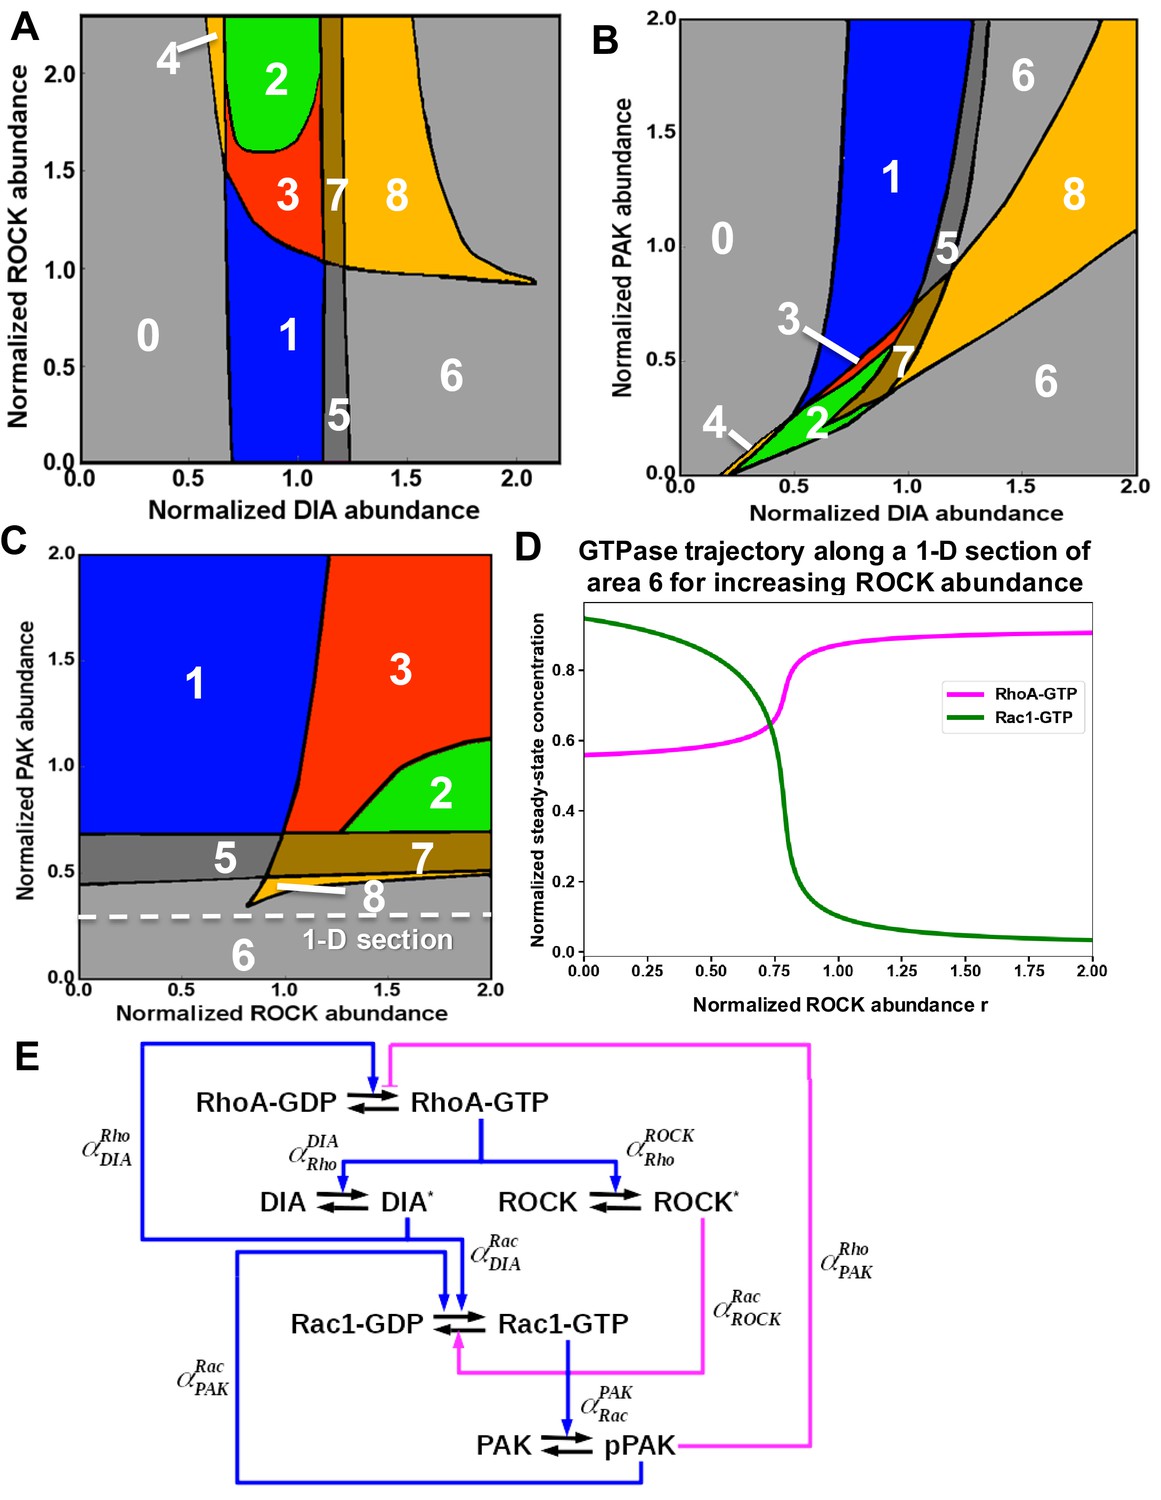
Distinct dynamic regimes of the RhoA-Rac1 network for different effector abundances.
Domains of the distinct RhoA-Rac1 dynamics partition the planes of the abundances of (A) ROCK and DIA, (B) PAK and DIA, (C) PAK and ROCK. (D) Steady-state RhoA-GTP and Rac1-GTP dependences on the ROCK abundance are presented along a 1-D section of the PAK, ROCK plane (, Equation 12) shown by white dashed line in (C). The amoeboid shape characterized by high RhoA activity emerges in mono-stable region 6 corresponding to the high RhoA-GTP and low Rac1-GTP when ROCK is non-inhibited. (E) Wiring diagram of the RhoA-Rac1 signaling network where the dimensionless multipliers, , specify the regulatory influence of protein Y on protein X (see Star*Materials and methods for details).
Figure 2—figure supplement 2
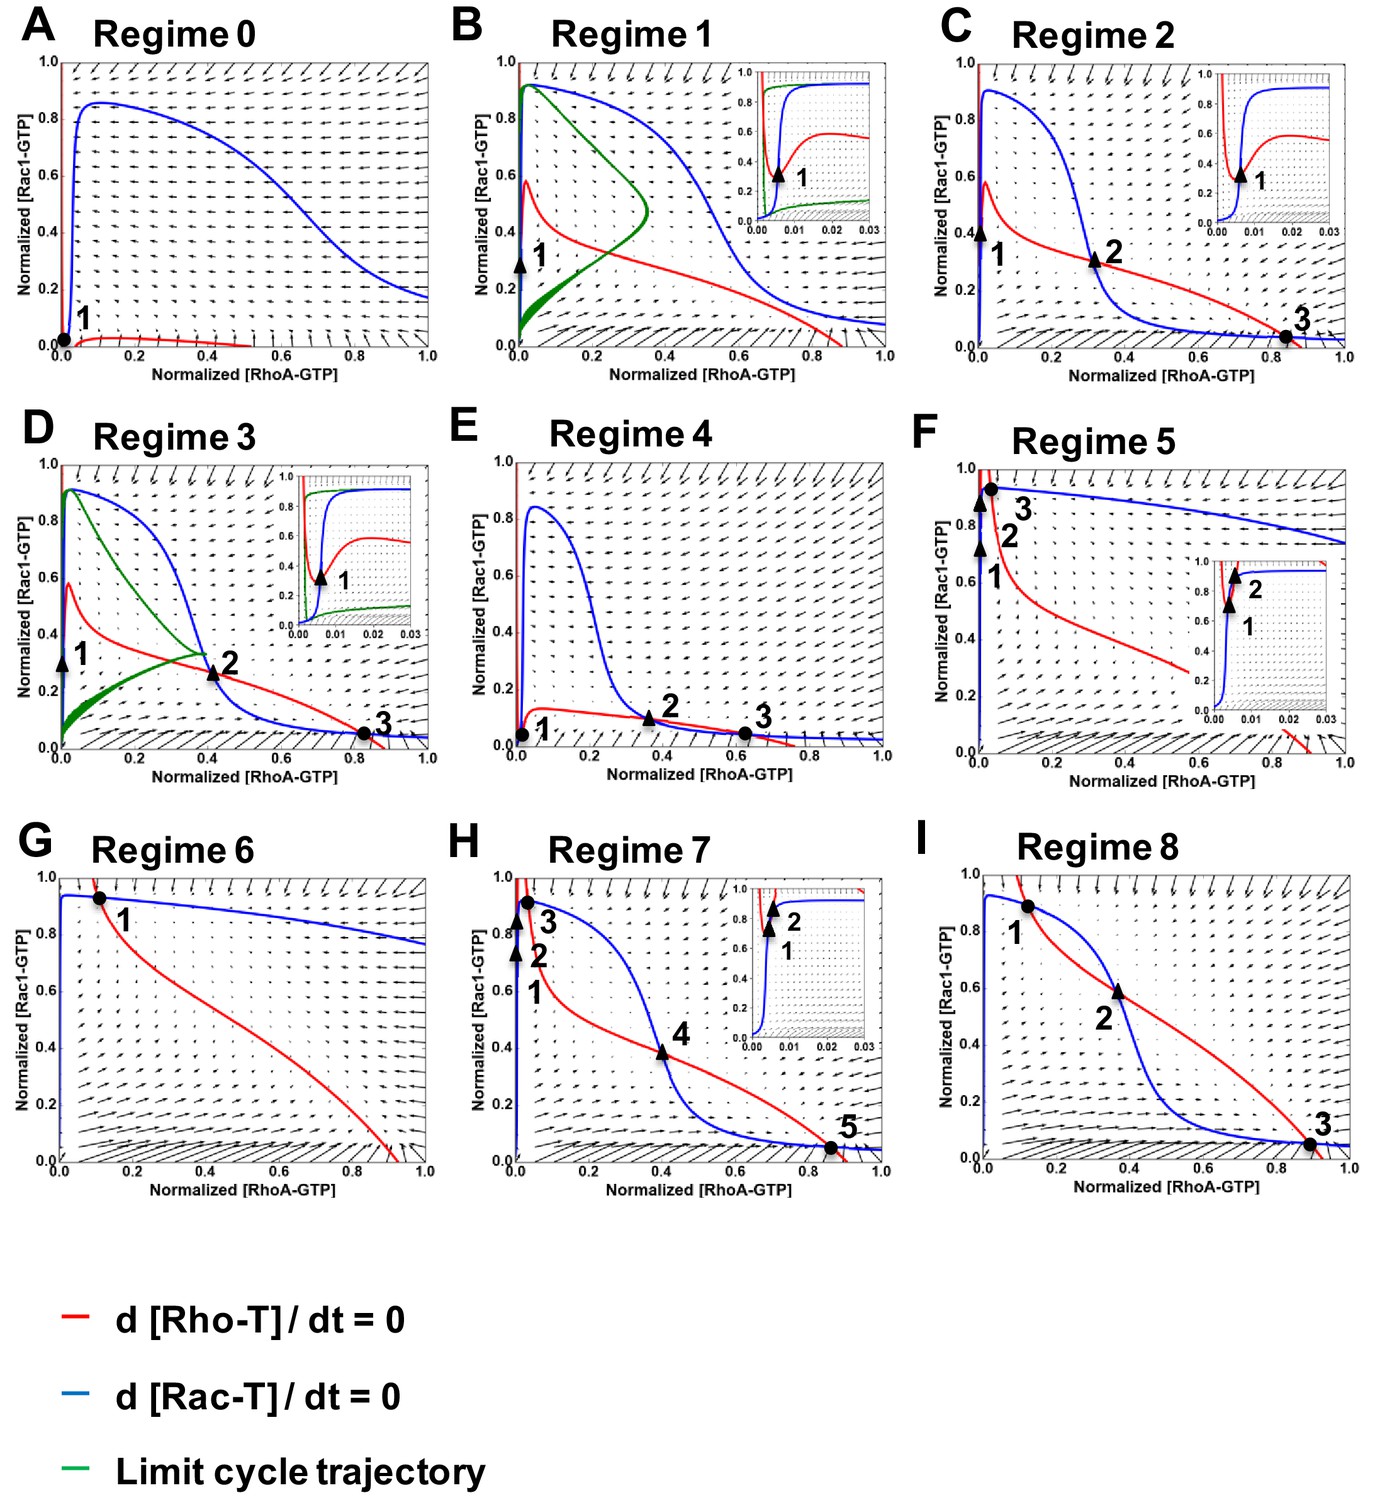
Nullclines and vector fields describing the nine dynamic regimes of RhoA-GTP and Rac1-GTP shown in Figure 2A.
(A–I) Nullclines and vector fields are calculated for a 2-D system given by Equation 12 for regimes 0–8, as indicated. The RhoA-GTP and Rac1-GTP nullclines are shown by red and blue curves, respectively. Projections of limit cycles of a 5-D system in Equation 6 into a 2-D space of the RhoA and Rac1 activities are shown by green curves. Circles show stable steady states; triangles represent unstable steady states. Inserts in panels (B–D, F, H) show the area near y-axis at a larger magnification.
Figure 2—figure supplement 3
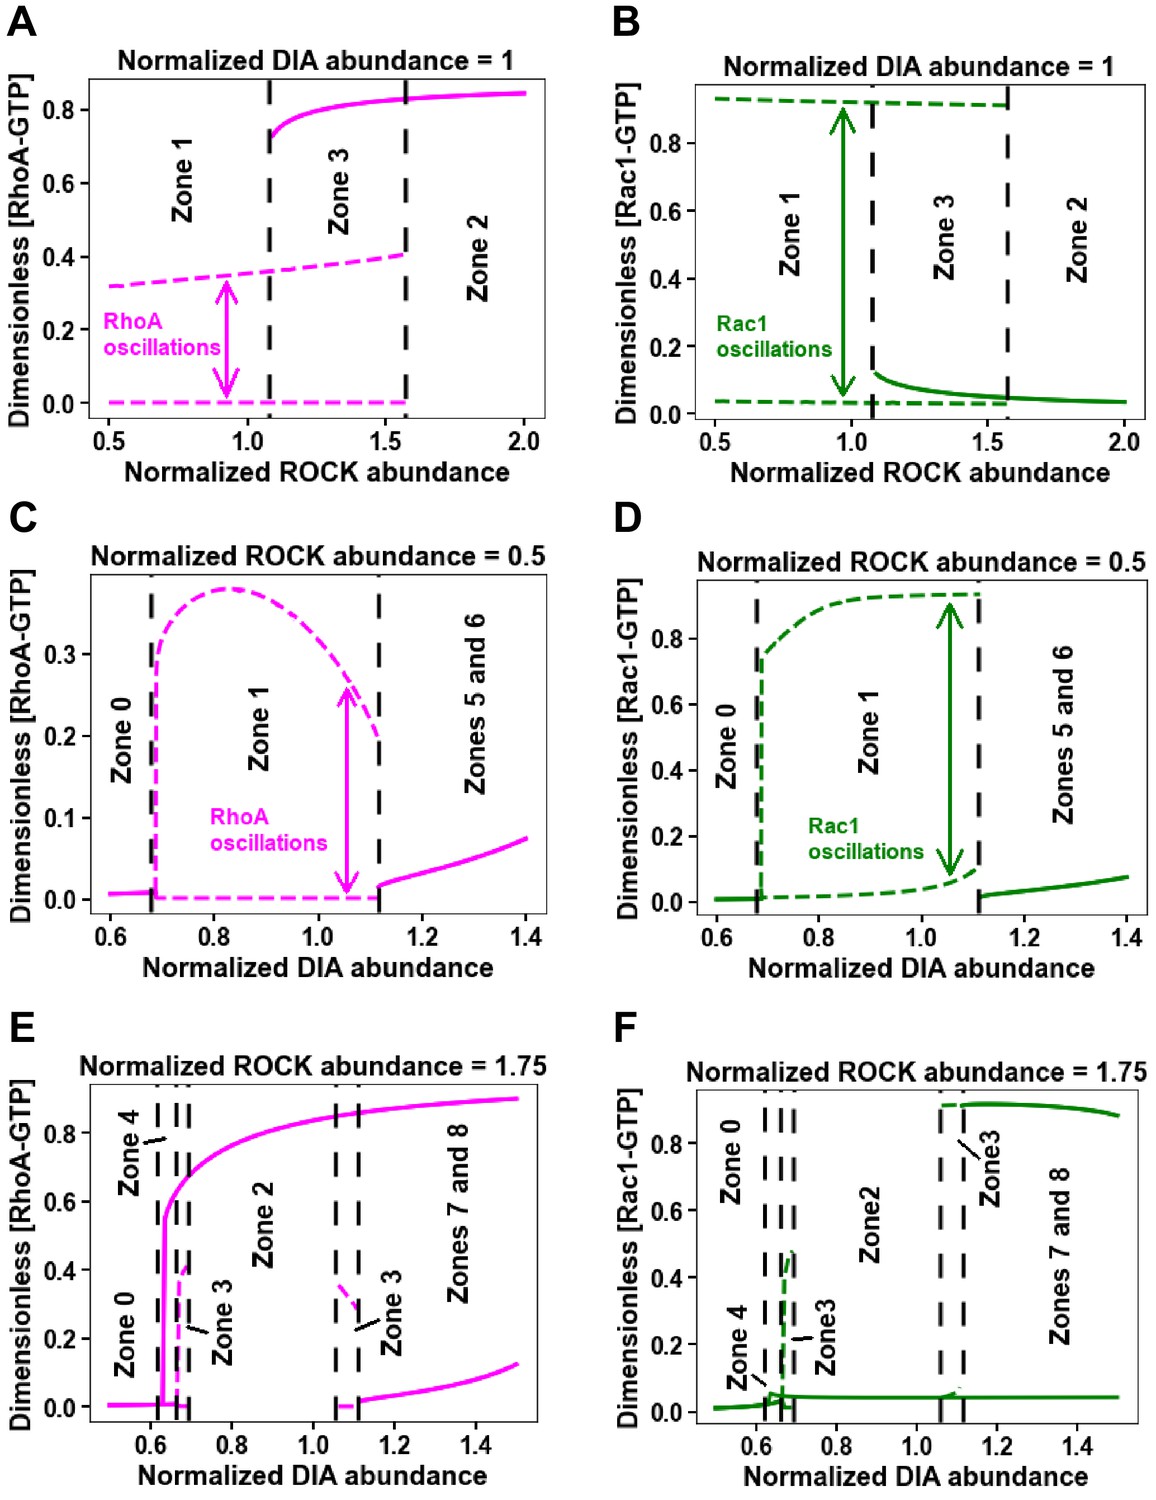
One-parameter bifurcation diagrams for changing ROCK and DIA abundances separately in Figure 2A.
(A–F) Minimum and maximum values of RhoA (A, C, E) and Rac1 (B, D, F) activity for the oscillatory regimes (dashed lines) and steady state values of RhoA (A, C, E) and Rac1 (B, D, F) activity (solid lines) are plotted against DIA (C–F) and ROCK (A–B) abundances. Black dashed lines represent borders of corresponding zones in Figure 2A.
Figure 3 with 1 supplement
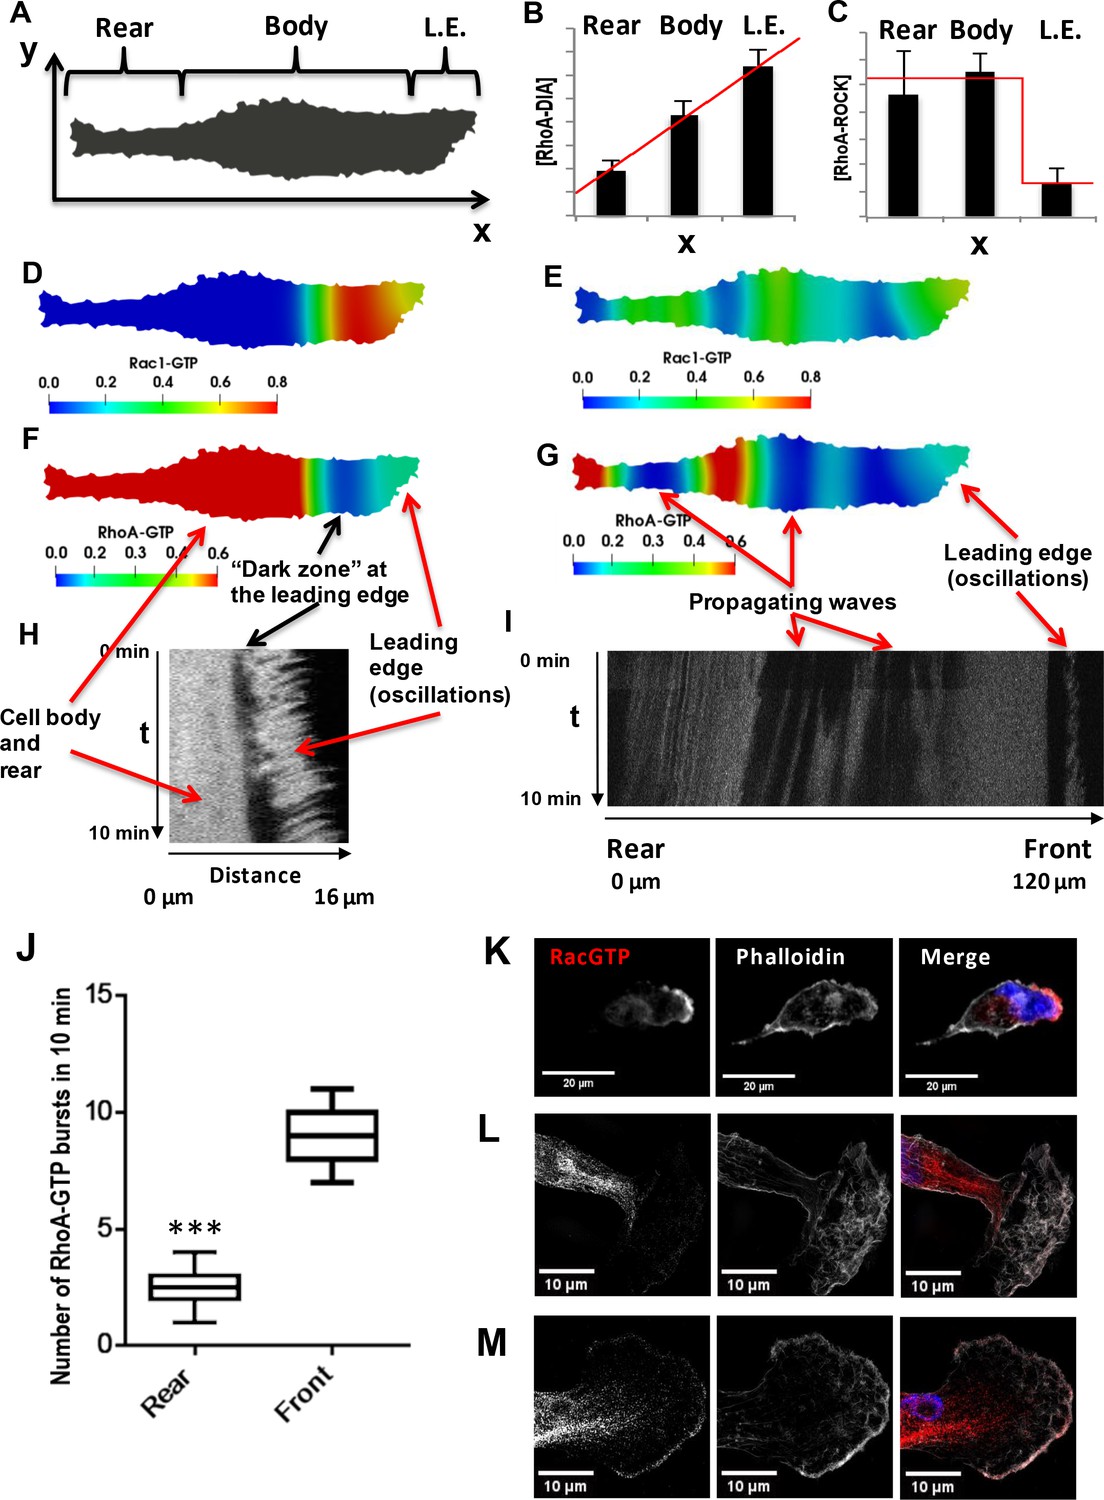
Spatial propagation of RhoA and Rac1 activities during cell motility.
(A) A 2-D calculation domain obtained by digitizing cell images. Different cellular compartments are indicated. The x-axis represents the direction of cell polarization, the y-axis represents the perpendicular direction. (B, C) The abundance profiles of DIA and ROCK used in simulations (red lines) are superimposed on the experimental spatial profiles (bar graphs in Figure 1C and D). (D–G) Model-predicted spatial patterns of the RhoA and Rac1 activities for different phases of the cell movement cycle. (D, F) Rac1 and RhoA activity snapshots during a protrusion-retraction cycle at the leading edge (t = 175 s from the start of the moving cycle). (E, G) represent snapshots when the Rac1 and RhoA activity wave have spread over the entire cell, reaching the rear (t = 1518 s). (H) The RhoA activity at the leading edge and cell body during a protrusion-retraction phase measured by RhoA FRET probe in space and time. The arrows compare model-predicted and experimentally measured patterns, indicating zones of RhoA oscillatory and high constant activities and a ‘dark zone’ of low RhoA activity. (I) Spatiotemporal pattern of the RhoA activity during further RhoA wave propagation into the cell. (J) The number of RhoA activity bursts at the cell body and rear during 10 min measured using the RhoA FRET probe. Error bars represent 1st and 3rd quartiles, *** indicate p<0.001 calculated using unpaired t-test. (K–M) Fluorescent microscopy images of Rac1 activity (red), combined with staining for F-actin (phalloidin, white) and the nucleus (DAPI, blue) in fixed cells for different phases of the cell movement cycle; (K) a protrusion-retraction cycle at the leading edge, and (L, M) present Rac1 activity wave propagation into the cell body. The images (L, M) were obtained by super-resolution microscopy.
Figure 3—figure supplement 1
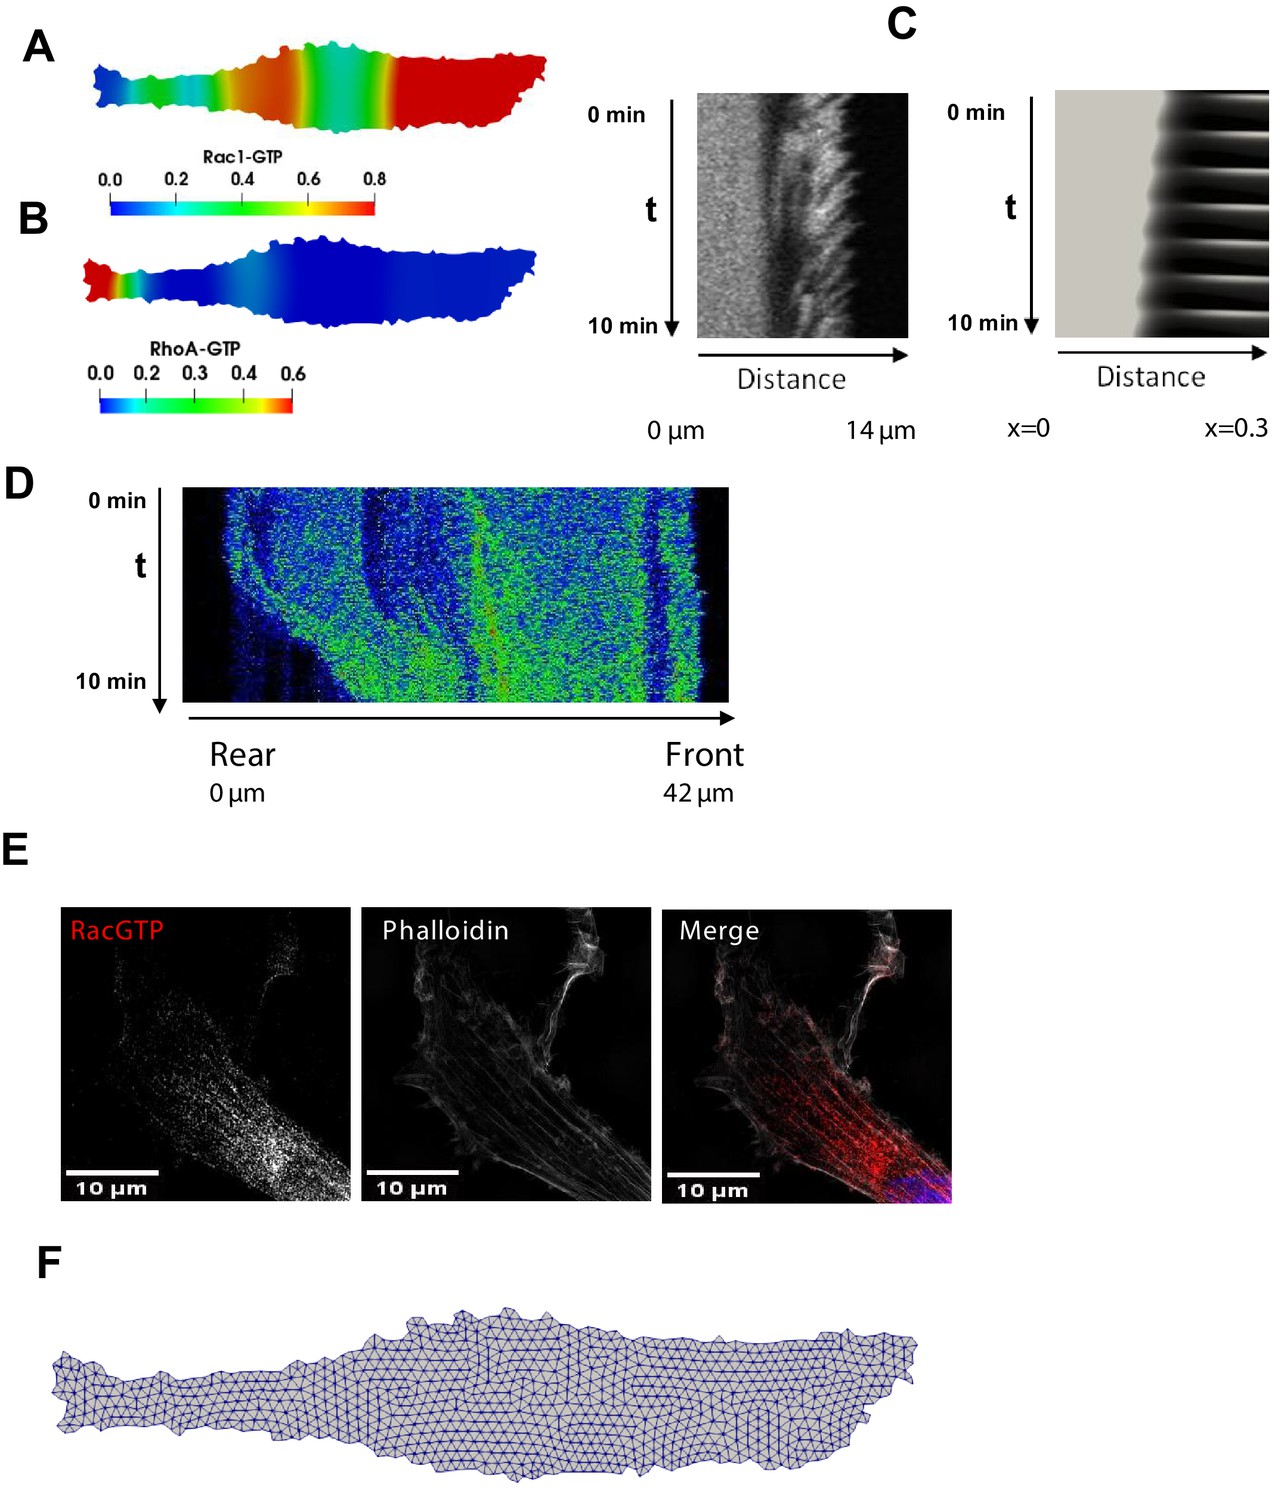
Spatial propagation of RhoA and Rac1 activities during cell motility.
(A, B) Model-predicted snapshots of the RhoA and Rac1 activities for the final phase of the cell movement cycle, when the RhoA-Rac1 wave has reached the cell rear. (C) A different biological replicate of a kymograph of the RhoA dynamics measured by RhoA FRET probe during a protrusion-retraction phase and the corresponding kymograph of the RhoA dynamics at the leading edge and cell body predicted by the model. (D) Spatiotemporal pattern of the RhoA activity during the rear contraction. (E) A different biological replicate of a super-resolution fluorescent microscopy image of Rac1 activity (red), combined with staining for F-actin (phalloidin, white) and the nucleus (DAPI, blue) in fixed cells. The image shows the Rac1 activity wave propagation into the cell body. (F) Computational mesh used in calculations for a given cell shape.
Figure 4 with 1 supplement
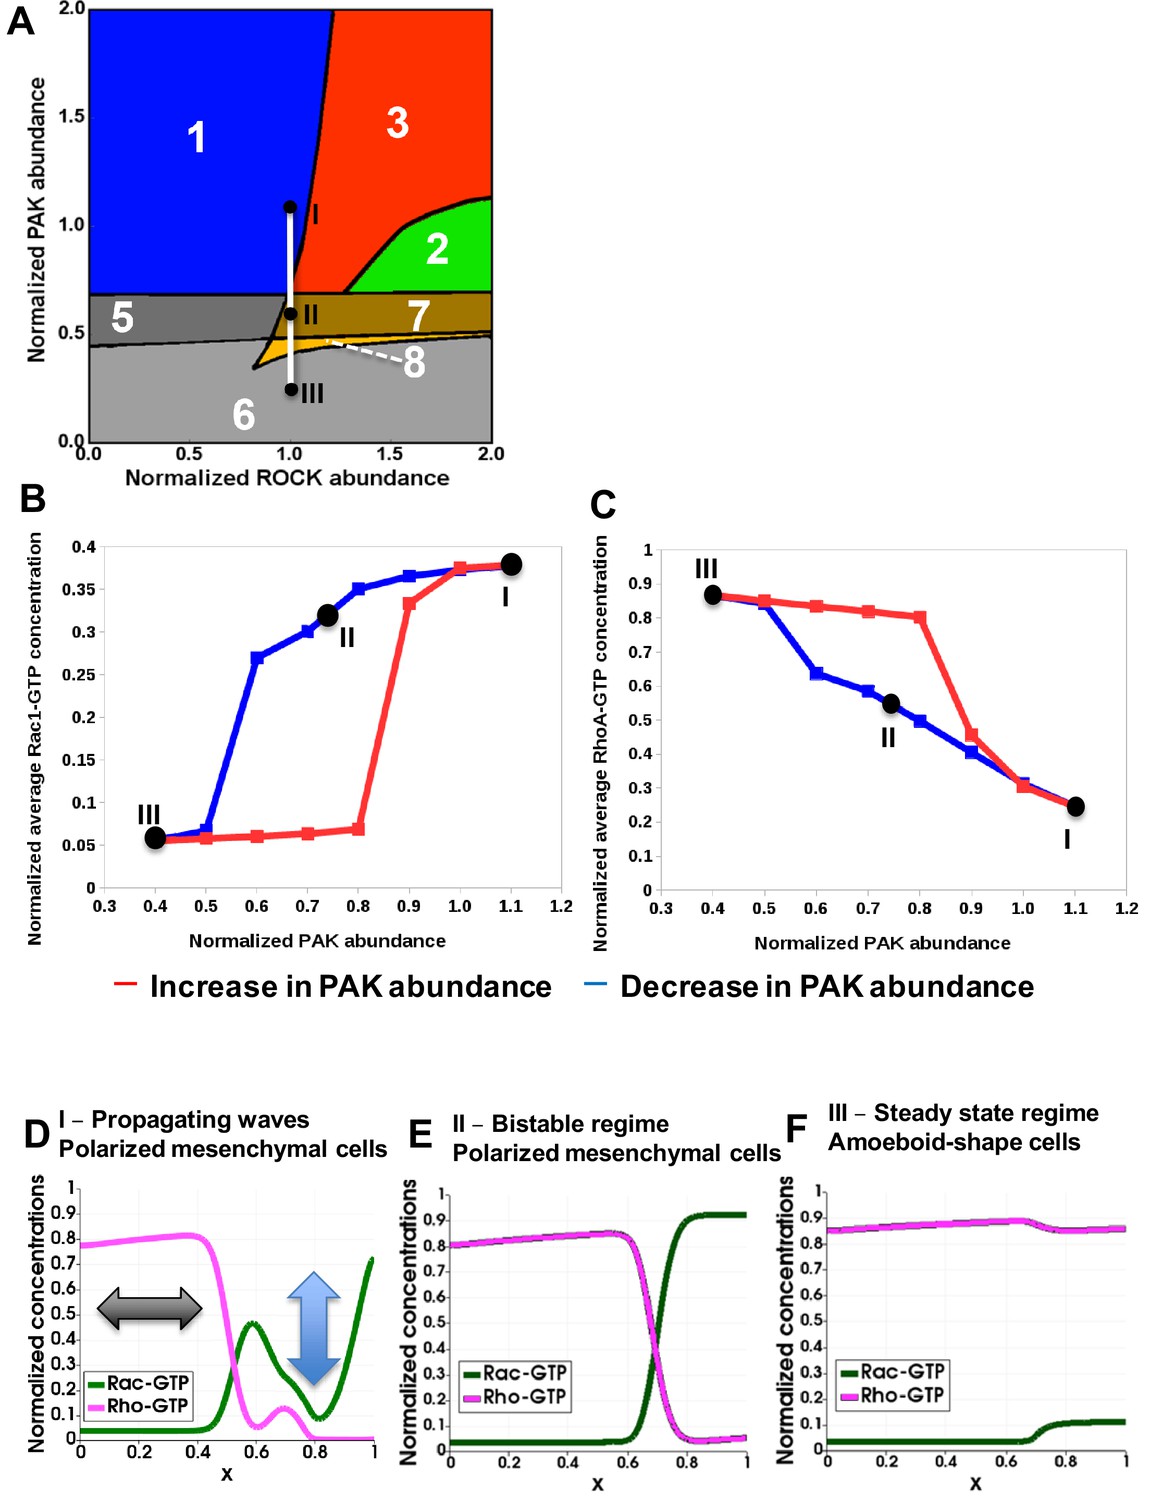
Hysteresis of the RhoA and Rac1 activities are manifested upon PAK inhibition and recapitulated by a spatiotemporal model.
(A) Distinct dynamic regimes of the RhoA-Rac1 network for different DIA and ROCK abundances. Colors and numbers of dynamic regimes are the same as in Figure 2A. (B, C) Model-predicted dependencies of the RhoA and Rac1 activities on the PAK abundance for gradually decreasing (blue) and increasing (red) PAK abundances. The network evolution occurs through two different routes (blue and red curves in B and C). It is calculated by averaging the GTPase activities over the time and cell volume based on western blot data reported in our previous study (Byrne et al., 2016). Points I, II and III shown in black (A) are also indicated on the network trajectories (B, C). (D–F) Snapshots of simulated RhoA-GTP and Rac1-GTP spatiotemporal patterns that emerge for different PAK abundances are shown for a 1-D section of a cell. The x axis corresponds to the normalized cell length (Figure 3A). Arrows in panel (D) illustrate oscillations and the wave propagation along a cell.
Figure 4—figure supplement 1

Hysteresis of the RhoA and Rac1 activities are manifested upon PAK inhibition.
(A, B) Model-predicted dependencies of the RhoA and Rac1 activities on the concentration of PAK inhibitor () for gradually increasing (blue) and decreasing (red) PAK inhibitor concentrations. The network evolution occurs through two different routes (blue and red curves in, panels A and B). It is calculated by averaging the GTPase activities over time and the cell volume based on Western blot measurements in our previous work (Byrne et al., 2016).
Figure 5 with 1 supplement
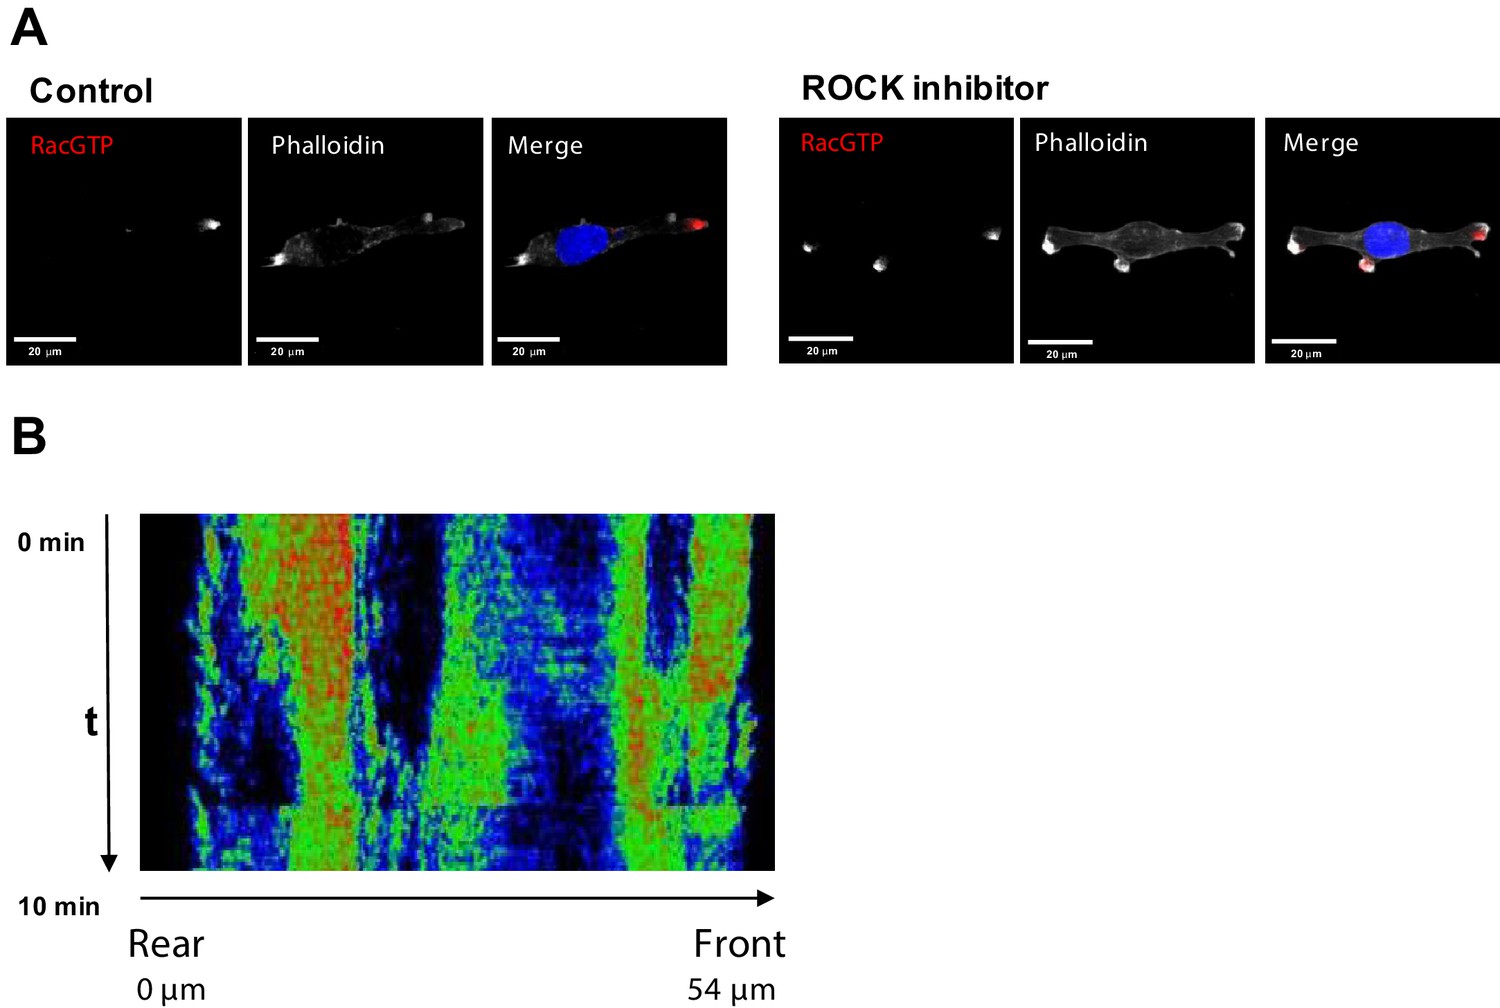
Inhibition of ROCK leads to the formation of multi-polar cells.
(A) Fluorescent microscopy images of Rac1 activity (red), and F-actin (phalloidin, white) and nuclear (DAPI, blue) staining in fixed MDA-MB-213 cells treated or not with 2.5 µM Y-27632 ROCK inhibitor for 15 min. (B) Spatiotemporal pattern of the RhoA activity in cells treated with 2.5 µM of ROCK inhibitor Y-27632 measured by the RhoA FRET probe.
Figure 5—figure supplement 1

Inhibition of ROCK leads to the formation of multi-polar cells.
(A) A different biological replicate of fluorescent microscopy image of Rac1 activity (red), and F-actin (phalloidin, white) and nuclear (DAPI, blue) staining in fixed MDA-MB-213 cells treated with 2.5 µM Y-27632 ROCK inhibitor for 15 min. (B) Model-predicted numbers of RhoA activity bursts during 10 min at the leading edge and the rear for control cells and cells where ROCK was inhibited by 2.5 μM of Y-27632. (C) The number of experimentally observed RhoA activity bursts during 10 min measured using the RhoA FRET probe at the leading edge and the rear for control cells and cells treated with the ROCK inhibitor Y-27632. Error bars represent 1st and 3rd quartiles, asterisks *** indicate p<0.001 calculated using unpaired t-test. (D) Quantification of the total distance travelled by the control cells and cells treated with a ROCK inhibitor. Results were similar for two different ROCK inhibitors, 10 μM Y-27632 and 1 μM GSK269962A. (E) Model predicted lower threshold of DIA abundance for induction of RhoA-Rac1 oscillations (region 1 in Figure 2A) in control and DIA knockdown conditions. DIA knockdown conditions were modeled by changing of RhoA and Rac1 abundance according to experimental data (Figure 1—figure supplement 1, panels A and B).
Author response image 1
Videos
Video 1
Model-predicted spatiotemporal activity patterns of RhoA and Rac1.
Video 2
Live-cell imaging of cel movement cycles.
Red color represents staining of the nuclei. Frame increment is 10 min.
Video 3
Model-predicted spatiotemporal activity patterns of RhoA and Rac1 when ROCK is inhibited by 2.5 μM of Y-27632.
Video 4
Live-cell imaging of cellular movement cycles in cells treated with 10 μM Y-27632 ROCK inhibitor.
Red color represents staining of the nuclei.
Tables
Key resources table
| Reagent type (species) or resource | Designation | Source or reference | Identifiers | Additional information |
|---|---|---|---|---|
| Antibody | Anti-Rac1 clone 23A8 (Mouse monoclonal) | Millipore | cat.05–389 | (1:500) |
| Antibody | Anti-RhoA (26C4) (Mouse monoclonal) | Santa-Cruz Biotechnology | cat.sc-418 | (1:200) |
| Antibody | anti-GAPDH (D16H11) XP (Rabbit monoclonal) | CST | cat.5174 | (1:3000) |
| Antibody | anti-DIA1 (Rabbit polyclonal) | Thermo | cat.PA5-21409 | WB (1:1500) IF (1:200) |
| Antibody | anti-ROCK1 (Rabbit polyclonal) | Thermo | cat.PA5-22262 | (1:100) |
| Antibody | anti-Rac-GTP (Mouse monoclonal) | New East Bio | cat.26903 | (1:100) |
| Antibody | Anti-mouse F(ab')2 Fragment Alexa Fluor 647 (Goat polyclonal) | Thermo | cat. A-21237 | (1:400) |
| Antibody | Anti-rabbit F(ab')2 Fragment Alexa Fluor 594 (Goat polyclonal) | Thermo | cat. A-11072 | (1:400) |
| Antibody | Anti-rabbit Alexa Fluor-488 (Donkey polyclonal) | Thermo | cat. A-21206 | (1:250) |
| Antibody | Anti-rabbit Alexa Fluor-594 (Goat polyclonal) | Thermo | cat. A-11012 | (1:250) |
| Antibody | Anti-rabbit IgG, HRP-linked (Goat polyclonal) | CST | cat.7074 | (1:10000) |
| Antibody | Anti-mouse IgG, HRP-linked (Horse polyclonal) | CST | cat.7076 | (1:10,000) |
| Strain, strain background (Lentivirus) | IncuCyte NucLight Red Lentivirus Reagent | Essen | Cat. 4625 | |
| Chemical compound, drug | Y-27632 | Sigma Aldrich | Cat.Y0503 | |
| Chemical compound, drug | GSK 269962 | Selleckchem | Cat.S7687 | |
| Chemical compound, drug | 4,6-Diamidino-2-phenylindole dihydrochloride (DAPI), stain | Sigma Aldrich | Cat.10236276001 | (1 µg/ml) |
| Chemical compound, drug | Rhodamine Phalloidin | Thermo | Cat. R415 | |
| Chemical compound, drug | Phalloidin- Alexa Fluor-488 | Thermo | Cat. A12379 | |
| Chemical compound, drug | Puromycin | Sigma Aldrich | Cat. P8833 | |
| Chemical compound, drug | Polibrene | Millipore | Cat.TR-1003-G | |
| Chemical compound, drug | Lipofectamine RNAiMax | Thermo | Cat.13778 | |
| Other | GST-Beads | Sigma Aldrich | G.4510 | |
| Other | Dulbecco’s Modified Eagle Medium (DMEM) | Sigma Aldrich | Cat.D6429 | |
| Other | FluoroBrite DMEM Media | Thermo | Cat. A1896701 | |
| Other | Fetal Bovine Serum (FBS) | Gibco | Cat.10270 | |
| Other | Collagen (rat tail) | Sigma Aldrich | Cat.11179179001 | |
| Cell line (Human) | MDA-MB-231 | ATCC | Cat.HTB-26 | Authenticated by the Beatson Institute, Glasgow, UK |
| Transfected Construct (Human) | DIAPH1 siRNA SMART Pool | Dharmacon | cat. L-010347-00-0010 | |
| Recombinant DNA reagent | GST-rhotekin-RBD | Dr. Mike Olson gift (Beatson Institute, Glasgow, UK) | ||
| Recombinant DNA reagent | GST-PAK-CRIB | Dr. Piero Crespo gift (IBBTEC,University of Cantanbria, Spain) | ||
| Recombinant DNA reagent | mTFP-YFP RhoA activity probe | Prof. Olivier Pertz Gift (Institute of Cell Biology, Bern, Switzerland) | ||
| Recombinant DNA reagent | psPAX-2 | Prof. Olivier Pertz Gift | ||
| Recombinant DNA reagent | VsVg | Prof. Olivier Pertz Gift | ||
| Software, algorithm | Fiji | Schindelin et al., 2012 | https://imagej.net/Fiji | |
| Software, algorithm | OpenFOAM | Weller et al., 1998 | https://www.openfoam.com/ | |
| Software, algorithm | ParaView | Ayachit, 2015 | https://www.paraview.org/ | |
| Software, algorithm | Salome | Ribes and Caremoli, 2007 | https://www.salome-platform.org/ | |
| Software, algorithm | Python | https://www.python.org/ | ||
| Software, algorithm | SciPy | Virtanen et al., 2020 | https://www.scipy.org/ | |
| Software, algorithm | MatplotLib | Hunter, 2007 | https://matplotlib.org/ | |
| Software, algorithm | OpenCV | Bradski, 2000 | https://opencv.org/ | |
| Software, algorithm | DYVIPAC | Nguyen et al., 2015 | https://bitbucket.org/andreadega/dyvipac-python/src/master/ | |
| Software, algorithm | BioNetGen | Blinov et al., 2004; Harris et al., 2016 | https://www.csb.pitt.edu/Faculty/Faeder/?page_id=409 |
Additional files
-
Source code 1
Scripts for building 1D and 2D bifurcation diagrams for ODE system (Equation 6).
See ‘description.txt’ file in the zip-archive for details.
- https://cdn.elifesciences.org/articles/58165/elife-58165-code1-v1.zip
-
Source code 2
Archive of the OpenFOAM source code for solving reaction-diffusion equations (Equation 12).
See ‘description.txt’ file in the zip-archive for details.
- https://cdn.elifesciences.org/articles/58165/elife-58165-code2-v1.zip
-
Supplementary file 1
Quantitative mass spectrometry data by Byrne et al., 2016 used to populate protein abundances in the mathematical model.
- https://cdn.elifesciences.org/articles/58165/elife-58165-supp1-v1.docx
-
Supplementary file 2
Parameter values (Equation 12).
- https://cdn.elifesciences.org/articles/58165/elife-58165-supp2-v1.docx
-
Transparent reporting form
- https://cdn.elifesciences.org/articles/58165/elife-58165-transrepform-v1.docx
Download links
A two-part list of links to download the article, or parts of the article, in various formats.
Downloads (link to download the article as PDF)
Open citations (links to open the citations from this article in various online reference manager services)
Cite this article (links to download the citations from this article in formats compatible with various reference manager tools)
Periodic propagating waves coordinate RhoGTPase network dynamics at the leading and trailing edges during cell migration
eLife 9:e58165.
https://doi.org/10.7554/eLife.58165


