Zebrafish Posterior Lateral Line primordium migration requires interactions between a superficial sheath of motile cells and the skin
- Section on Neural Developmental Dynamics, Division of Developmental Biology, Eunice Kennedy Shriver National Institute of Child Health and Human Development, National Institutes of Health, United States
- Advanced Imaging and Microscopy Resource, National Institutes of Health, United States
- Laboratory of High Resolution Optical Imaging, National Institute of Biomedical Imaging and Bioengineering, National Institutes of Health, United States
Figures
Figure 1 with 1 supplement

Superficial cells in the Zebrafish Posterior Lateral Line primordium.
(A) Z-projection of cells from a Tg(cldnb:lyn-egfp) embryo (green) transplanted into aTg(cldnb:lyn-mscarlet) (magenta) embryo. Dashed line indicates the position of the transverse section in B. (B) Transverse section of A showing position of green transplanted cells. (C) Superficial-Basal depth coding of the Tg(cldnb:lyn-gfp) cells shown in A and B. (D–F) Frames from a timelapse video (Figure 1—video 1) showing superficial membrane protrusions adjacent to the skin (arrowheads). All panels are processed Airyscan super-resolution images and represent top views of the primordium. Scale bars for D, E same as F.
Figure 1—video 1
Related to Figure 1.
Z-projection of a timelapse video of Tg(cldnb:lyn-gfp) (green) cells transplanted into Tg(cldnb:lyn-mscarlet) embryos, showing superficial membrane protrusions. Processed Airyscan video.
Figure 2 with 4 supplements
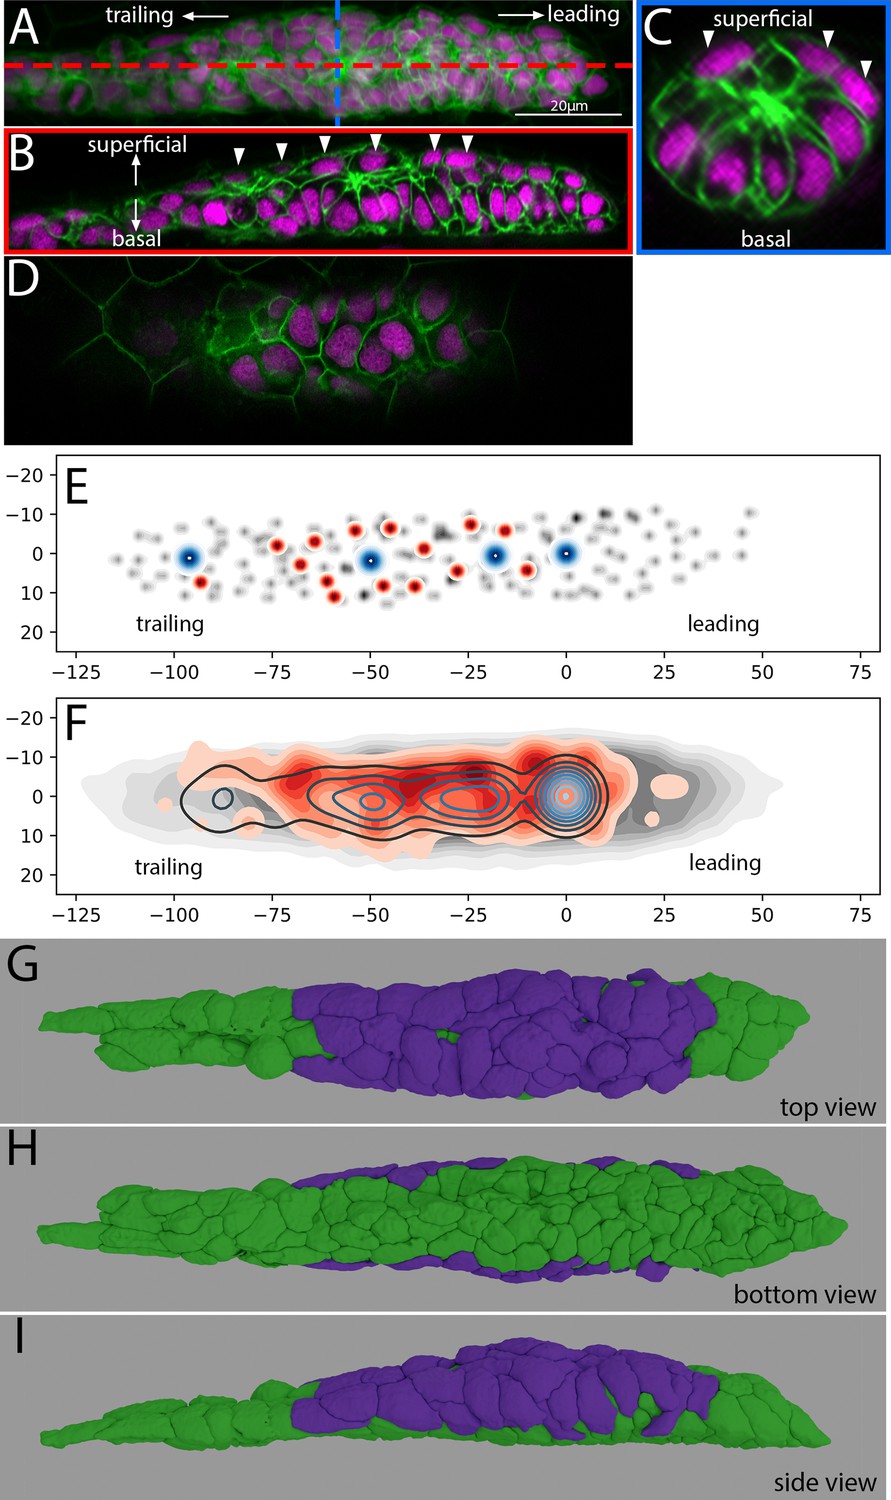
Location and morphology of superficial cells in the Zebrafish Posterior Lateral Line Primordium.
(A) Z-projection of the PLLp at ~32 hpf from a single deconvolved DiSPIM volume. Red and blue dashed lines indicate the position of cross-sections in B and C, respectively. Membranes are indicated in green and nuclei in magenta. (B) Length-wise section of the PLLp at the position indicated in by the red line in A. Arrowheads indicate superficial nuclei. (C) Cross-section of the PLLp at the position indicated by the blue line in A. Arrowheads indicate superficial nuclei. (D) Single processed Airyscan super-resolution confocal slice adjacent to the skin showing superficial nuclei. (E) Schematic of nuclear position in a single PLLp taken from an Airyscan-processed confocal stack. Gray dots indicate all PLLp nuclei, red dots indicate the position of superficial nuclei (see text for details), and blue dots indicate the position of protoneuromast apical constrictions. (F) Average of the positions of nuclei in n = 10 PLLp taken from Airyscan confocal stacks. PLLp were aligned based on the position of the leading-most protoneuromast. Gray indicates the position of all nuclei, red filled topo-lines indicate the position of superficial nuclei and blue open topo-lines indicate the position of protoneuromast apical constrictions. X and Y axes in E, F are distance in microns from the center of the first formed protoneuromast, located at 0,0. E,F are top view of the PLLp as in panel G. (G,H, I) 3D reconstruction of a DiSPIM volume of a ~32 hpf PLLp showing the superficial cells in magenta and the remaining cells in green in top (G), bottom (H), and side (I) views.
Figure 2—figure supplement 1

3D rendering of example cells from cell segmentation shown in Figure 2.
Two cells of each class (leading, protoneuromast, superficial) are shown. Relative positions in the PLLp are shown in the bottom panel. Enlargements of each cell are shown above from each orthogonal view (corresponding to the colored arrows in the bottom panel).
Figure 2—figure supplement 2

Surface area contacts and position of superficial cells in the Zebrafish Posterior Lateral Line primordium.
(A) Top panel: 3D rendering of PLLp. Superficial cells in magenta, protoneuromast cells in green and all other cells in gray. Bottom panels: Cross sections at the positions indicated in A showing internal PLLp cell boundaries in gray, and external cell boundaries in either magenta (for superficial cells) or green (for protoneuromast cells). (B) Boxplot of external (first two columns) and total surface area size (second two columns) for superficial and protoneuromast cells from the segmented PLLp shown in A. p-values are Mann-Whitney nonparametric U test. (C) 3D rendering of all segmented nuclei in the PLLp at t = 0 from Figure 2—video 2A. Box represents all nuclei within 40 µm (lengthwise) of the central protoneuromast in the PLLp, and includes the nuclei tracked in panels B-F. (D–F) Cross-section projections of the boxed area in A (from the perspective of the black arrow), showing each individual nuclear centroid track in a different color over 120 1-min timepoints (2 hr total). (D) Superficial nuclei tracks. (E) Protoneuromast nuclear tracks. (F) All nuclear tracks. (G–I) Heatmaps of the centroid positions of the nuclei in D-F, colored by whether the nucleus belongs to a superficial (magenta) or protoneuromast (green) cell (see panel A). To generate cross-section tracks in D-F, nuclear positions were normalized to the central apical constriction of the protoneuromast (which lies at 0,0 in all of the plots) to correct for migration of the primordium in the (X and Y plane), and a small rotation (~10° counter-clockwise) was imposed to compensate for asymmetries in the time-lapse data acquisition. See also Figure 2—video 2 for more details.
Figure 2—video 1
Related to Figure 2.
3D rendering of a reconstruction of the PLLp from confocal data showing superficial cells colored in magenta and remaining PLLp cells colored in green.
Figure 2—video 2
Related to Figure 2—figure supplement 1.
(A) 3D rendering of all nuclei in a PLLp over 2 hr of migration. (B) Cross-section of all nuclei in box in panel A. (C) Centroid tracks for all nuclei shown in panel B. (D-E) progressive heatmaps of nuclear centroid positions in C. (D) Superficial cell nuclei only. (E) Protoneuromast cell nuclei only. (F) overlay of superficial and protoneuromast cell nuclei. In all panels, magenta = superficial cells, green = protoneuromast cells, gray = all other cells.
Figure 3 with 4 supplements
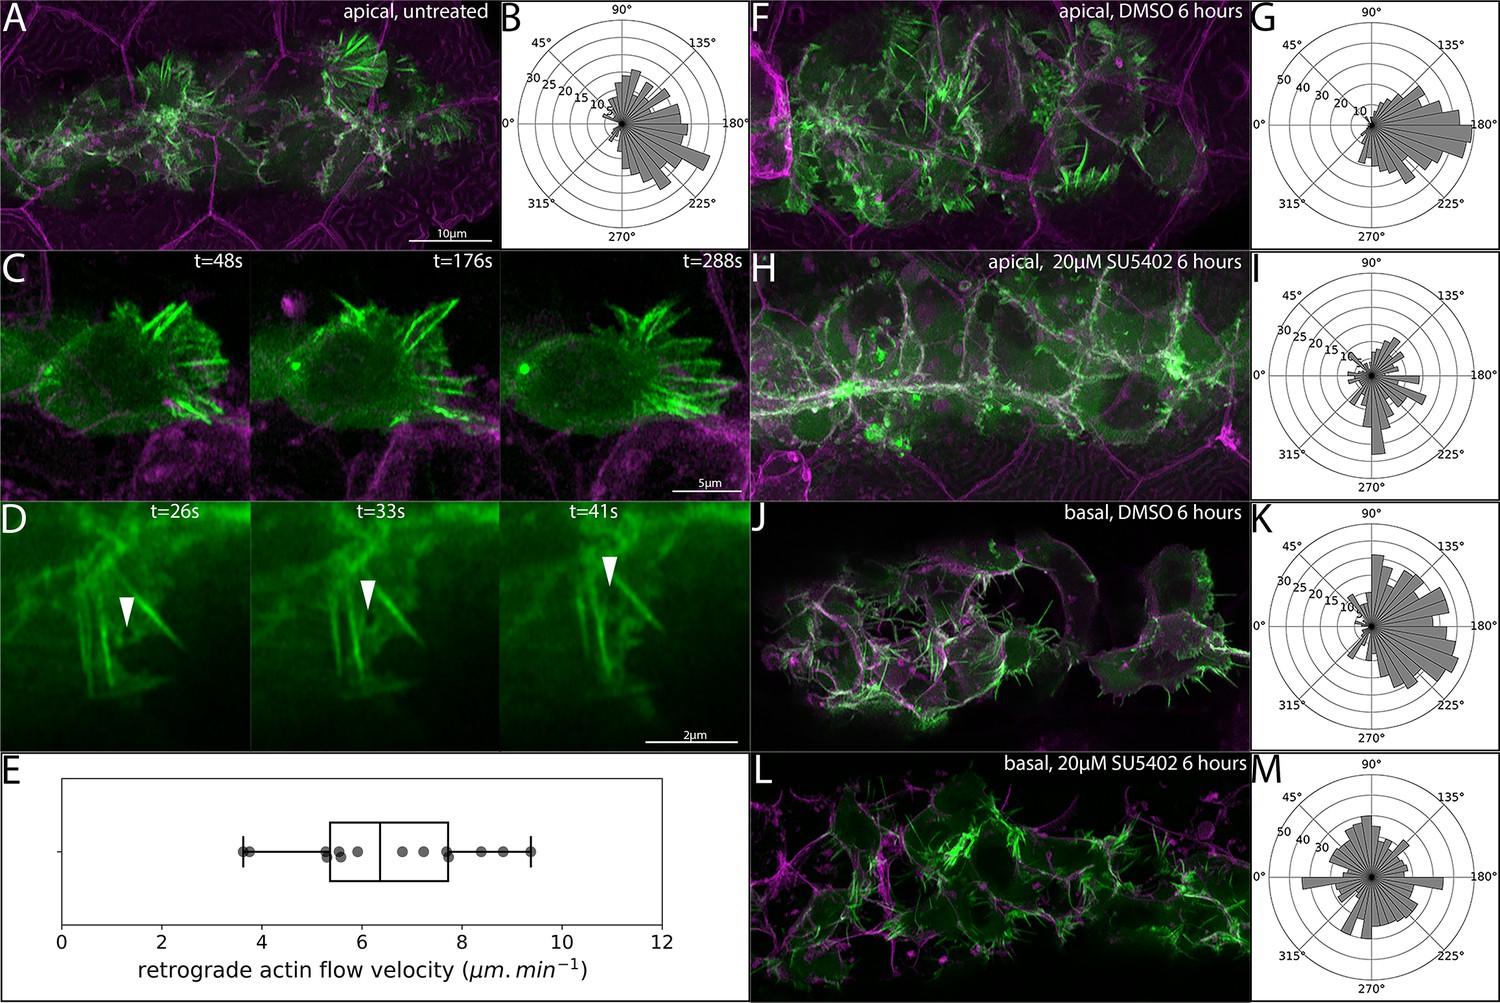
Orientation of superficial-cell Actin protrusions in untreated and Fgf-inhibited embryos.
(A) Maximum intensity projection of a confocal stack showing LifeAct-Citrine-positive projections (green) within 5 μm of the skin (magenta). (B) Quantification of the direction of superficial actin protrusions from timelapse videos. 180° (right) indicates the normal direction of PLLp migration. (C) Frames from a timelapse video showing a single TgBAC(cxcr4b:lifeact-citrine) cell adjacent to the overlying skin with polarized protrusive activity. (D) Series of frames from a timelapse video showing retrograde flow of LifeAct-Citrine in a superficial protrusion. (E) Boxplot of quantification of retrograde flow velocity in superficial protrusions. (F) Superficial LifeAct-Citrine-positive protrusions after 6 hr of treatment with DMSO. (G) Directionality of superficial protrusions after DMSO treatment. (H) Superficial LifeAct-Citrine-positive protrusions after 6 hr of treatment with 20 μM SU5402. (I) Directionality of superficial protrusions after SU5402 treatment. (J) Basal protrusions in TgBAC(cxcr4b:lifeact-citrine) transplants after 6 hr of treatment with DMSO. (K) Directionality of basal protrusions after DMSO treatment. (L) Basal protrusions in TgBAC(cxcr4b:lifeact-citrine) transplants after 6 hr of treatment with 20 μM SU5402. (M) Directionality of basal protrusions after SU5402 treatment. Scale bar for F,H,J,L is the same as A. All image panels are processed Airyscan super-resolution confocal images.
Figure 3—video 1
Related to Figure 3.
Z-projection of a timelapse video taken adjacent to the skin in TgBAC(cxcr4b:lifeact-citrine) (green); Tg(cldnb:lyn-mscarlet) (magenta) double transgenic embryos, showing superficial protrusive activity. Processed Airyscan video.
Figure 3—video 2
Related to Figure 3.
Z-projection of a timelapse video taken adjacent to the skin in an embryo where TgBAC(cxcr4b:lifeact-citrine) (green); Tg(cldnb:lyn-mscarlet) (magenta) double transgenic cells have been transplanted into Tg(cldnb:lyn-mscarlet) embryos, showing superficial protrusive activity from a single cell. Processed Airyscan video.
Figure 3—video 3
Related to Figure 3.
Z-projection of a timelapse video taken adjacent to the skin in TgBAC(cxcr4b:lifeact-citrine) embryos, showing rapid retrograde actin flow in the superficial protrusion. Processed Airyscan video.
Figure 3—video 4
Related to Figure 3.
Z-projection of an Airyscan timelapse video of TgBAC(cxcr4b:lifeact-citrine) (green); Tg(cldnb:lyn-mscarlet) (magenta) double transgenic embryos. Top panels represent superficial slices and bottom panels represent basal slices (in different embryos). Left hand panels are embryos that have been treated with DMSO for 6 hr, right hand panels are embryos that have been treated with 20 μM SU5402 for 6 hr. Processed Airyscan videos.
Figure 4 with 2 supplements

Posterior Lateral Line primordium migration after removal of the overlying skin.
(A–C) Frames from a timelapse video showing the skin (basal and periderm layers labeled by krt4:dsred) in magenta and the PLLp in green after skin removal and during subsequent healing. (D) Overlay of kymograph showing movement of the PLLp (green) and healing of the skin over the PLLp (magenta) along the migration course of the PLLp shown in A-C. (E) Kymograph of the PLLp alone. (F) Kymograph of the skin alone. (G) Quantification of the average migration speed of individual cells (n = 28) in three independent primordia with skin removed (orange dots) and after skin healing (blue dots). Red background indicates rostral movement, green background indicates caudal movement, p=2e−17 (paired sample t-test). (H) Quantification of average PLLp height before (green dots) and after (orange dots) skin removal. p=6e−7 (paired sample t-test, n = 11). Each gray line in G and H connects two paired measurements of the same PLLp or cell before and after manipulation.
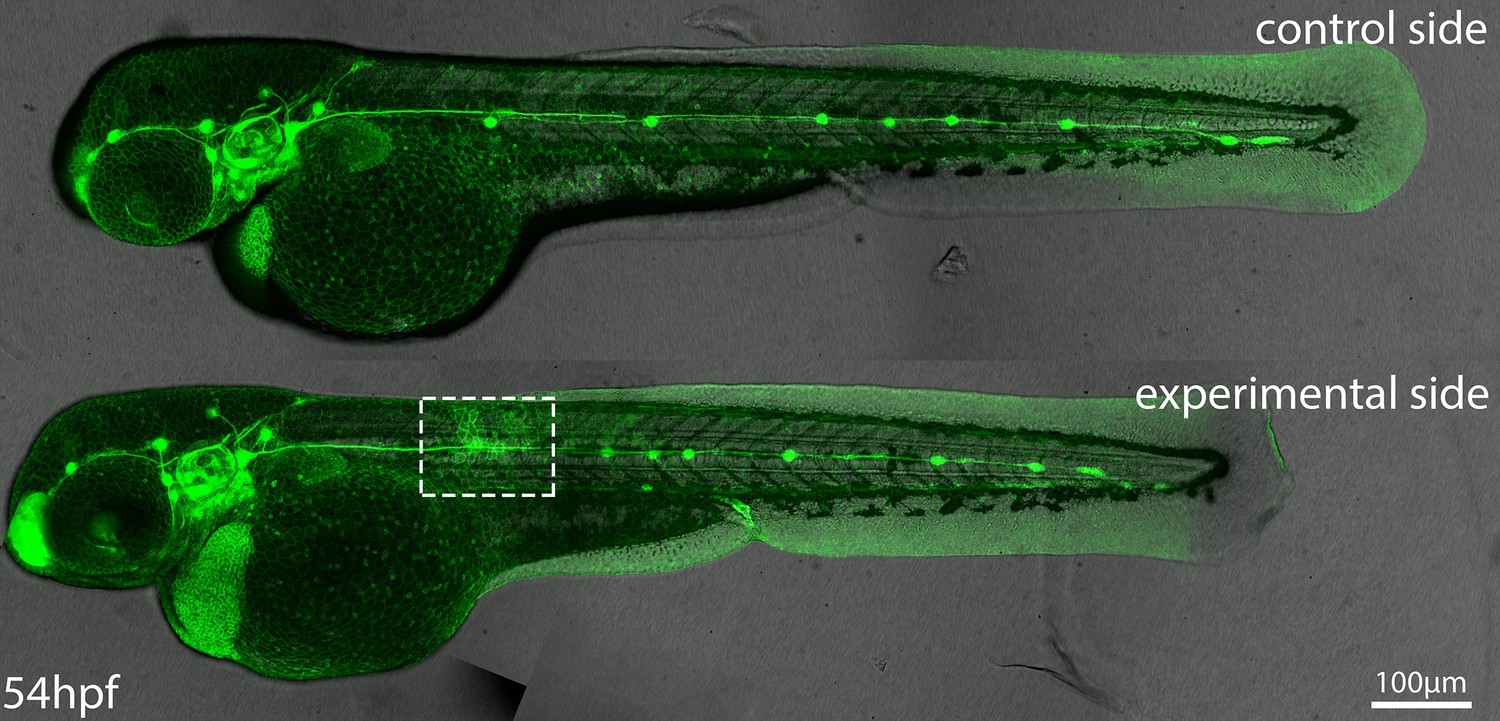
Figure 4—figure supplement 1
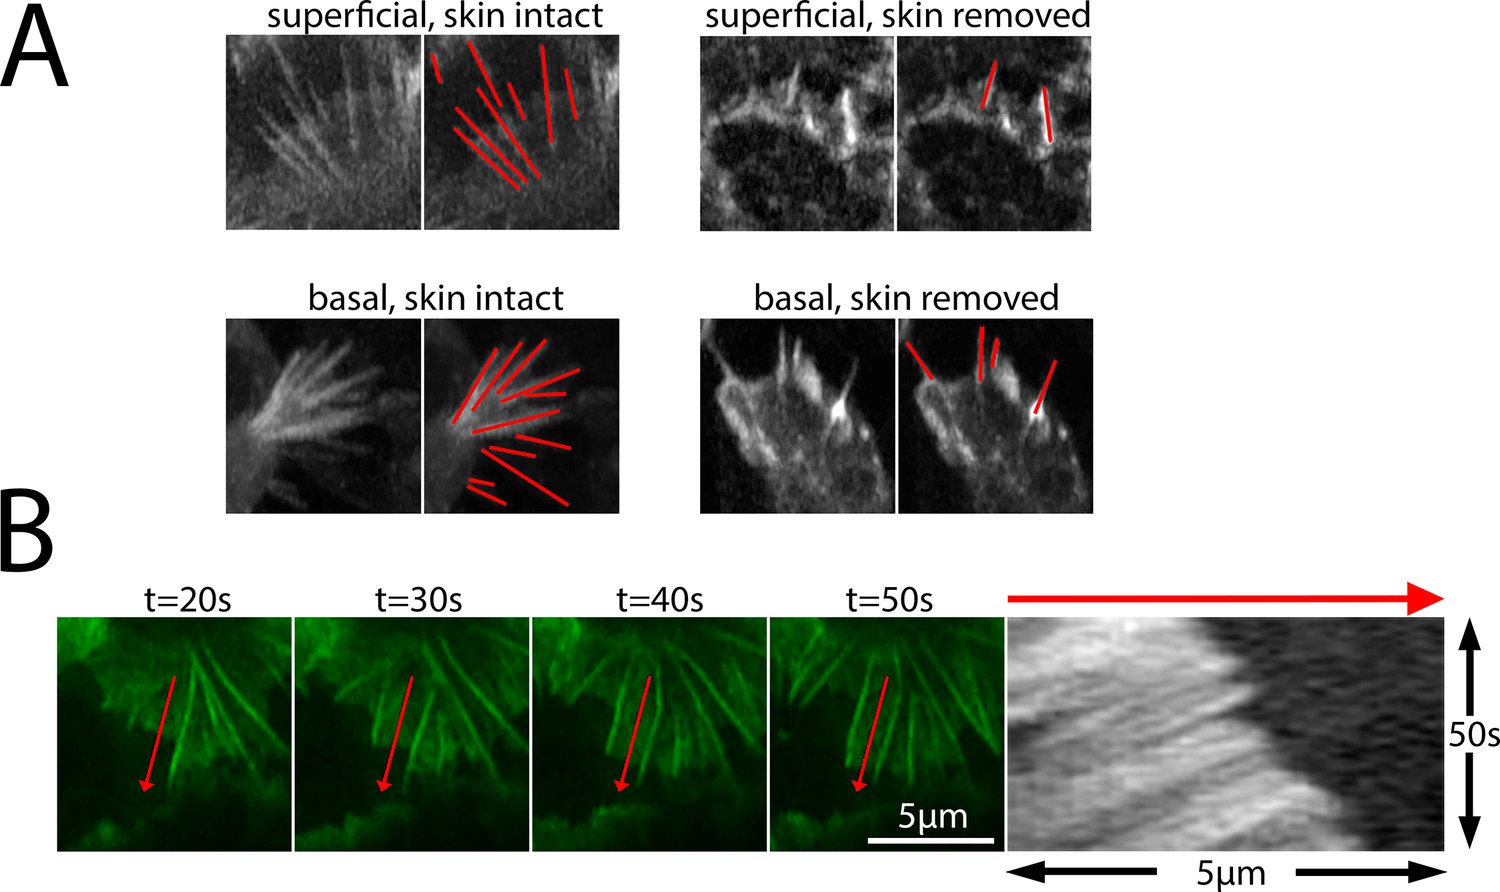
Image of a Tg(cldnb:lyn-egfp) embryo where skin had been removed over the PLLp at ~32 hpf (approximately equal in size and position as indicated by the white dashed box) and migration had been allowed to proceed until 54hpf.
Top panel shows control (unmanipulated) and bottom panel shows experimental (skin removed) side of the same embryo. Images are maximum-intensity projected stitched confocal stacks overlaid with DIC images.
Figure 4—video 1
Related to Figure 4.
Z-projection of a timelapse video of Tg(cldnb:lyn-gfp) (green); Tg(krt4:dsred) (magenta) double transgenic embryos in which the skin had been removed over the PLLp and allowed to heal, showing failure of migration when uncovered by skin and subsequent recovery of migration after skin healing.
Figure 5 with 2 supplements
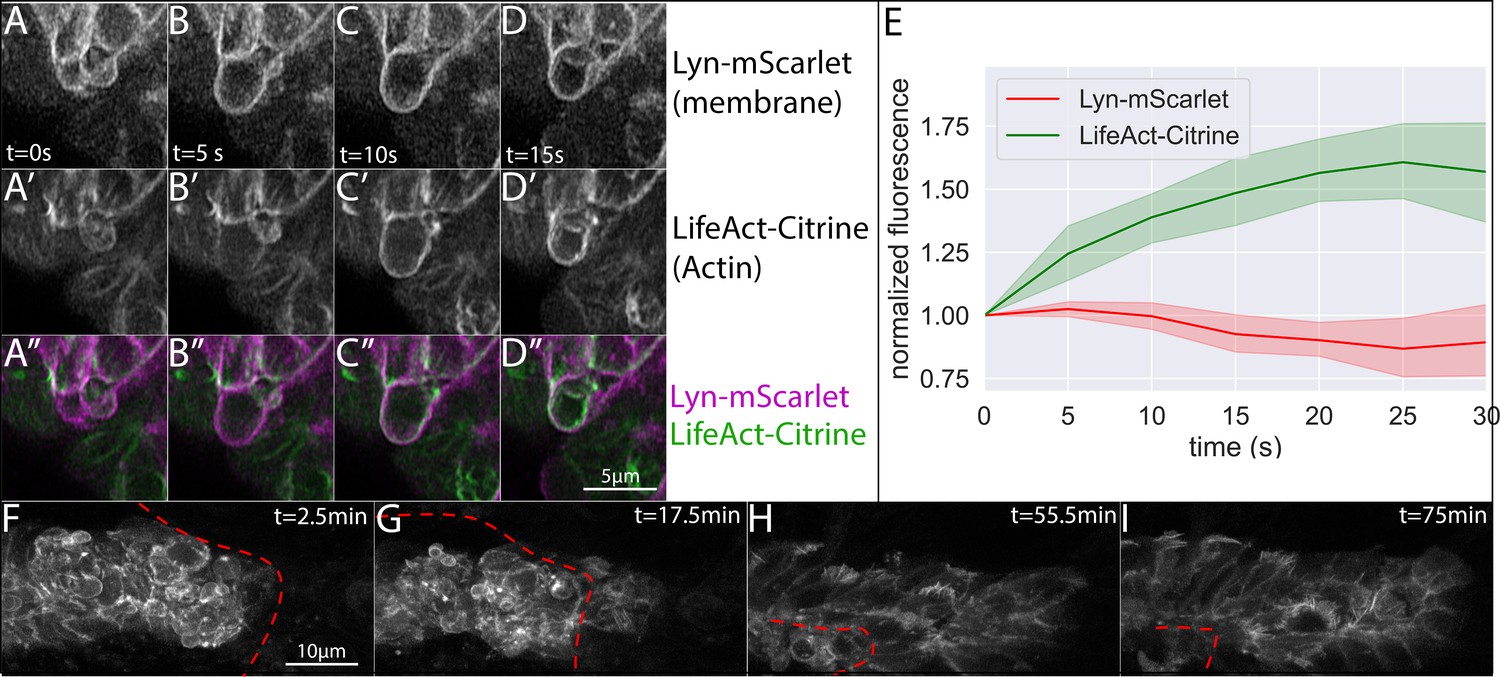
Morphology of superficial cells after removal and during regrowth of the overlying skin.
(A–D) Frames from a timelapse video showing superficial bleb formation and retraction after skin removal. (A-D) show lyn-mScarlet, marking membranes, A’-D’ show LifeAct-Citrine, marking F-actin and A’’-D’’ show the merge of both channels. Each panel (A-D) represents an interval of 5 s (E) Quantification of membrane (lyn-mScarlet) and Actin (LifeAct-Citrine) fluorescence intensity along bleb edge over time for n = 8 blebs. (F-I) Frames from a time-lapse video showing superficial LifeAct-Citrine during skin healing. Skin edge position is shown by the dashed red line, and time is indicated in the upper right corner. All images are processed Airyscan superesolution confocal images.
Figure 5—video 1
Related to Figure 5.
Z-projection of a timelapse video of TgBAC(cxcr4b:lifeact-citrine) (green); Tg(cldnb:lyn-mscarlet) (magenta) embryos showing blebbing of superficial cells after skin removal. Processed Airyscan video.
Figure 5—video 2
Related to Figure 5.
Z-projection of a timelapse video of TgBAC(cxcr4b:lifeact-citrine); Tg(krt4:dsred) (omitted for clarity) double transgenic embryos showing the disappearance of superficial blebs and the reappearance of superficial lamellipodia-like protrusions after skin healing. Red line indicates the position of the healing skin marked by the position of the Tg(krt4:dsred) signal. Processed Airyscan video.
Figure 6 with 2 supplements
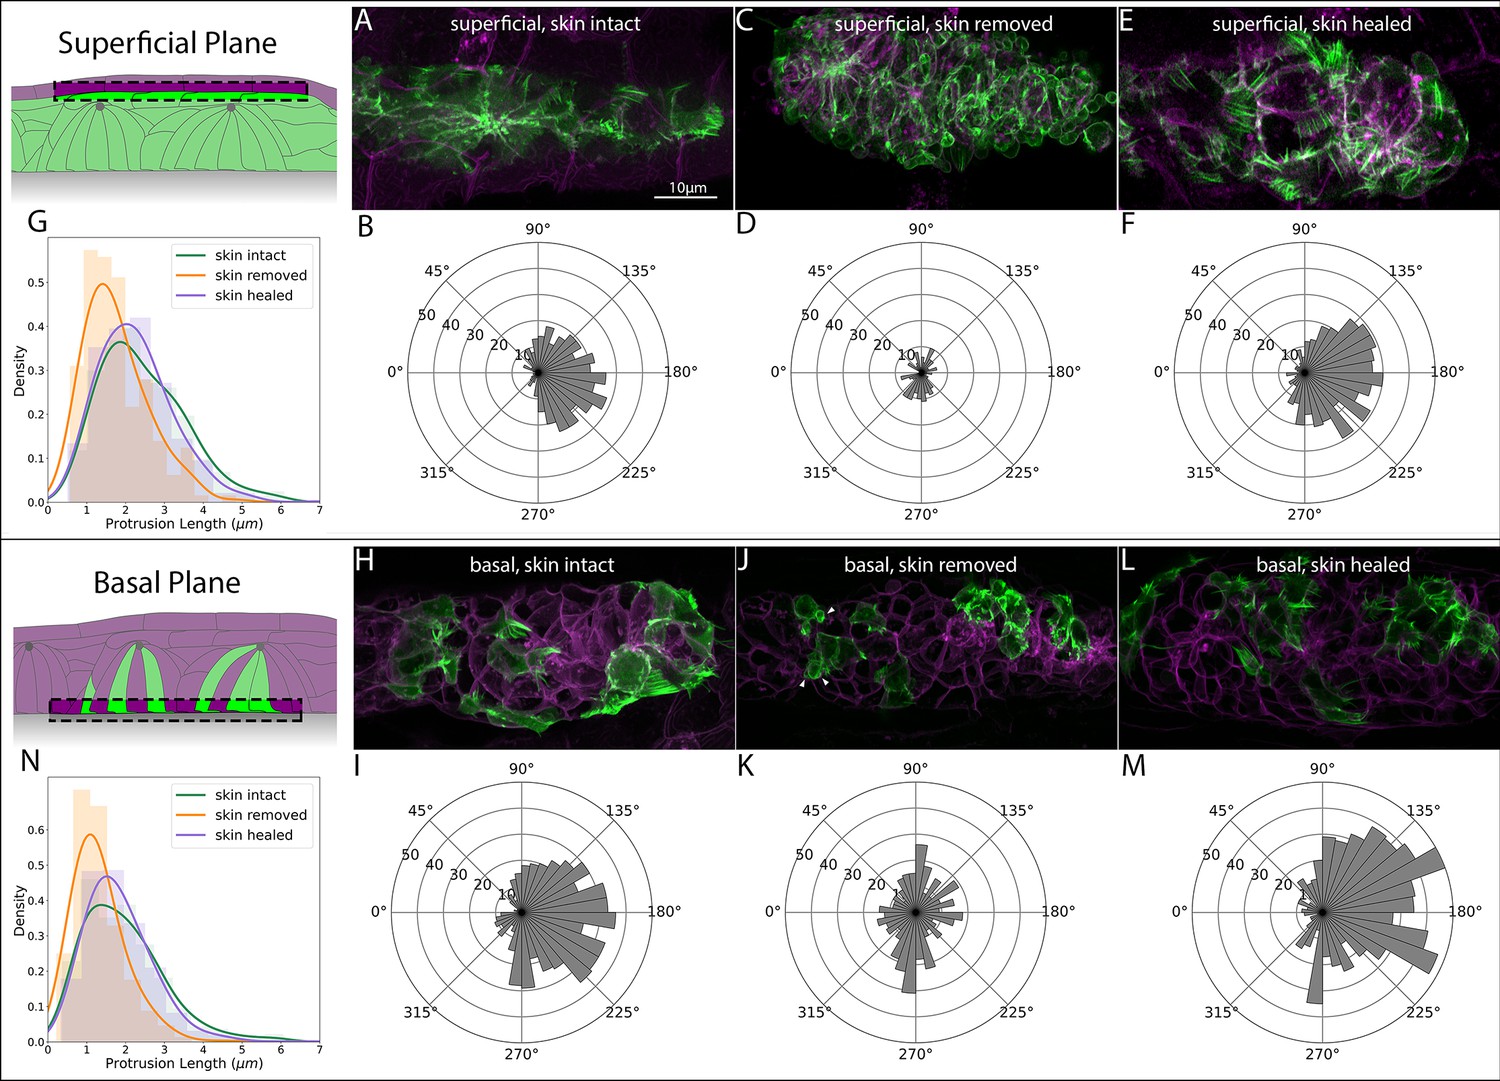
Superficial and basal protrusion morphology and directionality before, during and after skin removal and regrowth.
(A) Superficial LifeAct-Citrine-positive protrusions in embryos with intact skin. (B) Quantification of superficial protrusion directionality in embryos with intact skin. Panel K reflects same data as Figure 3B. (C) Superficial LifeAct-Citrine after removal of the overlying skin. (D) Quantification of superficial protrusion directionality in PLLp with overlying skin removed. (E) Superficial LifeAct-Citrine after removal and regrowth of the overlying skin. (F) Quantification of superficial protrusion directionality in PLLp with overlying skin removed and allowed to regrow. (G) Histograms and kernel density estimate (kde) plots of superficial-cell protrusion length for embryos with skin intact (green), skin removed (orange) and skin removed and allowed to heal (purple). (H) Transplanted cells showing basal LifeAct-Citrine-positive protrusions in embryos with intact skin. (I) Quantification of basal protrusion directionality in embryos with intact skin. (J) Transplanted cells showing basal LifeAct-Citrine after removal of the overlying skin. (K) Quantification of basal protrusion directionality in PLLp with overlying skin removed. (L) Basal LifeAct-Citrine after removal and regrowth of the overlying skin. (M) Quantification of basal protrusion directionality in PLLp with overlying skin removed and allowed to heal. (N) Histograms and kde plots of basal protrusion length for embryos with skin intact (green), skin removed (orange) and skin removed and allowed to heal (purple). All images are maximum-intensity projections of confocal stacks within 5 μm of the skin (for superficial protrusions) or the basal surface of the PLLp (for basal slices). All image panels are processed Airyscan super-resolution confocal images. Scale bar for (A), (C), (E), (H), and (J) are same as A. Schematics in each panel show the approximate area of the PLLp being imaged (dashed boxes).
Figure 6—figure supplement 1
Examples of protrusions measured for direction and length quantification in Figures 3, 6 and 7.
(A) Examples of superficial and basal protrusions in both skin-intact and skin-removed conditions. All protrusions were measured from time-lapse images where the direction of protrusion extension and maximal extension length could be quantified. (B) example kymograph used for quantification of retrograde actin flow. Left panels represent single frames from time-lapse video. Red arrow indicates the position sampled for the kymograph (right).
Figure 6—video 1
Related to Figure 6.
Z-projection of a timelapse video taken of the superficial and basal region of the PLLp in various conditions. Superficial images (upper panels) are of TgBAC(cxcr4b:lifeact-citrine) (green); Tg(cldnb:lyn-mscarlet) (magenta) double transgenic embryos, while basal images (lower panels) are of embryos where TgBAC(cxcr4b:lifeact-citrine) (green); Tg(cldnb:lyn-mscarlet) (magenta) double transgenic cells had been transplanted into Tg(cldnb:lyn-mscarlet) (magenta) single-transgenic embryos. Left hand column are images of intact (unperturbed) embryos. Middle panel are embryos where the skin has been removed over the PLLp. Right panels are embryos in which the skin has been removed and allowed to heal back over the PLLp before imaging. Processed Airyscan videos.
Figure 7
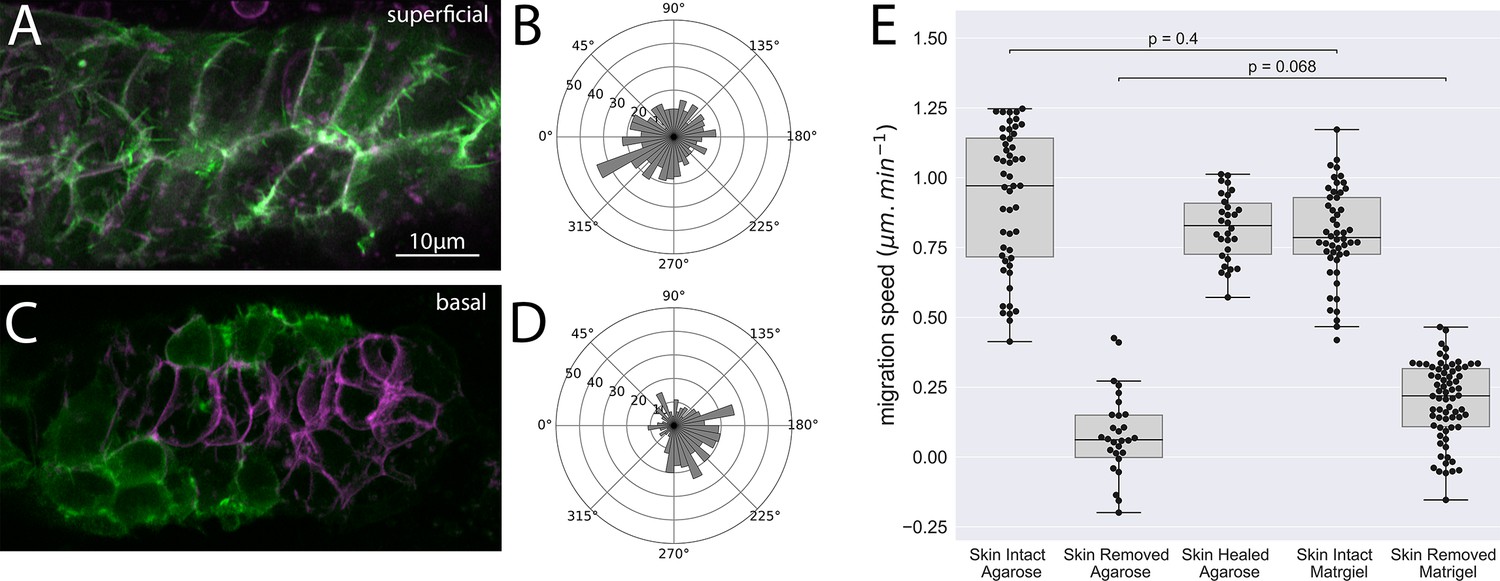
Superficial and basal protrusion morphology and directionality after removal of the overlying skin and embedding in Matrigel.
(A) Superficial LifeAct-positive protrusions (green) and membrane (magenta) in skin-removed embryos embedded in 20 mg/mL Matrigel. (B) Quantification of superficial protrusion directionality in embryos embedded in Matrigel (C) Basal LifeAct-positive protrusions (green) and membrane (magenta) in skin-removed embryos embedded in 20 mg/mL Matrigel (D) Quantification of basal protrusion directionality in embryos embedded in Matrigel. (E) Box plots of average cell migration speed (in the direction of normal migration) for embryos with skin intact embedded in 1% agarose, skin removed embedded in 1% agarose, skin removed and regrown embedded in 1% agarose, skin intact in 20 mg/mL Matrigel, and skin removed embedded in 20 mg/mL Matrigel. Dots indicate individual cell speed in the direction of normal migration in at least three embryos. p Values are represent results from ANOVA with multilevel model. Panels (A, C) are processed Airyscan super-resolution images.
Tables
Key resources table
| Reagent type (species) or resource | Designation | Source or reference | Identifiers | Additional information |
|---|---|---|---|---|
| Genetic reagent (Danio rerio) | Tg(cldnb:lyn-gfp) | PMID:16678780 | ZFIN ID: ZDB-ALT-060919–2 | |
| Genetic reagent (Danio rerio) | TgBAC(cxcr4b:lifeact-citrine) | PMID:26818072 | ZFIN ID: ZDB-ALT-160901–3 | |
| Genetic reagent (Danio rerio) | TgBAC(cxcr4b:h2a-mcherry) | PMID:31386838 | ZFIN ID: ZDB-ALT-180131–1 | |
| Genetic reagent (Danio rerio) | Tg(cldnb:lyn-mscarlet) | This paper | See Materials and methods | |
| Gnetic reagent (Danio rerio) | Tg(krt4:dsred) | PMID:22020759 | ZFIN ID: ZDB-ALT-120127–5 | |
| Software, algorithm | Allen Institute for Cell Science Segmenter | doi:https://doi.org/ 10.1101/491035; | 0.1.16.dev4 | Available: https://www.allencell.org/ segmenter.html |
| Chemical compound, drug | SU5402 | Tocris | Tocris:3300 |
Additional files
-
Supplementary file 1
Table of number of observations and embryos used for determining protrusion length and directionality in Figures 3, 6 and 7.
- https://cdn.elifesciences.org/articles/58251/elife-58251-supp1-v1.docx
-
Source data 1
Raw data (csv format) and Jupyter notebooks/SAS reports containing all statistical analysis performed.
- https://cdn.elifesciences.org/articles/58251/elife-58251-data1-v1.zip
-
Transparent reporting form
- https://cdn.elifesciences.org/articles/58251/elife-58251-transrepform-v1.docx
Download links
A two-part list of links to download the article, or parts of the article, in various formats.
Downloads (link to download the article as PDF)
Open citations (links to open the citations from this article in various online reference manager services)
Cite this article (links to download the citations from this article in formats compatible with various reference manager tools)
Zebrafish Posterior Lateral Line primordium migration requires interactions between a superficial sheath of motile cells and the skin
eLife 9:e58251.
https://doi.org/10.7554/eLife.58251


