Crosstalk between nitric oxide and retinoic acid pathways is essential for amphioxus pharynx development
- Department of Biology and Evolution of Marine Organisms (BEOM), Stazione Zoologica Anton Dohrn Napoli, Italy
- Sorbonne Université CNRS, Biologie Intégrative des Organismes Marins (BIOM), Observatoire Océanologique, France
Figures
Figure 1 with 5 supplements
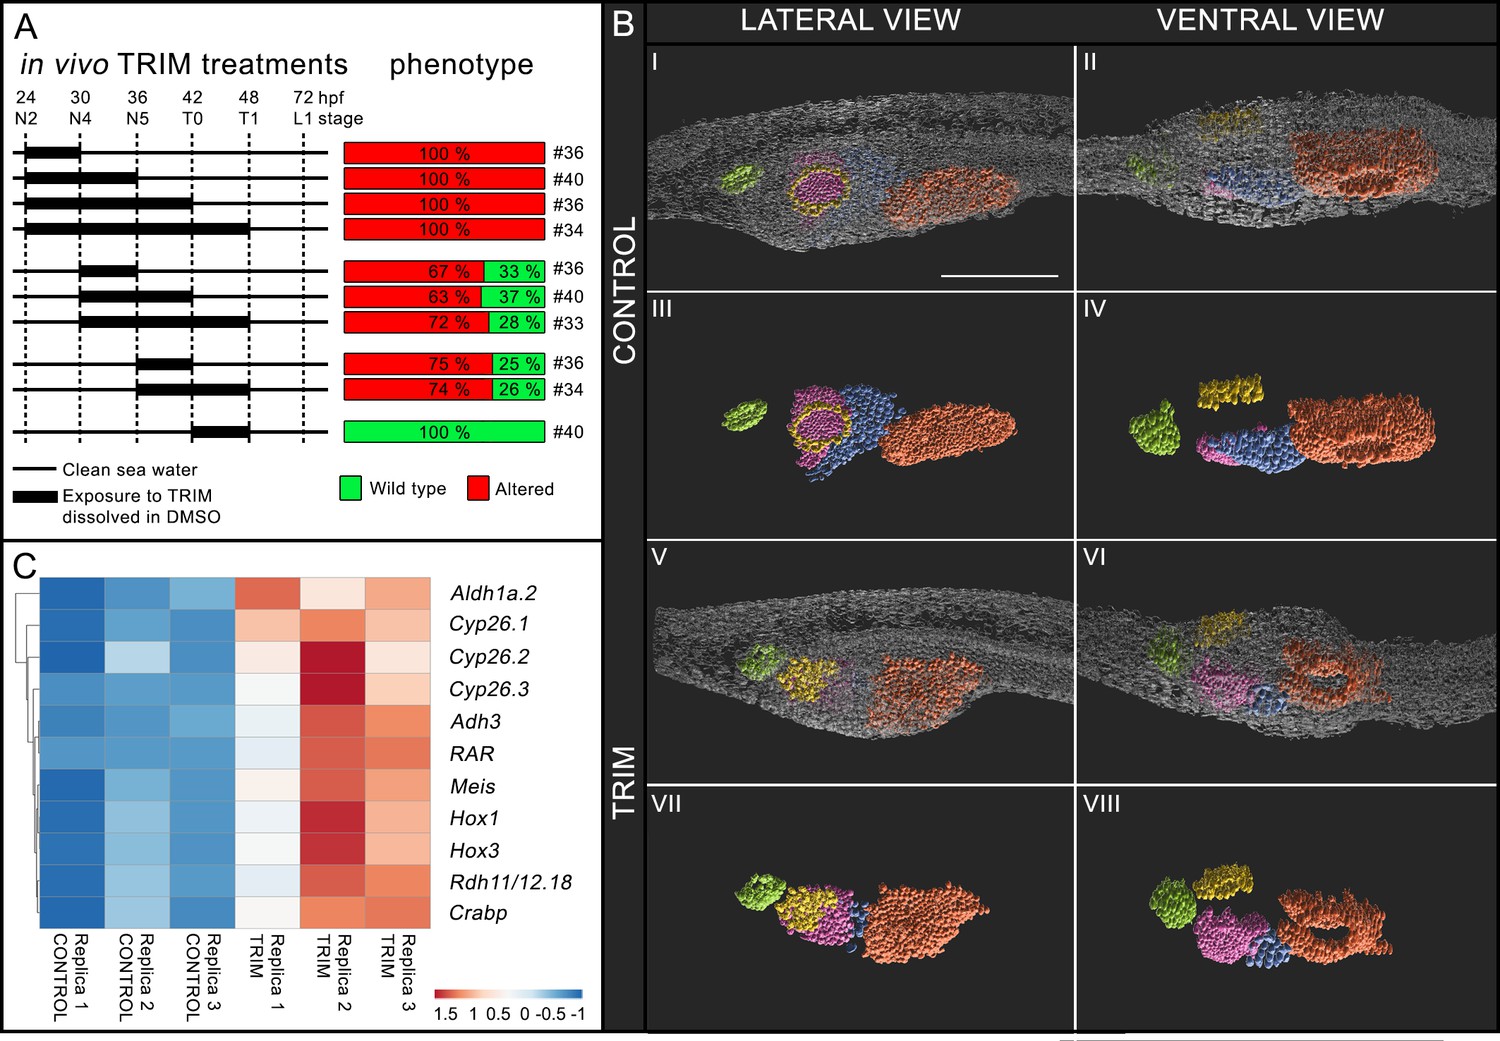
Characterization of in vivo 1-[2-(trifluoromethyl)phenyl]−1H-imidazole (TRIM) treatment during early amphioxus embryogenesis.
(A) Schematic representation of time intervals during which embryos were grown in presence of TRIM and the resulting phenotype. (B) 3D reconstruction of control and TRIM-treated larvae showing anatomical alterations in pharyngeal region (panels I, II, V, VI). Only internal anatomical structures are highlighted in panels III, IV, VII, VIII. Larvae orientation: anterior to the left, dorsal to the top. Scale bar: 50 μm. Color code: green = pre-oral pit, violet = endostyle, yellow = mouth, blue = club-shaped gland, orange = gill slit. (C) Gene expression heatmap, for selected genes, of the differential transcriptomic analysis (control versus TRIM).
-
Figure 1—source data 1
DESeq2 output for TRIM treated versus control condition.
- https://cdn.elifesciences.org/articles/58295/elife-58295-fig1-data1-v1.xlsx
Figure 1—figure supplement 1

NosC expression pattern by whole-mount in situ hybridization.
Transcripts are detected from stage N2 (24 hpf) to T1 (48 hpf). The positive signal is initially visible in few cells in the anterior limit of the neural plate (A). At later developmental stages it elongates posteriorly along the neural tube (B–E). For each developmental stage insets correspond to the neural plate (A) or neural tube (B–E); the asterisk indicates the cerebral vesicle. NosC mRNA signal is shown in magenta, nuclei are labeled in blue (DAPI), and acetylated tubulin antibody staining is in green. Embryo orientation: anterior to the left, dorsal to the top. Scale bar: 50 µm.
Figure 1—figure supplement 2
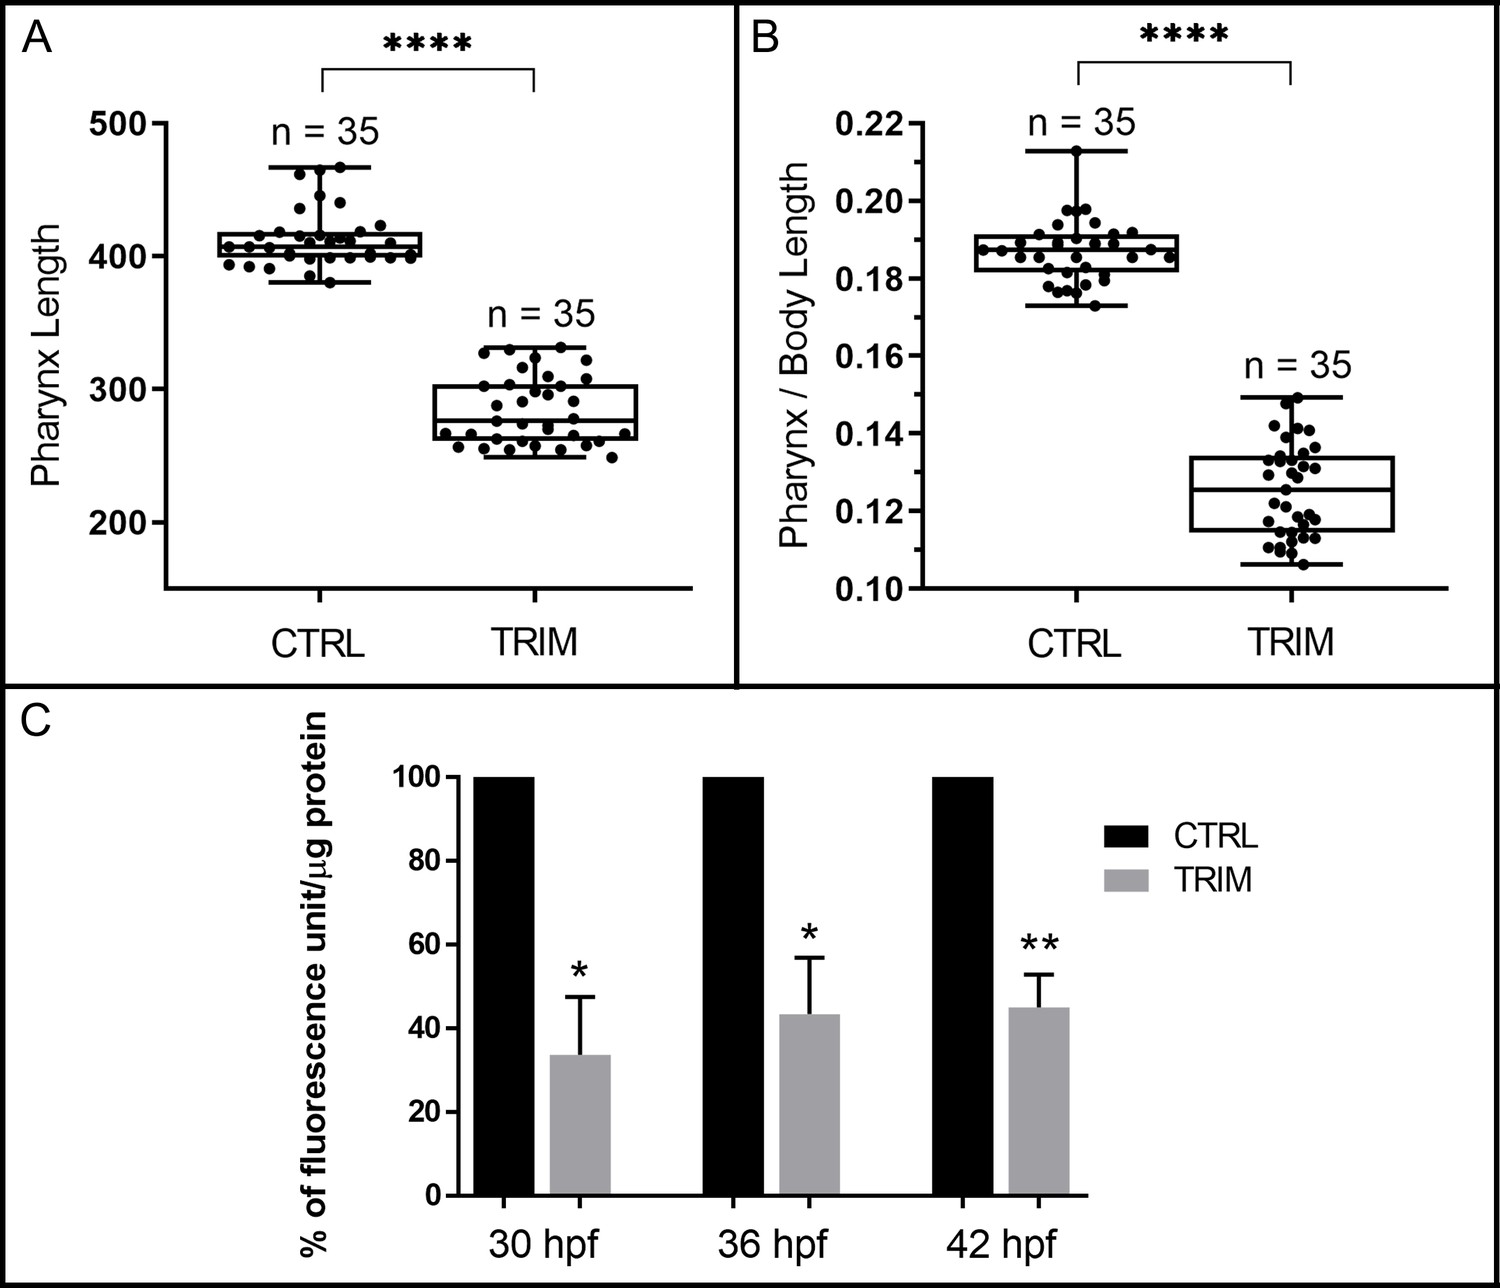
Pharynx and body lenght measurement and Nitric oxide quantification.
(A) Ratio between pharynx length and total body length in control and 1-[2-(trifluoromethyl)phenyl]−1H-imidazole (TRIM)-treated L1 larvae. Thirty-five larvae were tested for each condition; **** = p-value < 0.0001. (B) Nitric oxide (NO) quantification by 2,3-diaminonaphthalene (DAN) assay in control and in TRIM-treated embryos at three time points (30, 36, 42 hpf) with the treatment starting at 24 hpf. For each time point the value of the specific control was considered 100%. Results are presented in percentage of fluorescence compared to the control condition; * = p-value < 0.05; ** = p-value < 0.01.
Figure 1—figure supplement 3
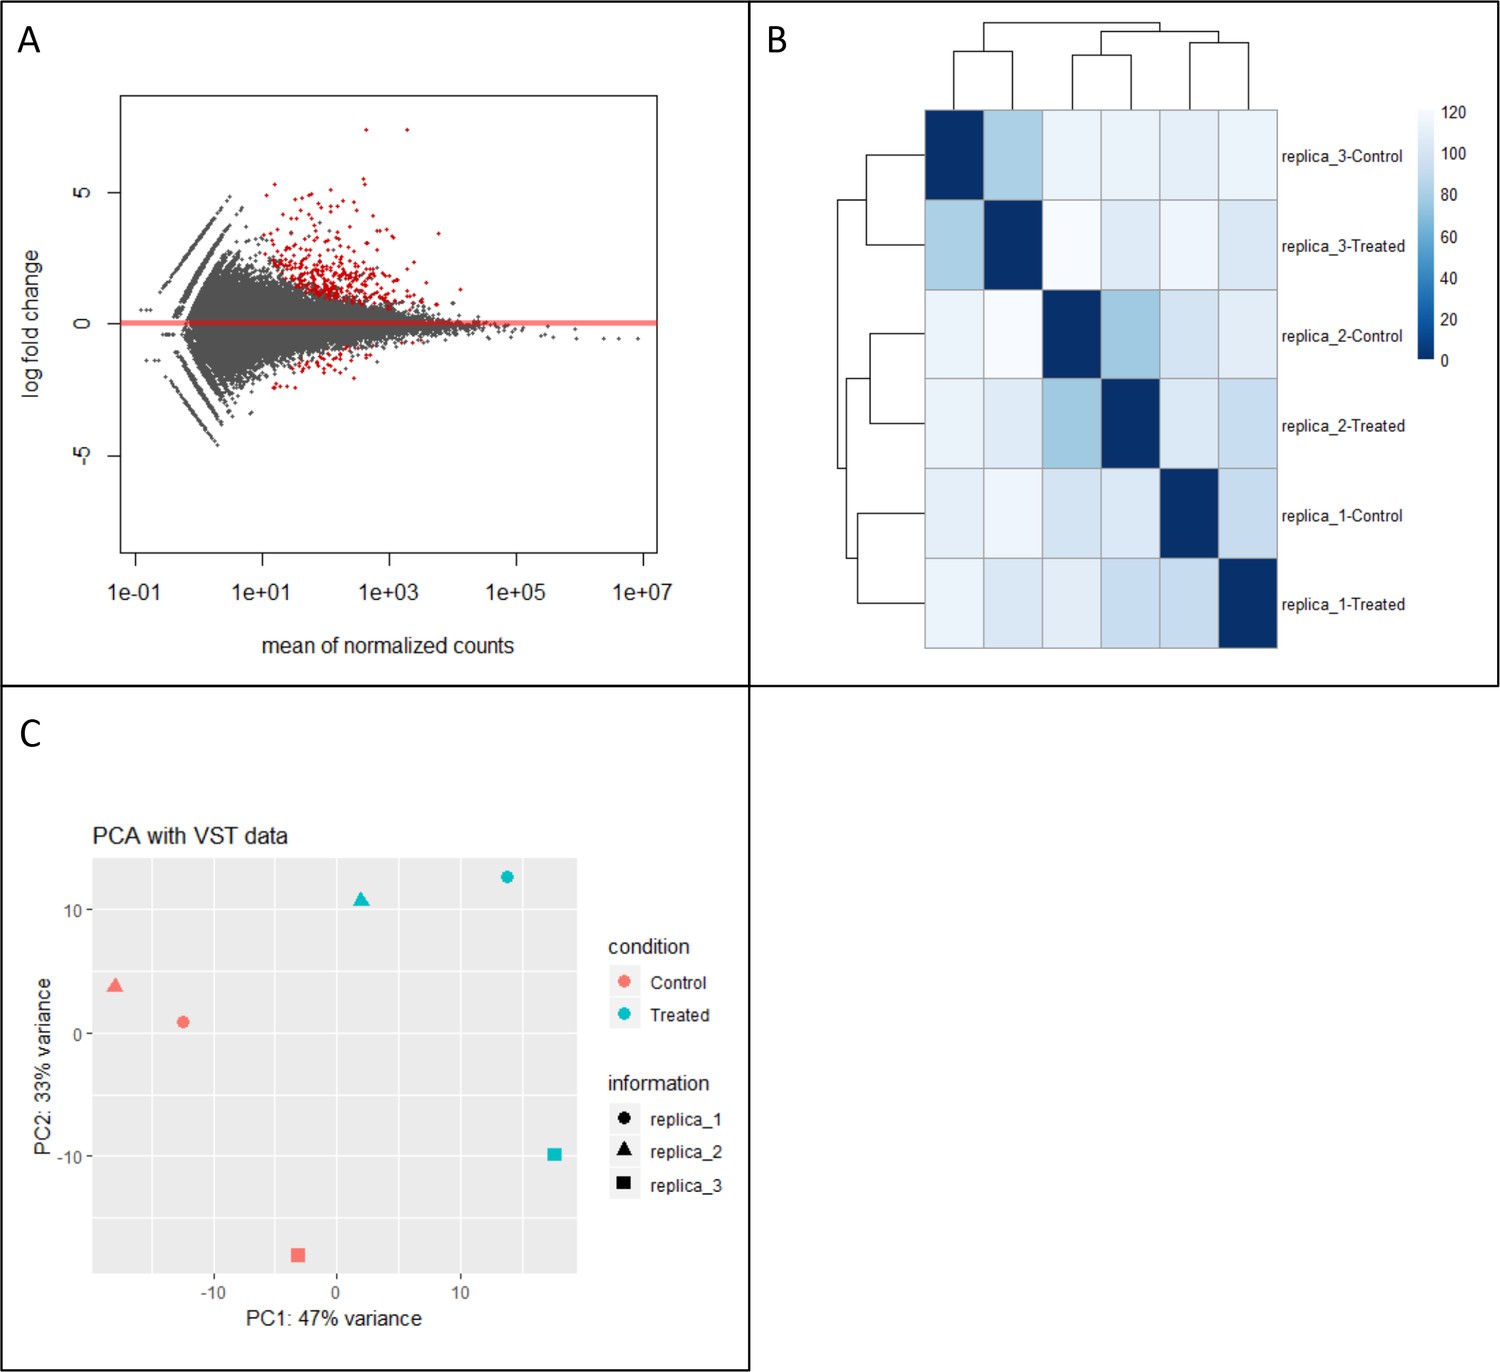
RNA-seq data quality.
(A) MA plot, red dots plotted represent genes with an adjusted p-value < 0.1 (1-[2-(trifluoromethyl)phenyl]−1H-imidazole [TRIM]-treated versus control). (B) Heatmap of sample-to-sample distances, strains are clustered by replicas (three controls and three TRIM-treated). (C) Principal component analysis (PCA) plot. Sample classes are highlighted in different colors: control in red and TRIM-treated in blue.
Figure 1—figure supplement 4
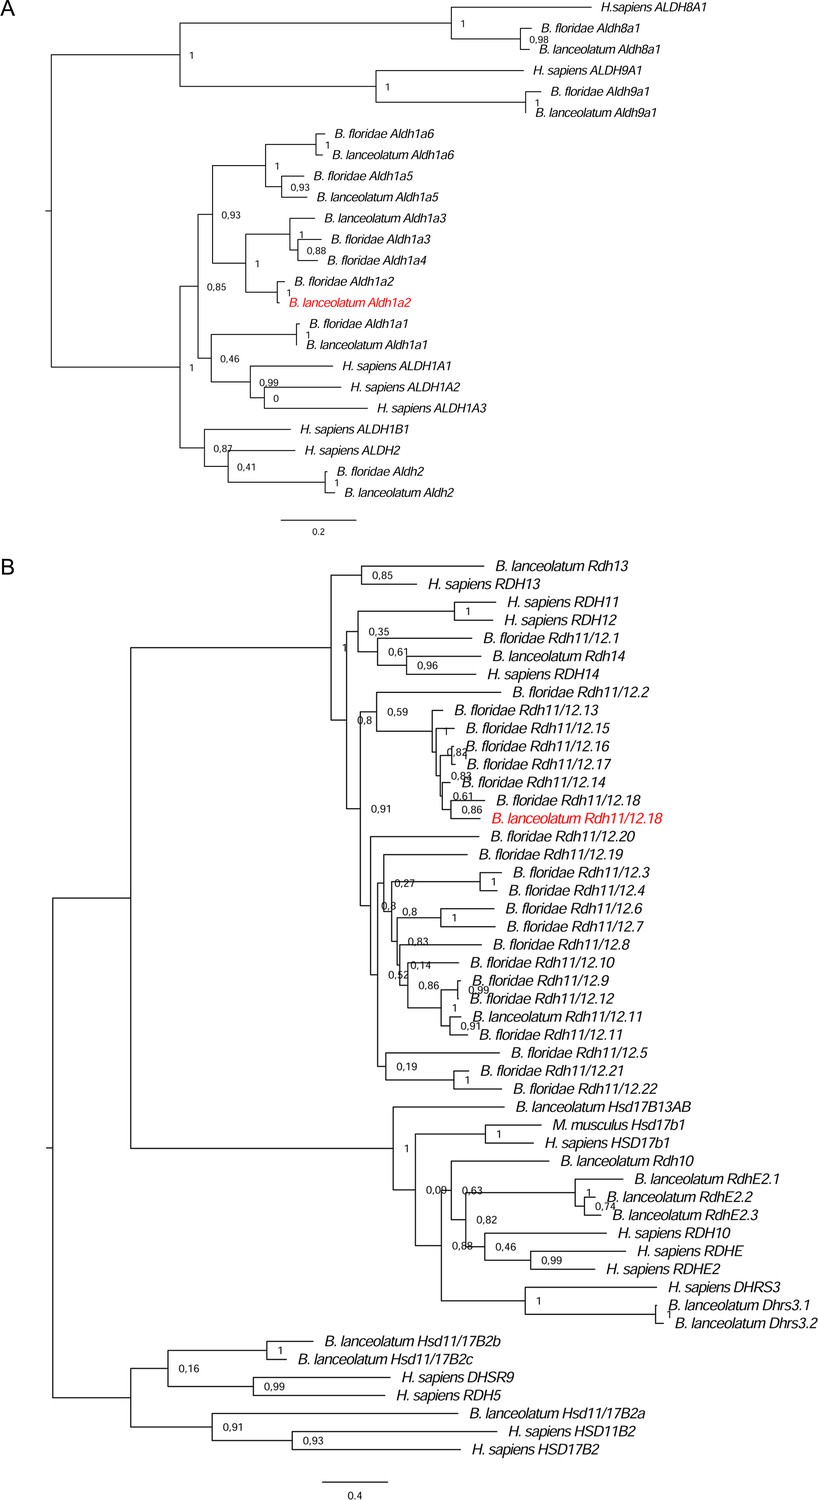
Phylogenetic analysis for two retinoic acid (RA) pathway genes.
The analysis allowed the identification of Branchiostoma lanceolatum orthologs (indicated in red) for (A) Aldh1a.2 (ContigAmph4820) and (B) Rdh11/12.18 (ContigAmph8913). Trees were calculated using maximum likelihood (ML) method, and bootstrap supports are given at each node.
Figure 1—figure supplement 5
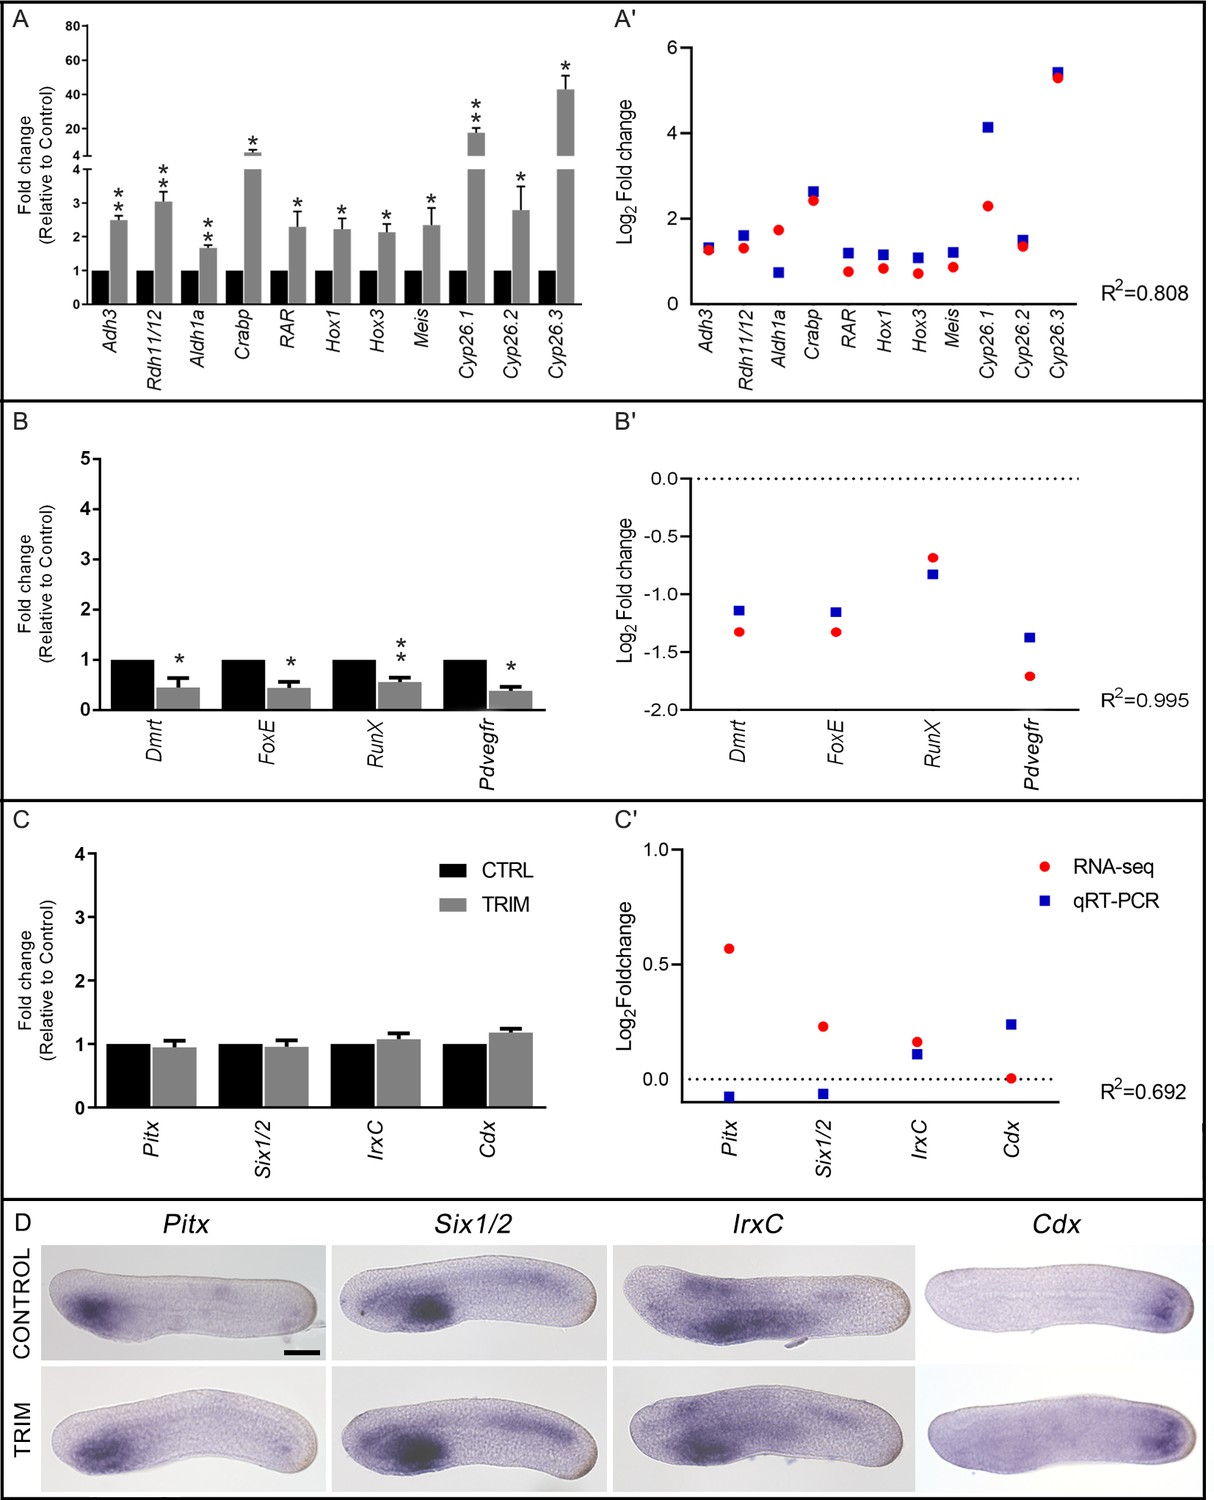
Validation of the RNA-seq data by gene expression analyses.
(A–B–C) Gene expression analysis by quantitative RT-PCR (qRT-PCR) of: Adh3, Rdh11/12.18, Aldh1a.2, Crabp, RAR, Hox1, Hox3, Meis, Cyp26.1, Cyp26.2, Cyp26.3, Dmrt, FoxE, RunX, Pdvegfr, Pitx, Six1/2, IrxC, and Cdx. Fold changes, relative to the control, from 1-[2-(trifluoromethyl)phenyl]−1H-imidazole (TRIM)-treated samples are reported. The statistical significance indicated is: * = p-value < 0.05; ** = p-value < 0.01. (A'–B'–C') Gene expression correlation between qRT-PCR and RNA-seq data for up-regulated genes: Adh3, Rdh11/12.18, Aldh1a.2, Crabp, RAR, Hox1, Hox3, Meis, Cyp26.1, Cyp26.2, and Cyp26.3; down-regulated genes: Dmrt, FoxE, RunX, and Pdvegfr; unaffected genes: Pitx, Six1/2, IrxC, and Cdx. Blue squares indicate log2 of relative fold changes obtained from qRT-PCR analysis of TRIM-treated versus control samples. Red circles indicate log2 of relative fold changes obtained from RNA-seq analysis of TRIM-treated versus control samples. The Pearson correlation coefficient (R2) is indicated. (D) Expression pattern of Pitx, Six1/2, IrxC, and Cdx in control and TRIM-treated embryos at the N5 stage. Embryo orientation: anterior to the left, dorsal to the top. Scale bar: 50 µm.
Figure 2 with 1 supplement

Analysis of gene expression.
(A) Gene expression pattern by in situ hybridization of Hox1, Hox3, Meis, Cyp26.1, Cyp26.2, and Cyp26.3 in 1-[2-(trifluoromethyl)phenyl]−1H-imidazole (TRIM)-treated and control embryos at N5 and T1 stage. The anterior (Hox1, Hox3, Meis, Cyp26.1) and posterior (Cyp26.2 and Cyp26.3) limits of gene expression territories in wild-type embryos are indicated with arrowheads in both control and TRIM-treated conditions. Fifteen embryos were used for each probe and all showed the pattern presented here. Embryos orientation: anterior to the left, dorsal to the top. Scale bar: 50 µm. (B–E) Quantitative RT-PCR (qRT-PCR) on N4 stage embryos showing expression level changes after 6 hr of pharmacological TRIM or retinoic acid (RA) treatments (24–30 hpf) of: (B) genes encoding enzymes for RA synthesis: Adh3, Rdh11/12.18, Aldh1a.2, and binding protein for storage: Crabp; (C) RA direct target genes: RAR, Hox1, Hox3, Meis; (D) genes encoding RA degradation enzymes: Cyp26.1, Cyp26.2, Cyp26.3; (E) Nos genes: NosA, NosB, NosC. The statistical significance indicated is: * = p-value < 0.05; ** = p-value < 0.01.
-
Figure 2—source data 1
Source raw data of qRT-PCR in Figure 2B-E.
- https://cdn.elifesciences.org/articles/58295/elife-58295-fig2-data1-v1.xlsx
Figure 2—figure supplement 1
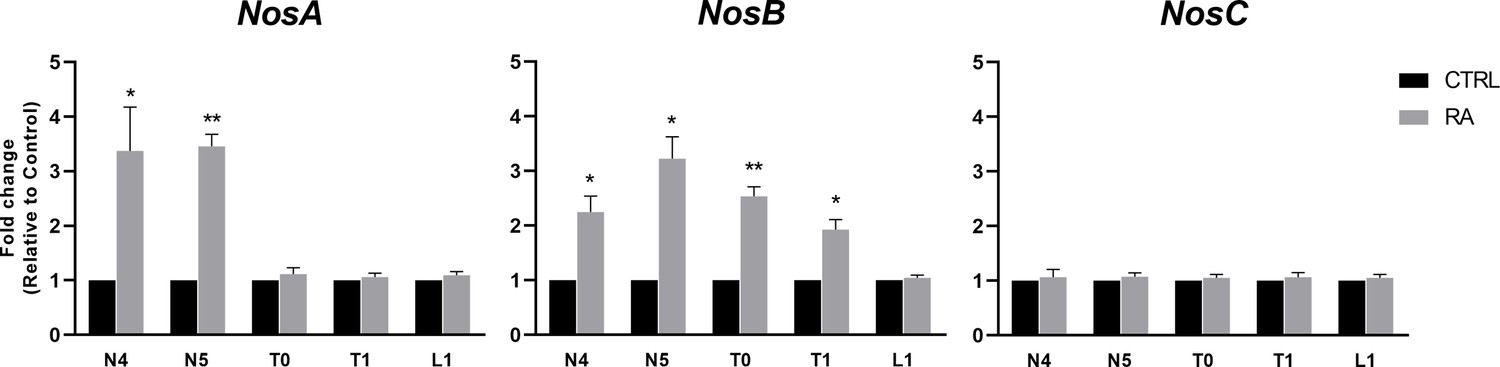
Nos genes expression pattern by quantitative RT-PCR (qRT-PCR) after retinoic acid (RA) treatment.
Five developmental time points were assayed from N4 to L1 stages. The statistical significance indicated is: * = p-value < 0.05; ** = p-value < 0.01.
Figure 3
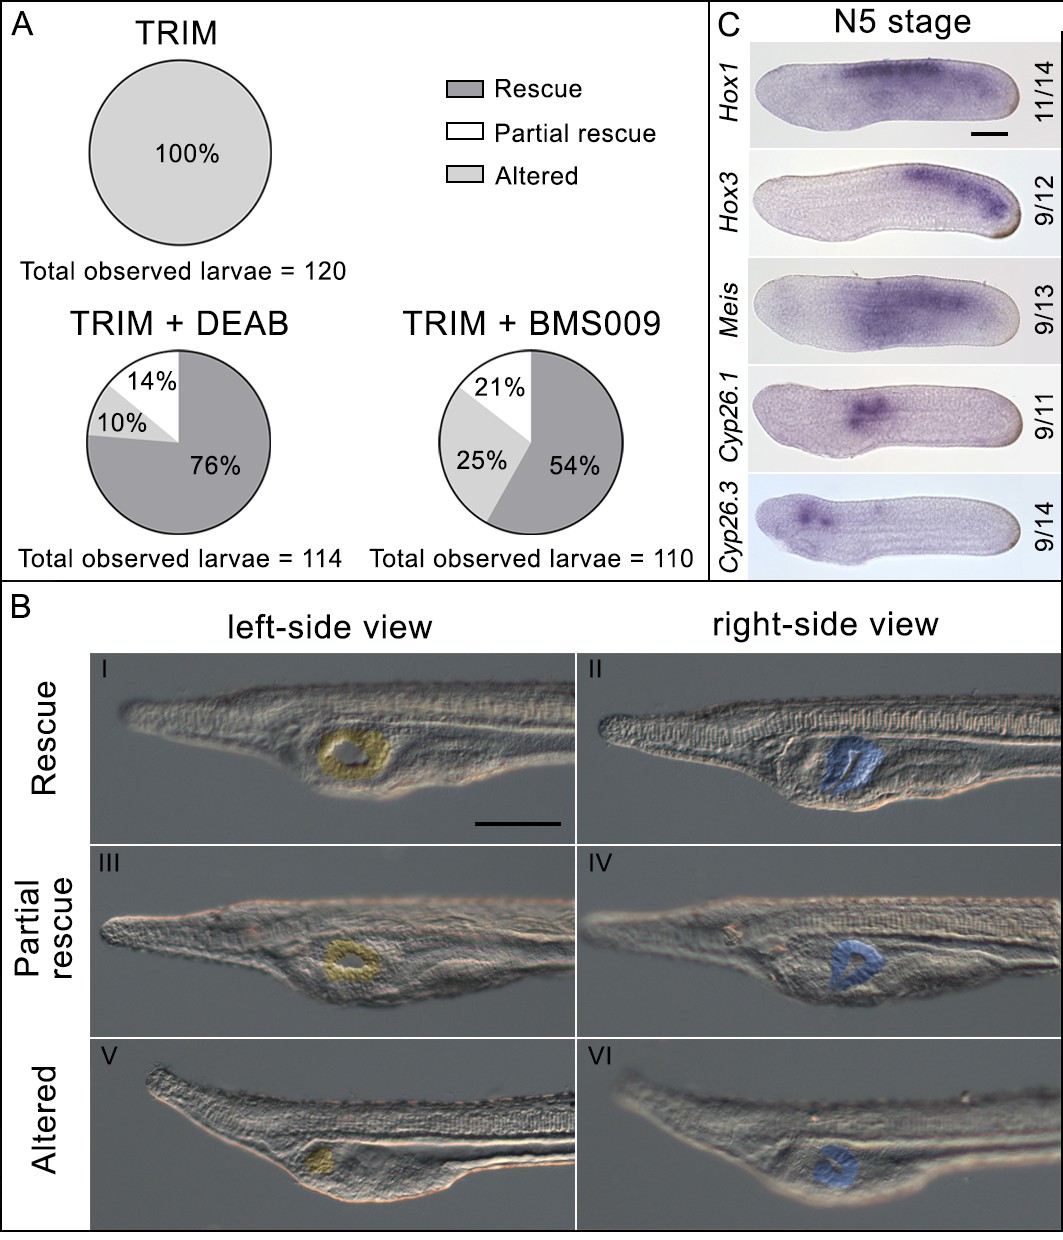
Phenotypic rescue effect of N,N-diethylaminobenzaldehyde (DEAB) and BMS009 on 1-[2-(trifluoromethyl)phenyl]−1H-imidazole (TRIM)-treated embryos.
(A) Pie charts of the phenotypes observed after TRIM treatment and the combinatorial pharmacological treatments TRIM (100 µM) + DEAB (25 µM) or TRIM (100 µM) + BMS009 (10−6 M). The percentages of each observed phenotype are reported in the respective portions of the graphs. For each treatment, the total number of observed larvae is indicated below the chart. (B) Pictures of the pharyngeal region of larvae presenting the three different classes of phenotype observed in the rescue experiments: rescue, partial rescue, and altered. The mouth is highlighted in yellow and the club-shaped gland in blue. Larvae orientation: anterior to the left, dorsal to the top. Scale bar: 50 µm. (C) Expression pattern by in situ hybridization of Hox1, Hox3, Meis, Cyp26.1, and Cyp26.3 after rescue assay with DEAB showing the restoration of wild-type expression territories. Numbers indicate the ratio between embryos showing a restored expression pattern and the total number of embryos analyzed. Embryo orientation: anterior to the left, dorsal to the top. Scale bar: 50 µm.
Figure 4
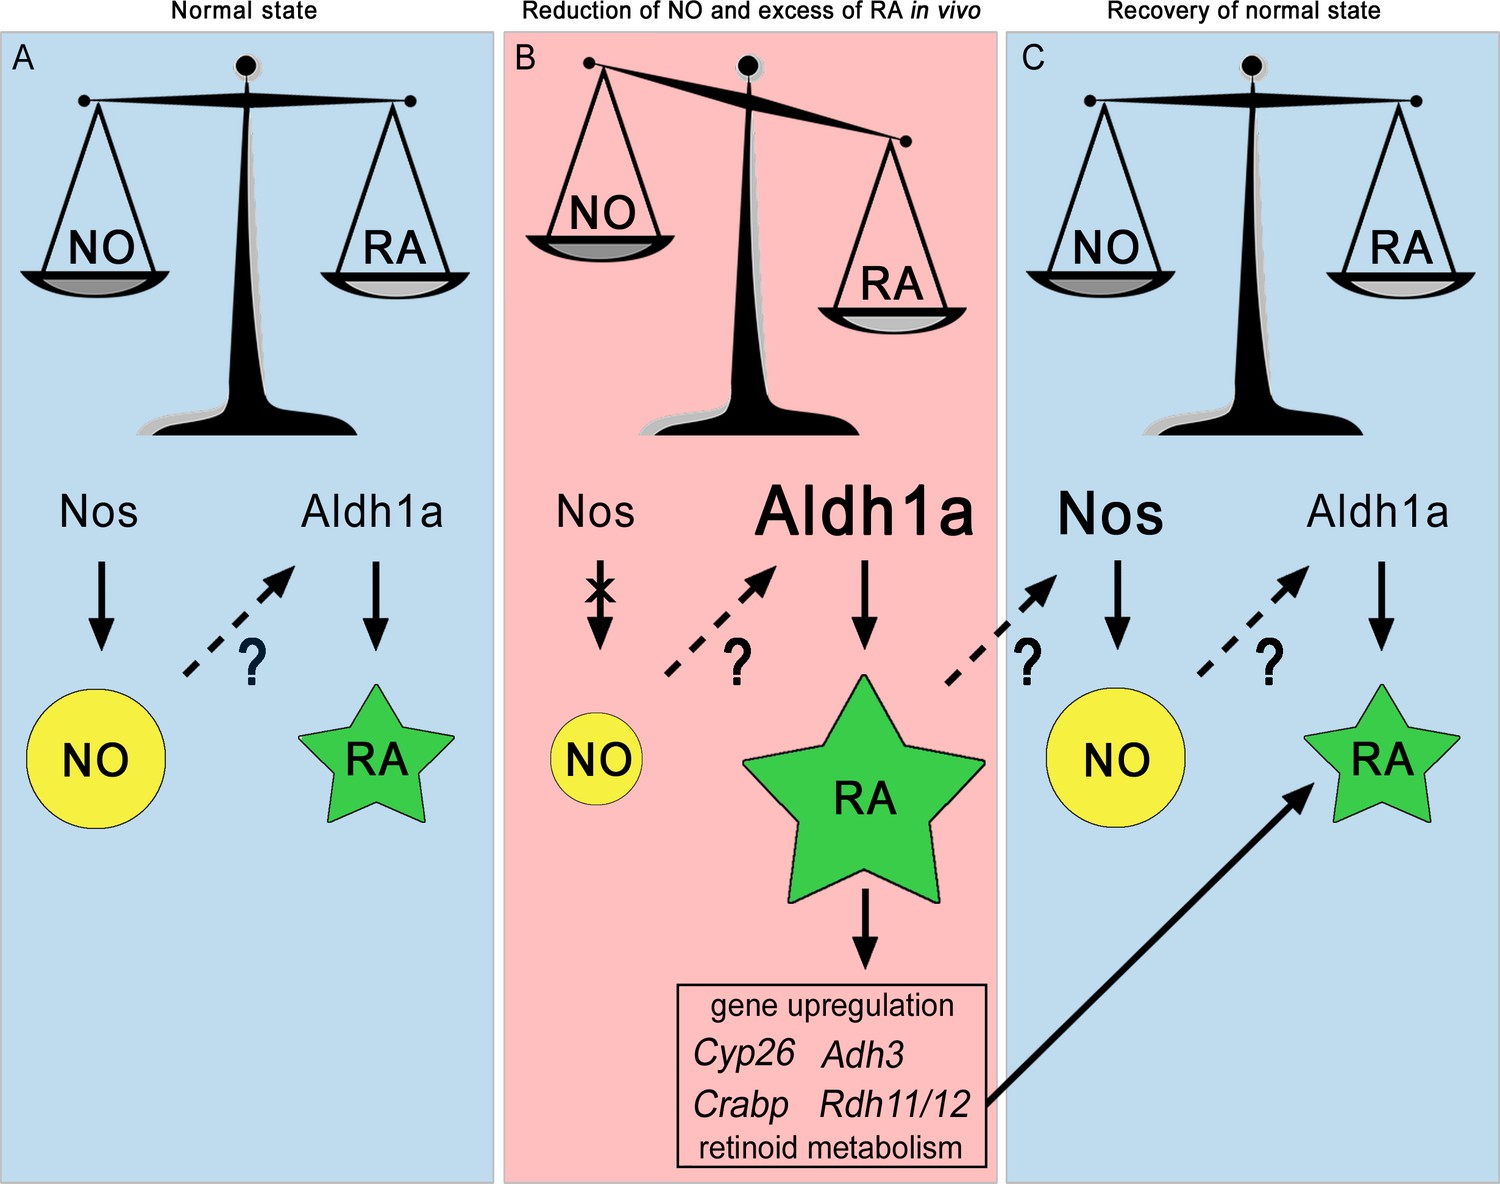
The NO:RA hypothesis.
Schematic representation of the possible crosstalk occurring between Nitric Oxide (NO) and Retinoic Acid (RA) during chordate development. NO is represented by a yellow circle, RA by a green star, the ratio between NO and RA by a scale symbol. The decrease of NO and the increase of RA, Aldh1a and Nos, are indicated by different sizes of symbols relative to the normal state. Arrows represent enzymatic processes, while discontinuous arrows correspond to transcriptional regulation. Question marks indicate that it is not known exactly how NO regulates Aldh1a.2 transcription and RA regulates Nos transcription. The cross over the arrow between Nos and NO illustrates the inactivation of Nos.
Tables
Key resources table
| Reagent type (species) or resource | Designation | Source or reference | Identifiers | Additional information |
|---|---|---|---|---|
| Strain, strain background, (Branchiostoma lanceolatum) | Wild type | Collected in Argelès-sur-mer, France | NCBI Taxon: 7740 | |
| Chemical compound, drug | 2,3-Diaminonaphthalene (DAN) | Sigma-Aldrich | D2757 | |
| Chemical compound, drug | Nitrate reductase (NAD[P]H) from Aspergillus niger | Sigma-Aldrich | N7265 | |
| Chemical compound, drug | Flavin adenine dinucleotide disodium salt hydrate (FAD) | Sigma-Aldrich | F6625 | |
| Chemical compound, drug | β-Nicotinamide adenine dinucleotide 2′-phosphate reduced tetrasodium salt hydrate (NADPH) | Sigma-Aldrich | N7505 | |
| Chemical compound, drug | 1-[2-(Trifluoromethyl)phenyl]-1H-imidazole (TRIM) | Cayman chemical | 81310 | |
| Chemical compound, drug | all-trans-Retinoic acid (RA) | Sigma-Aldrich | R2625 | |
| Chemical compound, drug | N,N-diethylaminobenzaldehyde (DEAB) | Sigma-Aldrich | D86256 |
Additional files
-
Supplementary file 1
Primers for the preparation of WISH probes cloning and for quantitative RT-PCR.
- https://cdn.elifesciences.org/articles/58295/elife-58295-supp1-v1.docx
-
Transparent reporting form
- https://cdn.elifesciences.org/articles/58295/elife-58295-transrepform-v1.pdf
Download links
A two-part list of links to download the article, or parts of the article, in various formats.
Downloads (link to download the article as PDF)
Open citations (links to open the citations from this article in various online reference manager services)
Cite this article (links to download the citations from this article in formats compatible with various reference manager tools)
Crosstalk between nitric oxide and retinoic acid pathways is essential for amphioxus pharynx development
eLife 10:e58295.
https://doi.org/10.7554/eLife.58295


