An essential role for MEF2C in the cortical response to loss of sleep in mice
- Department of Psychiatry, Peter O’Donnell Brain Institute, University of Texas Southwestern Medical Center, United States
- Research Service, North Texas VA Health Care System, United States
- Department of Neuroscience, Peter O’Donnell Brain Institute, University of Texas Southwestern Medical Center, United States
- Department of Neuroscience, Medical University of South Carolina, United States
- Howard Hughes Medical Institute, University of Texas Southwestern Medical Center, United States
- International Institute of Integrative Sleep Medicine, University of Tsukuba, Japan
Figures
Figure 1 with 3 supplements
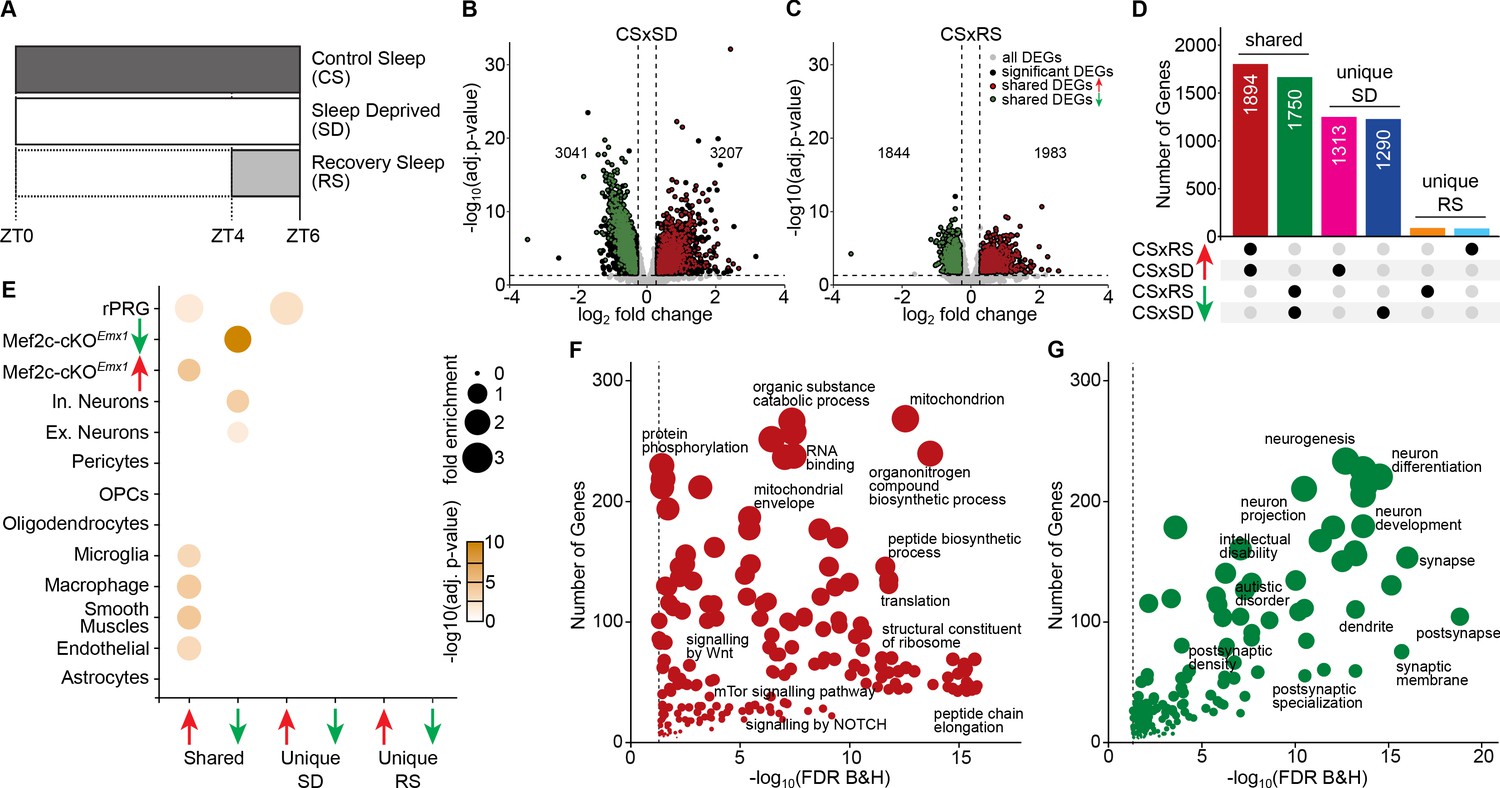
Sleep need induced transcriptomic changes.
(A) Schematic of the experimental design illustrating the protocol for frontal cortex brain tissue collection from three sleep conditions at Zeitgeber Time (ZT) = 6 hours: control sleep (CS), sleep deprived (SD) and recovery sleep (RS). Volcano plots showing differentially expressed genes across (B) CS to SD and (C) CS to RS. Significantly differentially expressed genes (DEGs) (adj. p-value<=0.05, absolute log2 fold change >= 0.3), unique to the sleep condition, are indicated as black dots whereas genes shared by SD and RS are indicated as either red (increased expression) or green (decreased expression) dots. (D) Upset plot showing the shared and unique sets of significant DEGs for CS to SD and CS to RS. (E) Dot plot showing enrichment of significant DEGs for cell-types identified using single cell RNA sequencing data (Hrvatin et al., 2018) from mouse cortex, identified Mef2c target genes (Harrington et al., 2016) and rapid primary response genes (rPRGs) (Tyssowski et al., 2018). A Fisher’s exact test was used to calculate the significance of the overlap of the sleep DEGs and the Mef2c-cKOEmx1 DEGs. The size of the dot indicates the odds ratio for enrichment and the color indicates the p-value. Dot plot showing GO analysis for shared significant DEGs with (F) increased and (G) decreased expression across SD and RS compared to CS (for a complete list of significant GO, see Supplementary file 3).
Figure 1—figure supplement 1
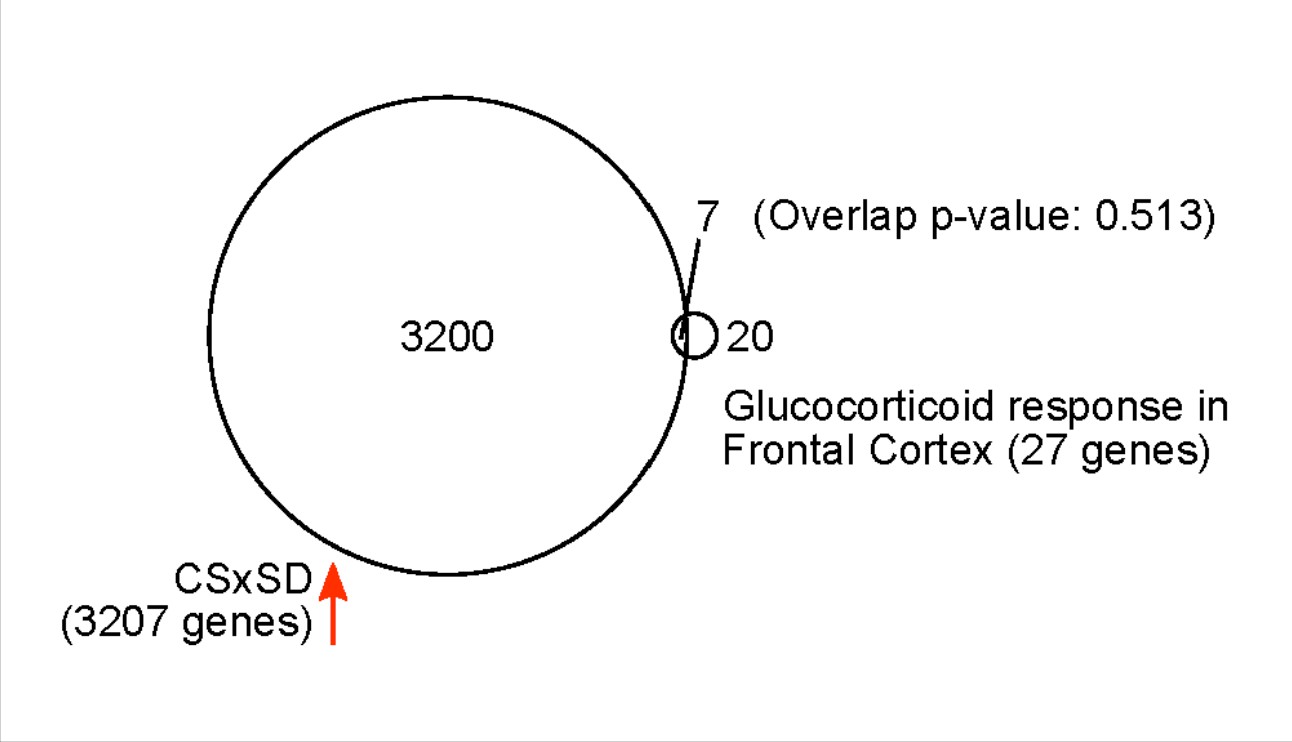
3207 genes increased their expression after 6 hr of sleep deprivation (SD).
27 genes are expressed in the frontal cortex and involved in glucocorticoid intracellular responses (MGI GO:0071385). Seven genes have both increased expression in response to SD and are involved in glucocorticoid responses (p-value=0.513 using Fisher’s exact test).
Figure 1—figure supplement 2
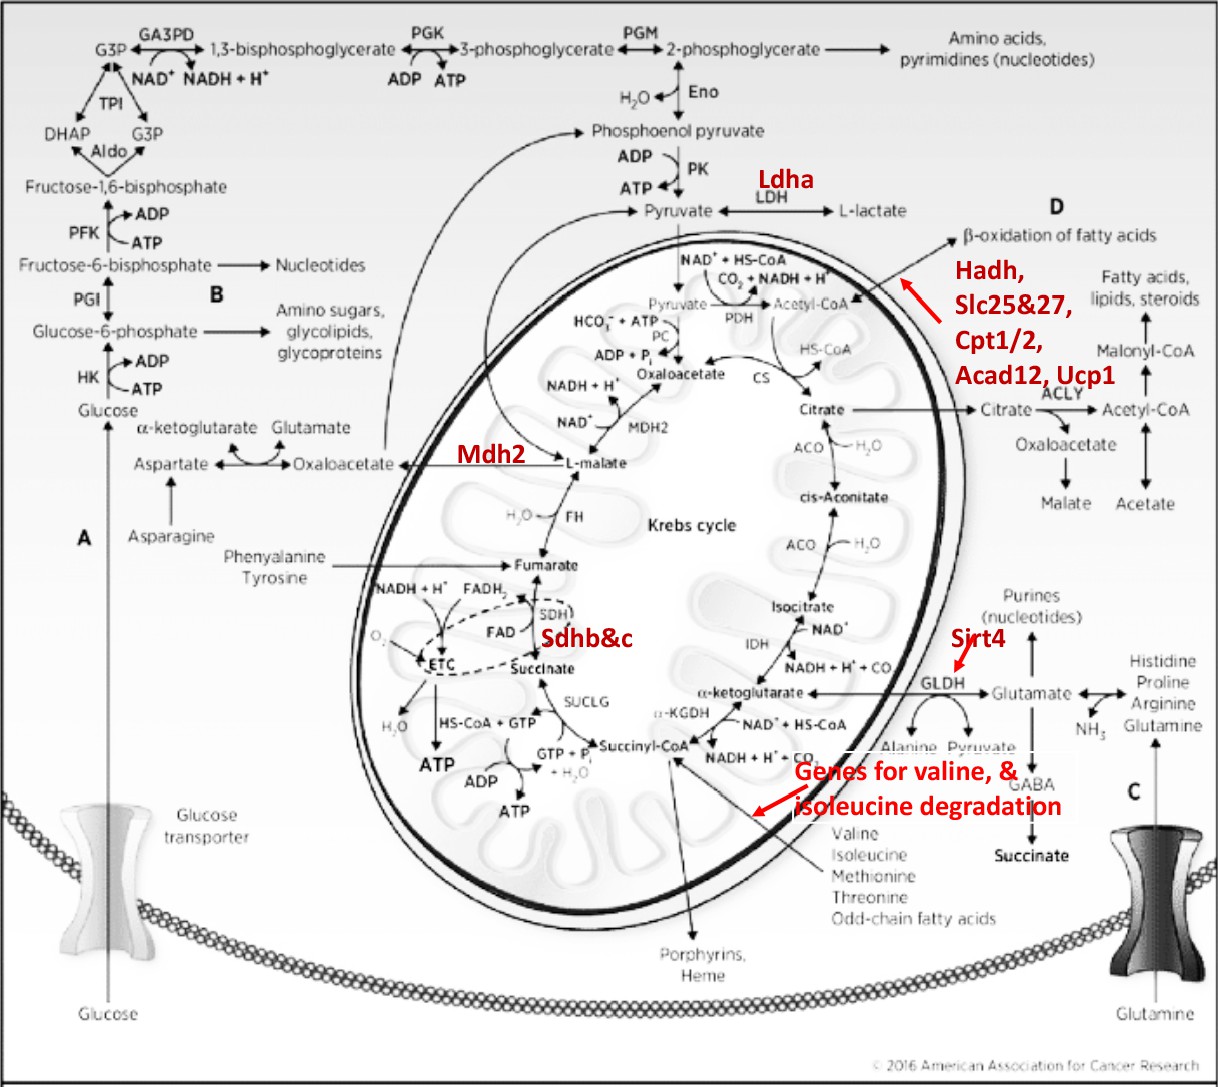
Kreb’s cycle with highlighted differentially expressed genes with increased expression in both SD and RS, and involved in anaplerotic reactions.
Figure 1—figure supplement 3
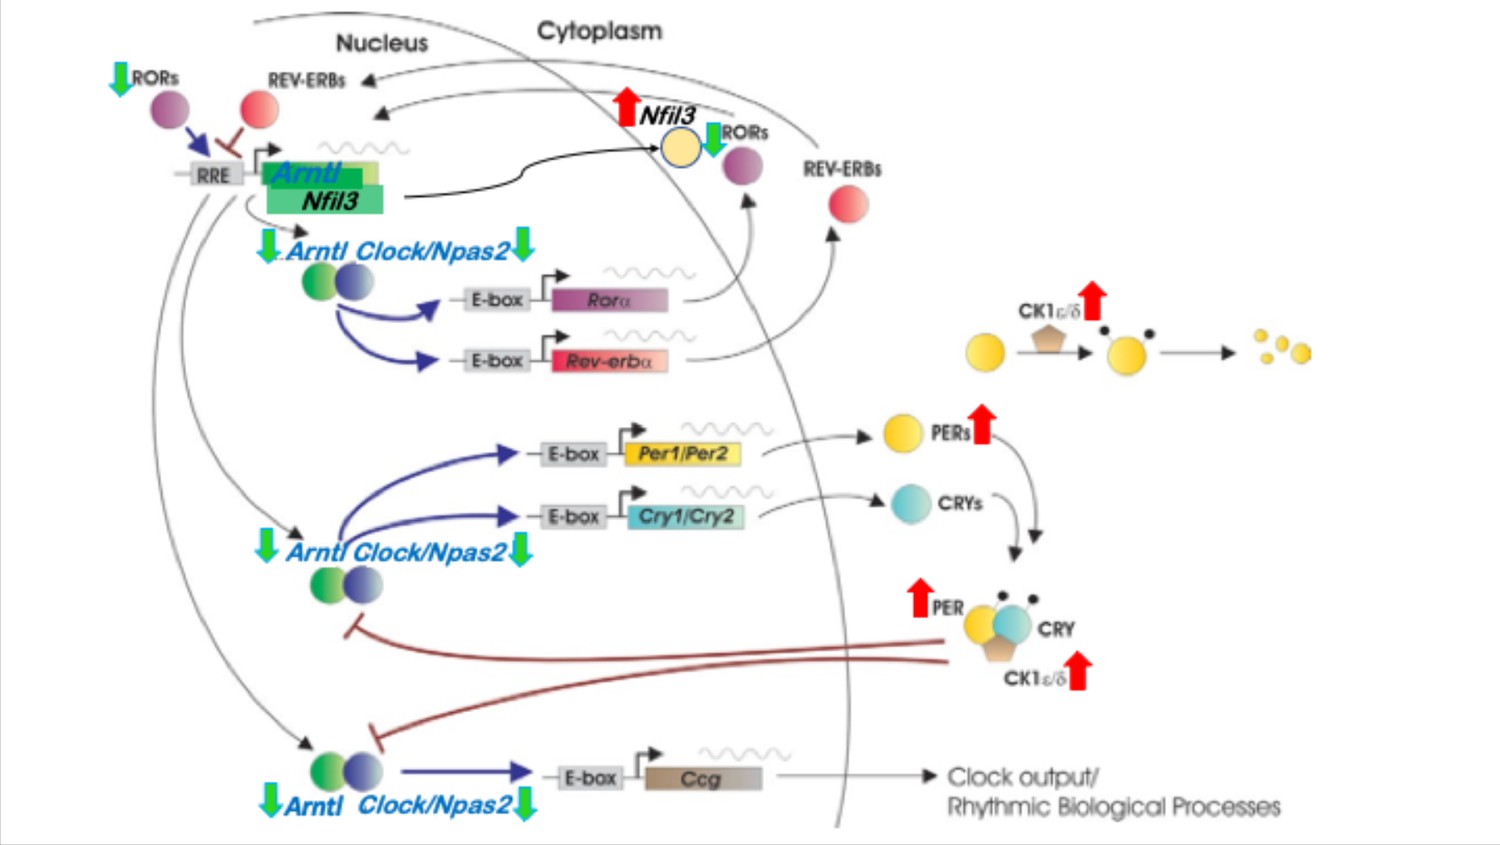
Circadian rhythm gene regulatory network with highlighted core clock genes that are affected during SD.
Genes with increased expression in SD are marked with red up arrows and genes with decreased expression in SD are marked with green down arrows.
Figure 2 with 1 supplement

Coordinated transcriptomic responses with sleep need indicate a role for MEF2C.
(A) Heatmap showing enrichment of sleep-state DEGs across modules of genes identified by weighted gene co-expression network analysis (WGCNA). First three rows show module eigengene correlation to sleep states (CS, SD and RS respectively) ordered by most positive to most negative correlation to CS sleep state. The following four rows highlight the significance of module enrichment for a specific set of DEGs colored by green for genes with decreased expression for CSxSD, CSxRS, SDxRS and MEF2C targets (Harrington et al., 2016) and the next four rows colored by red to highlight the significance of module enrichment for genes with increased expression for CSxSD, CSxRS, SDxRS and MEF2C targets (Harrington et al., 2016). The bottom four rows colored by shades of orangeyellow show enrichment of modules for cell types identified using single-cell RNA sequencing (Hrvatin et al., 2018) from mouse cortex. Each column is a module of genes as indicated by the module ID in last row. (B) Barplot for a selected module (Module ID 04) with eigengene correlation across sleep states showing a strong positive correlation to CS and negative correlation to SD and weak negative correlation to RS. (C) Network plot for selected module (Module ID 04) showing the top 250 connections between genes. Genes that are MEF2C targets (Harrington et al., 2016) are highlighted by red circles. (D) GO plot for genes within the selected module (Module ID 04).
Figure 2—figure supplement 1
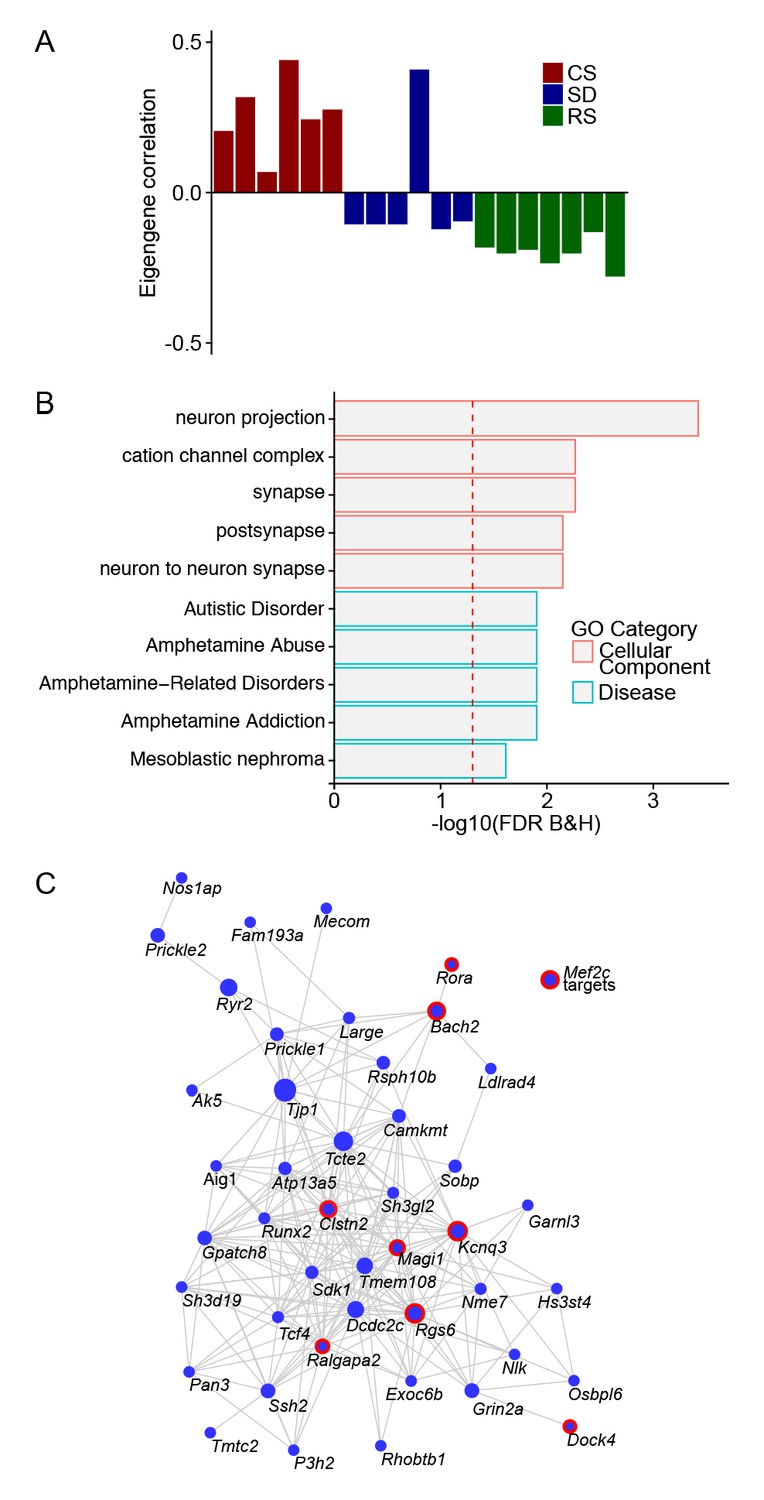
A module of gene co-expression characterized by an eigengene driven by sleep condition.
(A) Barplot for Module ID 10 with eigengene correlation across sleep states showing a strong positive correlation to CS and negative correlation to SD and RS. (B) GO plot for genes within the Module ID 10. (C) Network plot for Module ID 10 showing the top 250 connections between genes. Genes that are MEF2C targets (14) are highlighted by red circles.
Figure 3
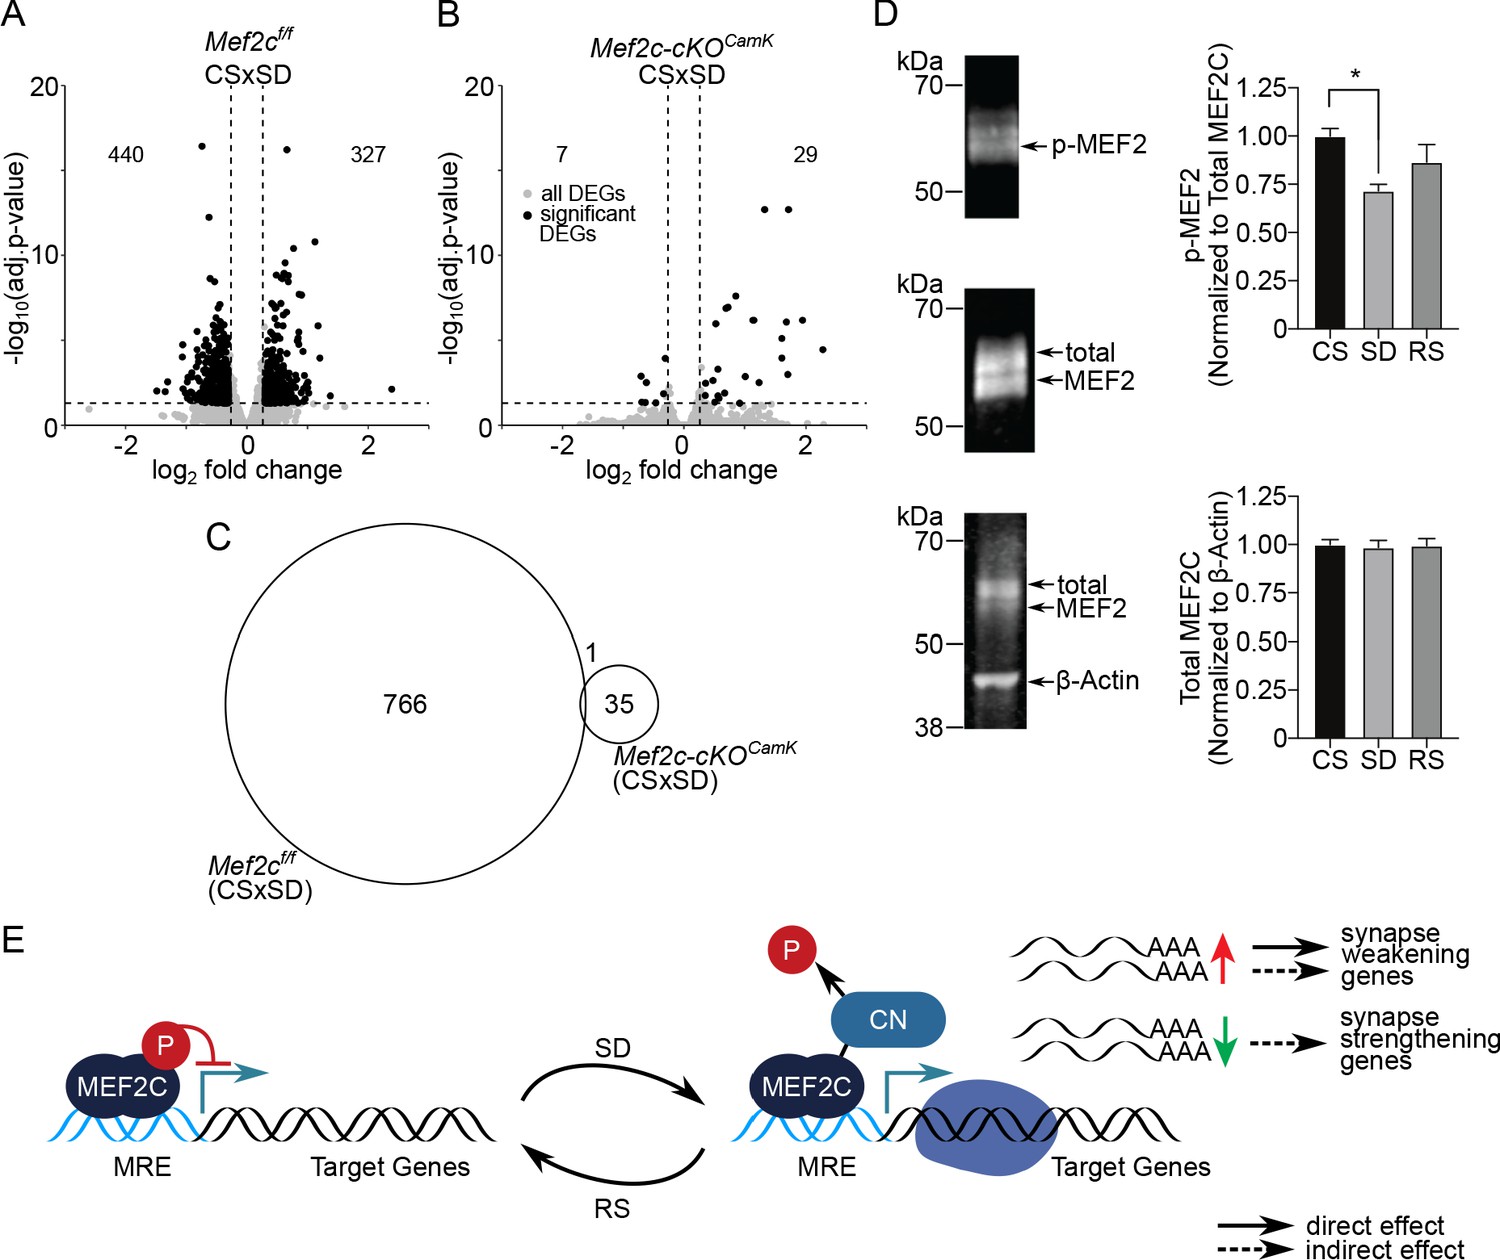
MEF2C, its de-phosphorylation and essential role in sleep-loss-mediated differential gene expression.
(A) Volcano plot showing the DEGs identified for Mef2cf/f and another, (B) for Mef2c-cKOCamk2a-Cre between CS to SD sleep condition. DEGs (adj. P-val <= 0.05; absolute log2(change) => 0.3) are indicated by black dots. (C) A Venn diagram showing overlap between DEGs for Mef2cf/f and Mef2c-cKOCamk2a-Cre between CS and SD sleep states. (D) Immunoprecipitation of MEF2C to detect MEF2C, Phospho-S396 MEF2C Phospho-S396 and total MEF2C for each sleep condition. Phospho-MEF2 (top blot) re-labeled from immunoprecipitation of total MEF2C (middle blot) was quantified and normalized to total MEF2C signal for each sample (n = 4 samples/condition). Total MEF2C from total cell lysate was quantified and normalized to B-actin (bottom blot). Data reported as mean +/- SEM. Statistical significance was determined by one-way ANOVA with Tukey’s multiple comparisons test (interaction = p < 0.05, post-hoc test comparing CS to SD *=p < 0.05). (E) Model showing role of de-phosphorylated, activated MEF2C, increased relative to total MEF2C by loss of sleep and leading to synapse remodeling. MRE = Mef2 response element, CN = calcineurin.
Figure 4
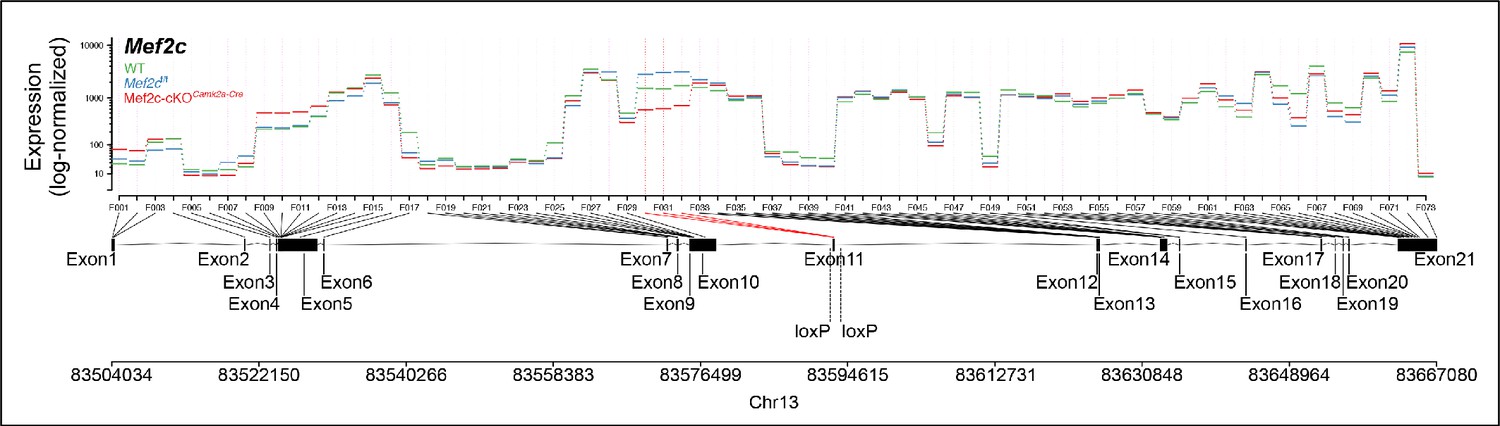
Differential exon usage analysis showing minor variability in exon expression between WT, Mef2cf/f and Mef2c-cKOCamk2a-Cre samples, also indicating specific reduction of floxed exon in Mef2c-cKOCamk2a-Cre.
Figure 5 with 1 supplement
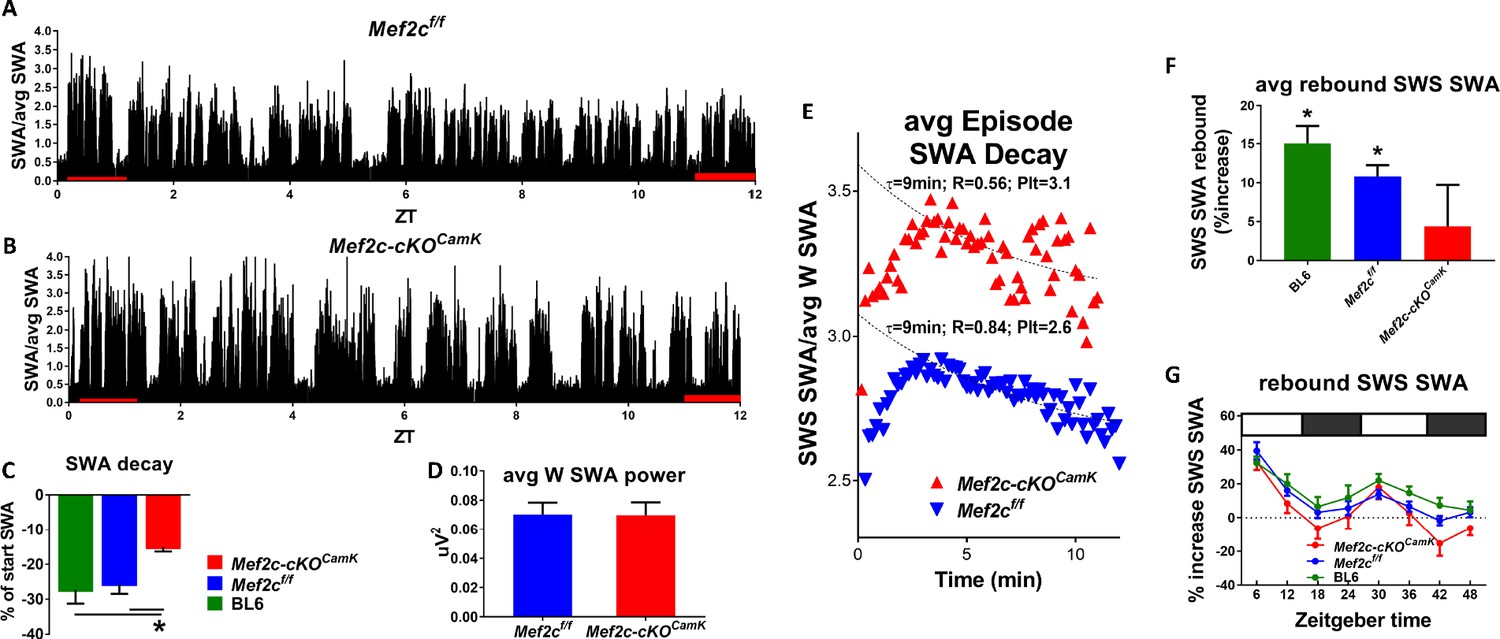
Loss of Mef2c increases sleep need and decreases its resolution.
(A) SWA power (normalized to average SWA power over 24 hr) declines over the light phase as shown in a Mef2cf/f mouse. (B) The decline is less apparent in an example from a Mef2c-cKOCamk2a-Cre mouse. (C) Pooled data (Mef2cf/f, n = 6; Mef2c-cKOCamk2a-Cre, n = 11; C57BL/6, n = 6) SWA power decay over the light phase for WT (BL/6), Mef2cf/f and Mef2c-cKOCamk2a-Cre. (D) The average waking SWA power in 24 hr is similar for Mef2c-cKOCamk2a-Cre and Mef2cf/f and is used as a normalizing factor to assess averaged SWS episode power. (E) SWS-SWA power over time from an average of SWS episodes aligned from the time of transition from waking to SWS, set to t = 0. The time constant of decay, τ = 8.4 min, was calculated by best fit of the decay of power for the Mef2cf/f but the decay fit was indeterminate for Mef2c-cKOCamk2a-Cre (see Materials and methods section for details). By setting τ = 8.4 min, a best fit to single exponential decay provided a plateau value (minimal value), an extrapolated peak value and an indication of goodness of fit in comparison to Mef2cf/f. The SWS-SWA power for Mef2c-cKOCamk2a-Cre mice is greater than Mef2cf/f as determined by the plateau value (Plt) and the peak value. The quality of the fit is reduced as indicated by the R2 value. (F) The average SWS-SWA power of each genotype following repeated, regular bouts of 4 hr SD, was significantly increased compared to SWS-SWA power under baseline conditions. Mef2c-cKOCamk2a-Cre mice failed to show this rebound response to sleep loss. (G) The time course of rebound across the 8 × 4 hr SD periods indicates that the lack of rebound in Mef2c-cKOCamk2a-Cre is particularly prominent during the dark phase.
Figure 5—figure supplement 1

Loss of Mef2c does not influence sleep/waking time, but modestly alters spectral power distribution across states.
(A) A cumulative histogram of SWS episode durations shows a shift to the right for Mef2cf/f from CS to SD condition indicative of increased need for sleep. For Mef2c-cKOCamk2a-Cre the SD induced rightward shift is occluded, suggesting high sleep need in CS condition. (B) Time in waking, SWS, and REM (right axis) as a percent of total time is unchanged by loss of Mef2c. (C) Spectral power distribution is modulated by loss of MEF2C function. During waking, relative power in Mef2c-cKOCamk2a-Cre mice is shifted to the slower delta range frequencies compared to Mef2cf/f mice; during SWS, power in the delta range is decreased with loss of MEF2C function; during REM the power distribution is unaffected by genotype. Significant group by frequency differences are indicated by * for Mef2cf/f and Mef2c-cKOCamk2a-Cre groups.
Figure 6 with 1 supplement
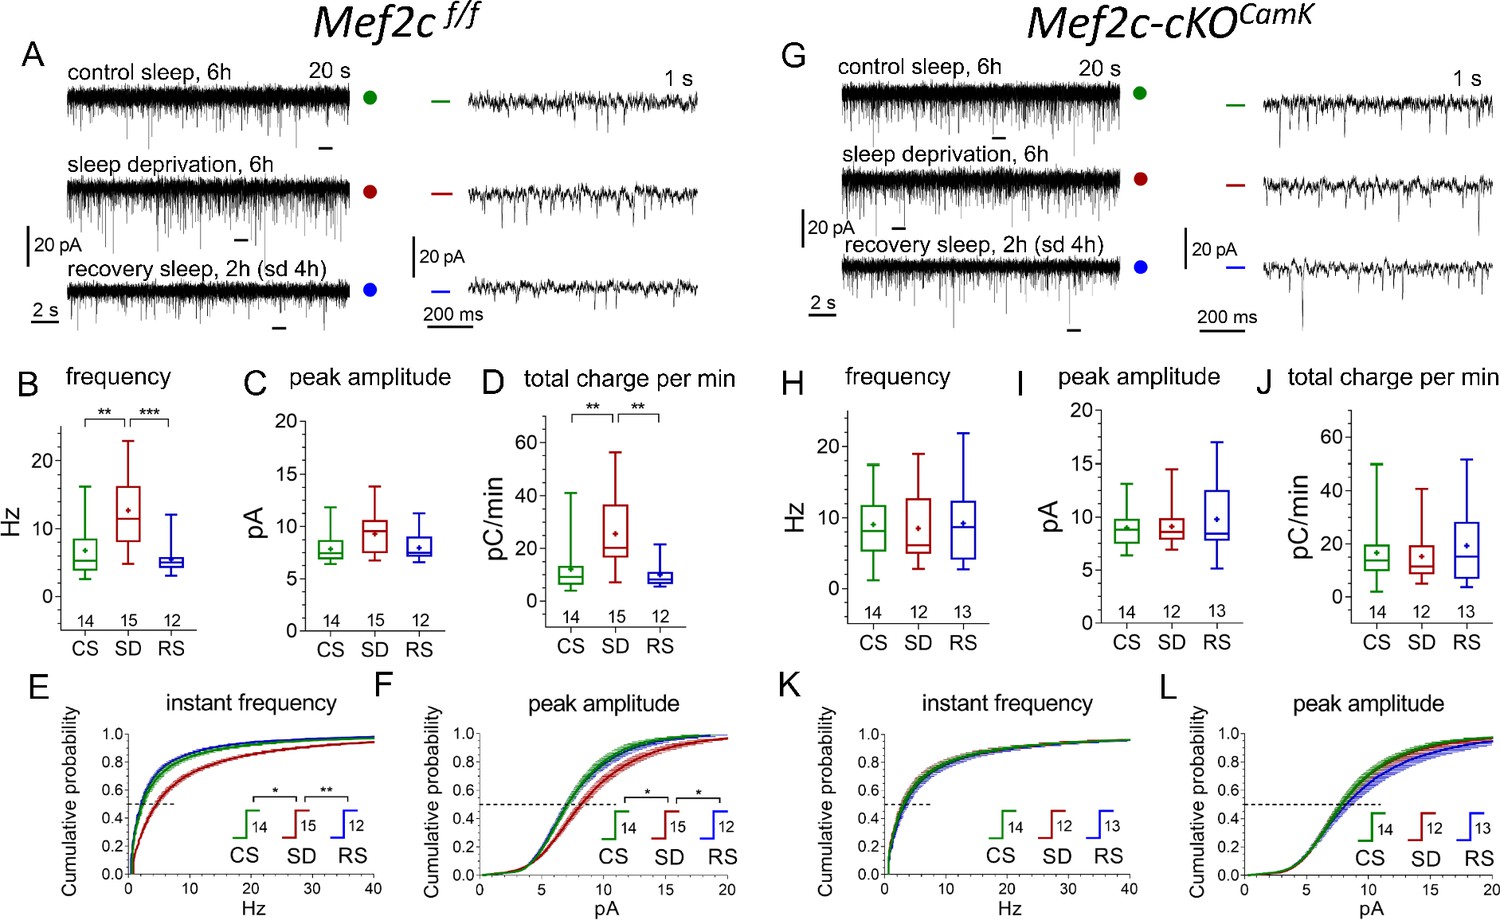
Conditional Mef2c knock-out in forebrain excitatory neurons eliminates sleep/wake remodeling of synaptic excitatory inputs to pyramidal neurons in anterior cingulate cortex slices.
(A, G) Representative recordings of miniature excitatory postsynaptic current (mEPSC) traces (20 s, left panels, and expanded 1 s traces on the right corresponding to time bars underneath original traces) obtained for three different experimental sleep/wake conditions, CS (green), SD (red), and RS (blue), for Mef2cf/f mice (A) and Mef2c-cKOCamk2a-Cre mice (G). (B,C,D) and (H,I,J) illustrate mEPSC functional parameters obtained from Mef2cf/f and Mef2c-cKOCamk2a-Cre (number of cells for each condition shown above X axis condition label; also see Figure 6—figure supplement 1 for comparison to WT). Averaged cumulative probability histograms for instant frequency and peak amplitude show increased frequency and amplitude with SD compared to CS or RS for Mef2cf/f (E, F) but not for Mef2c-cKOCamk2a-Cre mice (K, L). See Materials and methods and Supplementary file 6 for details and statistics.
Figure 6—figure supplement 1
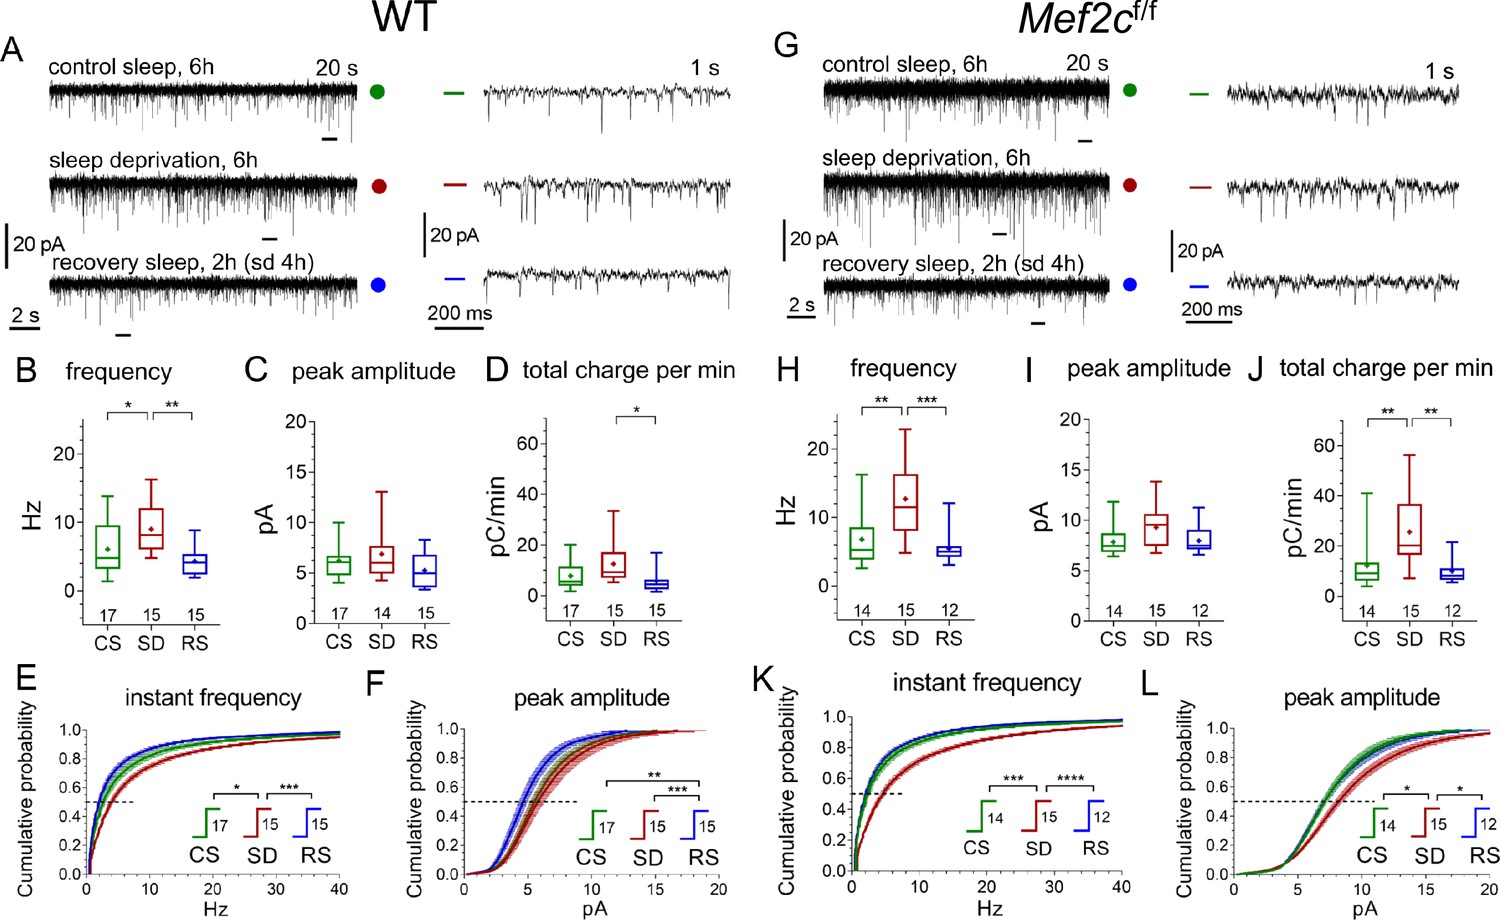
Similar responses of WT and Mef2cf/f mEPSCs to SD and RS conditions.
(A, G) Representative recordings of miniature excitatory postsynaptic current (mEPSC) traces (20 s, left panels, and expanded 1 s traces on the right corresponding to time bars underneath original traces) obtained for three different experimental sleep/wake conditions, CS (green), SD (red), and RS (blue), for WT mice (A) and Mef2cf/f mice (G). (B,C,D) and (H,I,J) illustrate mEPSC functional parameters obtained from WT and Mef2cf/fnumber of cells for each condition shown above X axis condition label. Averaged cumulative probability histograms for instant frequency and peak amplitude show increased frequency and amplitude with SD compared to CS or RS for WT (E, F) and Mef2cf/f mice (K, L).
Figure 7

No significant differences in presynaptic glutamate release probability between CS and SD are found in either control or Mef2c-cKOCamk2a-Cre mice.
(A and C) Representative paired-pulse recordings of excitatory postsynaptic currents (evoked EPSC) evoked in layer 2/3 pyramidal neurons by two brief electrical stimulations of axon terminals in layer I, 50 ms interval, obtained for three different experimental sleep/wake conditions (CS, SD, RS) imposed on Mef2cf/f mice (A) and Mef2c-cKOCamk2a-Cre mice (C), respectively. The probability of presynaptic release (Prelease), is inversely proportional to the ratio of EPSC amplitudes (1/Prelease ~ P2/P1); The P2/P1 ratio, obtained for three different experimental sleep/wake conditions (CS, SD, RS) and calculated separately for three different inter-pulse intervals (20, 50 and 100 ms), in Mef2cf/f (B) vs. Mef2c-cKOCamk2a-Cre mice (D). The plots (see Materials and methods, numbers of experiments for each sleep/wake conditions shown underneath boxes), show no significant differences between CS and SD conditions in either control or in Mef2c-cKOCamk2a-Cre mice.
Figure 8 with 2 supplements
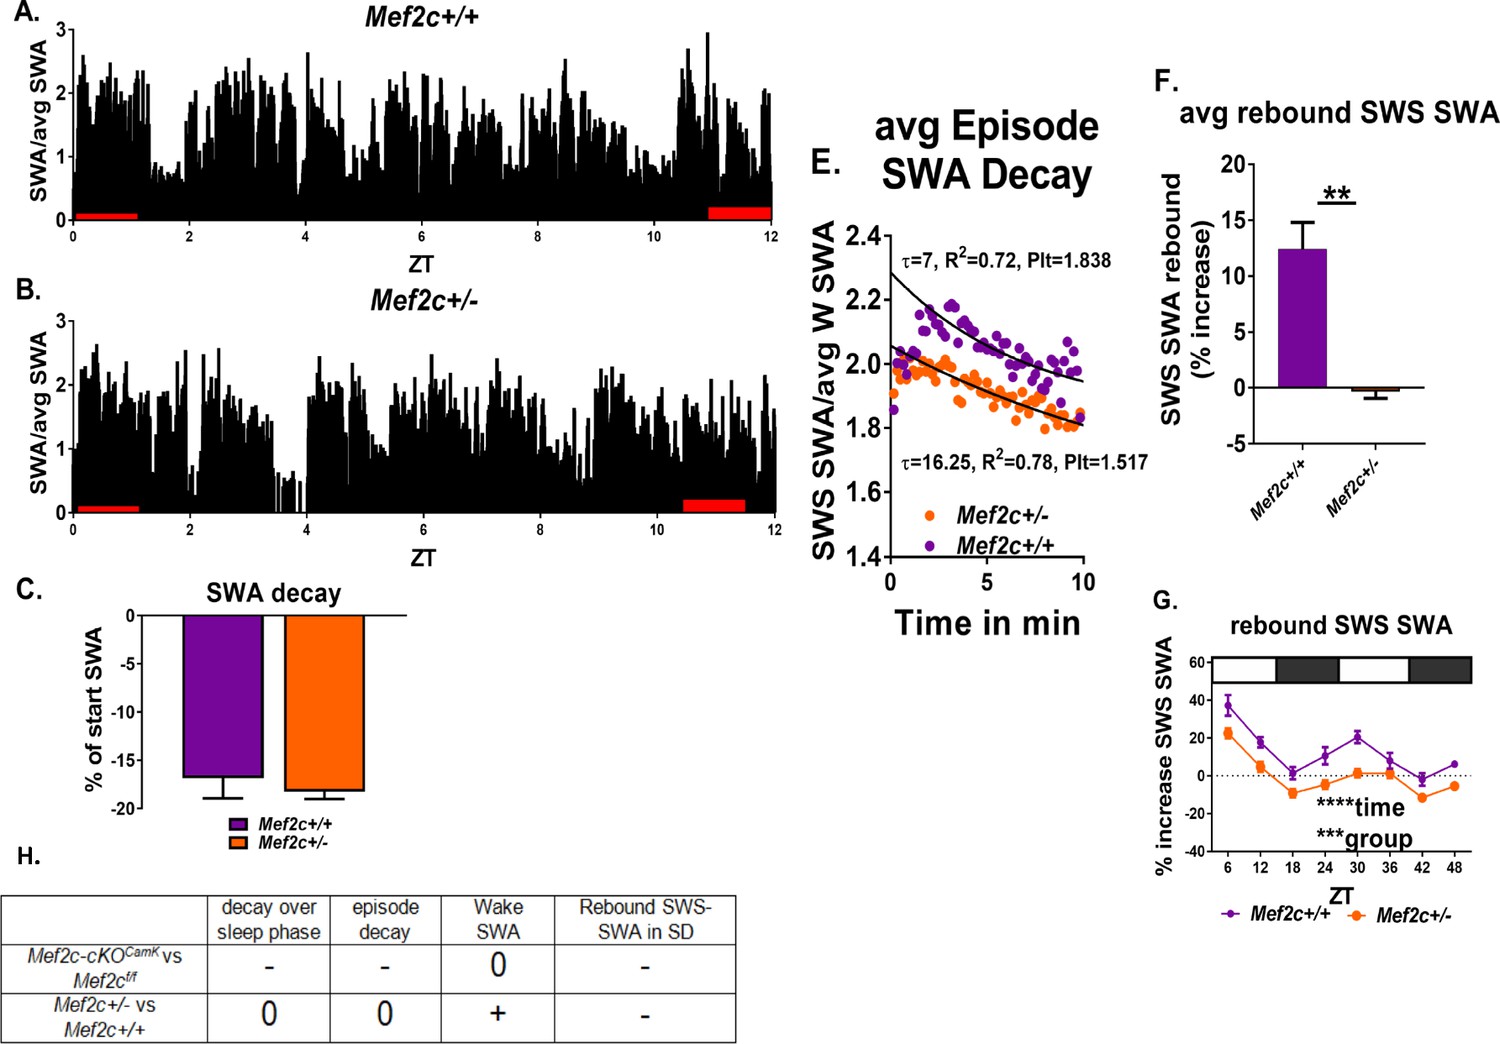
Mef2c+/- mice resolve sleep need in undisturbed conditions but lack a rebound increase of SWS-SWA power in response to sleep loss.
(A,B) Average SWA power per 10 s epoch decreases during the sleep phase (ZT = 0 to 12 hr) to the same extent for Mef2c+/+ (n = 6) and Mef2c+/- (n = 6) mice (C). (D) Twenty-four hour average waking SWA power is greater for Mef2c+/- mice. (E) Decay of SWA power (normalized to the average 24 hr waking SWA) during an average SWS episode is preserved in the Mef2c+/- mice but with an increased τ, associated with increased sleep need. (F, G) Rebound increased SWS-SWA in response to SD is absent in Mef2c+/- mice. The SD was administered in repeated 6 hr cycles of 4 hr SD and 2 hr RS. (H) A table showing responses of Mef2c-cKOCamk2a-Cre and Mef2c+/- compared to their respective controls (see Figure 5).
Figure 8—figure supplement 1
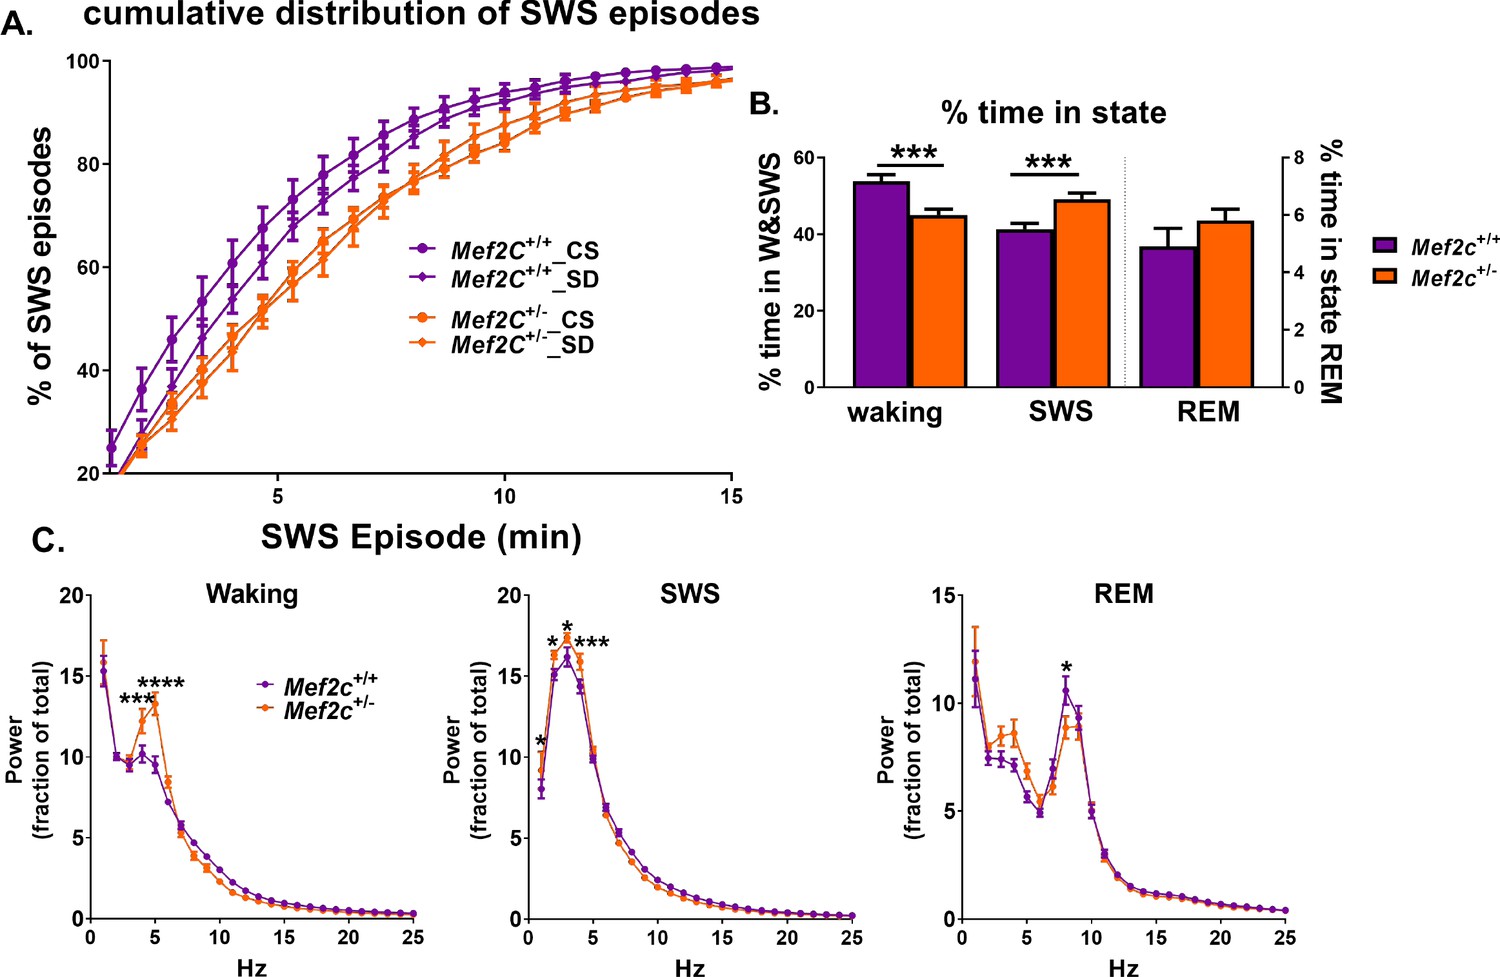
Mef2c+/- mice are similar to Mef2c+/+ mice with respect to SD evoked increase in SWS episode consolidation.
(A) A cumulative histogram SWS episode duration showing a generalized shift to the right of the episode duration evoked by SD for both Mef2c+/- and Mef2c+/+ mice. (B) Histograms of relative time spent in waking, SWS or REM show Mef2c+/- mice have significantly less waking time and increased SWS time under baseline conditions. (C) The frequency/power distribution of the EEG shows that Mef2c+/- mice have relatively more fast delta and slow theta-range power during waking, more delta-range power during SWS, and more mid-theta-range power during REM, than their Mef2c+/+ controls.
Figure 8—figure supplement 2
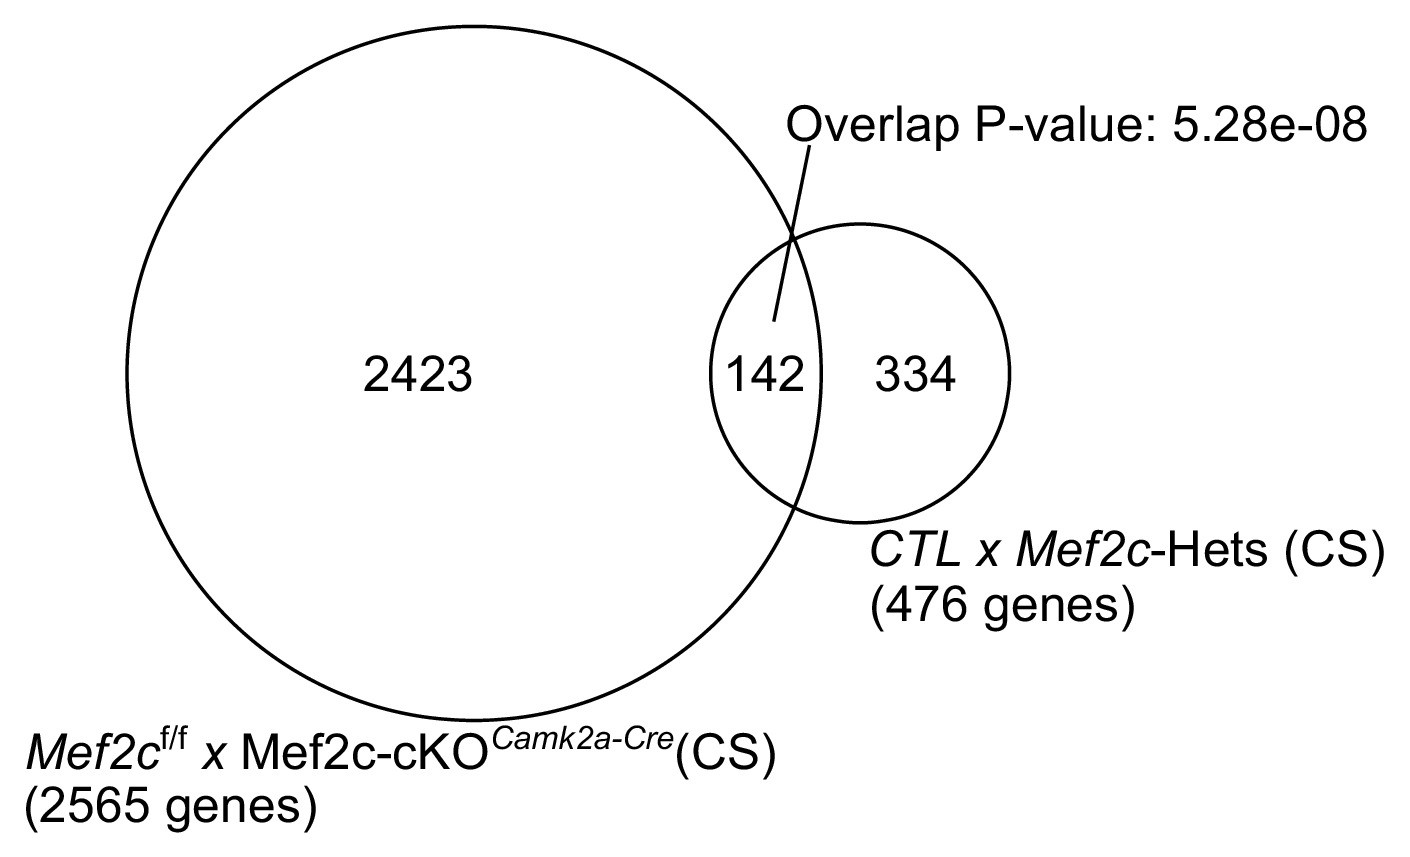
Total of 2565 differentially expressed genes across Mef2cf/f and Mef2c-cKOCamk2a-Cre under CS conditions.
476 differentially expressed genes from Mef2c+/- compared to Mef2c+/+ at CS share a significant set of overlapping genes (142; P-value: 5.28e-08, Fisher’s exact test).
Figure 9
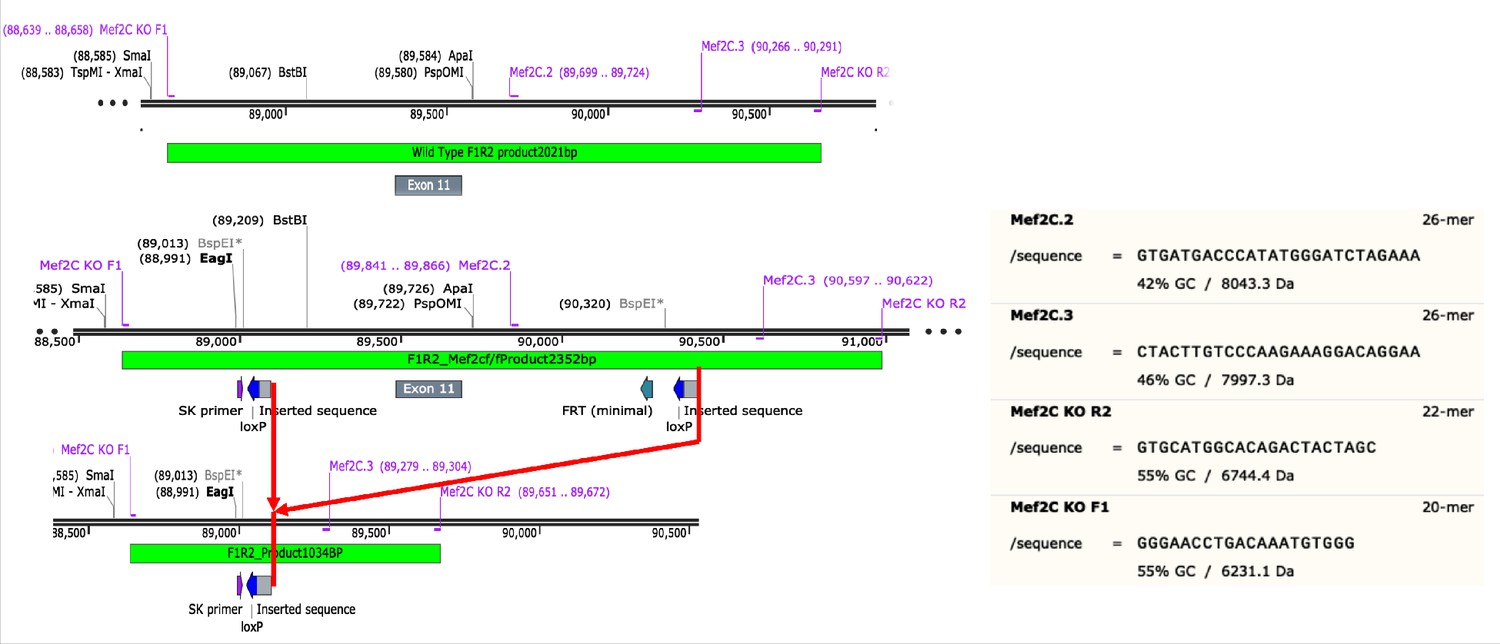
Schematic of Mef2c genomic DNA sequence to illustrate locations of knockin sequences of loxP and their recombination product used in this study.
Figure 10
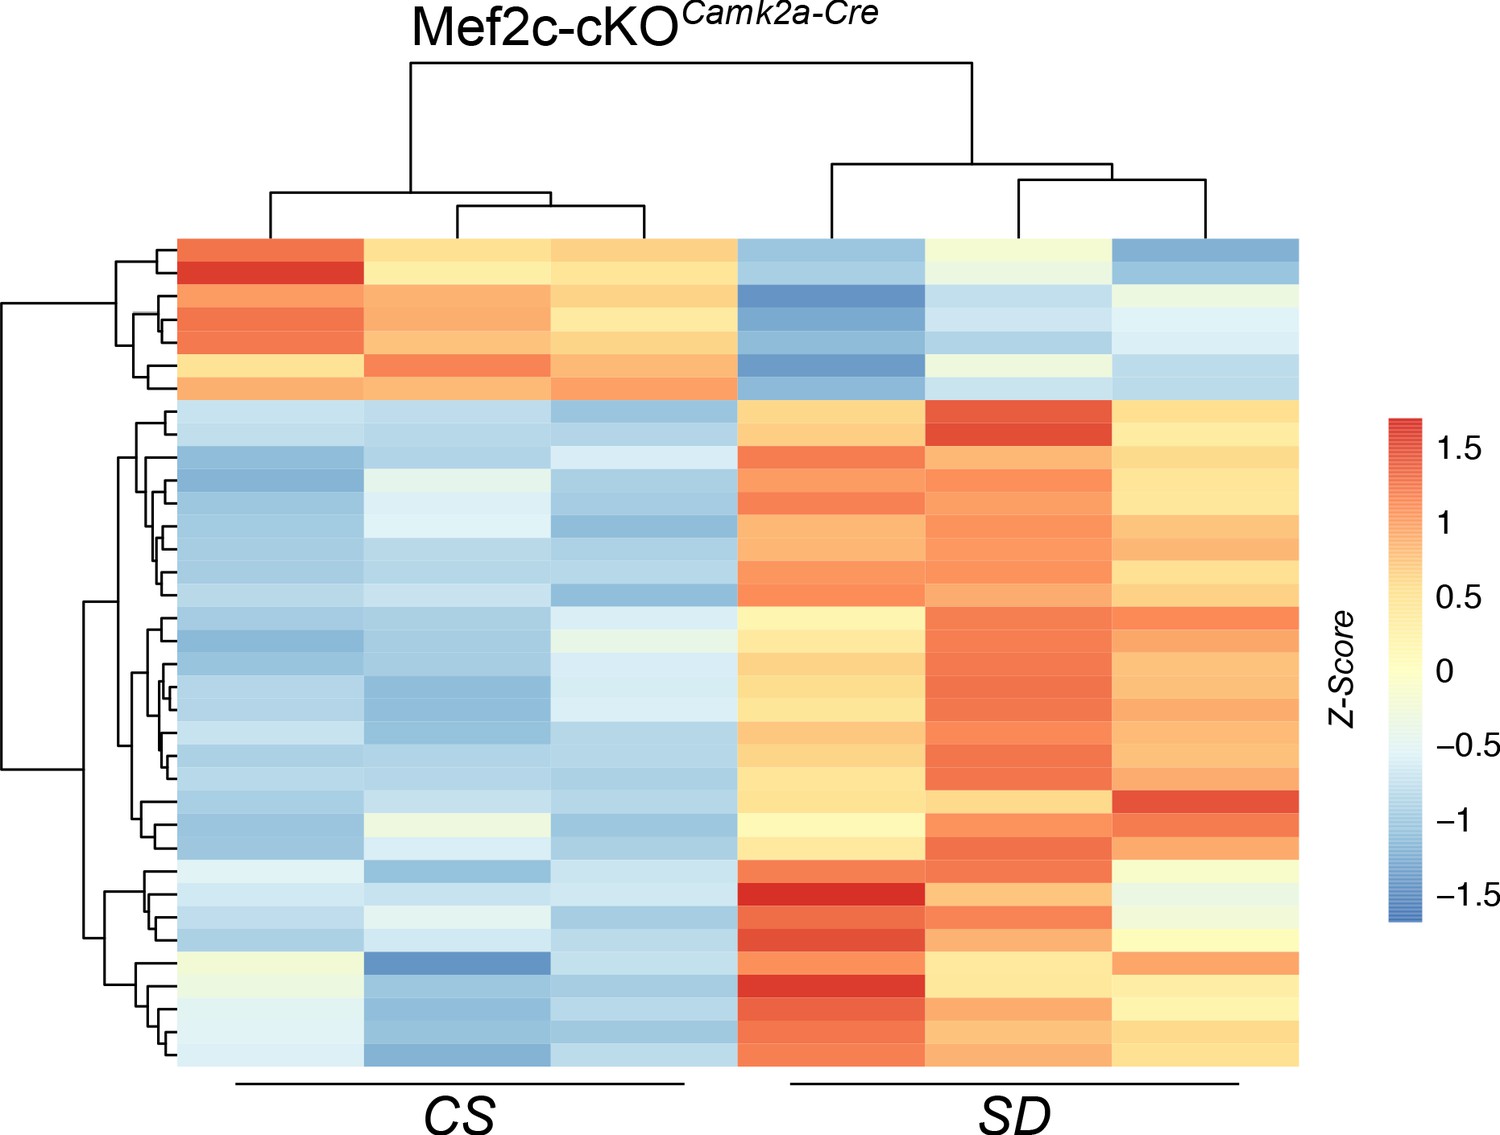
Heat map of DEGs from Mef2c-cKOCamk2a-Cre mouse samples under CS or SD conditions.
The sample from the second column (CS) showed a similar DEG clustering pattern to the other two samples that had germline recombination.
Author response image 1
Author response image 2

Videos
Video 1
Mouse on moving treadmill in SD configuration.
Tables
Key resources table
| Reagent type (species) or resource | Designation | Source or reference | Identifiers | Additional information |
|---|---|---|---|---|
| Genetic reagent (Mus. Musculus) | C57BL/6 background | Jackson Laboratories | WT (8–19 weeks old) | |
| Genetic reagent (Mus. Musculus) | Mef2cf/f(C57BL/6J background) | Arnold et al., 2007; PMID:17336904 | RRID:MGI:3719006 | Mef2cf/f(8–19 weeks old): knock-in of loxP sites flanking exon 11 of the Mef2c gene, a control for the Mef2c-cKOCamk2a-Cre |
| Genetic reagent (Mus. Musculus) | C57BL/6 background, B6.Cg- Tg(Camk2a-Cre)T29-1Stl/J | Jackson Laboratories | Mef2c-cKOCamk2a-Cre (8–19 weeks old): CRE-mediated recombination of the Mef2cf/floxP sites, resulting in a region and cell type specific conditional knockout Mef2c-cKOCamk2a-Cre | |
| Genetic reagent (Mus. Musculus) | Mef2c+/- (backcrossed to C57BL/6J) | Harrington et al., 2020. PMID:32418612. | ||
| Antibody | Anti-MEF2C (Mouse, Monoclonal) | Novus | Cat. # NBP2-00493 | Immunoprecipitation (2 ul (ug) per sample) |
| Antibody | anti-MEF2C (Rabbit, Monoclonal) | Abcam | Cat. #: ab197070; RRID:AB_2629454 | (1:2500) (WB) |
| Antibody | anti-phospho-MEF2 (Rabbit, Polyclonal) | Phospho-peptide affinity purified in-house (as described in Flavell et al., 2006. PMID:16484497) | (1:200) (WB) | |
| Antibody | Anti-beta-actin (Rabbit, Monoclonal) | Cell Signaling | Cat. #: 4970S RRID:AB_2223172 | (1:1000) (WB) |
| Antibody | IRDye 800CW Goat anti-Rabbit IgG Secondary Antibody | Li-Cor | Cat. #: 926–32211 | (1:20,000) (WB after IP) |
| Sequence-based reagent | Mef2C KO F1 | This paper (GGGAACCTGACAAATGTGGG) | PCR Primers | Products of 2 kb for non-recombined Mef2cf/fand 1 kb for recombined Mef2c-cKOCamk2a-Cre alleles |
| Sequence-based reagent | Mef2C KO R2 | This paper (GTGCATGGCACAGACTACTAGC) | PCR Primers | |
| Commercial assay or kit | RNeasy mini kit | Qiagen | Cat. #. 74104 | RNA purification |
| Commercial assay or kit | TrueSeq Stranded mRNA Library Prep | Illumina | Cat. #. 20020596 | RNA-seq library preparation |
| Commercial assay or kit | Agilent Bioanalyzer High-Sensitivity DNA chip | Agilent | Cat. #. 5067–1504 | |
| Commercial assay or kit | DC Protein Assay Kit II | Bio-Rad | Cat. #: 5000112 | |
| Commercial assay or kit | 7.5% Mini-PROTEAN TGX Stain-Free Protein Gels, 15 well, 15 µl | Bio-Rad | Cat.#: 4568026 | WB after IP |
| Commercial assay or kit | Trans-Blot Turbo Midi PVDF Transfer Packs | Bio-Rad | Cat. #: 1704157 | WB after IP |
| Commercial assay or kit | Odyssey blocking buffer | Li-Cor | Cat. #: NC9877369 | WB after IP |
| Chemical compound, drug | TRIzol reagent | Thermo Fisher Scientific | Cat. #. 15596026 | RNA extraction |
| Software, algorithm | GraphPad Prism | GraphPad Prismhttps://graphpad.com | ||
| Software, algorithm | FASTQC | Babraham Bioinformaticshttps://www.bioinformatics.babraham.ac.uk/projects/fastqc | ||
| Software, algorithm | Trimmomatic | Bolger et al., 2014 | ||
| Software, algorithm | STAR | Dobin et al., 2013 | ||
| Software, algorithm | R | R Foundationhttps://www.r-project.org | ||
| Software, algorithm | HTSeq | Anders et al., 2015 | R package | |
| Software, algorithm | edgeR | McCarthy et al., 2012 Robinson et al., 2010 | R package | |
| Software, algorithm | DESeq2 | Anders and Huber, 2010 Love et al., 2014 | R package | |
| Software, algorithm | UpSetR | Conway et al., 2017 | R package | |
| Software, algorithm | WGCNA | Weighted gene co-expression network analysis Langfelder and Horvath, 2008 | R package | |
| Software, algorithm | DEXseq | Anders et al., 2012 | R package | |
| Software, algorithm | ToppGene | Chen et al., 2009 https://toppgene.cchmc.org | Web-tool | |
| Software, algorithm | REVIGO | http://revigo.irb.hr Supek et al., 2011 | Web-tool | |
| Other | Single-cell RNA-seq Dataset | Mouse visual cortex single cell RNA-seq dataset Hrvatin et al., 2018 | NCBI GEO: GSE102827 | |
| Other | Protein G Plus/A agarose beads | Millpore Sigma | IP05 | Immunoprecipitation (75 ul per sample) |
Additional files
-
Supplementary file 1
Differentially expressed genes (DEG) across sleep states.
(1) DEG for CS to SD, (2) DEG for CS to RS, (3) DEG for SD to RS, (4) list of overlapping and unique genes across sleep states (Figure 1D) and (5) list of overlapping genes between genes shared by SD and RS against rPRGs (Tyssowski et al.) and ERTFs (Hrvatin et al.)
- https://cdn.elifesciences.org/articles/58331/elife-58331-supp1-v2.xlsx
-
Supplementary file 2
Overlapping SD genes with glucocorticoid cellular response genes.
The GC response genes are a subset (27/44) from MGI GO:0071385 that we identified as being expressed in the frontal cortex.
- https://cdn.elifesciences.org/articles/58331/elife-58331-supp2-v2.xlsx
-
Supplementary file 3
GO for shared and unique differentially expressed genes (DEG).
(1) GO for genes shared by SD and RS with increased expression against CS, (2) GO for genes shared by SD and RS with decreased expression against CS, (3) GO for genes unique to SD with increased expression against CS, (4) GO for genes unique to SD with decreased expression against CS, (5) GO for genes unique to RS with increased expression against CS and (6) GO for genes unique to RS with decreased expression against CS.
- https://cdn.elifesciences.org/articles/58331/elife-58331-supp3-v2.xlsx
-
Supplementary file 4
GO for gene modules identified by weighted correlation network analysis (WGCNA).
(1) Intermodular connectivity across modules, (2) genes associated with each module (3-61) GO for genes within each module.
- https://cdn.elifesciences.org/articles/58331/elife-58331-supp4-v2.xlsx
-
Supplementary file 5
Differentially expressed genes (DEG) across sleep states for Mef2c-cKOCamk2a-Cre.
(1) DEG for CS to SD for Mef2cf/f and (2) DEG for CS to SD for Mef2c-cKOCamk2a-Cre.
- https://cdn.elifesciences.org/articles/58331/elife-58331-supp5-v2.xlsx
-
Supplementary file 6
Functional parameters of mEPSCs.
Recordings were obtained ex Vivo from anterior cingulate cortex excitatory neurons of Mef2cf/f and Mef2c-cKOCamk2a-Cre mice exposed to three different sleep/wake experimental conditions: control sleep 6 hr (CS), sleep deprivation 6 hr (SD) and sleep deprivation 4 hr followed by recovery sleep 2 hr (RS).
- https://cdn.elifesciences.org/articles/58331/elife-58331-supp6-v2.docx
-
Supplementary file 7
Paired pulse ratio of evoked EPSCs.
P2/P1 was obtained at three different interpulse intervals (20, 50 and 100 ms), obtained in anterior cingulate cortex excitatory neurons of Mef2cf/f and Mef2c-cKOCamk2a-Cre mice exposed to three different sleep/wake experimental conditions: control sleep 6 hr (CS), sleep deprivation 6 hr (SD) and sleep deprivation 4 hr followed by recovery sleep 2 hr (RS).
- https://cdn.elifesciences.org/articles/58331/elife-58331-supp7-v2.docx
-
Supplementary file 8
Overlapping genes shared by (a) differentially expressed genes across Mef2cf/f and Mef2c-cKOCamk2a-Cre at CS and (b) differentially expressed genes across Mef2c-Hets and CTL at CS.
- https://cdn.elifesciences.org/articles/58331/elife-58331-supp8-v2.xlsx
-
Supplementary file 9
Number of detected DEGs for CS (n = 4) and SD (n = 3) in random down-sampling and permutation experiment over 100 iterations in comparison to WT DEGs for CS (n = 6) and SD (n = 7).
- https://cdn.elifesciences.org/articles/58331/elife-58331-supp9-v2.xlsx
-
Supplementary file 10
Tab ‘Overlap’: Overlap between DEGs for WT_CS|SD (6248 genes) and Mef2cff_CS|SD (767 genes).
Tab ‘Gene Ontology: GO of overlapped genes, ToppGene (https://toppgene.cchmc.org).
- https://cdn.elifesciences.org/articles/58331/elife-58331-supp10-v2.xlsx
-
Transparent reporting form
- https://cdn.elifesciences.org/articles/58331/elife-58331-transrepform-v2.docx
Download links
A two-part list of links to download the article, or parts of the article, in various formats.
Downloads (link to download the article as PDF)
Open citations (links to open the citations from this article in various online reference manager services)
Cite this article (links to download the citations from this article in formats compatible with various reference manager tools)
An essential role for MEF2C in the cortical response to loss of sleep in mice
eLife 9:e58331.
https://doi.org/10.7554/eLife.58331


