Expandable and reversible copy number amplification drives rapid adaptation to antifungal drugs
- Department of Microbiology and Immunology, University of Minnesota Medical School, United States
Figures
Figure 1 with 3 supplements
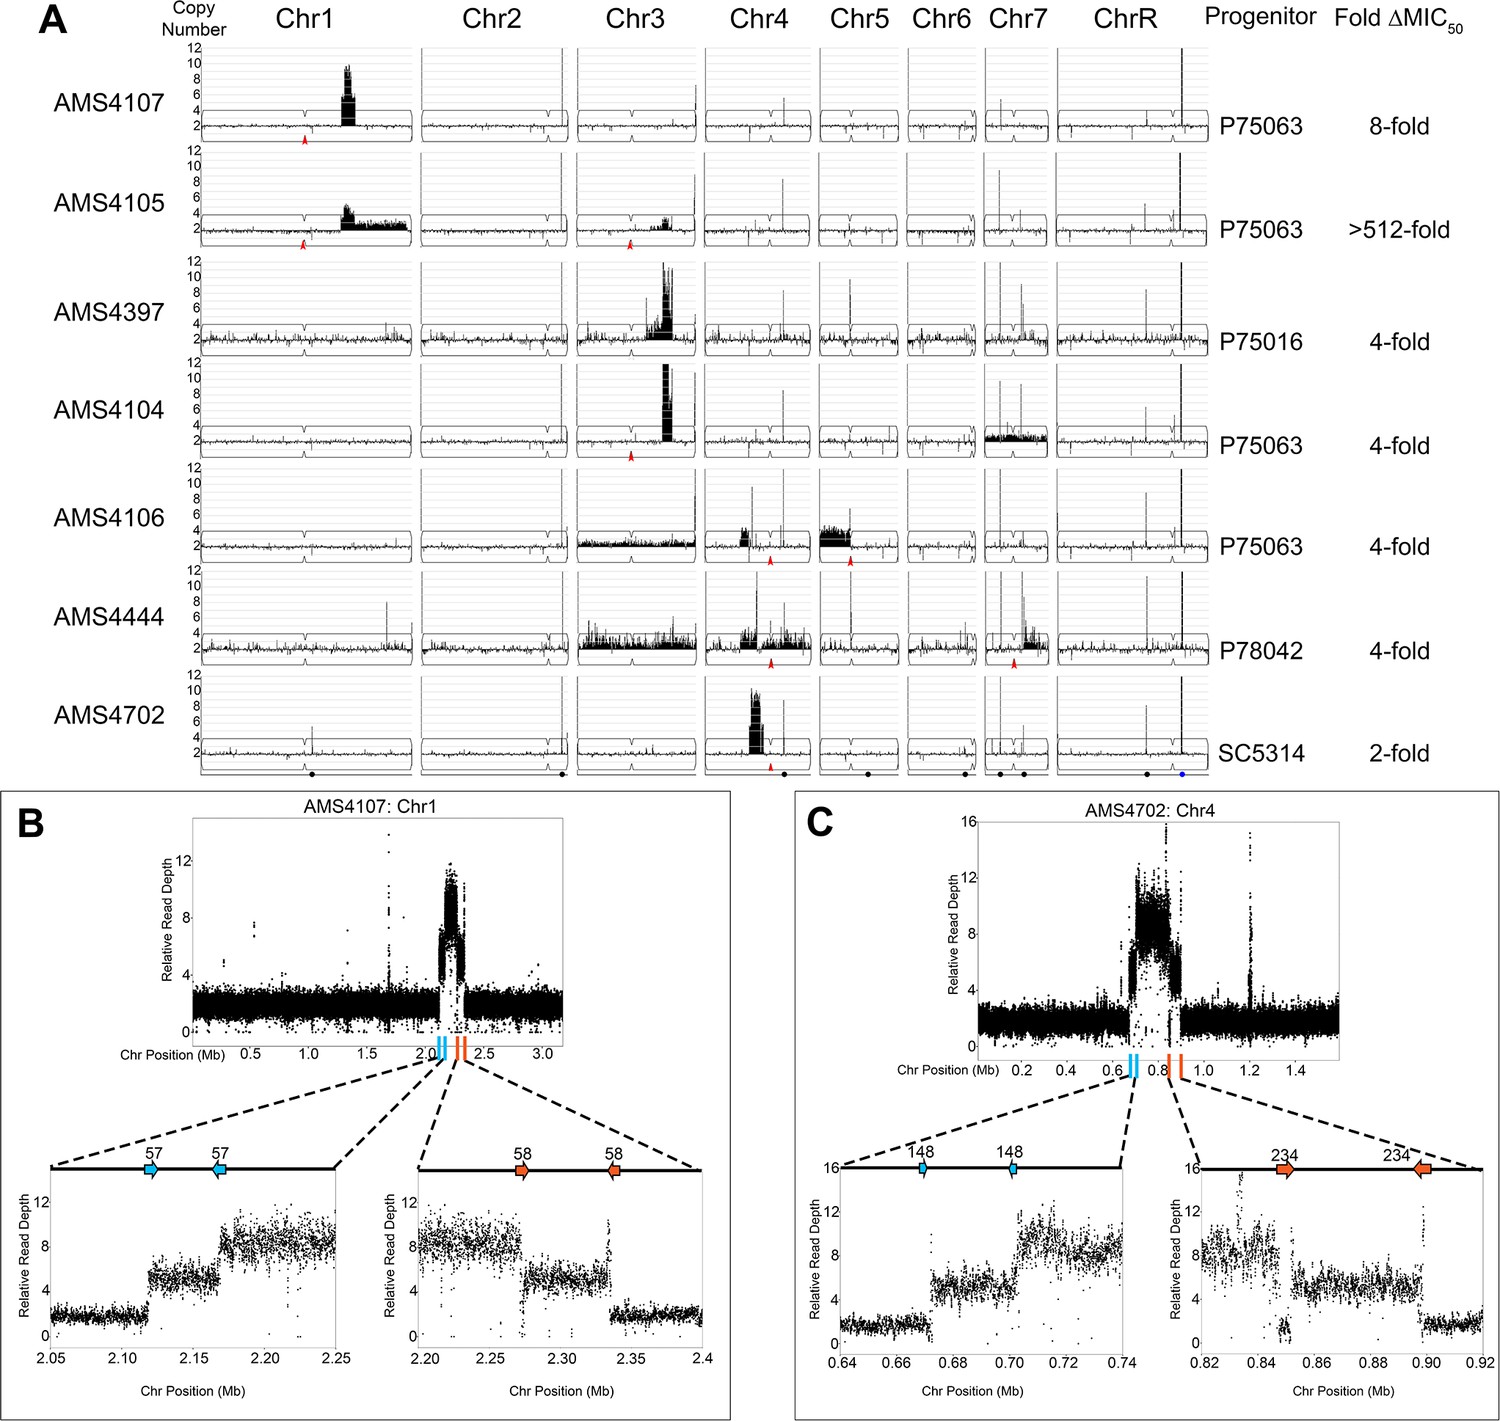
Complex CNVs are comprised of stair-step amplifications flanked by distinct long inverted repeat sequences.
(A) Whole genome sequence data of FLC-evolved isolates plotted as log2 ratio and converted to chromosome copy number (y-axis, 1–12 copies) and chromosome position (x-axis, Chr1-R) using the Yeast Mapping Analysis Pipeline (YMAP). Complex CNVs amplify >12 copies of a chromosomal region ranging from 164 kb to 1.02 Mb in length. Centromeres indicated with a red arrowhead. Chromosomal positions of all MRS sequences (black dots) and the rDNA array (blue dot) are indicated below AMS4702. The progenitor of each FLC-evolved isolate and the fold increase in FLC MIC50 at 48 hr between the progenitor and the FLC-evolved isolate is indicated. The symmetric stair-step CNV breakpoints for two isolates: (B) Chr1R of AMS4107 and (C) Chr4L of AMS4702. The relative genome sequence read depth is plotted according to chromosome position using R. The left and right side of each CNV (indicated with blue and orange lines along the x-axis of each chromosome) are expanded for higher resolution (left and right lower panels). In both isolates (AMS4107 and AMS4702), the CNV is flanked by two, distinct long inverted repeat sequences (blue and orange arrows) that do not share homology. The highest copy number amplification occurs between the two, distinct inverted repeats. All copy number breakpoints and long inverted repeat sequence details are found in Supplementary file 2. All genes found within the amplified regions are found in Supplementary file 4. Repeat numbers refer to Supplementary file 2 from Todd et al., 2019.
Figure 1—figure supplement 1
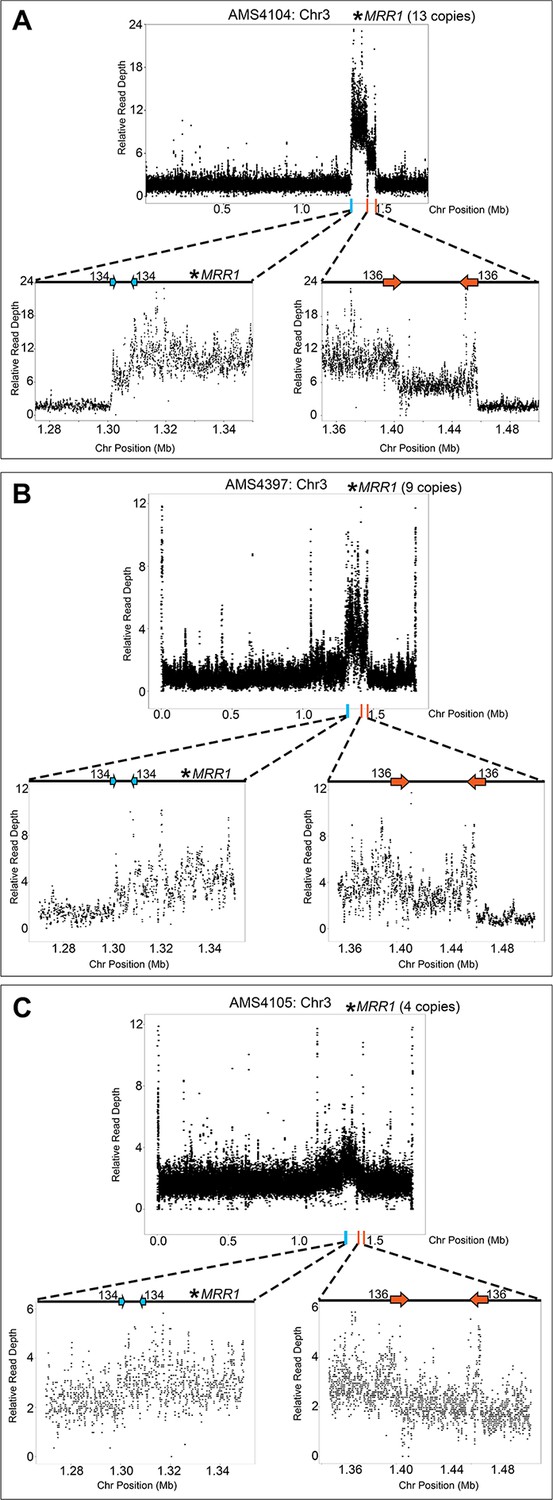
Recurrent CNV breakpoints located on Chr3R amplify MRR1.
The relative genome sequence read depth is plotted according to chromosome position using R. The left and right side of the highest copy number region of the CNV (indicated with blue and orange lines along the x-axis of each chromosome) are expanded for higher resolution (left and right lower panels). Isolates (A) AMS4104, (B) AMS4397, and (C) AMS4105 all amplify a ~208 kb region on Chr3R that includes MRR1 (asterisks), the transcriptional regulator of the multidrug transporter Mdr1.
Figure 1—figure supplement 2
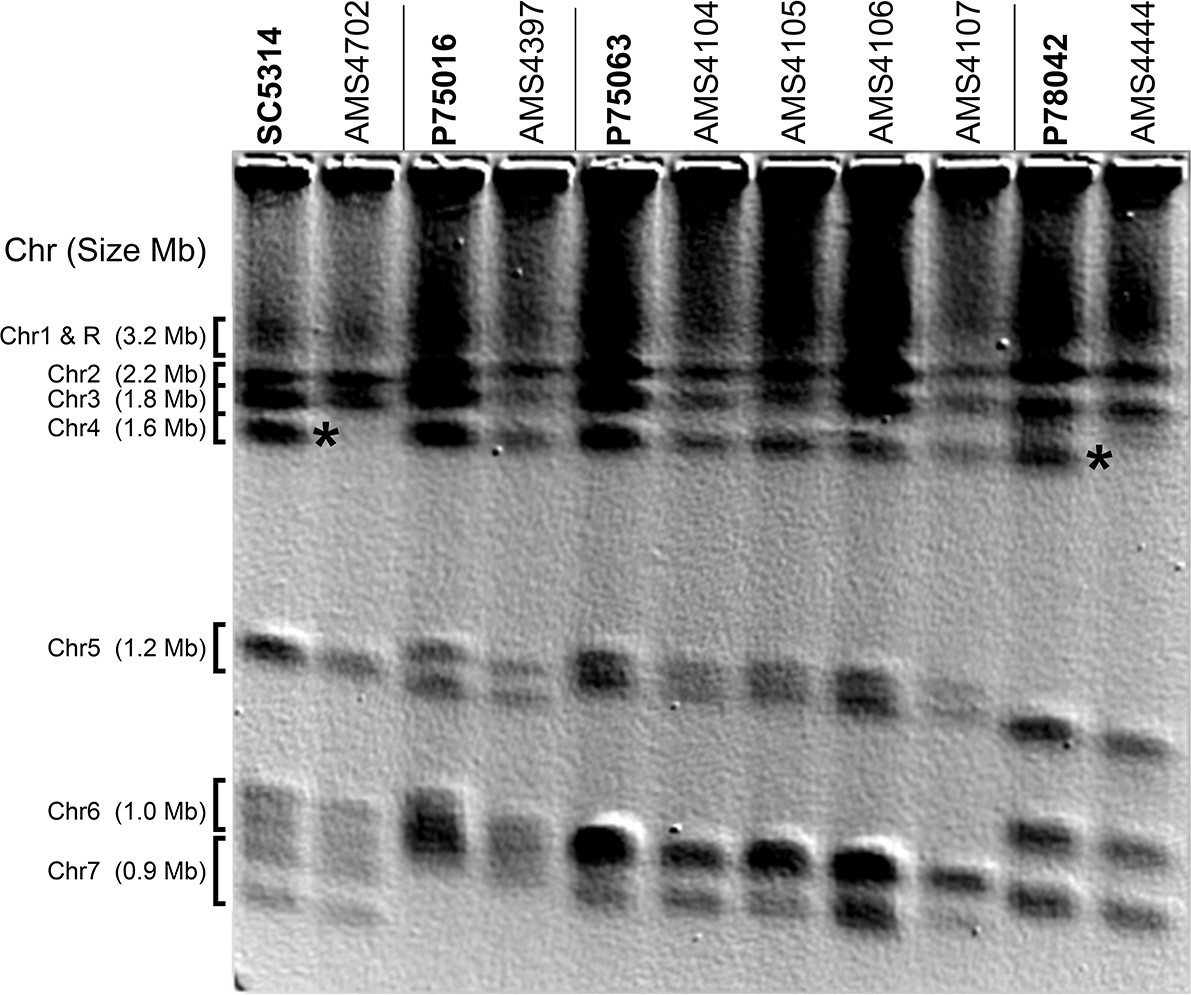
Complex CNVs increase chromosome size.
Contour-clamped homogenous electric field (CHEF) electrophoresis of each progenitor (in bold) and FLC-evolved isolates. Chromosomes (Chr) are labeled to the left of the gel (approximate Chr sizes based on SC5314); some progenitors have separable homologs of Chrs 4–7. An increase in Chr4 size due to the Chr4L CNV (Figure 1) is indicated for two FLC-evolved isolates (AMS4702 and AMS4444, asterisks) relative to their progenitor (SC5314 and P78042, respectively). The Chr4L CNV increases the size of Chr4 from ~1.6 Mb to ~3.4 Mb for AMS4702 and to ~2.8 Mb for AMS4444, and results in the Chr4 band migrating with Chr1 and ChrR, respectively. Approximate chromosome size increases due to each CNV are in Supplementary file 6.
Figure 1—figure supplement 3
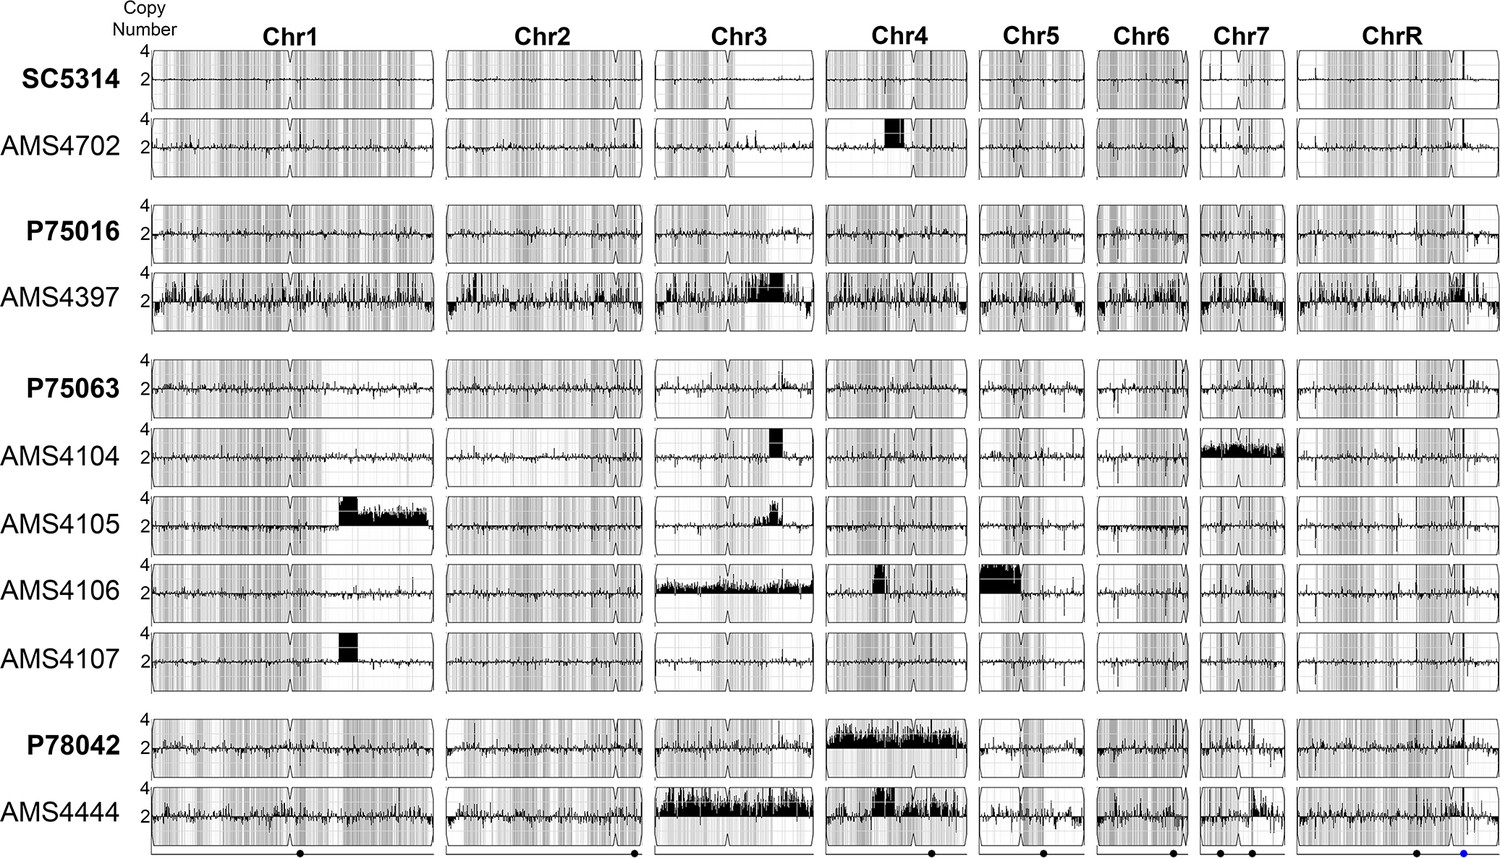
Complex CNVs are predominantly found in homozygous sequence.
Whole genome sequence data of progenitor isolates in bold (SC5314, P75016, P75063, and P78042) and independent, FLC-evolved isolates (AMS4702, AMS4397, AMS4104, AMS4105, AMS4016, AMS4017, and AMS4444) plotted as log2 ratio and converted to chromosome copy number (y-axis) and chromosome position (x-axis) using YMAP. Heterozygous loci indicated with gray hashing. Over half (7/10) of the CNVs detected occur in regions that are already homozygous in the progenitor. For example, allele ratios indicate that the CNV breakpoints on Chr1 (AMS4105 and AMS4107), Chr3 (AMS4397, AMS4104, and AMS4105), Chr5 (AMS4106), and Chr7 (AMS4444) occurred at regions that were homozygous or were heterozygous-to-homozygous breakpoints in the progenitor. (1/10) of the CNVs coincide with novel loss of heterozygosity (LOH) breakpoints (Chr4, AMS4702). (2/10) CNVs occurred in heterozygous sequence, and allele ratios scale with copy number (Chr 4, AMS4106 and AMS4444). These data suggest that CNVs, when heterozygous, are from a single haplotype, and that many of these CNVs may be transient events that previously drove LOH in the progenitor.
Figure 2 with 1 supplement

Complex CNVs increase multidrug fitness and tolerance.
(A–D) 36 hr growth curve analysis in the absence (YPAD, left) and presence of FLC (YPAD + 1 μg/ml FLC) for each progenitor (black) and FLC-evolved isolate with a complex CNV. Average slope and standard error of the mean for three biological replicates is indicated. (E–F) Heat map of isolate growth (OD600 at 24 and 48 hr) in two-fold increasing concentrations of the azole antifungal drugs (E) fluconazole (FLC) and (F) miconazole. The drug concentration at which 50% of growth is inhibited (MIC50) is denoted with a yellow line on the heat map. Each heat map represents the average of three independent MIC50 assays. Supra-MIC growth (SMG), a measurement of tolerance, was calculated as the average growth at 48 hr above the MIC50 at 24 hr divided by the growth at 48 hr in no drug (see Materials and methods, Figure 2—source data 1).
-
Figure 2—source data 1
Minimum inhibitory concentration raw data.
- https://cdn.elifesciences.org/articles/58349/elife-58349-fig2-data1-v1.xlsx
Figure 2—figure supplement 1

Complex CNVs increase tolerance and reduce susceptibility to multiple azole drugs.
Heat map of OD600 values at 24 and 48 hr in two-fold increasing concentrations of the following azole antifungal drugs: (A) fluconazole (FLC); (B) miconazole; (C) itraconazole; (D) ketoconazole; and (E) posaconazole. The MIC50 is denoted with a yellow line. Each heat map represents the average of three independent MIC50 assays. Independently evolved isolates are grouped by progenitor (bold). Supra-MIC growth (SMG), a measurement of tolerance, was calculated as the average growth at 48 hr for all wells above the MIC50 at 24 hr divided by the growth at 48 hr in no drug (see Materials and methods, Figure 2—source data 1).
Figure 3 with 2 supplements
Complex CNVs are rapidly expandable in the presence of antifungal drug.
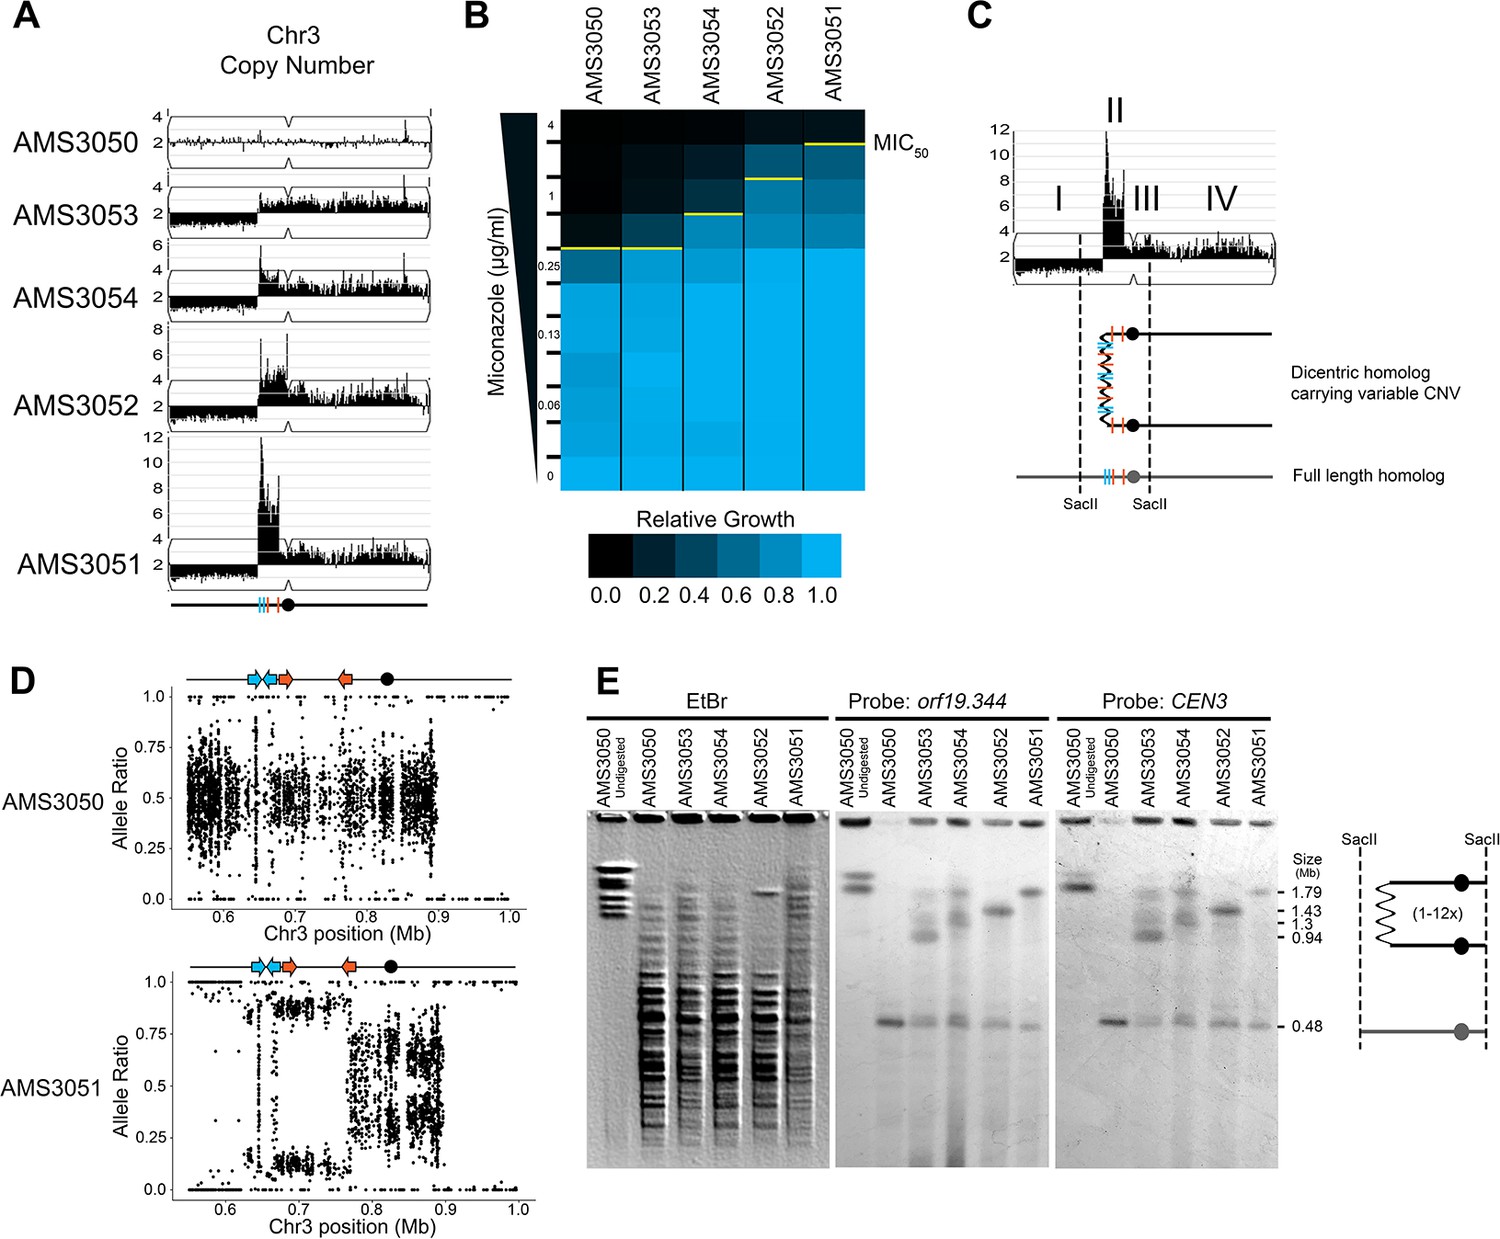
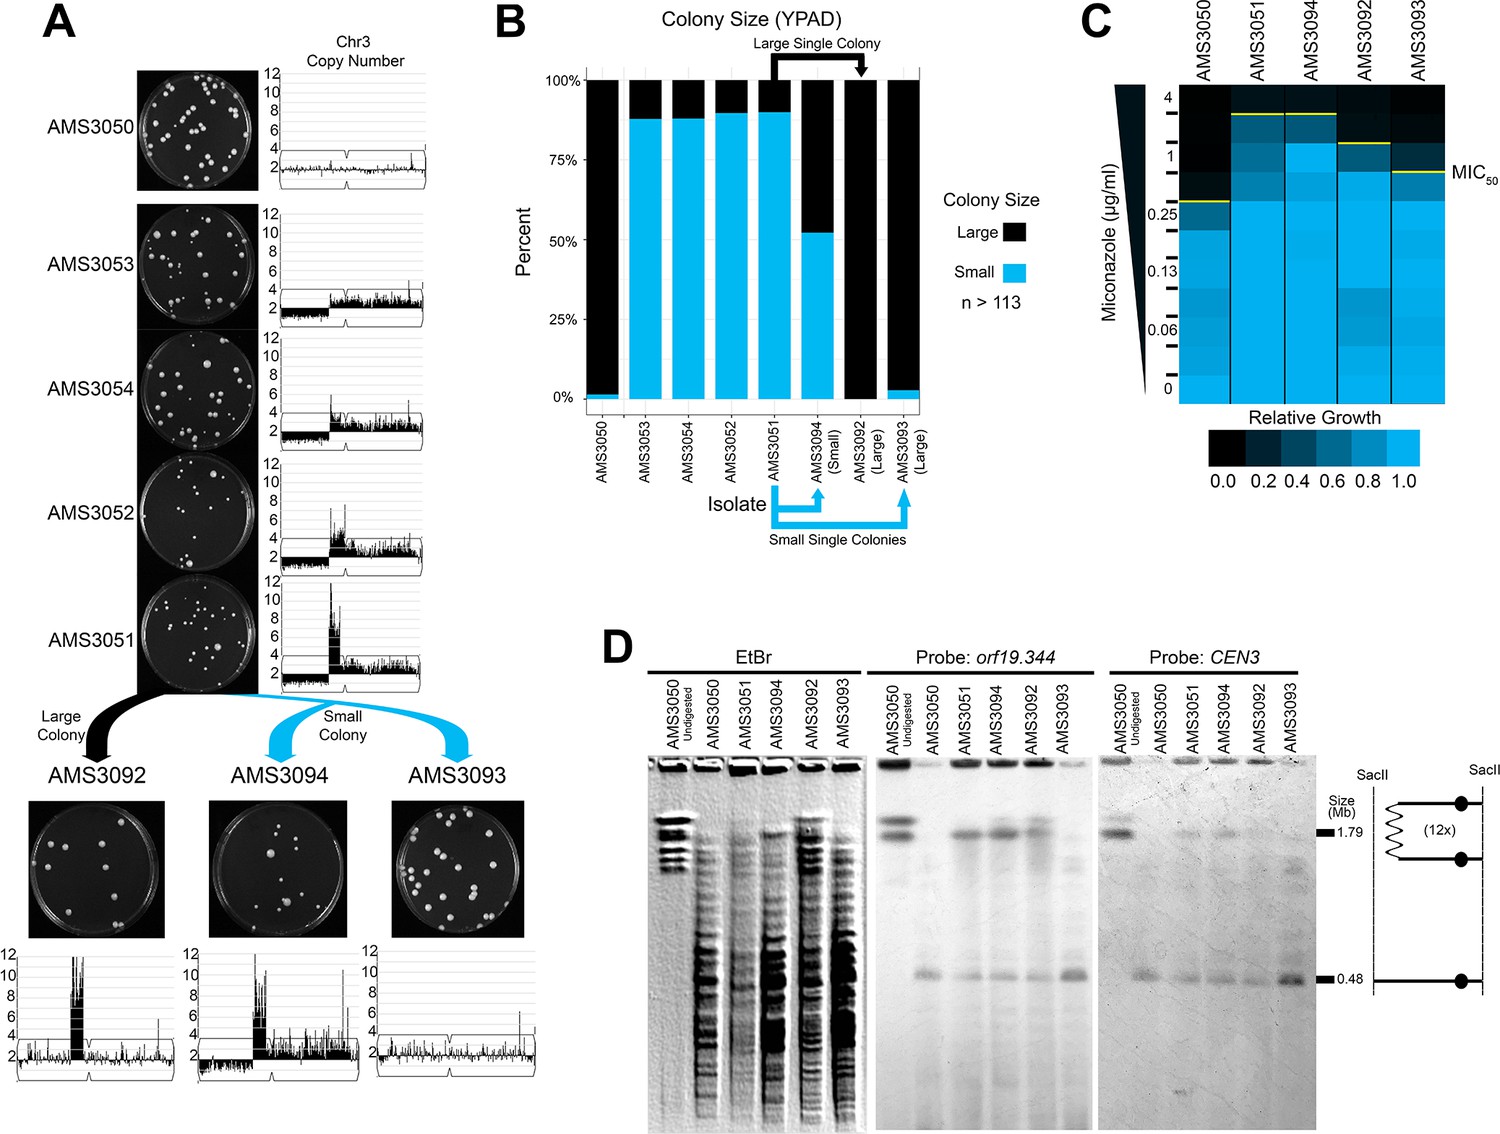
(A) Whole genome sequence data of progenitor isolate (AMS3050) and miconazole-evolved single colonies (AMS3053, AMS3054, AMS3052, and AMS3051) plotted as in Figure 1A. All four colonies are monosomic from the Chr3L telomere to a CNV breakpoint at Repeat 124 (blue lines). Stair-step complex CNVs (3 to 14 copies per genome) occur on Chr3L between two distinct long inverted repeat sequences: Repeat 124 (blue lines) and Repeat 127 (orange lines) (detailed in Figure 3—figure supplement 1). All four colonies are trisomic for the Chr3 centromere (CEN3, black circle) and all of Chr3R. (B) The MIC50 increases with the copy number of the complex CNV. Heat map of isolate growth (OD600 at 48 hr) in twofold increasing concentrations of miconazole. The MIC50 is denoted with a yellow line. Each heat map represents the average of three independent MIC50 assays (Figure 2—source data 1). (C) Schematic of the homologous chromosomes in AMS3051. The full length (gray) and dicentric CNV-containing (black) homologs with the positions indicated for CEN3 (circle), the long repeat sequences (blue and orange lines), and SacII cut sites (dashed lines). Four regions (I–IV) that support a breakage-fusion-bridge mechanism for the formation of complex CNVs (see main text for details). (D) Allele ratio plot of all heterozygous loci located within and flanking the complex CNV for AMS3050 and AMS3051. Allele ratio plots for all isolates are in Figure 3—figure supplement 2. (E) SacII-digested CHEF karyotype of the progenitor and miconazole-evolved isolates (first lane of undigested AMS3050 is shown for relative size). The SacII digest isolates the region with variable copy number and CEN3 (schematic at far right). CHEF gel stained with ethidium bromide (left panel) and analyzed by Southern blot using a DIG-labeled probe to orf19.344, located within the complex CNV (middle panel), and CEN3 (right panel). Both Southern blot probes detect a novel band that increases in size as the complex CNV increases in copy number.
Figure 3—figure supplement 1
The Chr3L CNV is flanked by two, distinct inverted repeat sequences.
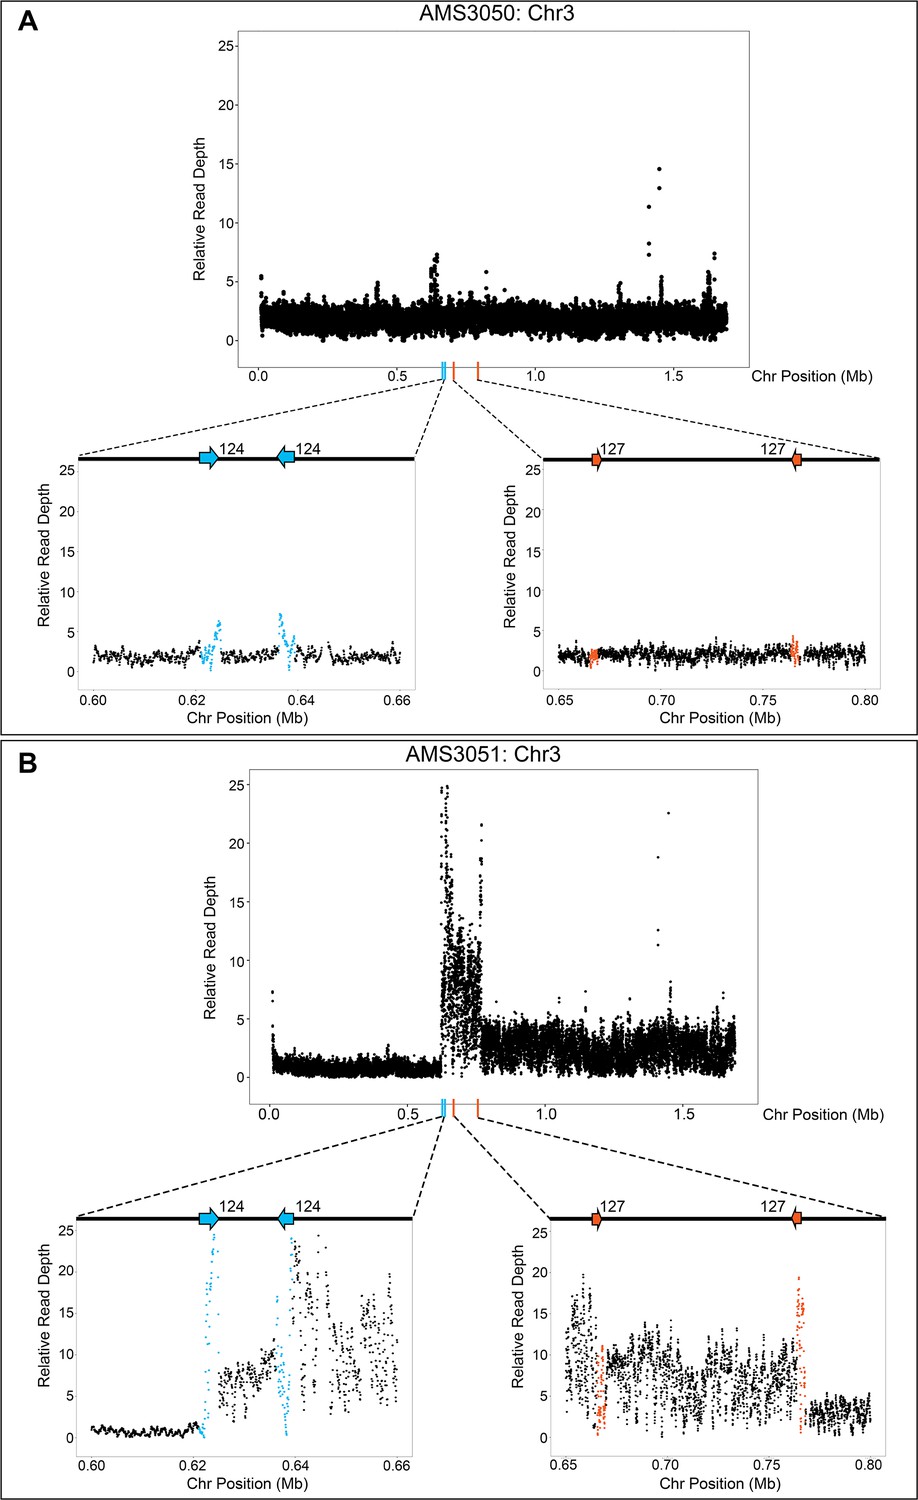
Relative genome sequence read depth plotted according to chromosome position for (A) the progenitor AMS3050 and (B) the miconazole-evolved isolate AMS3051. The complex CNV in AMS3051 is flanked by two, distinct long inverted repeat sequences: Repeat 124 (blue arrows/data points) and Repeat 127 (orange arrows/data points). The highest copy number amplification occurs between the two non-homologous inverted repeats. All features of the CNV breakpoints are detailed in Supplementary file 2; repeat numbers refer to Supplementary file 2 from Todd et al., 2019.
Figure 3—figure supplement 2
CNVs are intra-chromosomal amplifications between two distinct inverted repeat sequences.
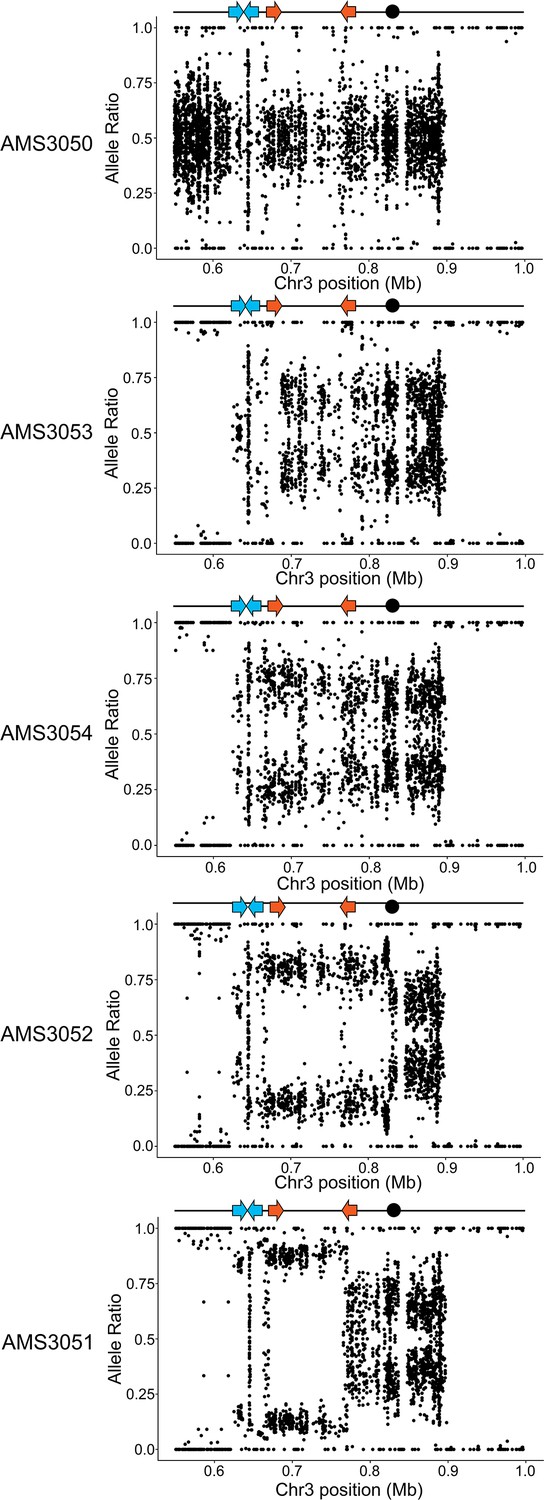
Allele ratio plot of all heterozygous loci located within and flanking the CNV breakpoints (blue and orange arrows indicate the inverted repeat sequences at the CNV breakpoints) and the CEN3 (black dot). Allele ratios shift from +0.52/- 0.48 in the progenitor AMS3050 to +0.66/- 0.34 in AMS3053, +0.77/- 0.23 in AMS3054, +0.79/- 0.21 in AMS3052, and 0.90+/- 0.10 in the 14 copy CNV region of the evolved isolate AMS3051. The specific C. albicans chromosome A/B haplotypes were reported previously (Mount et al., 2018).
Figure 4
Long-read sequencing reveals recombination products involved in the formation of complex CNVs.
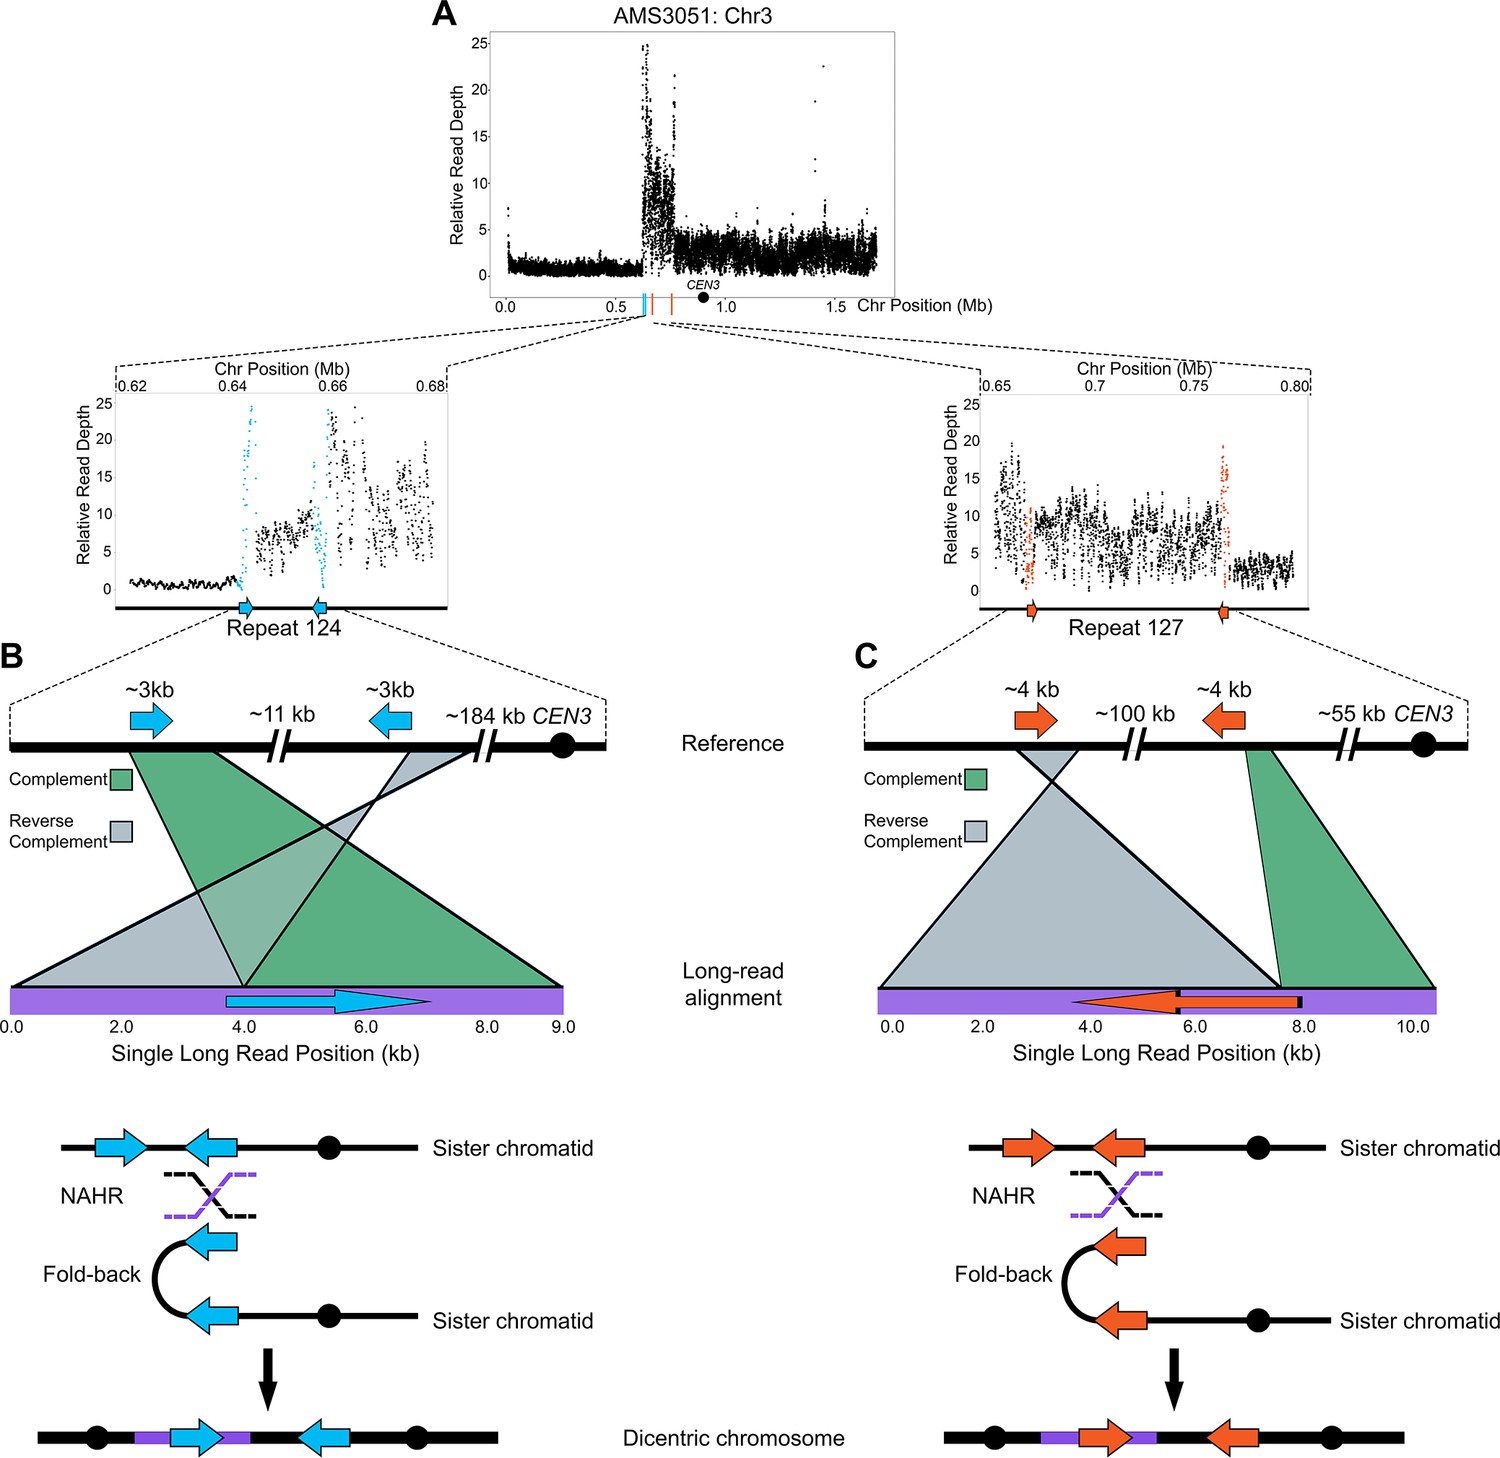
(A) Relative Illumina read depth for the miconazole-evolved isolate AMS3051 plotted by chromosome position (data as in Figure 3—figure supplement 1) indicating the presence of two inverted repeats (Repeat 124 (blue line) and Repeat 127 (orange line)) flanking a complex CNV on Chr3L. Repeat numbers refer to Supplementary file 2 from Todd et al., 2019. In the reference genome, Repeat 124 (B), consists of two inverted copies (~99% sequence identity) that are ~3 kb in length that are ~11 kb apart and Repeat 127 (C) consists of two inverted copies (~99% sequence identity) that are ~4 kb in length and located ~100 kb apart. Analysis of long-read sequences from AMS3051 identified structural variants relative to the reference genome at both Repeats 124 and 127. A single representative long-read (bottom purple line) aligned to the reference genome (top black line) is shown for Repeat 124 (B) and Repeat 127 (C). The long-read contains unique sequences that are separated by up to ~100 kb in the reference genome. Green-colored areas indicate alignment to the complement strand and gray-colored areas indicate alignment to the reverse complement strand of the reference genome. The transition between complement/reverse complement occurs within the repeat sequence. Schematics of both Repeat 124 and Repeat 127 indicate the formation of a fold-back inversion and non-allelic homologous recombination (NAHR, black and purple dashed lines) between repeat copies on sister chromatids, which could generate a dicentric chromosome. Alignment of the recombination product is inferred to produce the long-read that was detected (purple bar within the dicentric chromosomes). Each structural variant was supported by ~50 long-read sequences (see Materials and methods). All features of the CNV breakpoints are detailed in Supplementary file 2.
Figure 5 with 3 supplements
Complex CNVs resolve in the absence of antifungal drug by eliminating the dicentric chromosome.
(A) Representative images of the progenitor (AMS3050) and the four miconazole-evolved isolates (AMS3053, AMS3054, AMS3052, and AMS3051) containing the Chr3L CNV grown on YPAD. Copy number of Chr3 (from Figure 3) shown to the right of the plate images. The notch in Chr3 is CEN3. Representative images below AMS3051 of single colonies derived from either a small (blue) or large (black) colony of AMS3051 on rich medium: The small colony gave rise to AMS3094 and AMS3093 and the large colony gave rise to AMS3092. Copy number of Chr3 shown below the plate images. Whole genome sequencing data are provided in Figure 5—figure supplement 1. (B) Colony size analysis using ImageJ (see Materials and methods), n > 113 (up to n = 300) single colonies, three biological replicates. (C) Heat map of OD600 values taken at 48 hr in twofold increasing concentrations of miconazole. The MIC50 is denoted with a yellow line. Each heat map represents the average of three independent MIC50 assays (Figure 2—source data 1). (D) CHEF of the parental strain and miconazole-evolved isolates. Whole genomic DNA was digested with SacII to isolate the region containing the CNV and CEN3 (schematic to right). CHEF gel stained with ethidium bromide (left panel) and analyzed by Southern blot with DIG-labeled probes to orf19.344 within the CNV (middle panel) and CEN3 (right panel).
Figure 5—figure supplement 1

Loss of Chr3 CNV correlates with reduction of MIC50 to miconazole.
Whole genome sequence data of miconazole-evolved isolates plotted as log2 ratio and converted to chromosome copy number (y-axis) and chromosome position (x-axis) using the Yeast Mapping Analysis Pipeline (YMAP). (A) The progenitor strain (AMS3050) and the four evolved isolates (AMS3053, AMS3054, AMS3052, and AMS3051) with the Chr3 CNV and Chr7 trisomy. MIC50 at 48 hr to miconazole shown to the right. (B) The three single colonies (AMS3094, AMS3092, and AMS3093) derived from AMS3051. MIC50 shown to the right.
Figure 5—figure supplement 2

Additional loss of heterozygosity can occur during resolution of complex CNVs.
Allele ratio plots of all heterozygous loci on Chr3 for (A) the CNV-containing progenitor isolate AMS3051, and three single colonies isolated from AMS3051 in the absence of antifungal drug (B–D). Location of the long inverted repeats (blue and orange arrows) and CEN3 (black dot) are shown above each plot. The progenitor to AMS3051 is homozygous on Chr3R from position 896,538 to the Chr3R telomere. (B) AMS3094 maintains the entire Chr3 CNV structure and allele frequency ratios similar to AMS3051. (C) AMS3092, which kept the complex stair-step CNV on Chr3L but became disomic for both Chr3R and the telomere proximal region of Chr3L, returned to a ~50% allele frequency ratio between the CNV and CEN3 while remaining homozygous for the telomere proximal disomic region of Chr3L. (D) Recombination near CEN3 resulted in LOH and loss of the CNV. The euploid strain AMS3093 became homozygous for the entire left arm of Chr3 while remaining heterozygous to the right of CEN3.
Figure 5—figure supplement 3
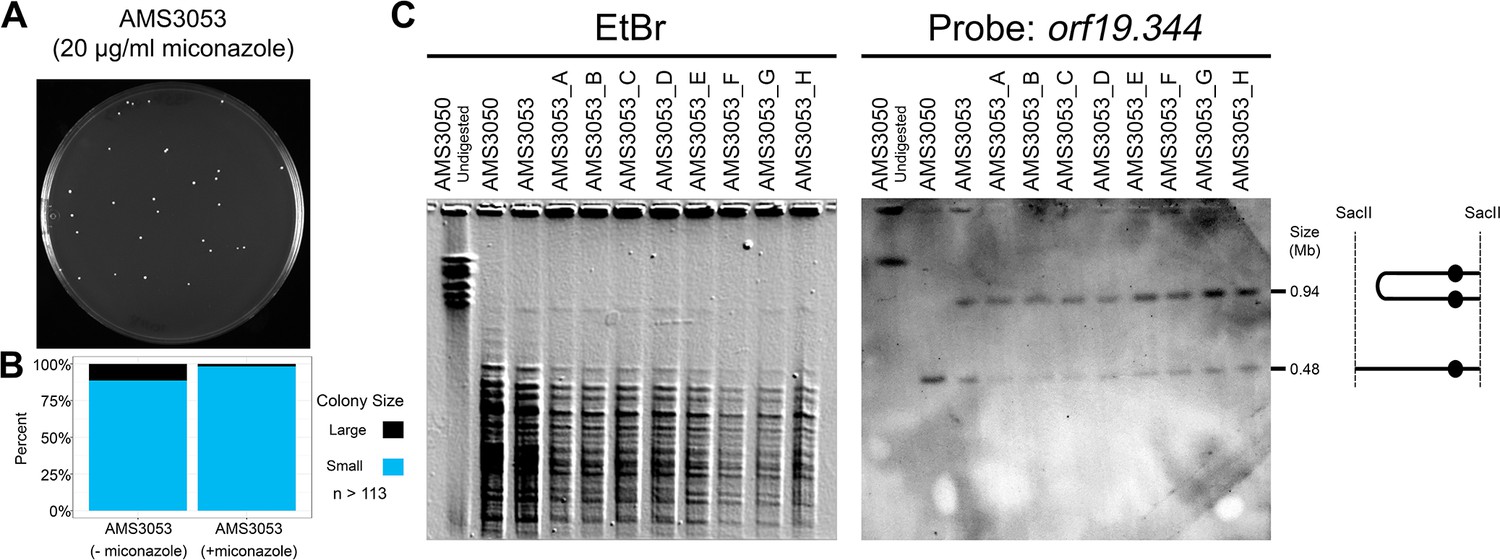
Dicentric Chr3 is stable in the presence of antifungal drug.
(A) Representative image of AMS3053 single colonies on a plate containing 20 μg/ml miconazole for 72 hr. (B) Colony size heterogeneity of AMS3053 in the absence and presence of 20 μg/ml miconazole. Colony size determined using ImageJ, n = 113–115 single colonies obtained from three individual agar plates (see Materials and methods). (C) CHEF of the progenitor (AMS3050), the initial miconazole-evolved isolate with a dicentric Chr3 (AMS3053), and eight randomly selected single colonies (AMS3053_A-H) derived from AMS3053 after 72 hr on 20 μg/ml miconazole (plate pictured in A). Karyotype analysis performed as in Figure 5D: whole genomic DNA was digested with SacII to isolate the region containing the dicentric Chr3 band (schematic to right). CHEF gel stained with ethidium bromide (left panel) and analyzed by Southern blot with DIG-labeled probes to orf19.344 within the CNV (right panel).
Figure 6 with 1 supplement
Breakage-fusion-bridge model for the formation and resolution of complex CNVs.
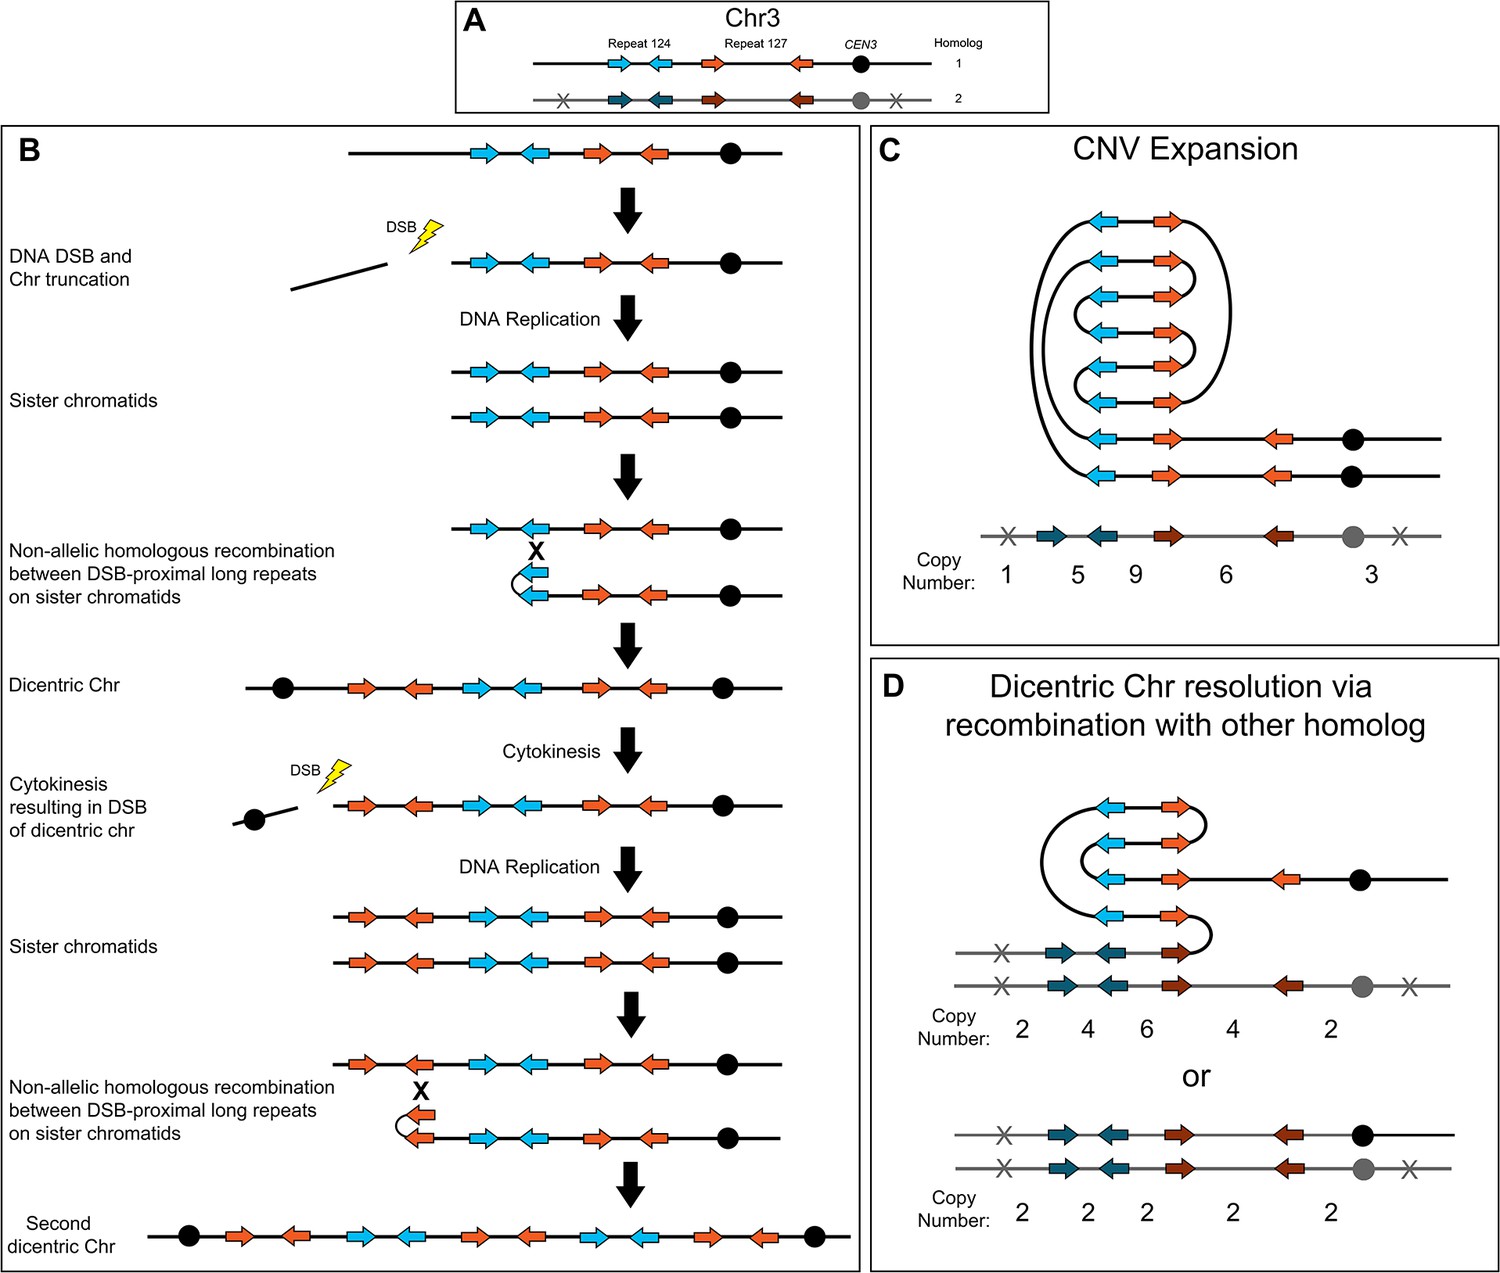
DNA double-strand breaks (DSBs), recombination, and dicentric chromosome formation can drive complex CNV formation through successive breakage-fusion-bridge (BFB) cycles. (A) Two distinct long-repeat sequences, Repeat 124 (blue/dark blue arrows) and Repeat 127 (orange/dark orange arrows), are located on both Chr3 homologs (black and gray). Heterozygous SNVs indicated with an X on Chr3 homolog 2. (B) A DSB occurs telomere proximal to the left copy of Repeat 124 on homolog 1 of Chr3, resulting in the formation of a telomere-proximal acentric DNA fragment. DNA replication generates two sister chromatids with a truncated arm. Non-allelic homologous recombination (NAHR) between Repeat 124 on sister chromatids generates a dicentric chromosome. During cytokinesis, the dicentric chromosome undergoes bridge formation and breaks near the centromere due to the closure of the actomyosin ring, generating two asymmetric chromosome fragments, each with only one centromere. The longer, monocentric chromosome fragment is followed in this model. During the next cell cycle, DNA replication generates two sister chromatids that undergo NAHR between a distinct long inverted repeat (Repeat 127, orange arrows) on sister chromatids that generates a second dicentric chromosome. Subsequent BFB cycles can result in different outcomes depending on the environmental selection: (C) Complex CNV expansion in which successive rounds of the BFB cycle generate CNVs with higher copy numbers, or (D) NAHR with a repeat on the other homolog results in the resolution of the dicentric chromosome and isolates the CNV on a monocentric chromosome (top, e.g. AMS3092). Alternatively, break induced replication (BIR) could prime near CEN3 and continue to the Chr3L telomere, resulting in the loss of the complex CNV and homozygosis of Chr3L (bottom, e.g. AMS3093). Example stair-step copy numbers of genomic segments indicated below each schematic.
Figure 6—figure supplement 1
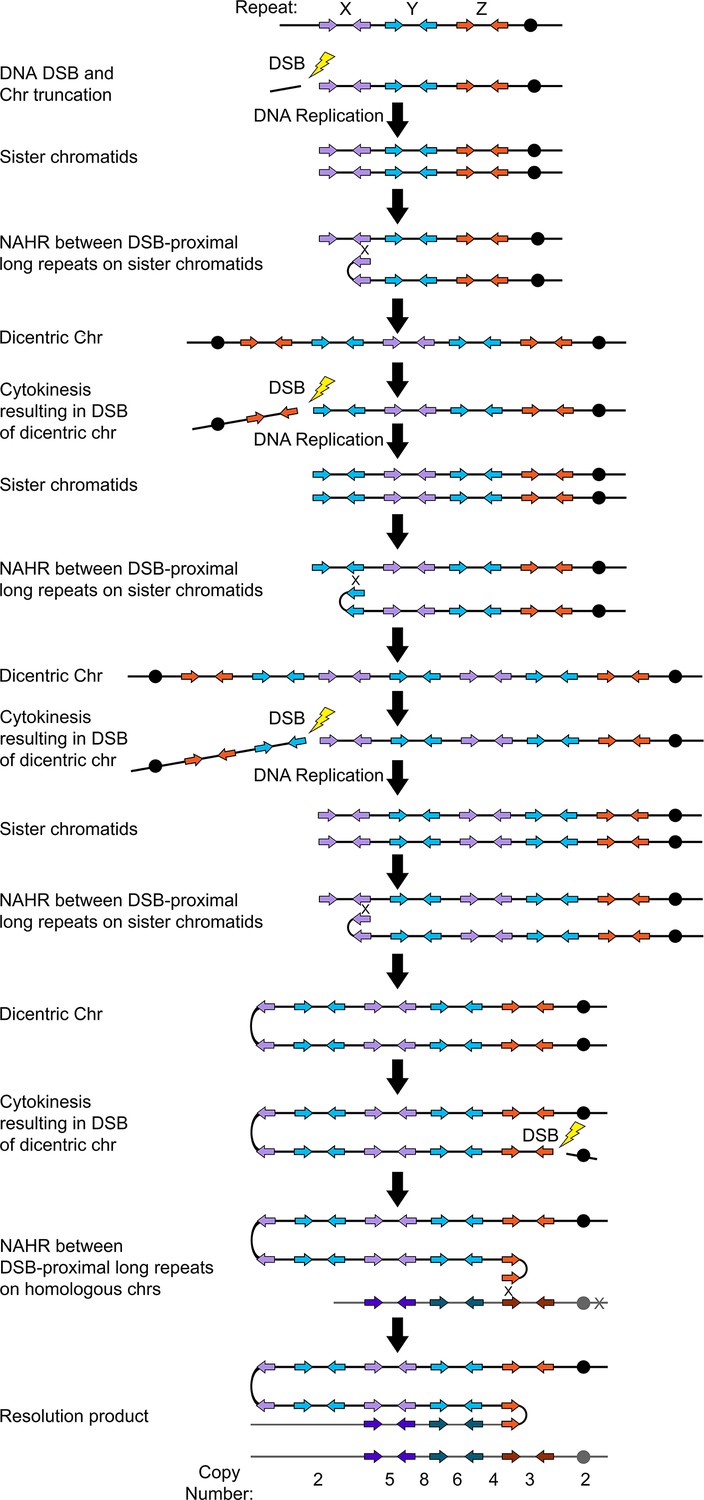
Breakage-fusion-bridge model for the formation of asymmetric complex CNVs.
CNVs with asymmetric stair-steps were associated with three distinct long inverted repeat sequences (e.g. Repeats X, Y, and Z) located on the same chromosome arm. A DNA double-strand break (DSB) occurs telomere proximal to the left copy of Repeat X (purple arrows) resulting in the formation of a telomere-proximal acentric DNA fragment. DNA replication generates two sister chromatids with a truncated arm. Non-allelic homologous recombination (NAHR) between Repeat X on sister chromatids generates a dicentric chromosome. During cytokinesis, the dicentric chromosome undergoes bridge formation and breaks between copies of Repeats Y and Z (blue and orange arrows), generating two asymmetric chromosome fragments, each with only one centromere. The longer, monocentric chromosome fragment is followed in this model. During the next cell cycle, DNA replication generates two sister chromatids that undergo NAHR between a distinct long inverted repeat (Repeat Y, blue arrows) on sister chromatids that generates a second dicentric chromosome. Again, following bridge formation, a DSB occurs between copies of Repeats X and Y (purple and blue arrows). DNA replication generates two sister chromatids that undergo NAHR between copies of Repeat X (purple arrows) on sister chromatids generating another dicentric chromosome. After a final DSB, NAHR with Repeat Z (dark orange) on the other homolog (gray) results in the resolution of the dicentric chromosome and isolates the CNV on a monocentric chromosome. Example asymmetric stair-step copy numbers of genomic segments indicated below model.
Tables
Key resources table
| Reagent type (species) or resource | Designation | Source or reference | Identifiers | Additional information |
|---|---|---|---|---|
| Strain, strain background (Candida albicans) | SC5314 | Hirakawa et al., 2015 (doi:10.1101/gr.174623.114) | RRID:SCR_013437 | |
| Strain, strain background (C. albicans) | P75016 | Hirakawa et al., 2015 (doi:10.1101/gr.174623.114) | ||
| Strain, strain background (C. albicans) | P75063 | Hirakawa et al., 2015 (doi:10.1101/gr.174623.114) | ||
| Strain, strain background (C. albicans) | P78042 | Hirakawa et al., 2015 (doi:10.1101/gr.174623.114) | ||
| Antibody | Anti-Digoxigenin-AP Fab Fragments (Polycolonal from sheep) | Roche | 11093274910 RRID:AB_2734716 | (1:5000) |
| Sequence-based reagent | PCR Primers | This study | Supplementary file 5 | |
| Commercial assay or kit | Illumina Nextera XT Library Kit | Illumina | 105032350 | |
| Commercial assay or kit | Illumina Nextera XT Index Kit | Illumina | 105055294 | |
| Commercial assay or kit | Illumina Nextera Flex DNA Kit | Illumina | 20018704 | |
| Commercial assay or kit | Illumina Nextera DNA CN Index kit | Illumina | 20018707 | |
| Commercial assay or kit | Blue Pippin 1.5% agarose gel dye-free cassette | Sage Science | 250 bp - 1.5 kb DNA size range collections, Marker R2 | Target of 900 bp |
| Commercial assay or kit | Illumina MiSeq v2 Reagent Kit | Illumina | 15033625 | 2 × 250 bp |
| Commercial assay or kit | 1D Ligation Sequencing Kit | Oxford Nanopore Technologies | SQK-LSK108 | |
| Commercial assay or kit | R9 FLO-Min106 spot-on flow cell | Oxford Nanopore Technologies | R9.4.1 | |
| Commercial assay or kit | Ultra II End Repair/dA-Tailing Module | New England Biolabs | E7546S | |
Commercial assay or kit | Qubit dsDNA HS kit | Life Technologies | Q32854 | |
| Commercial assay or kit | PCR DIG Probe Synthesis Kit | Roche | 11636090910 | |
| Commercial assay or kit | Agilent 2100 Bioanalyzer High Sensitivity DNA Reagents | Agilent Technologies | 5067–4626 | |
| Commercial assay or kit | SacII restriction enzyme | New England Biolabs | R0157S | |
| Chemical compound, drug | Fluconazole (FLC) | Alfa Aesar | J62015 | |
| Chemical compound, drug | Miconazole | Alfa Aesar | AAJ6087206 | |
| Chemical compound, drug | Itraconazole | Alfa Aesar | AAJ6639003 | |
| Chemical compound, drug | Posaconazole | MilliporeSigma | 11-101-3331 | |
| Chemical compound, drug | Ketoconazole | Fisher Scientific | AC455470010 | |
| Chemical compound, drug | PMSF | Milipore Sigma | 10837091001 | |
| Software, algorithm | Trimmomatic | Bolger et al., 2014 (doi:10.1093/bioinformatics/btu170) | v0.33 RRID:SCR_011848 | |
| Software, algorithm | BWA | Li, 2013 (doi:10.1093/bioinformatics/btp324) | v0.7.12 RRID:SCR_010910 | |
| Software, algorithm | Samtools | Li et al., 2009 (doi:10.1093/bioinformatics/btp352) | v0.1.19 RRID:SCR_002105 | |
| Software, algorithm | Genome Analysis Toolkit | McKenna et al., 2010 (doi: 10.1101/gr.107524.110) | v3.4–46 RRID:SCR_001876 | |
| Software, algorithm | Yeast Analysis Mapping Pipeline | Abbey et al., 2014 (doi: 10.1186/s13073-014-0100-8) | V1.0 | |
| Software, algorithm | JMP Pro | https://www.jmp.com | V14.2.0 | |
| Software, algorithm | ImageJ | https://imagej.nih.gov/ij/? | v2.0.0-rc-30/1.49 s RRID:SCR_003070 | |
| Software, algorithm | Integrative Genomics Viewer | Thorvaldsdóttir et al., 2013 (doi:10.1093/bib/bbs017) | v2.3.92 RRID:SCR_011793 | |
| Software, algorithm | R | https://www.r-project.org | v3.5.2 RRID:SCR_001905 | |
| Software, algorithm | Candida Genome Database | http://Candidagenome.org | RRID:SCR_002036 | |
| Software, algorithm | NGMLR | Sedlazeck et al., 2018 (doi: 10.1038/s41592-018-0001-7) | V0.2.7 | |
| Software, algorithm | Sniffles | Sedlazeck et al., 2018 (doi: 10.1038/s41592-018-0001-7) | v1.0.11 | |
| Software, algorithm | SplitThreader | Nattestad et al., 2016 (doi: 10.1101/087981) http://splitthreader.com | ||
| Software, algorithm | Ribbon | http://genomeribbon.com |
Additional files
-
Supplementary file 1
Strains used in this study.
- https://cdn.elifesciences.org/articles/58349/elife-58349-supp1-v1.xlsx
-
Supplementary file 2
Features of long-repeat sequences identified at copy number breakpoints of complex CNVs.
- https://cdn.elifesciences.org/articles/58349/elife-58349-supp2-v1.xlsx
-
Supplementary file 3
Growth curve raw data and analysis.
- https://cdn.elifesciences.org/articles/58349/elife-58349-supp3-v1.xlsx
-
Supplementary file 4
Coding sequences within complex CNVs.
- https://cdn.elifesciences.org/articles/58349/elife-58349-supp4-v1.xlsx
-
Supplementary file 5
Primers used in this study.
- https://cdn.elifesciences.org/articles/58349/elife-58349-supp5-v1.xlsx
-
Supplementary file 6
Summary of complex CNV features.
- https://cdn.elifesciences.org/articles/58349/elife-58349-supp6-v1.xlsx
-
Transparent reporting form
- https://cdn.elifesciences.org/articles/58349/elife-58349-transrepform-v1.pdf
Download links
A two-part list of links to download the article, or parts of the article, in various formats.
Downloads (link to download the article as PDF)
Open citations (links to open the citations from this article in various online reference manager services)
Cite this article (links to download the citations from this article in formats compatible with various reference manager tools)
Expandable and reversible copy number amplification drives rapid adaptation to antifungal drugs
eLife 9:e58349.
https://doi.org/10.7554/eLife.58349


