SOX11 promotes epithelial/mesenchymal hybrid state and alters tropism of invasive breast cancer cells
- The Breast Cancer Now Toby Robins Research Centre, The Institute of Cancer Research, United Kingdom
- Translational Immunotherapy Team, Division of Radiotherapy and Imaging, The Institute of Cancer Research, United Kingdom
- CIC bioGUNE, Basque Research and Technology Alliance (BRTA), Spain
Figures
Figure 1 with 5 supplements
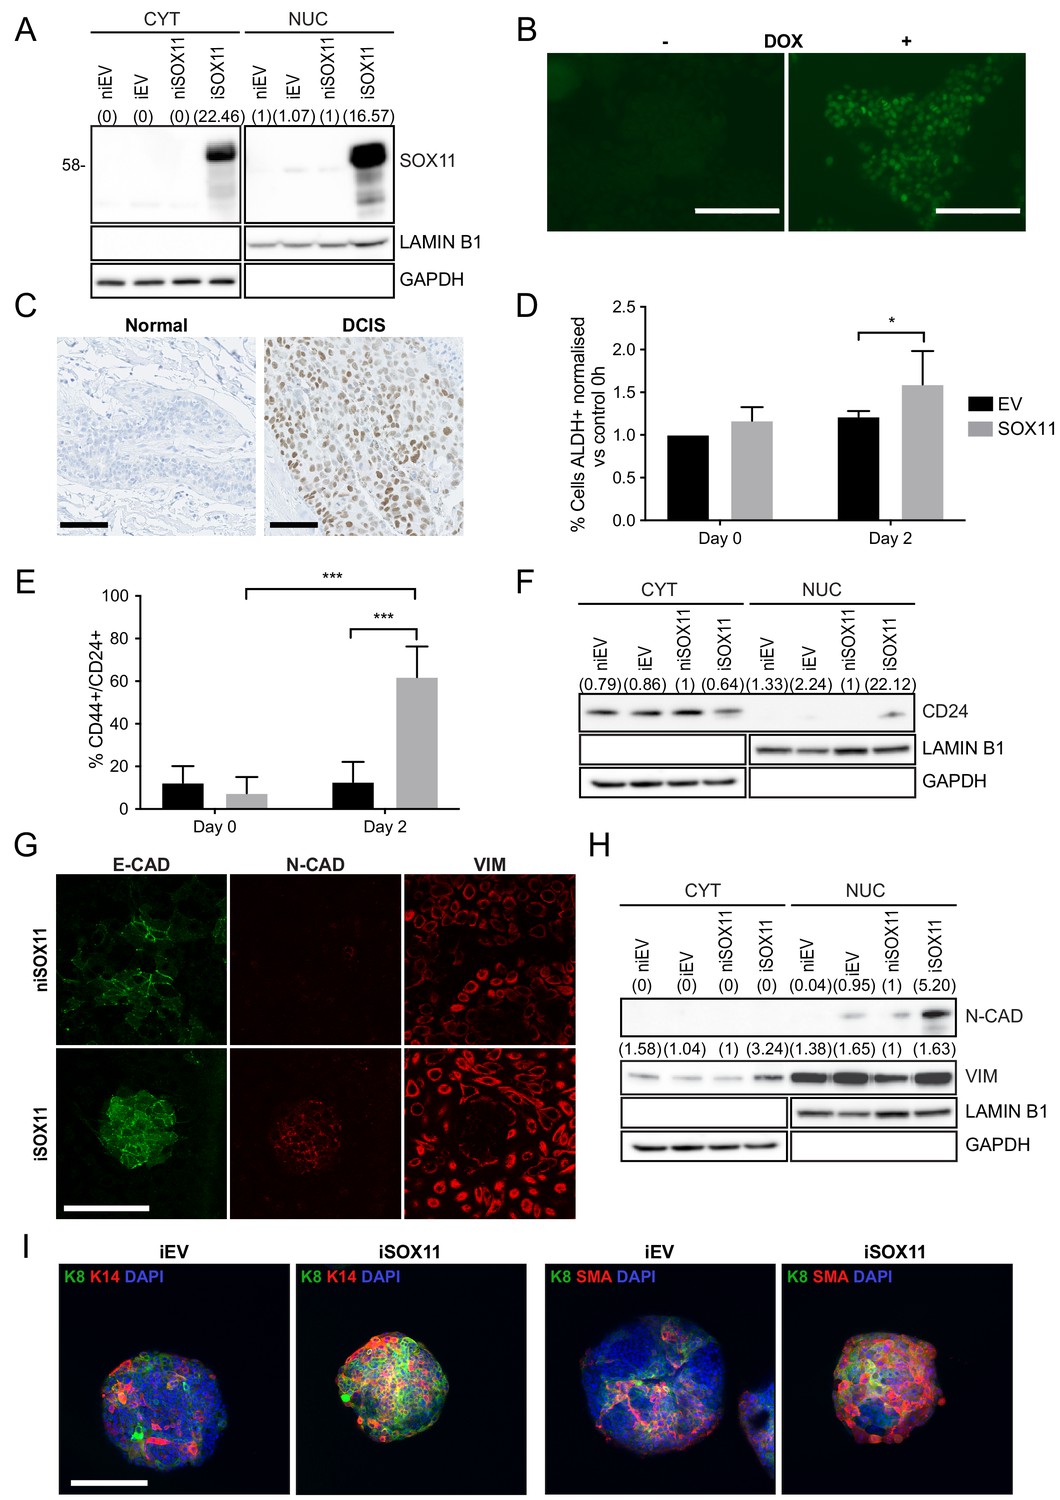
Inducible expression of SOX11 leads to changes in cell state profiles of DCIS.com cells.
(A) Western blot of SOX11 in cytoplasmic and nuclear fractions of DCIS.com cells containing the pInducer21 empty vector in presence (iEV) or absence (niEV) of 1 μM Doxycycline (DOX) or the pInducer21SOX11 with (iSOX11) or without DOX (niSOX11). GAPDH and LAMIN B1 were used as loading control of cytoplasmic and nuclear fractions, respectively. Densitometry results normalised against niSOX11 are shown in brackets. (B) SOX11 expression detected in iSOX11 cells stained by IF after 48 hr of DOX induction. Scale Bar: 200 μm. (C) ER- DCIS case sample showing SOX11 staining in DCIS and adjacent normal breast tissue. Scale Bar: 200 μm. (D) Results from flow cytometry analysis of Aldefluor assays of niEV and niSOX11 cells (day 0) and iEV and iSOX11 after 2 days treatment with 1 μM DOX. Results show the % of ALDH+ cells normalised against niEV. Error bars represent SD. *p = 0.0223. n = 5. (E) Results from flow cytometry analysis of CD24 and CD44 of niEV and niSOX11 cells (day 0) and iEV and iSOX11 after treatment with 1 μM DOX for 2 days. Results show the average % of cells CD44+/CD24+ in each condition. Error bars represent SD. ***p = 0.0005 (iSOX11 vs niSOX11) and p = 0.0009 (iSOX11 vs iEV) n = 3. (F) Western blot of CD24 in cytoplasmic and nuclear fractions of niEV, niSOX11, iEV and iSOX11 cells. GAPDH and LAMIN B1 were used as loading control of cytoplasmic and nuclear fractions, respectively. In brackets densitometry results normalised against niSOX11. (G) Confocal images of IF staining of E-CADHERIN, N-CADHERIN, VIMENTIN in niSOX11 and iSOX11 cells. Cells were grown in slides covered with Collagen I. Scale Bar: 200 μm. (H) Western blot of N-CADHERIN and VIMENTIN in cytoplasmic and nuclear fractions of niEV, niSOX11, iEV and iSOX11 cells. GAPDH and LAMIN B1 were used as loading control of cytoplasmic and nuclear fractions, respectively. Densitometry results normalised against niSOX11 are shown in brackets. (I) Confocal IF images of iEV and iSOX11 spheroids treated with 1 μM DOX, stained with luminal marker, K8, and basal markers K14 or SMA, and DAPI. Scale bar: 200 μm. DOX: doxycycline, IF: Immunofluorescence.
Figure 1—figure supplement 1

Inducible expression of SOX11 in DCIS.com cells leads to changes in CD24 profiles.
(A) Western blot to detect SOX11 in nuclear proteins of DCIS.com cells transduced with pLenti6.3 LacZ or SOX11. (B) Western blot to detect SOX11 in total cell lysates to determine the concentration of DOX needed to induce SOX11. (C) Western blot to detect SOX11 with total cell lysates induced with 1 μM DOX at different times. (D) Western blot to detect SOX11 with total cell lysates induced with 1 μM DOX for 24 hr and cultured in media without DOX at different times afterwards. (E) Representative flow cytometry analysis of CD44/CD24 cell populations of EV and SOX11 cells before and after 2-day treatment with DOX. Experiments were performed three times. (F) Fluorescence levels of iEV and iSOX11 after treatment with DOX stained by IF with CD24. The positively stained area for CD24 at different DOX concentrations was normalised by the area stained with DAPI. The results are shown normalised against no DOX. DOX: Doxycycline, IF: Immunofluorescence.
Figure 1—figure supplement 2
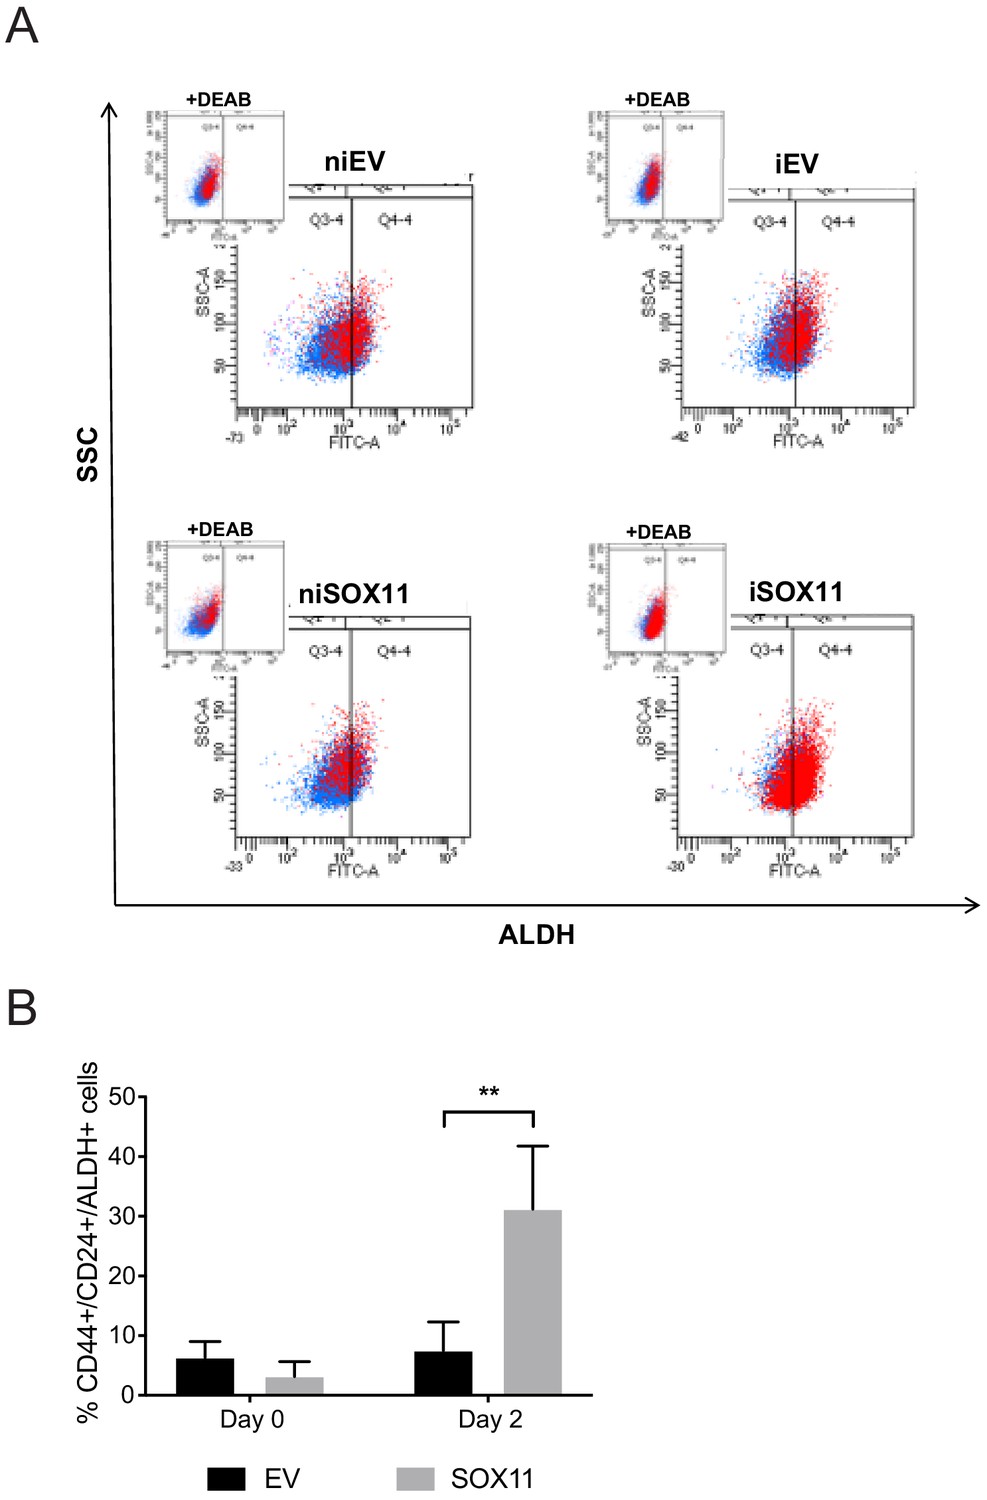
Inducible expression of SOX11 in DCIS.com cells leads to changes in ALDH activity.
(A) ALDH activity levels in EV and SOX11 cells before and after 2 days treatment with DOX were detected with the Aldefluor assay. Cells were stained and sorted with CD44 and CD24 antibodies, and ALDH activity was measured with the Aldefluor kit. Representative ALDH activities after flow cytometry analysis in CD44/CD24+ EV and SOX11 cell populations before and after 2 days treatment with DOX are shown. +DEAB plots display the negative control; cells incubated with diethylaminobenzaldehyde (DEAB), the specific inhibitor of ALDH, were used to establish the baseline fluorescence of these cells are shown in insets. Experiments were performed five times. (B) The frequency of CD44+/CD24+ALDH cells are shown in EV and SOX11 cells before and after 2 days treatment with DOX. Error bars represent SD. Experiment performed five times. **p = 0.0029. DOX: Doxycycline.
Figure 1—figure supplement 3

Inducible expression of SOX11 in DCIS.com cells leads to changes in expression of epithelial and mesenchymal markers.
(A) E-CADHERIN, N-CADHERIN, VIMENTIN IF staining of EV or SOX11 cells grown in collagen induced with and without DOX treatment. Scale bar: 200 μm. (B) Fluorescence levels of iEV and iSOX11 stained by IF with SOX11, VIM, K5 and K8. The positively stained area for each protein was normalised by the area stained with DAPI. The results are shown normalised against niEV and niSOX11. (C) VIMENTIN IF and DAPI staining of EV or SOX11 cells induced with DOX and without DOX treatment. Scale bar: 200 μm. DOX: Doxycycline, IF: Immunofluorescence.
Figure 1—figure supplement 4
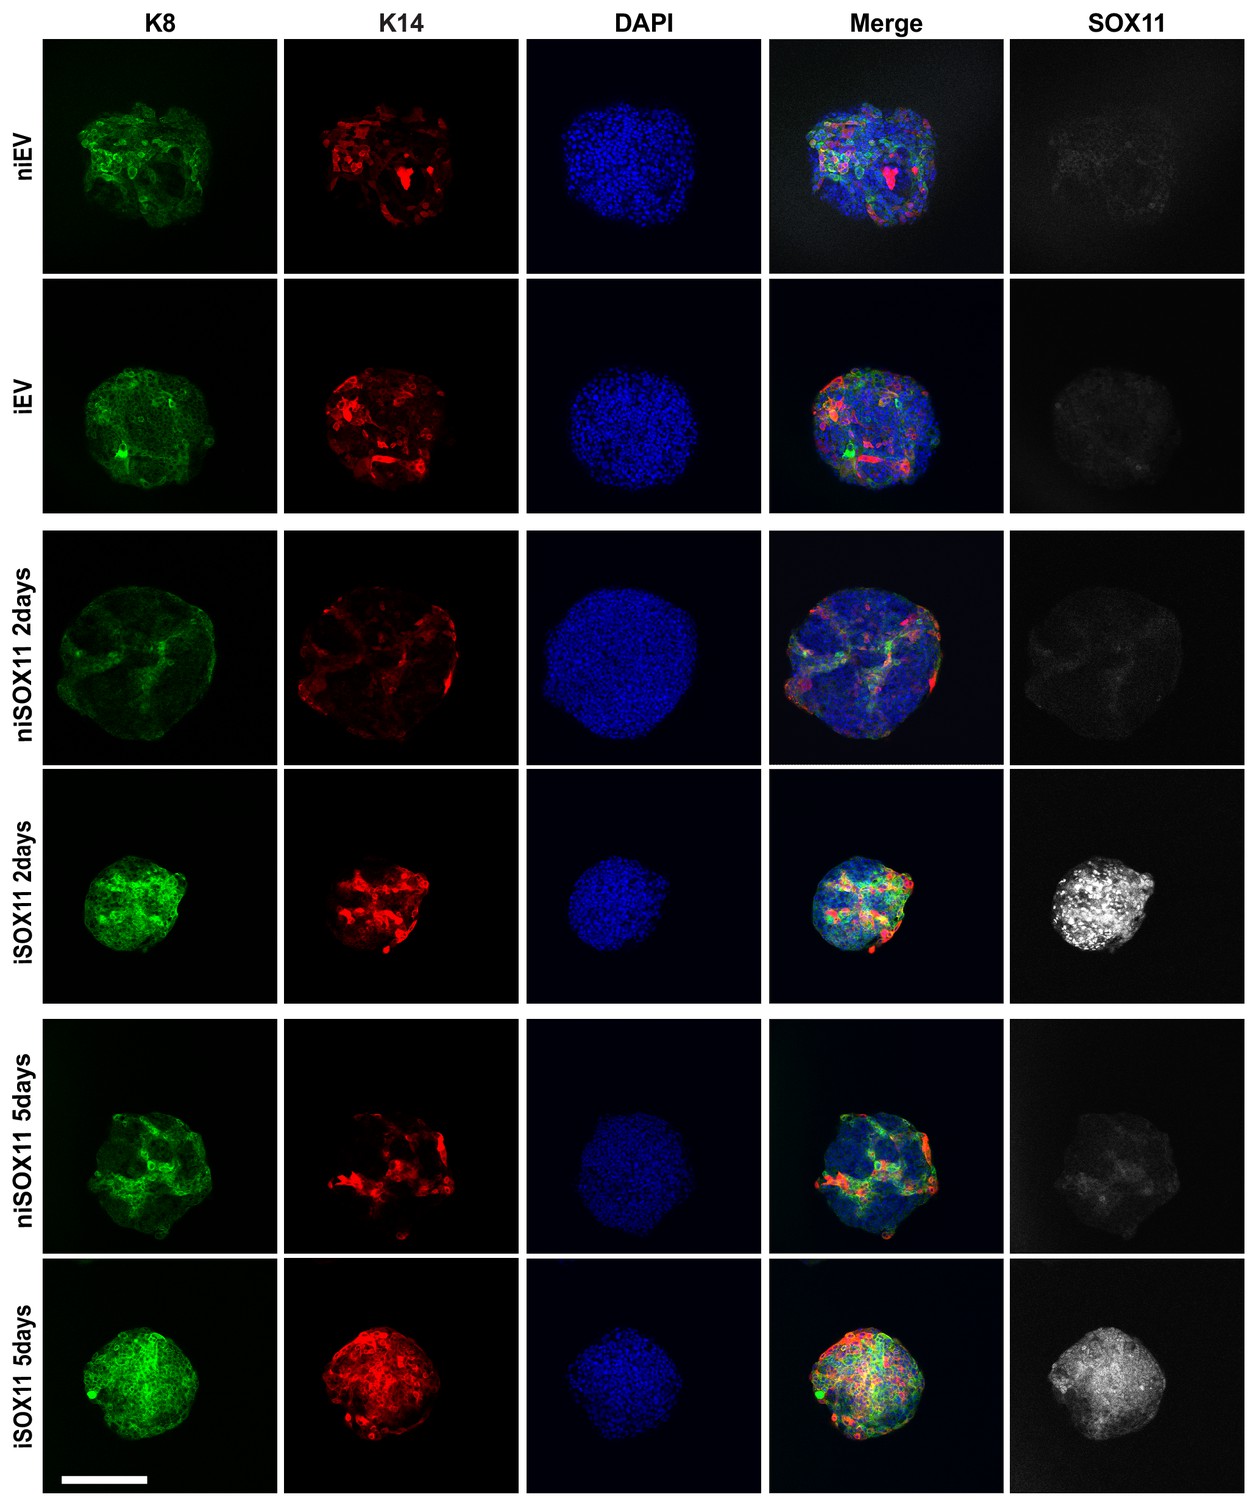
Inducible expression of SOX11 in DCIS.com spheroids leads to changes in epidermal marker expression.
Confocal images of spheres formed with niEV, niSOX11, iEV and iSOX11 cells induced for 2 or 5 days with 1 μM DOX, and stained by IF with K14, K8 and SOX11. Scale bar: 200 μm. DOX: Doxycycline, IF: Immunofluorescence.
Figure 1—figure supplement 5
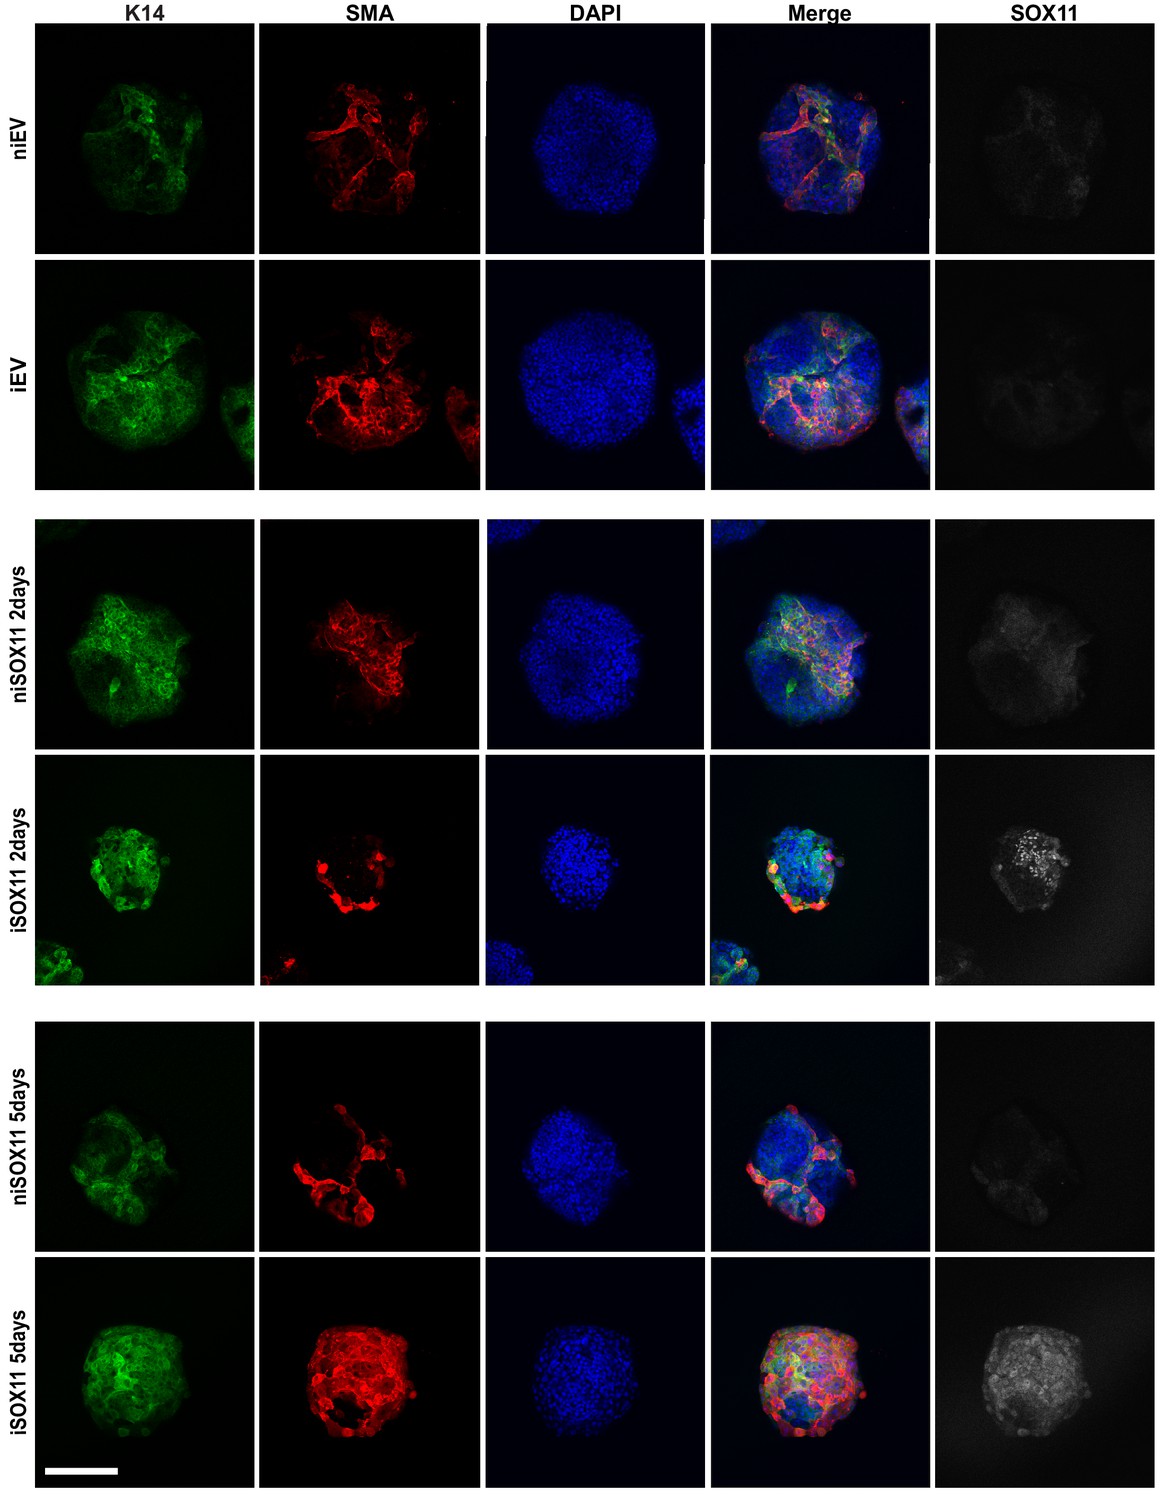
Inducible expression of SOX11 in DCIS.com spheroids leads to changes in epidermal marker expression.
Confocal images of spheres formed with niEV, niSOX11, iEV and iSOX11 cells induced for 2 or 5 days with 1 μM DOX, and stained by IF with K14, SMA and SOX11. Scale bar: 200 μm. DOX: Doxycycline, IF: Immunofluorescence.
Figure 2 with 4 supplements
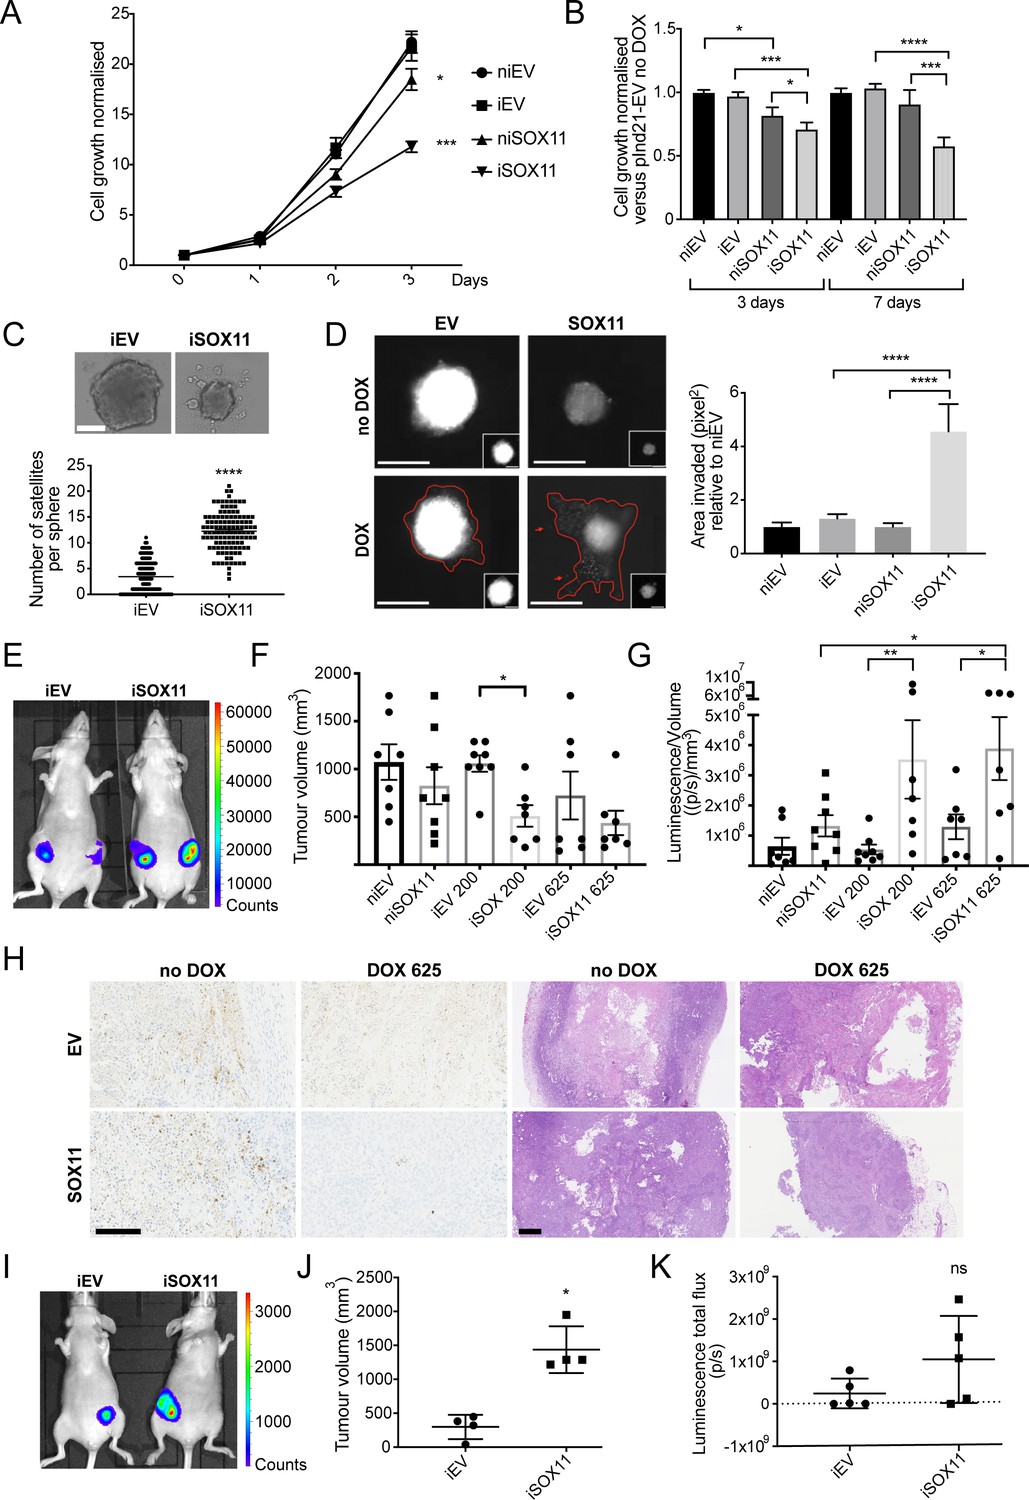
DCIS cells expressing SOX11 grow more slowly and form more invasive spheroids.
(A) Cell growth assays results for iEV or iSOX11 DCIS cells (induced with 1 μM DOX for 72 hr). Experiments were performed five times. Error bars represent SEM. *p = 0.0450 and ****p < 0.0001. (B) Cell growth assays results for spheroid formed with iEV or iSOX11 DCIS cells induced with 1 μM DOX for 3 or 7 days. Experiments were performed three times. Error bars represent SEM. p-values (3 days): *p = 0.0374 (niEV vs niSOX11), *p = 0.0221 (niSOX11 vs iSOX11) ***p = 0.0002. p- values (7 days): ***p = 0.0004 and ****p < 0.0001 (C) Examples of DCIS iEV and DCIS iSOX11 spheroids grown on low attachment plates. Graph shows the number of microsatellites per sphere. ****p < 0.0001. (D) Invasion assay after overlaying niEV, iEV, niSOX11 and iSOX11 DCIS spheroids with Collagen I. Scale bar: 200 μm. Graph shows the area invaded in pixel2 normalised against niEV. Both ****p < 0.0001. (E–G) IVIS imaging, tumour volumes and luminescence total flux/volume results after mammary fat pad xenografts. p-value in F: *p = 0.0331. p-values in G: *p = 0.0252 (niSOX11 vs iSOX11 625ppm), *p = 0.0285 (iEV 625 ppm vs iSOX11 625 ppm), **p = 0.0082. (H) Representative images of IHC staining to detect Cleaved Caspase three and H and Es of tumours resected from mice injected with iEV and iSOX11 cells. Scale bar: 500 μm. (I–K) IVIS imaging, tumour volumes and luminescence total flux after mammary intraductal injection (MIND) xenografts. *p = 0.0286 (U Mann Whitney). DOX: doxycycline, IHC: Immunohistochemistry.
Figure 2—figure supplement 1
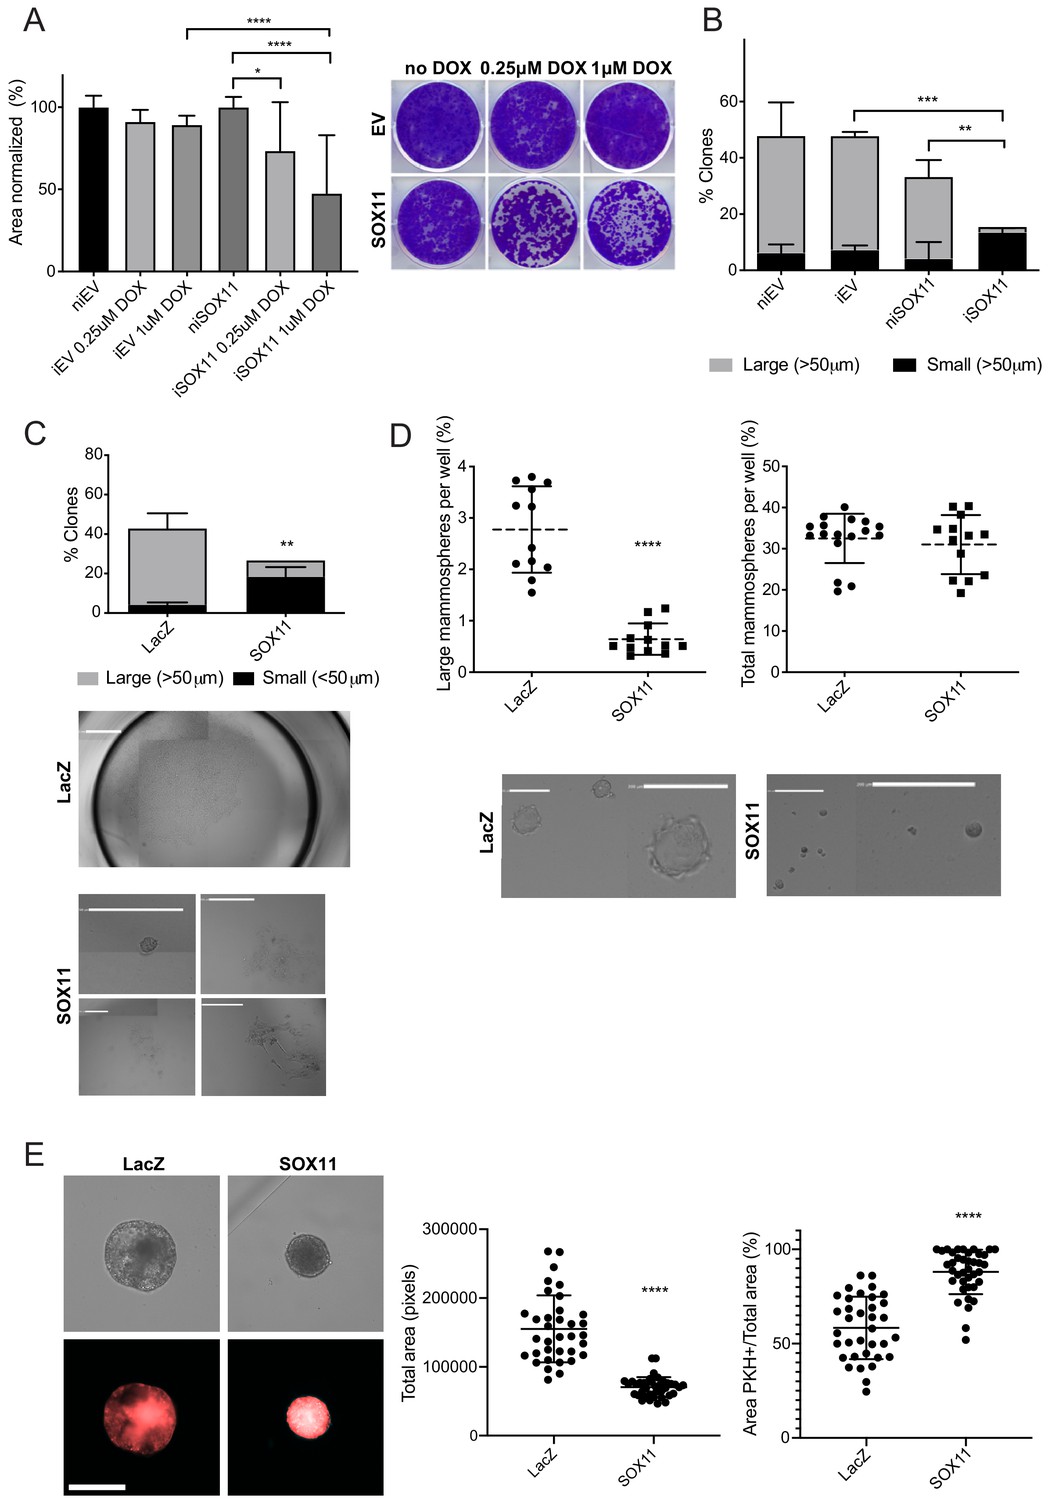
Inducible expression of SOX11 in DCIS.com cells leads to changes in stem cell activity.
(A) Representative colony-forming assay results using niEV, iEV, niSOX11 and iSOX11 cells. The area stained with crystal violet was quantified and normalised by the area of niEV or niSOX11, respectively. Representative photo is shown. Experiment was performed thrice with three replicates each. (B) Percentage of iEV and iSOX11 cells plated in two‐dimensional (2D) culture that form colonies. Cells were sorted by FACS and single cells were plated per well in a 96-well. Results are shown as the % of clones obtained divided by the cells seeded in each cell line. Experiment was performed twice with 30 cells for each cell line. (C) Percentage of DCIS-LacZ and DCIS-SOX11 cells plated in two‐dimensional (2D) culture that form colonies. Cells were sorted by FACS sorted and single cells were plated per well in a 96-well. Results are shown as the % of clones obtained divided by the cells seeded in each cell line. Experiment was performed thrice with 30 cells for each cell line. Typical morphologies observed for DCIS-LacZ and DCIS-SOX11 clones are shown. (D) Quantification of sphere-initiating capacity of DCIS-LacZ and DCIS-SOX11 cells plated in three‐dimensional (3D) culture that form spheres grown in methylcellulose and ultra-low attachment plates. Results are shown as the % of clones larger than 50 µm (upper graph) or as a percentage of total clones (down) obtained divided by the cells seeded in each cell line. Experiments were performed twice with six biological replicates each. 10,000 cells were plated per well. Typical morphologies observed for spheroid formed from DCIS-lacZ and DCIS-SOX11 cells grown in methylcellulose and ultra-low attachment plates. (E) Representative images showing PKH26 dye labelling of DCIS-lacZ and DCIS-SOX11 spheres grown in ultra-low attachment 96-well plates after 14 days. Graphs represent the size of the spheres formed (pixel2) and the percentage of the area that is PKH+ in each sphere. Experiment was replicated twice (n = 35).
Figure 2—figure supplement 2
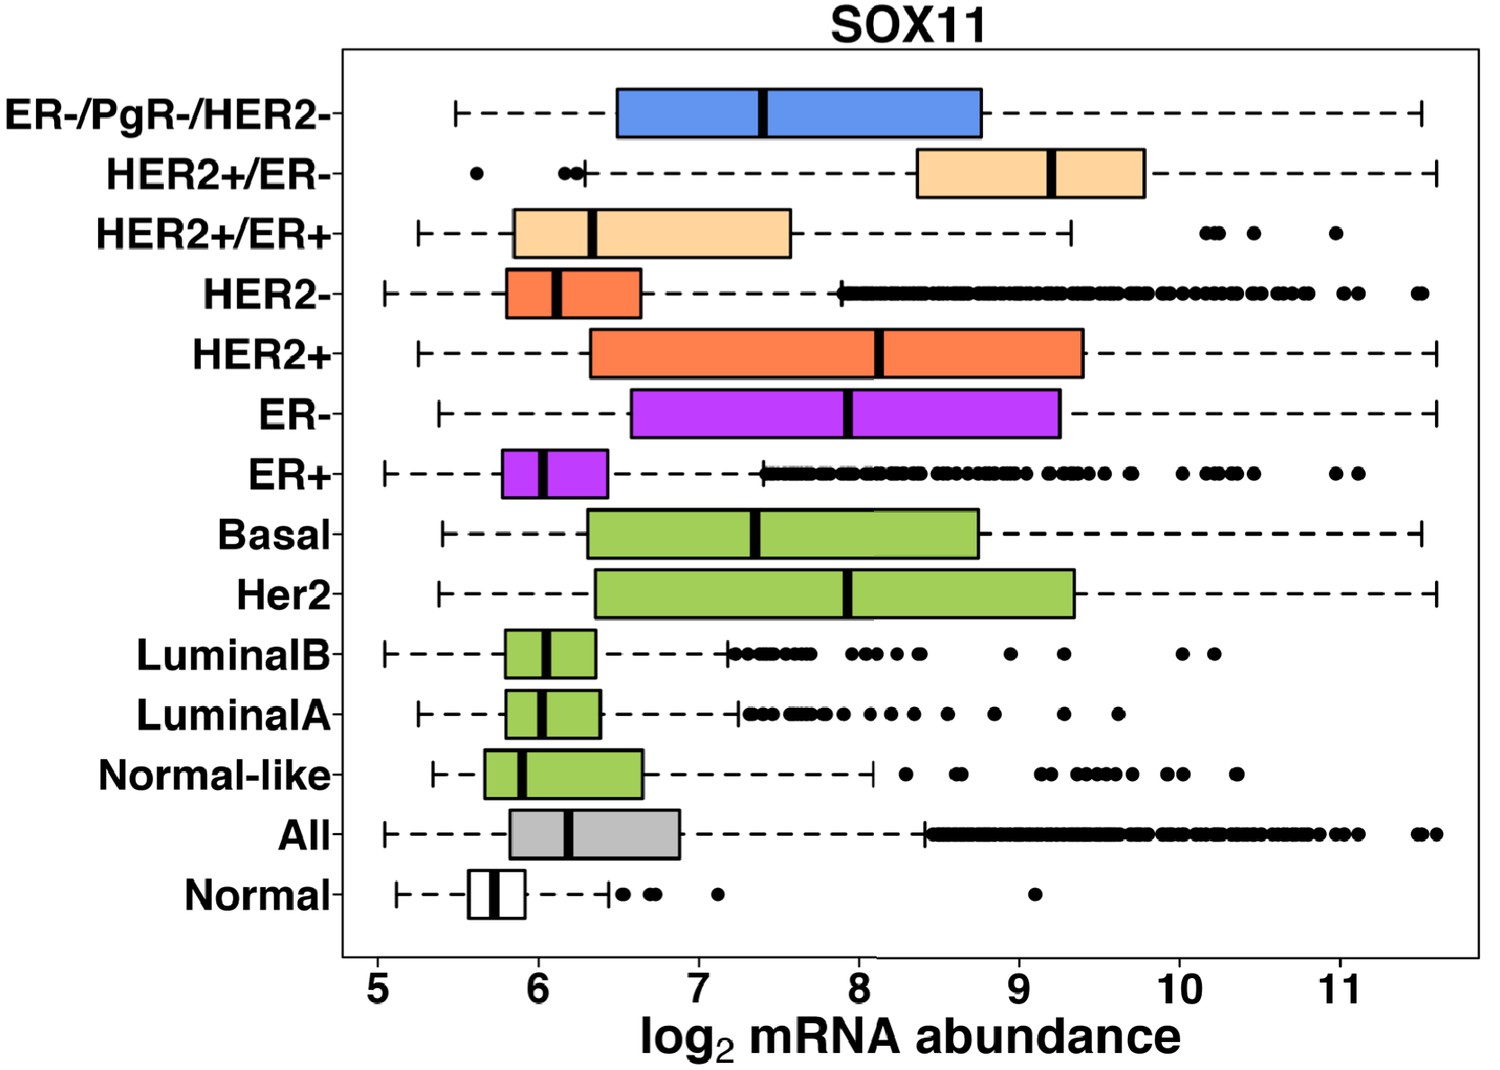
SOX11 levels in breast cancer METABRIC dataset.
Figure 2—figure supplement 3
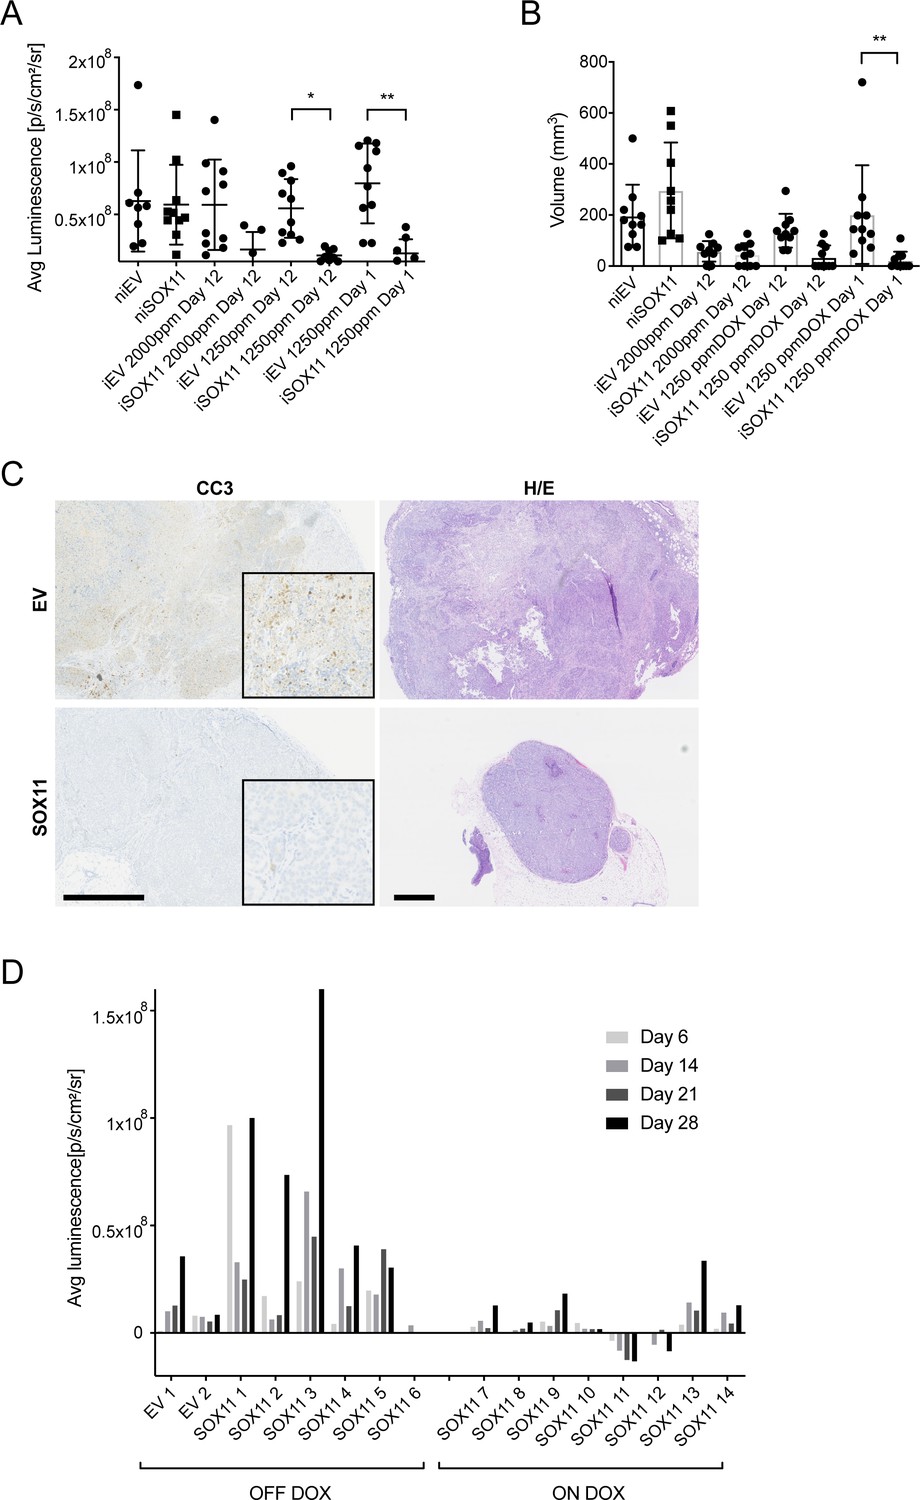
DCIS cells expressing SOX11 form smaller tumours comprised of more viable cells.
(A) Average luminescence results in IVIS images after mammary fat pad xenografts of iEV or iSOX11 in mice that were fed with high doses of DOX. (B) Tumour volumes after mammary fat pad xenografts. (C) Representative images of IHC to detect Cleaved Caspase three in tumours resected from mice injected with iEV and iSOX11 tumours. Scale bar: 500 μm. (D) Average luminescence results in IVIS images of mice xenografted with iEV and iSOX11 cells at day 6, 14, 21 and 28 after placing half on DOX or off DOX diet after an initial 42 days on DOX. DOX: Doxycycline.
Figure 2—figure supplement 4
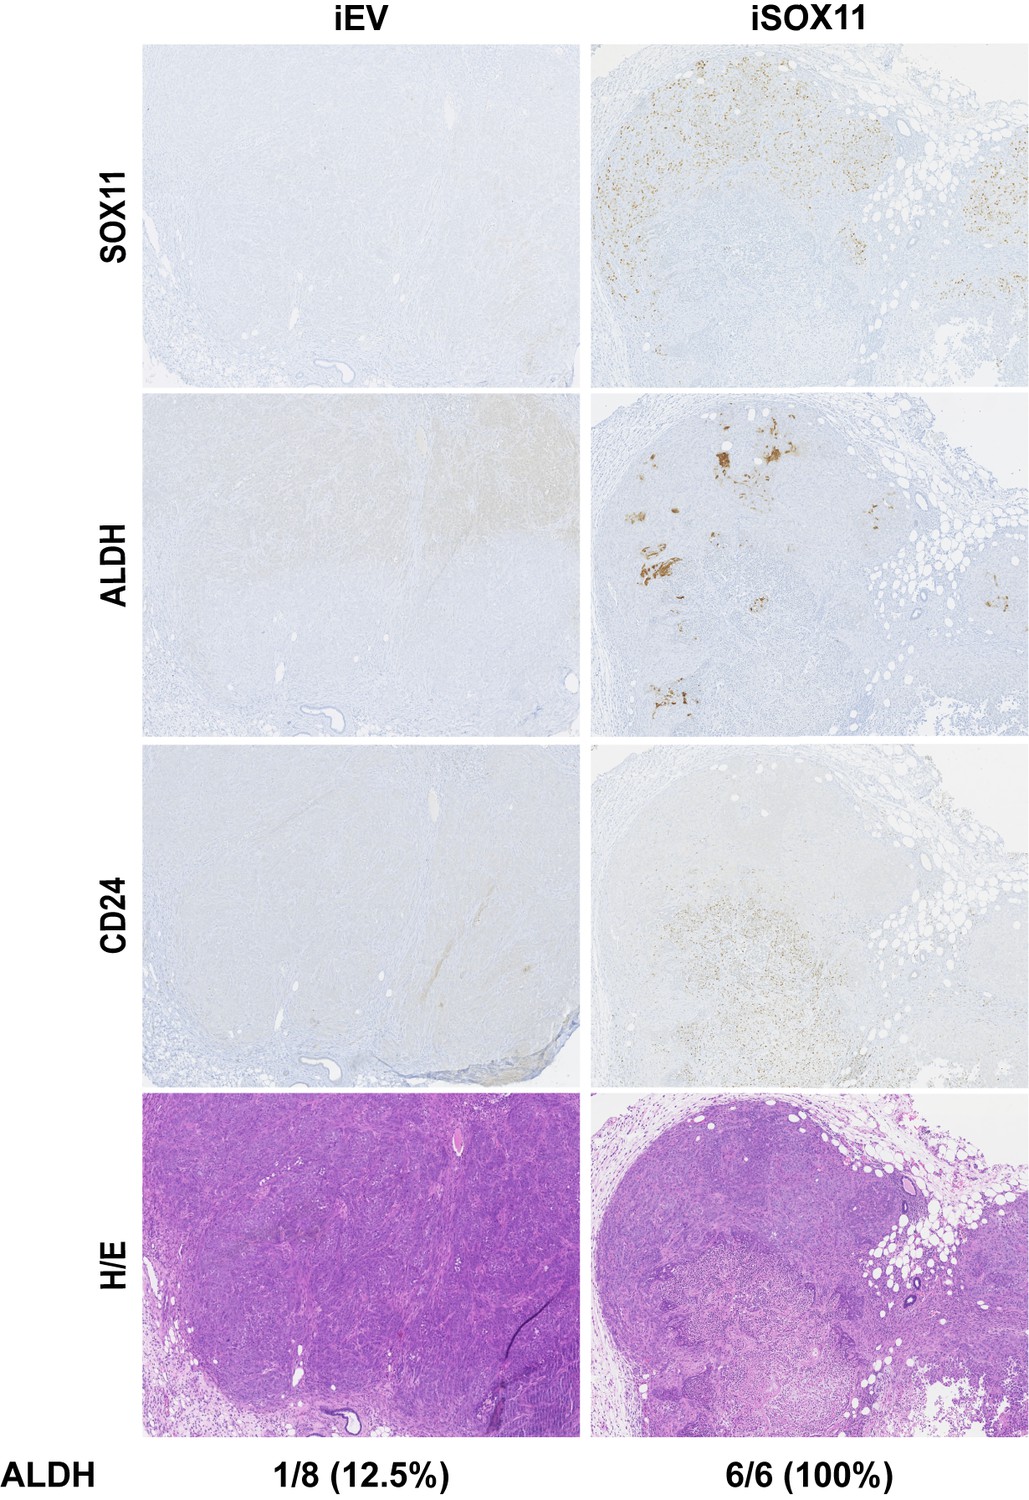
Panel shows photomicrographs of primary fat pad tumours following immunohistochemical detection of SOX11, ALDH1A1, CD24, and H and E staining.
Data shown are from mice xenografted with iEV and iSOX11 cells and fed DOX chow. DOX: Doxycycline, H and E: Haematoxylin/Eosin.
Figure 3 with 1 supplement
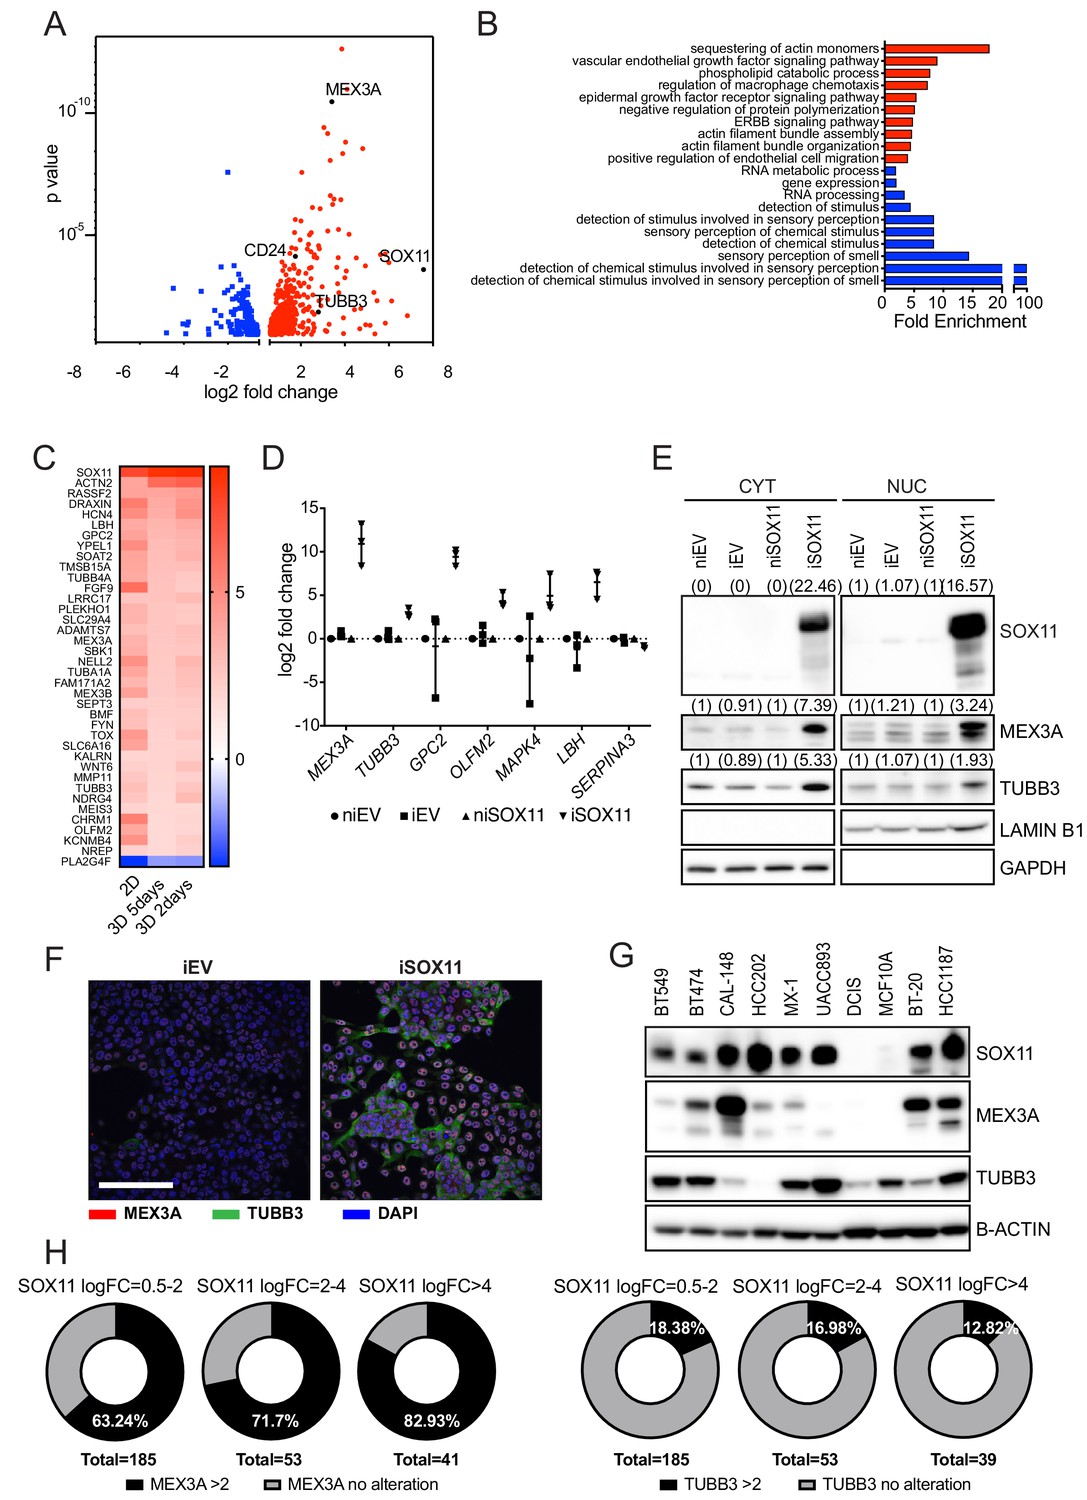
SOX11 expression promotes expression of developmental pathways frequently activated in cancer.
(A) Volcano plot representing the RNAs with a log2 fold-change > +/- 0.585 in the RNA-sequencing results of iSOX11 cells grown in 2D compared with the controls [(iSOX11-niSOX11)- (iEV-niEV)] to account for effects of DOX treatment on DCIS.com cells. (B) Gene ontology results from A. (C) List of genes overexpressed log2 fold-change >+/-1.585 times in all three RNA-sequencing (cells grown in: 2D, 3D for 2 days, 3D for 5 days) results comparing iSOX11 versus iEV. (D) qRT-PCR results for several potential SOX11 targets in EV and SOX11 cells with and without DOX induction in cells grown in 2D. Experiment was repeated three times. (E) Western blot of MEX3A and TUBB3 in cytoplasmic and nuclear fractions of EV or SOX11 cells in presence or absence of 1 μM DOX. GAPDH and LAMIN B1 were used as loading control of cytoplasmic and nuclear fractions respectively. In brackets, densitometry results normalised against niEV and niSOX11. (F) IF staining of DCIS iEV and DCIS iSOX11 cells with TUBB3 (green) and MEX3A (red). Scale: 200 μm. (G) Western blot of MEX3A and TUBB3 in SOX11+ breast cancer cell lines and SOX11- DCIS.com and MCF10A from the MCF10A mammary cell progression series. (H) Pie charts representing the percentage of breast cancer samples with a log2 fold-change greater than two in the levels of MEX3A or TUBB3 RNA when SOX11 increased between 0.5- and 2-fold, 2- and 4-fold, or greater than 4-fold in the TCGA dataset. DOX: doxycycline, qRT-PCR: Quantitative real time PCR, IF: Immunofluorescence.
Figure 3—figure supplement 1
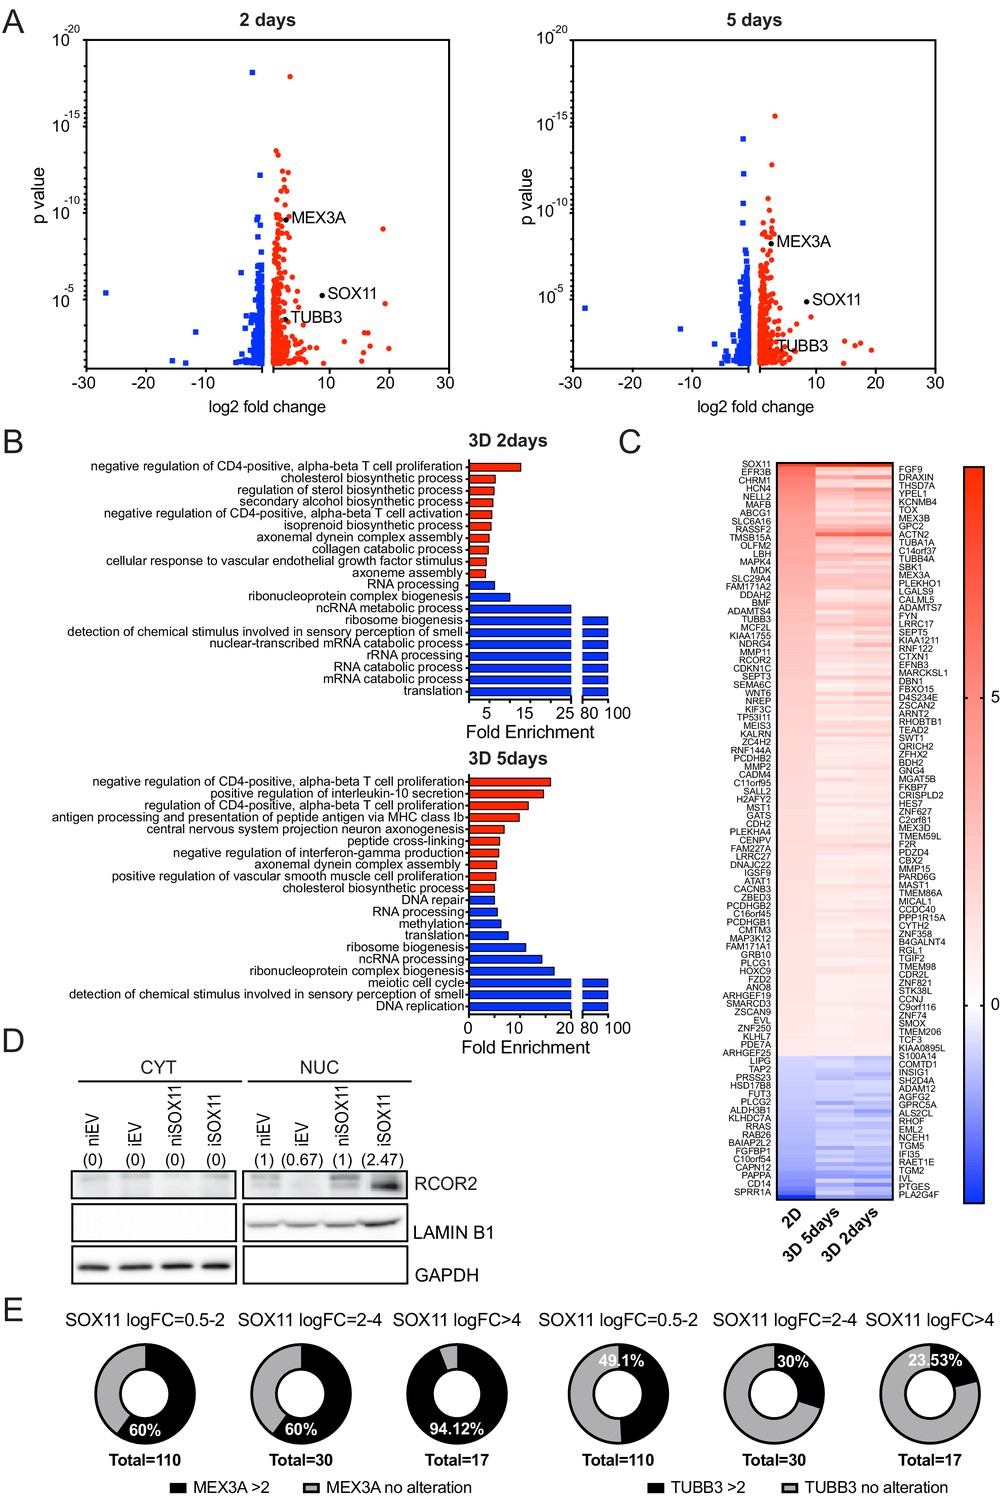
RNA sequencing results comparing iSOX11 and iEV cells.
(A) Volcano plots representing the genes with a log2 fold-change > +/- 0.585 in the RNA-sequencing results of comparing iSOX11 and iEV cells grown in 3D with DOX for 2 (left) or 5 days (right). (B) Gene ontology results from A. (C) List of genes overexpressed log2 fold-change >+/-0.585 times in all three RNA-sequencing (cells grown in: 2D, 3D for 2 days, 3D for 5 days) results comparing iSOX11 versus iEV. (D) Western blot of RCOR2 in cytoplasmic and nuclear fractions of EV or SOX11 cells in presence or absence of 1 μM DOX. GAPDH and LAMIN B1 were used as loading control of cytoplasmic and nuclear fractions, respectively. Densitometry results normalised against niEV and niSOX11 are shown in brackets. (E) Pie charts representing the percentage of samples with a log2 fold-change greater than two in the levels of MEX3A or TUBB3 RNA when SOX11 is increased between 0.5- and 2-fold, 2- and 4-fold, or greater than 4-fold in the Broad cell line dataset. DOX: Doxycycline.
Figure 4 with 2 supplements
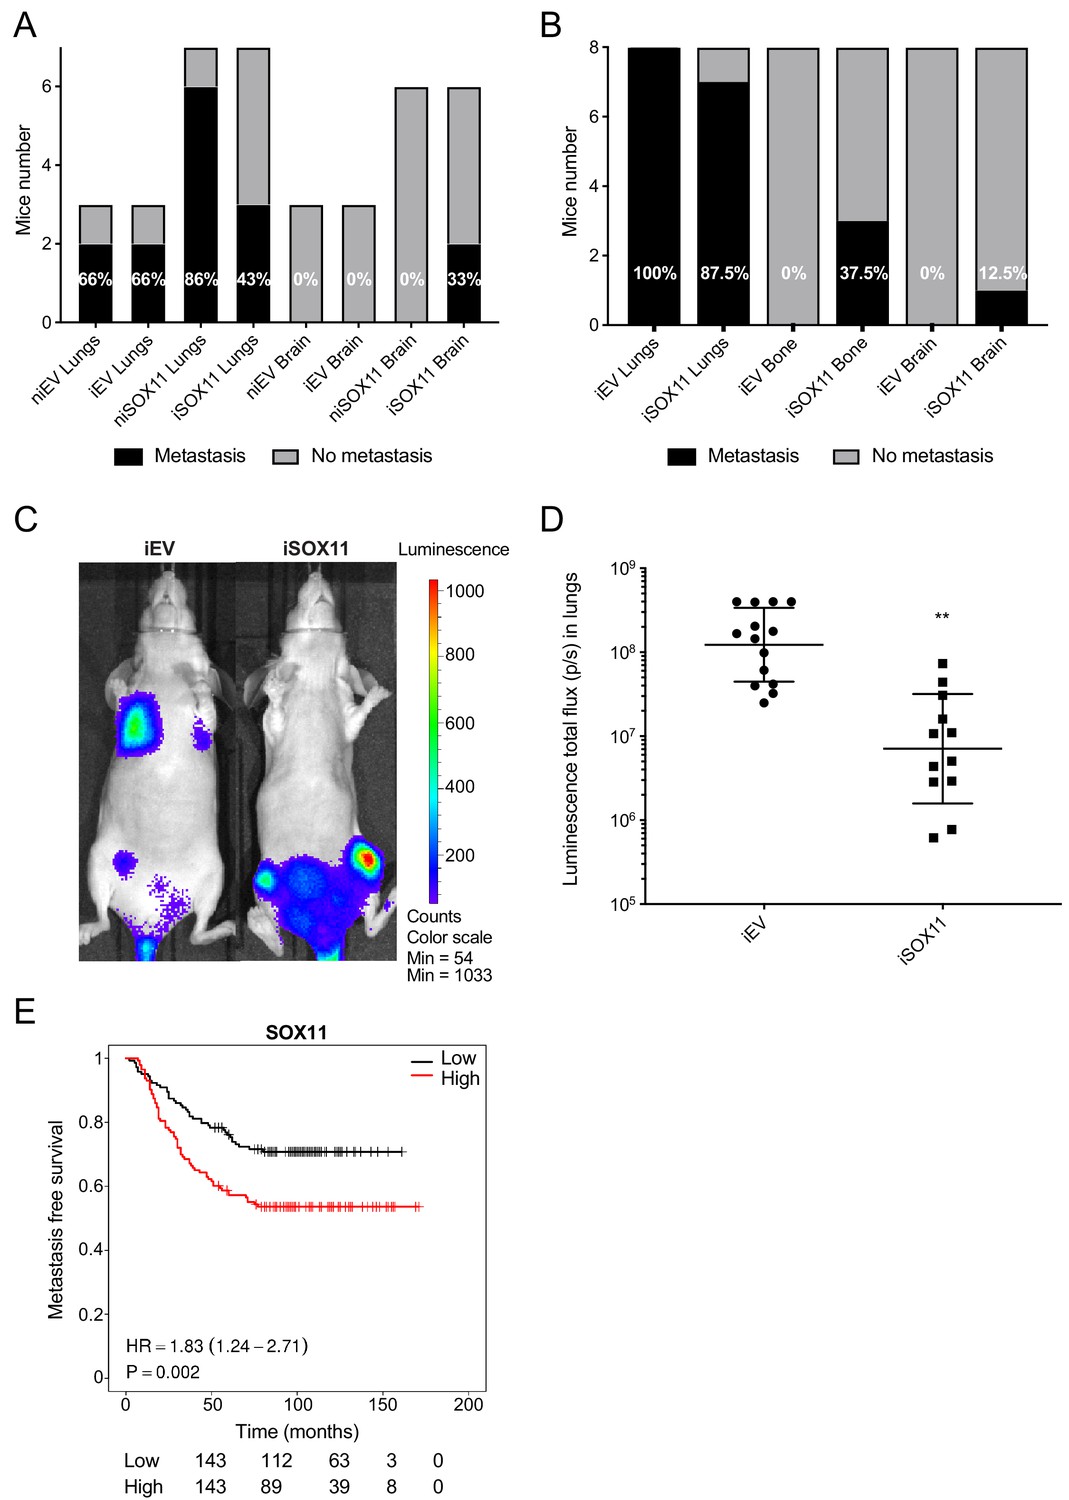
DCIS cells expressing SOX11 show alterations in metastatic tropism.
(A) Tabulated results of micrometastasis assessed by ex vivo IVIS imaging after orthotopic mammary fat pad xenografting of iEV and iSOX11 cells. (B) Tabulated results of micrometastasis assessed by ex vivo IVIS imaging after xenografting iEV and iSOX11 cells via the tail vein. (C) Representative in vivo IVIS 7 days after tail vein injections of iEV and iSOX11 cells. (D) Quantification of in vivo lung metastatic burden at day 31. Graph shows the luminescence total flux (p/s) in the lungs 31 days after tail vein injections. **p = 0.0011. (E) Distance metastasis-free survival curve for SOX11 in breast cancer patients in the Wang cohort (GSE2034).
Figure 4—figure supplement 1
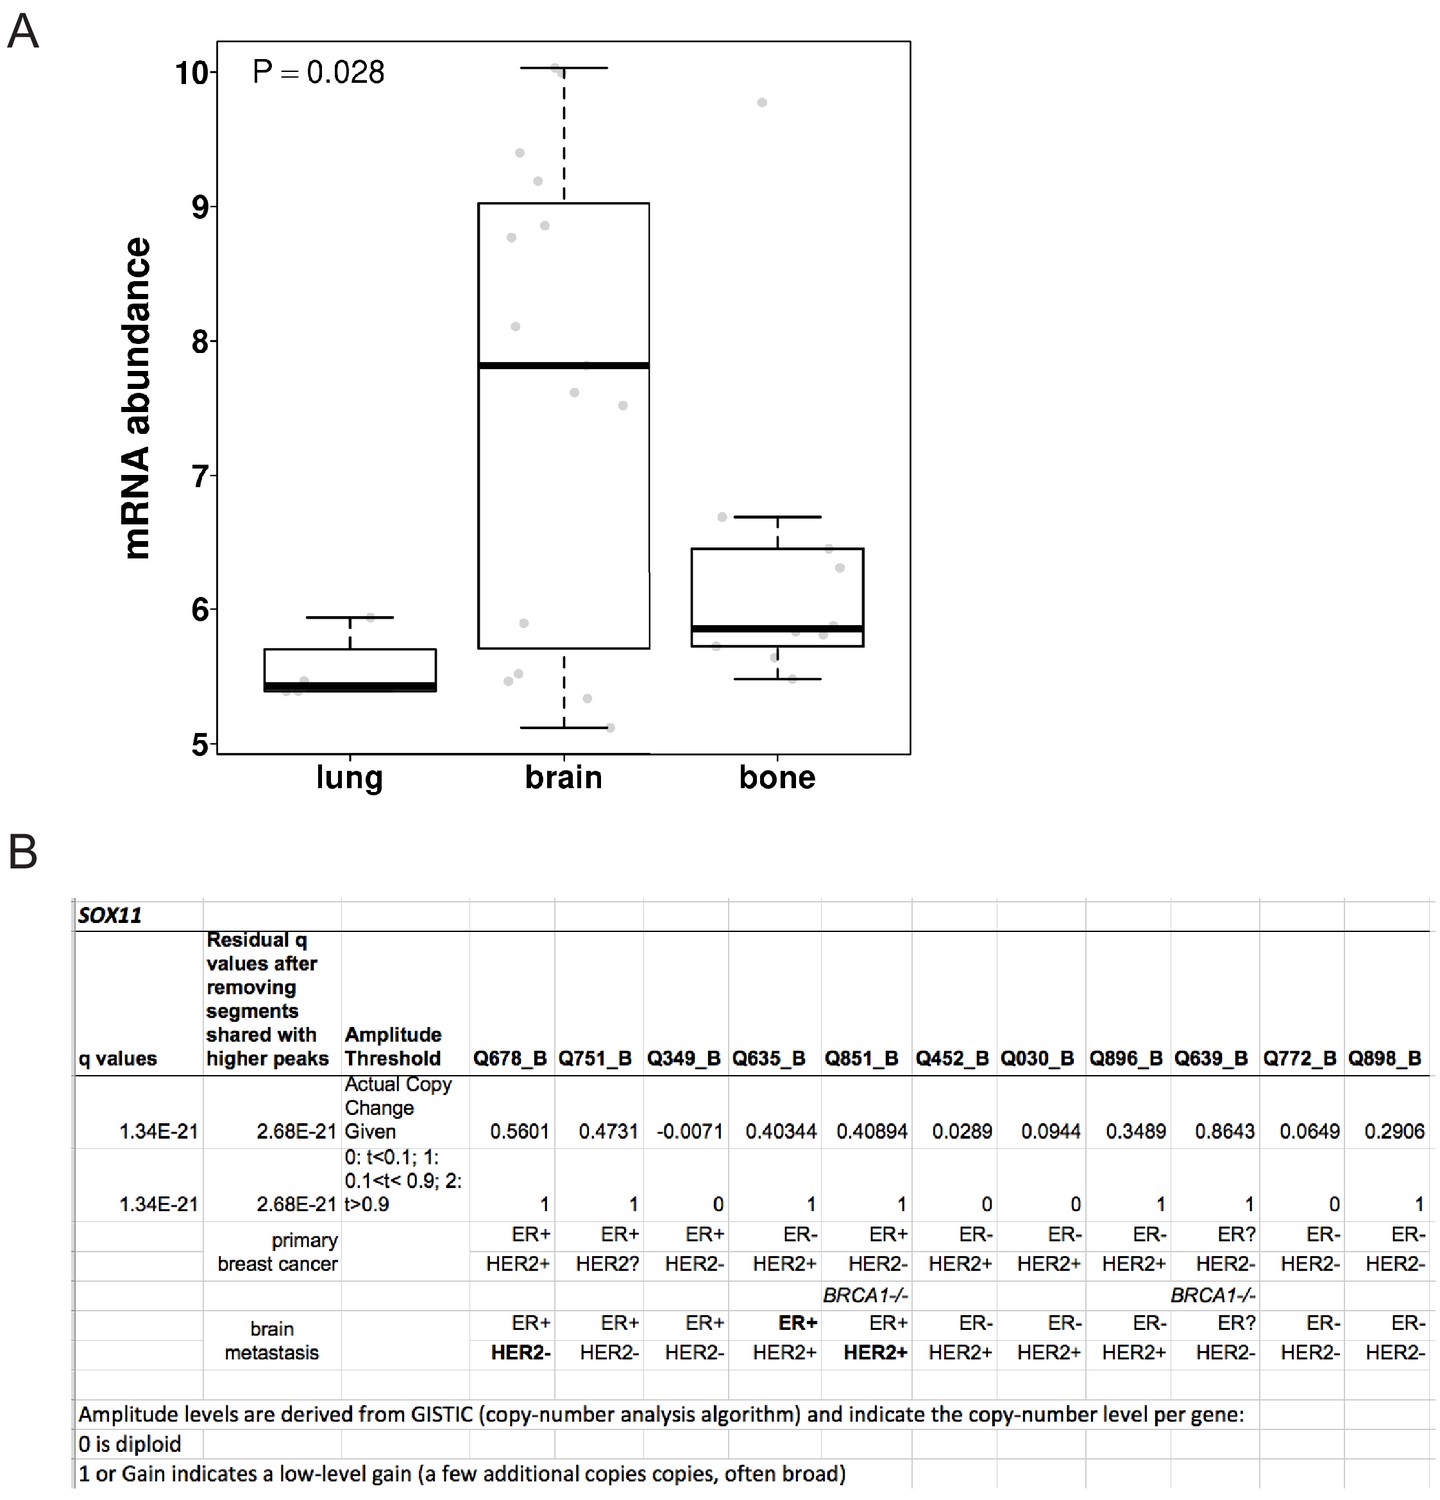
SOX11expression in breast cancer metastasis.
(A) SOX11 expression in breast cancer metastasis (Zhang cohort: GSE140200). (B) SOX11 is amplified and highly expressed in ~30% breast cancer brain metastasis (BCBM) from ER-, ER+, HER2+ and BRCA1-/- breast cancer patients in a study by Saunus et al., 2015.
Figure 4—figure supplement 2
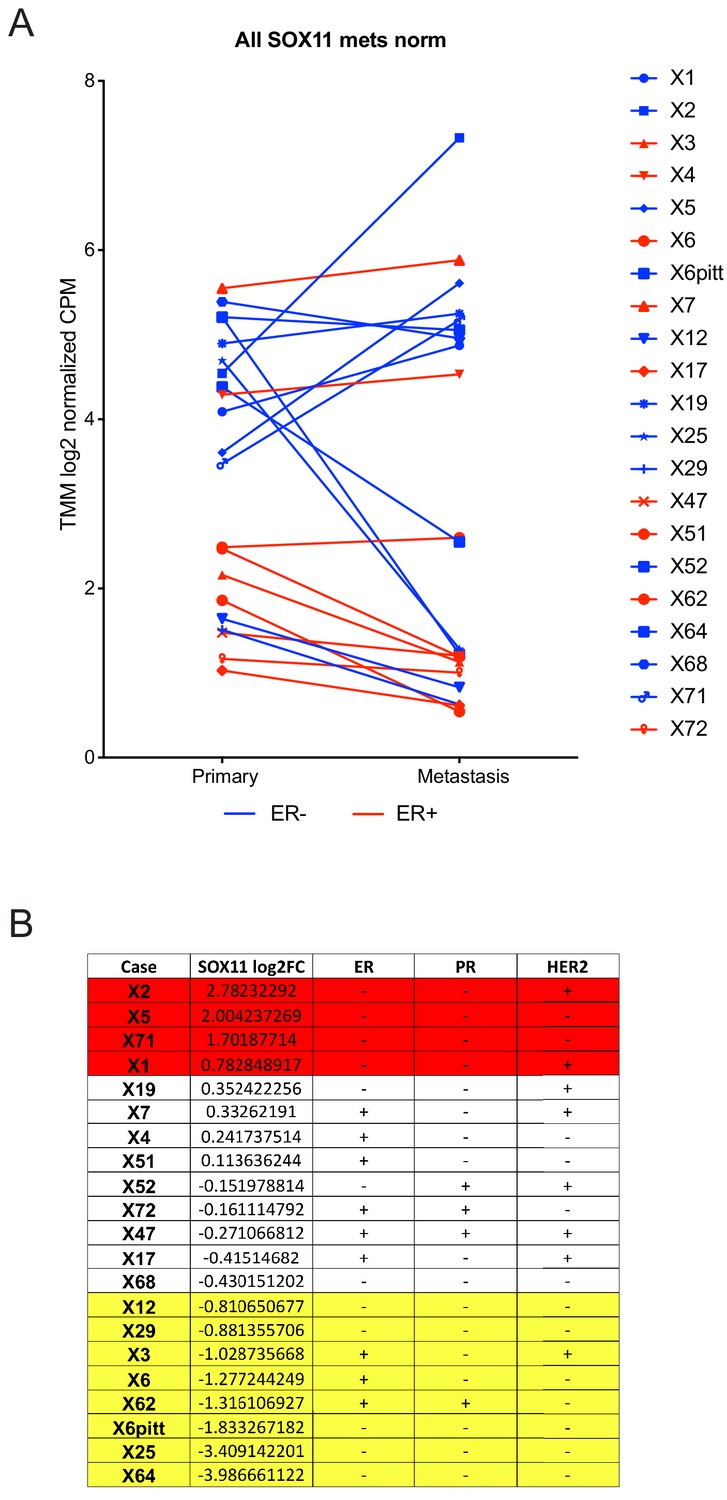
SOX11expression in breast cancer brain metastasis.
(A) Graph showing the log2 values of SOX11 in primary tumours and its correlative log2 values in the brain metastasis dataset from Varešlija et al., 2019. (B) Table resuming the SOX11 log2 fold-change between the values in the brain metastasis and the primary tumour and the ER, PR and HER2 status of each case.
Figure 5
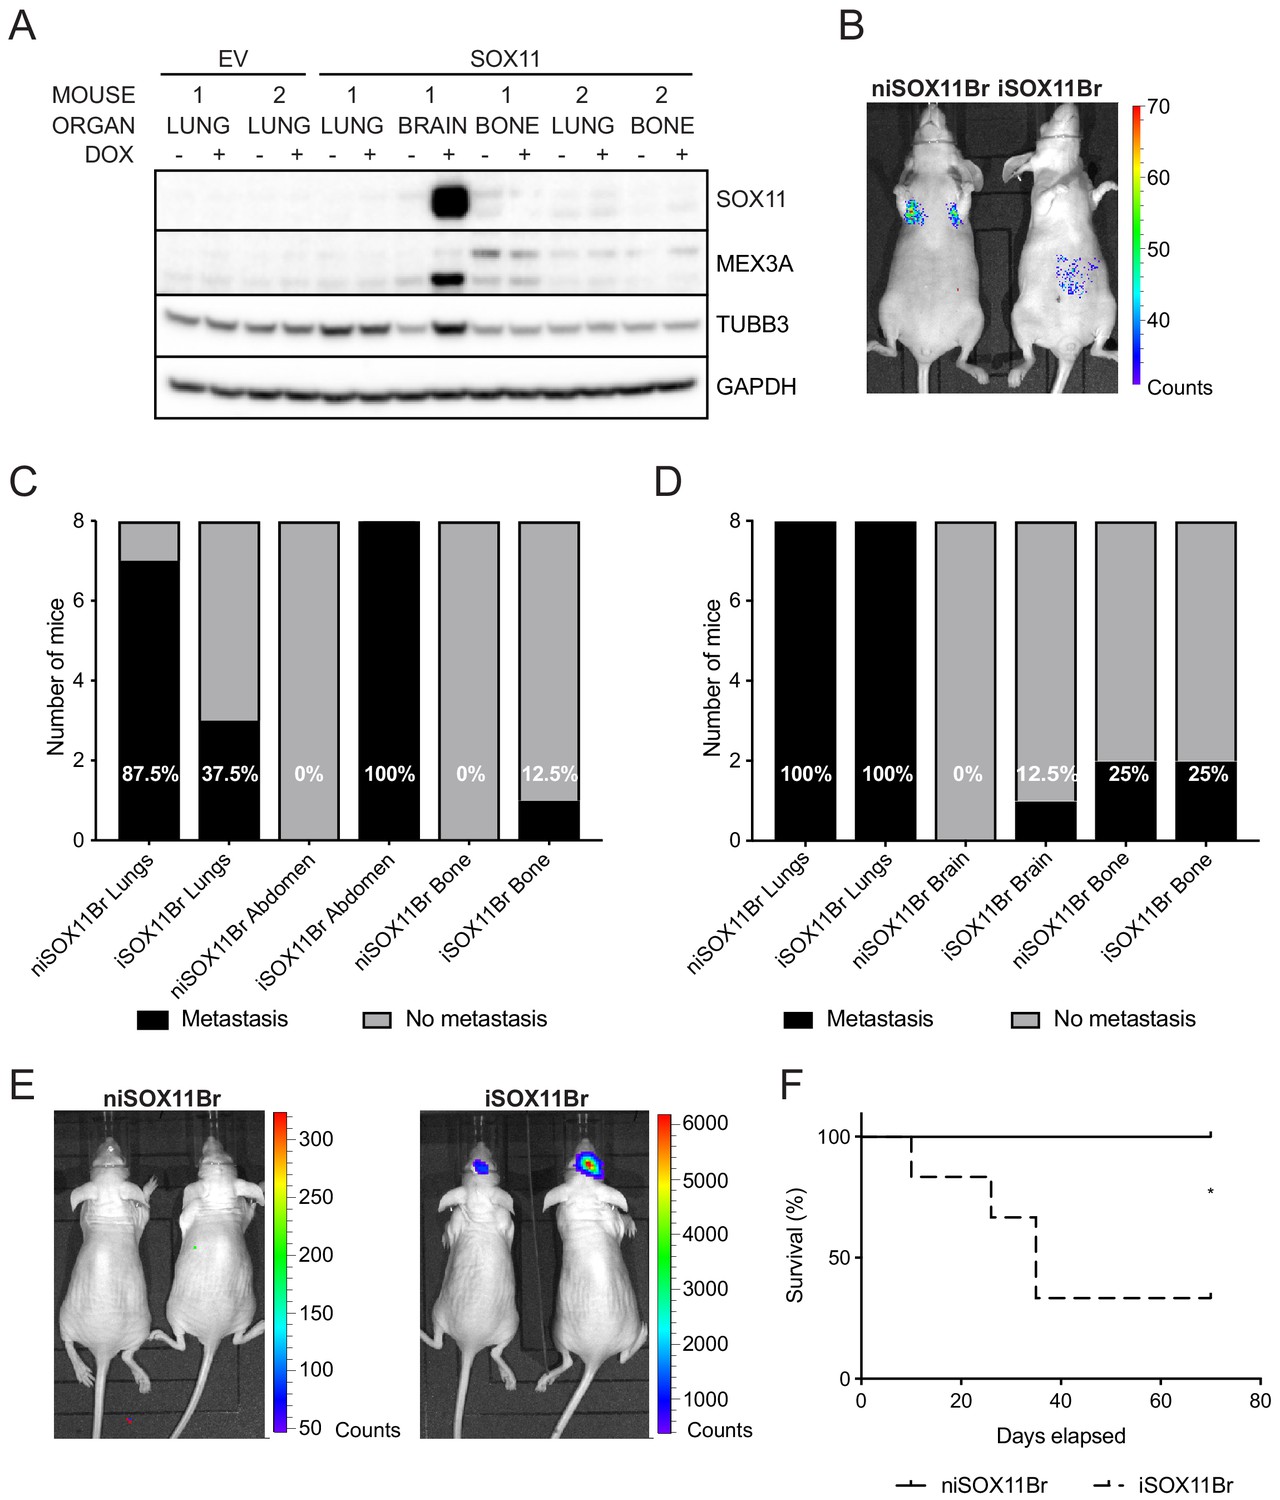
SOX11+ DCIS cells isolated from brain metastasis display a colonisation and growth advantage after intracranial xenografting.
(A) Western blot of SOX11, MEX3A and TUBB3 in total cell lysates of EV and SOX11 cell lines isolated from primary metastasis at indicated sites in presence or absence of DOX. (B) Representative in vivo IVIS imaging 7 days after tail vein injections of iSOX11 cells that were isolated from the brain metastasis (SOX11Br) in presence or absence of DOX. (C) Tabulated results of micrometastasis from in vivo IVIS imaging 7 days after tail vein injections of SOX11Br cells. (D) Tabulated results of micrometastasis from ex vivo IVIS imaging of the tail vein injections of SOX11Br cells. (E) IVIS imaging of mice fed normal chow or DOX-containing chow 10 days after intracranial injections of SOX11Br cells. (F) Survival curve for mice shown in E. *p = 0.0195. DOX: doxycycline.
Figure 6
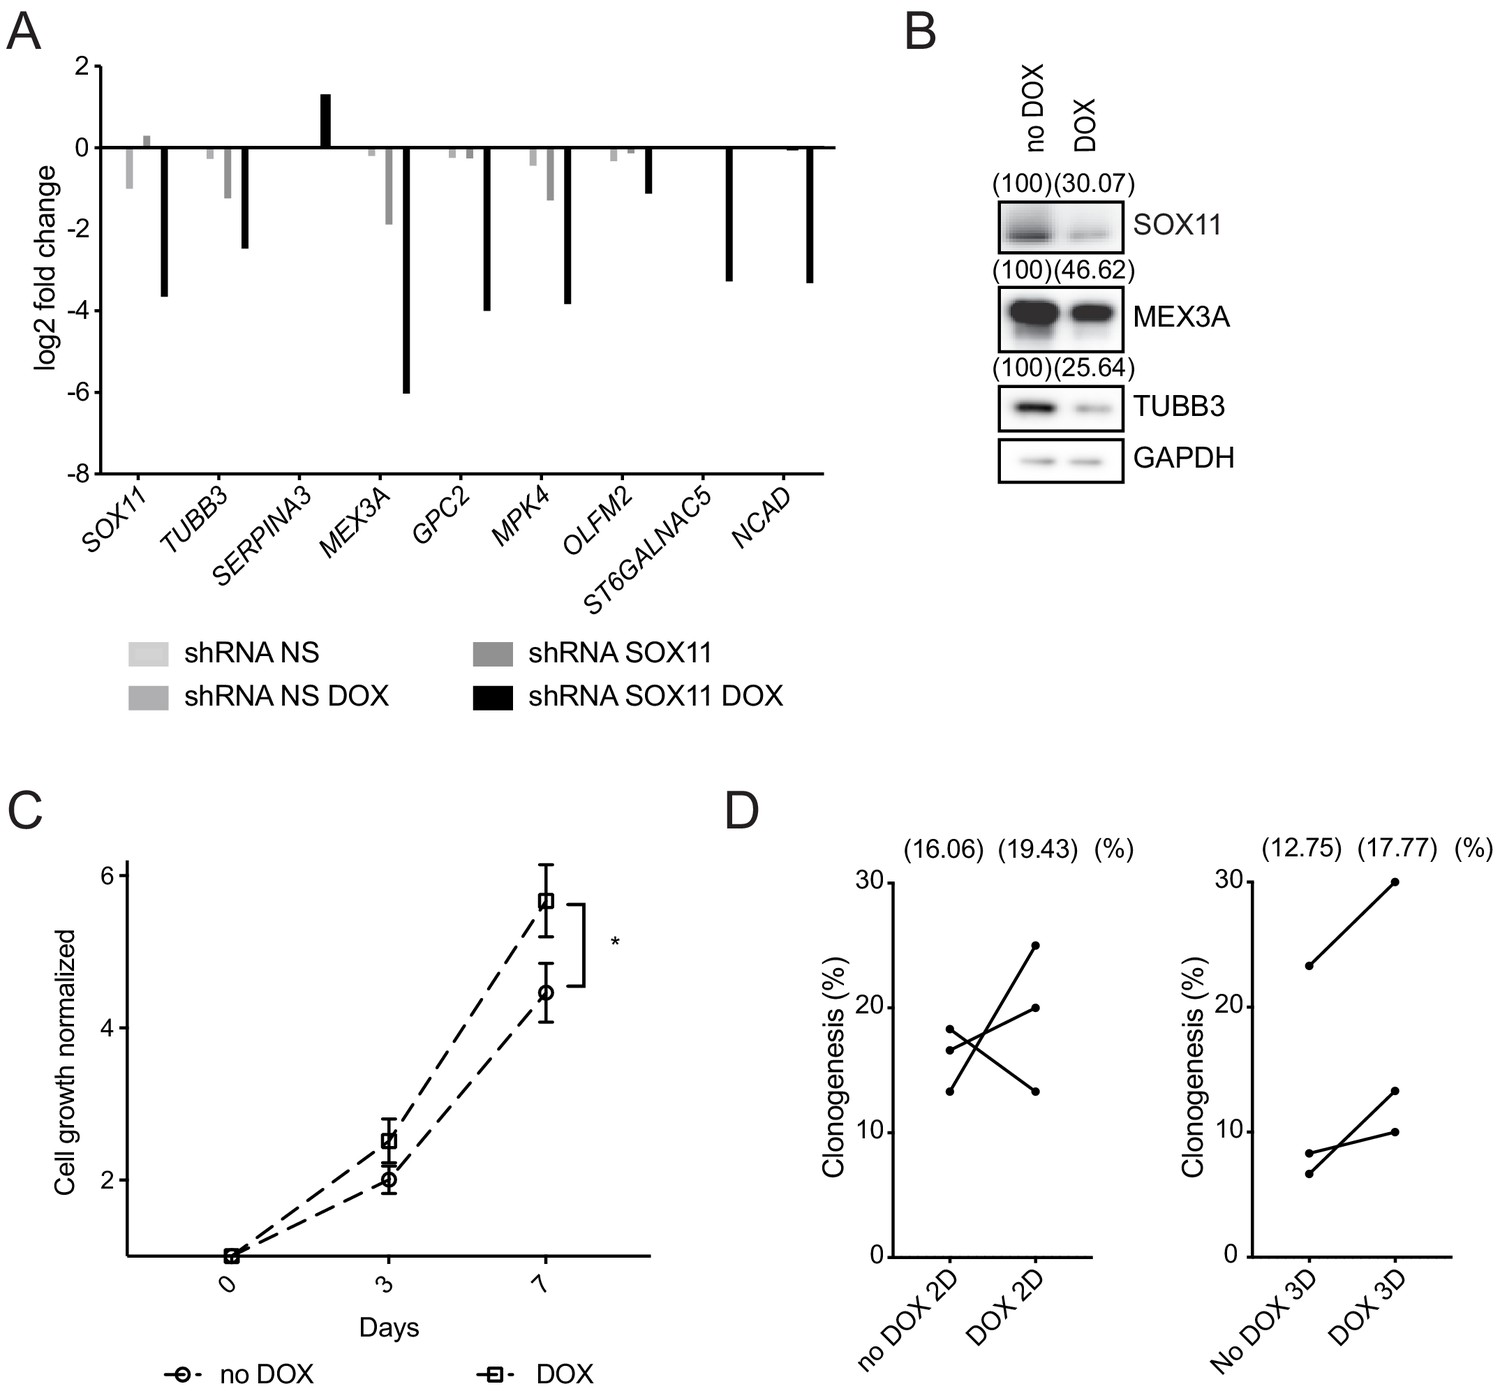
SOX11 regulates growth of ER- breast cancer cells.
(A) qRT-PCR results for several potential SOX11 targets in CAL-148 cells transduced with shRNA to SOX11 or shRNA NS cells with and without DOX induction in cells grown in 2D. (B) Western blot of SOX11, MEX3A and TUBB3 in total cell lysates of CAL-148 cells transduced with shRNA SOX11 in presence or absence of 1 μM DOX after 48 hr. GAPDH was used as loading control. Densitometry results normalised against no DOX are shown in brackets. (C) Cell growth assay results for CAL-148 shRNA SOX11 cells induced with 1 μM DOX at 3 and 7 days. Experiments were performed three times. Error bars represent SEM. *p=0.0106 (day 7). (D) Quantification of clonogenicity in 2D and 3D from single CAL-148 shRNA SOX11 cells plated in presence or absence of DOX after 21 days. The number in brackets represents the mean in each group of the three experimental replicates. DOX: doxycycline, NS: non-silencing.
Figure 7 with 2 supplements
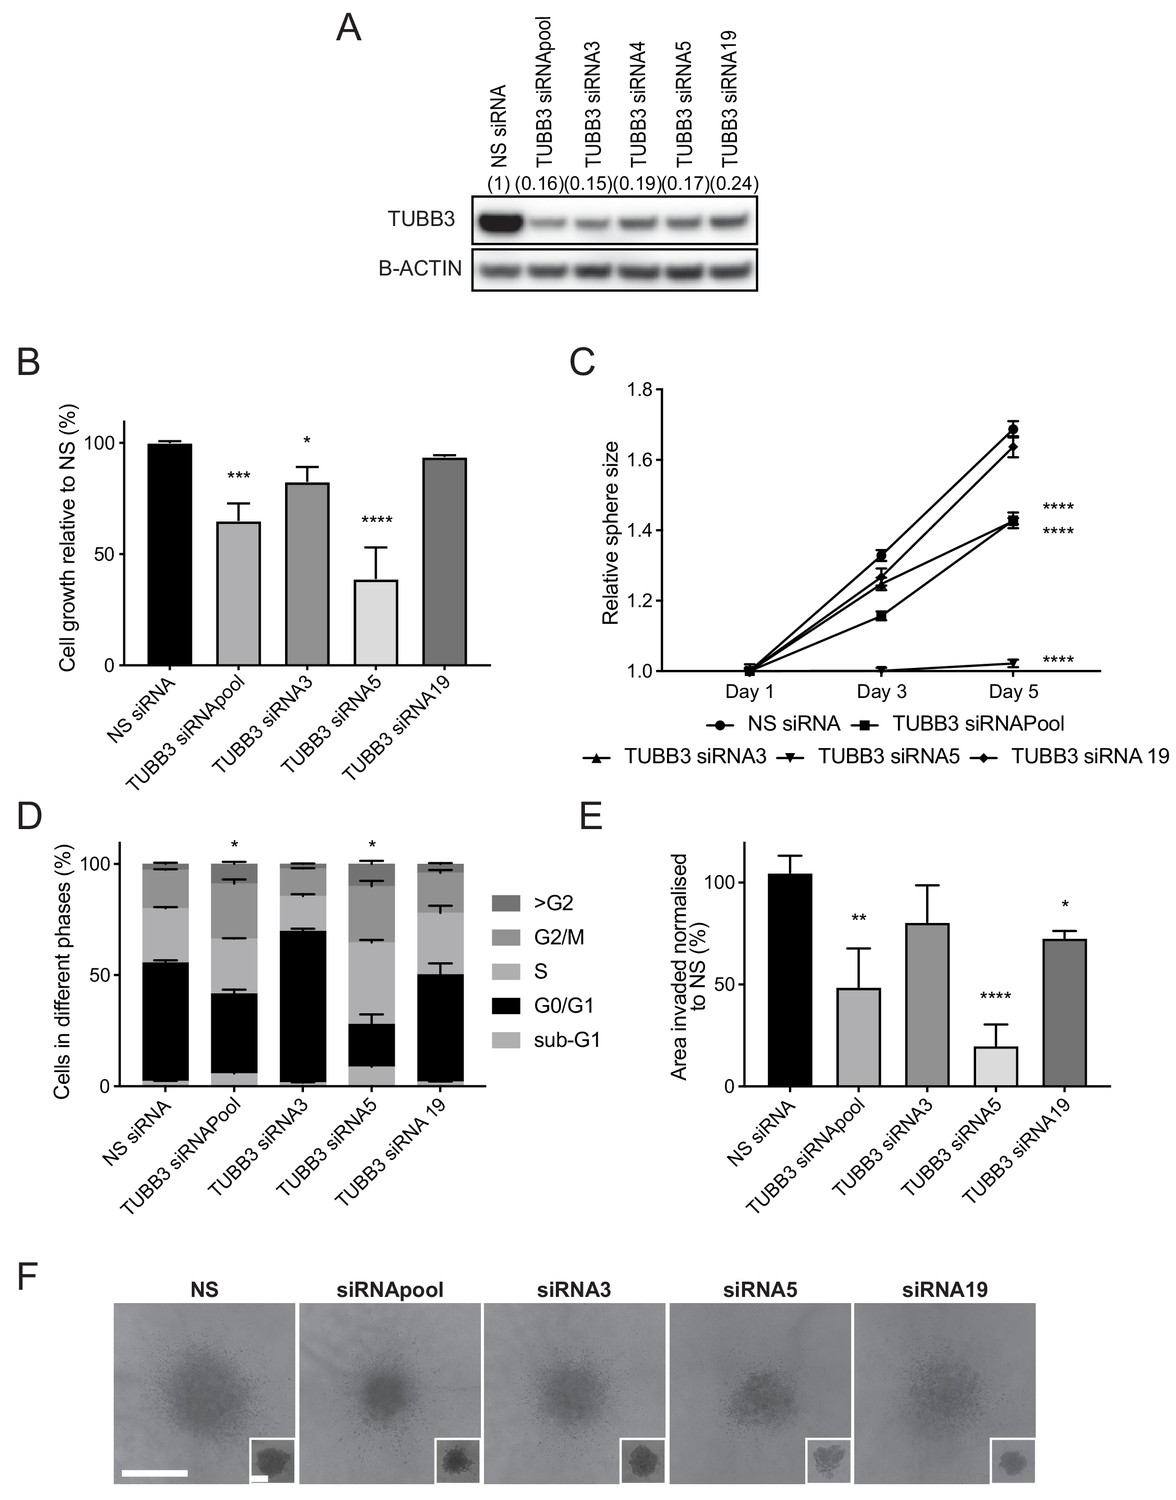
TUBB3, an established SOX11 target, regulates cell growth and invasive potential of ER- breast cancer cells.
(A) Western blot of TUBB3 in total cell lysates of BT-20 cells transfected with siRNAs specific for TUBB3. B-ACTIN was used as loading control. Densitometry results normalised against NS siRNA are shown in brackets. (B) Cell growth assay results 5 days after BT-20 cells were transfected with siRNA specific for TUBB3 (since siRNAs require 48 hr for efficient knockdown). Results relative to NS siRNA are shown. Experiments performed three times. *p = 0.0297, ***p = 0.0001, ****p < 0.0001. (C) Sphere size measured 3 and 5 days after BT-20 cells were transfected with siRNA specific for TUBB3. Results relative to NS siRNA are shown. Experiments performed three times. ****p < 0.0001. (D) Cell cycle analysis performed by flow cytometry at day two after siRNA transfection specific for TUBB3 in BT-20 cells. Graph shows % of cell in each phase of the cell cycle. *p = 0.0396 (Phase G2/M siRNApool vs siRNA NS) and *p = 0.0243 (Phase G2/M siRNA5 vs siRNA NS). Experiments were performed three times. (E) Invasion assay after overlaying BT-20 spheroids with Collagen I at day 2 after siRNA transfection specific for TUBB3. Graph shows the area invaded in pixel2 normalised against NS siRNA. *p = 0.0444, **p = 0.0014, ****p < 0.0001. (F) Representative images of BT-20 spheroids transfected with indicated siRNAs to TUBB3 48 hr after adding Collagen I and (in small insets) at time 0 hr (2 days after transfection). Scale bar: 200 μm. NS: non-silencing.
Figure 7—figure supplement 1
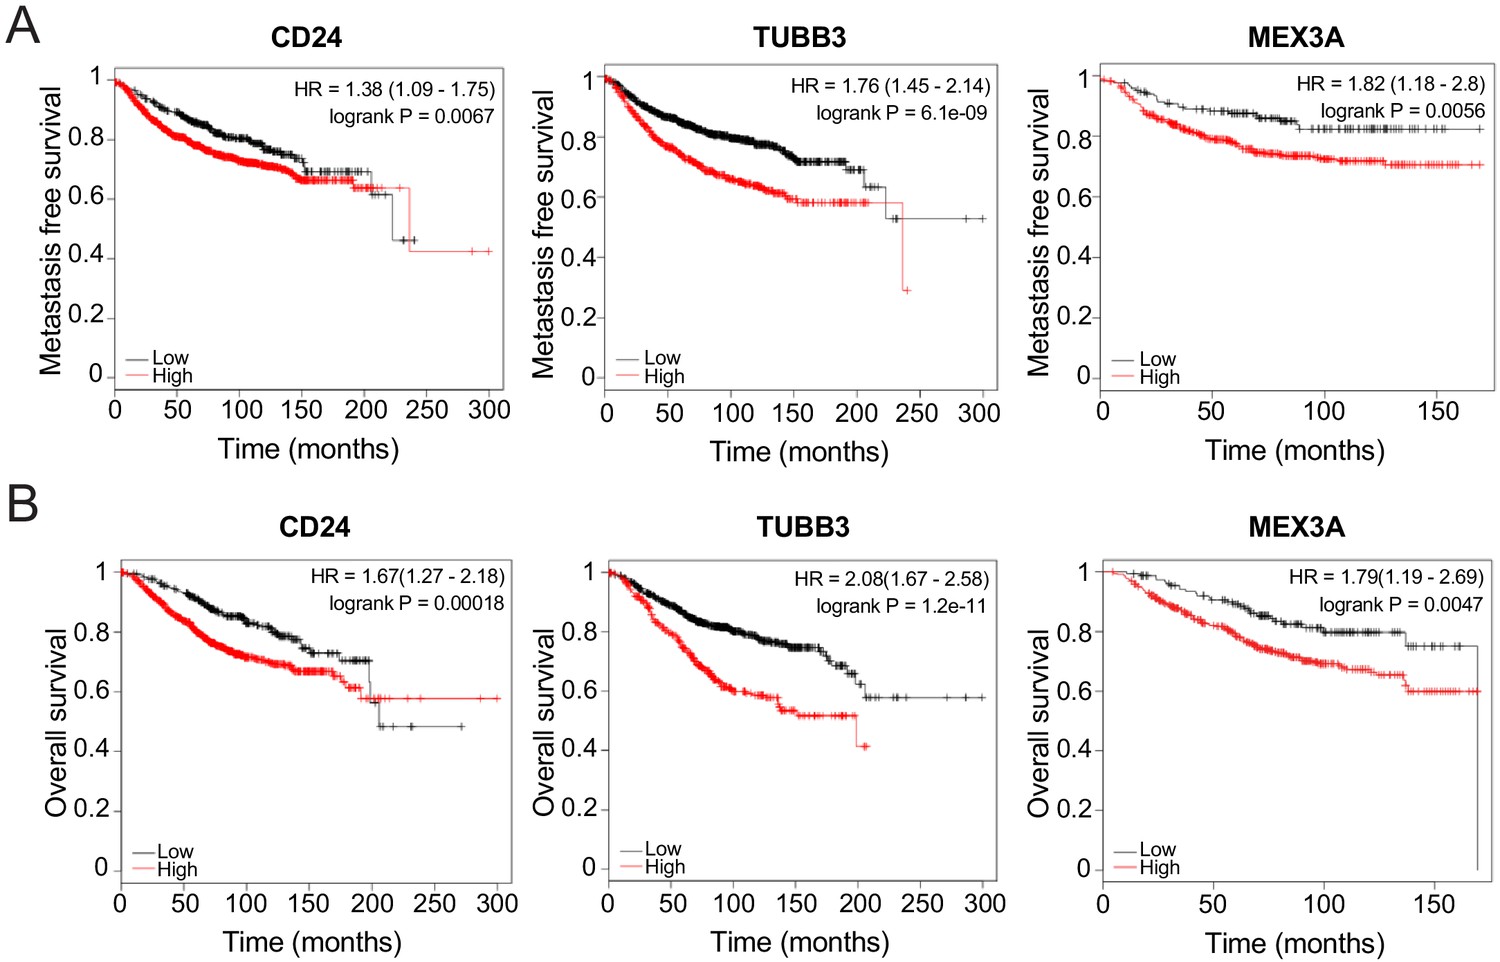
Survival curves of breast cancer patients with tumours expressing low or high levels ofCD24,TUBB3, andMEX3A.
(A) Distant metastasis-free survival of breast cancer patients with low or high expression of CD24, TUBB3, and MEX3A. (B) Overall survival of breast cancer patients with low or high expression of CD24, TUBB3, and MEX3A.
Figure 7—figure supplement 2
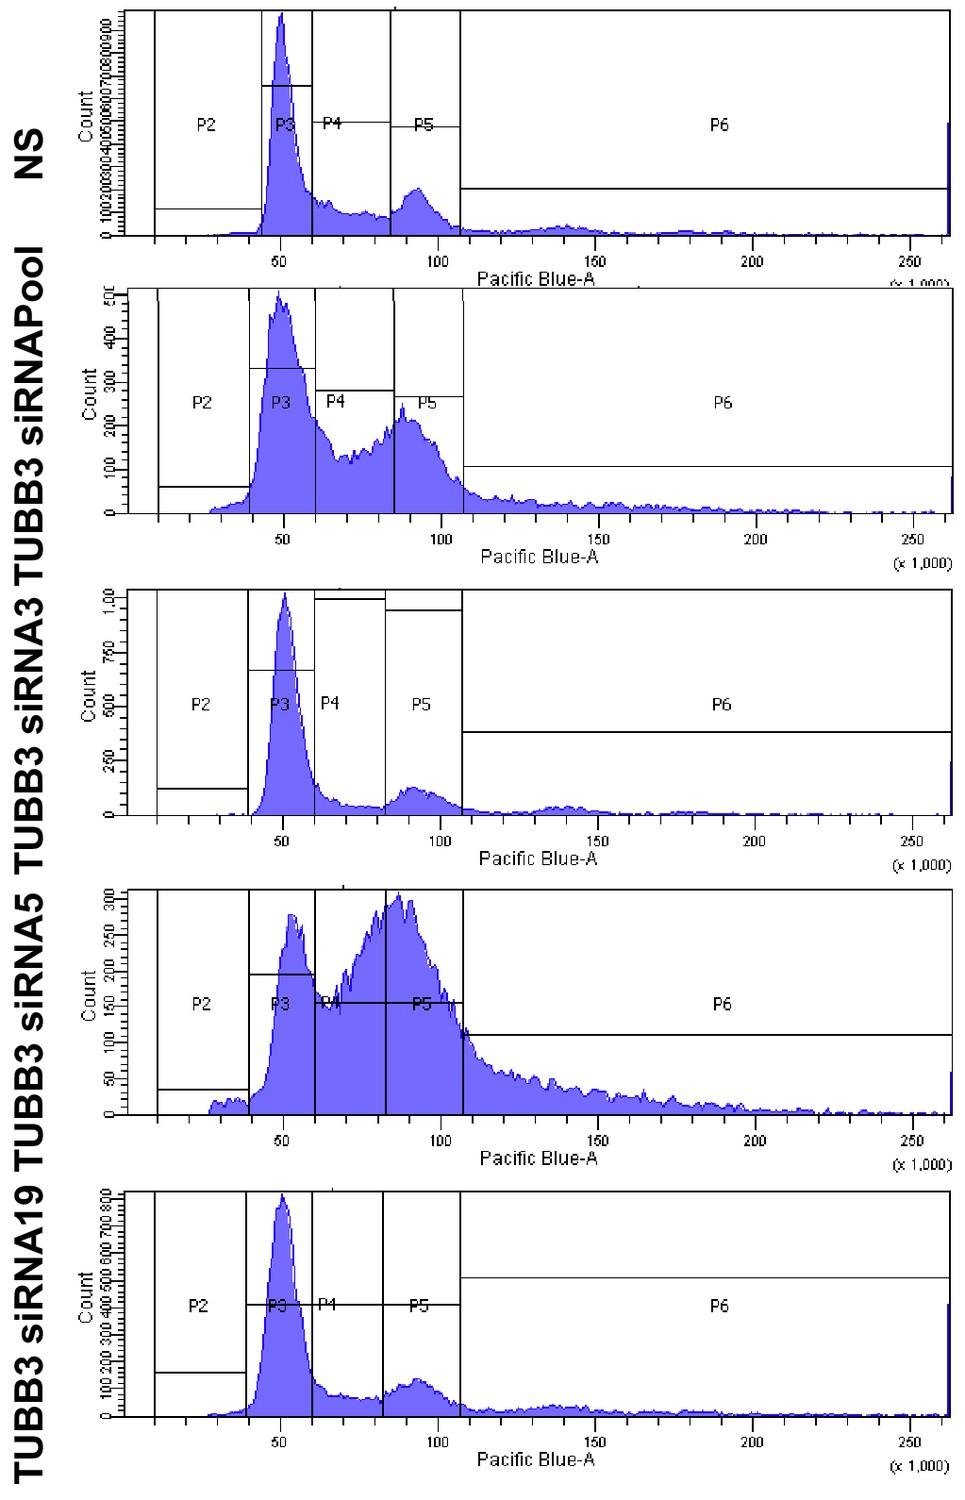
Representative flow cytometry histograms of cell cycle analysis of BT-20 cells after transfection with specific TUBB3 siRNAs.
Figure 8 with 2 supplements
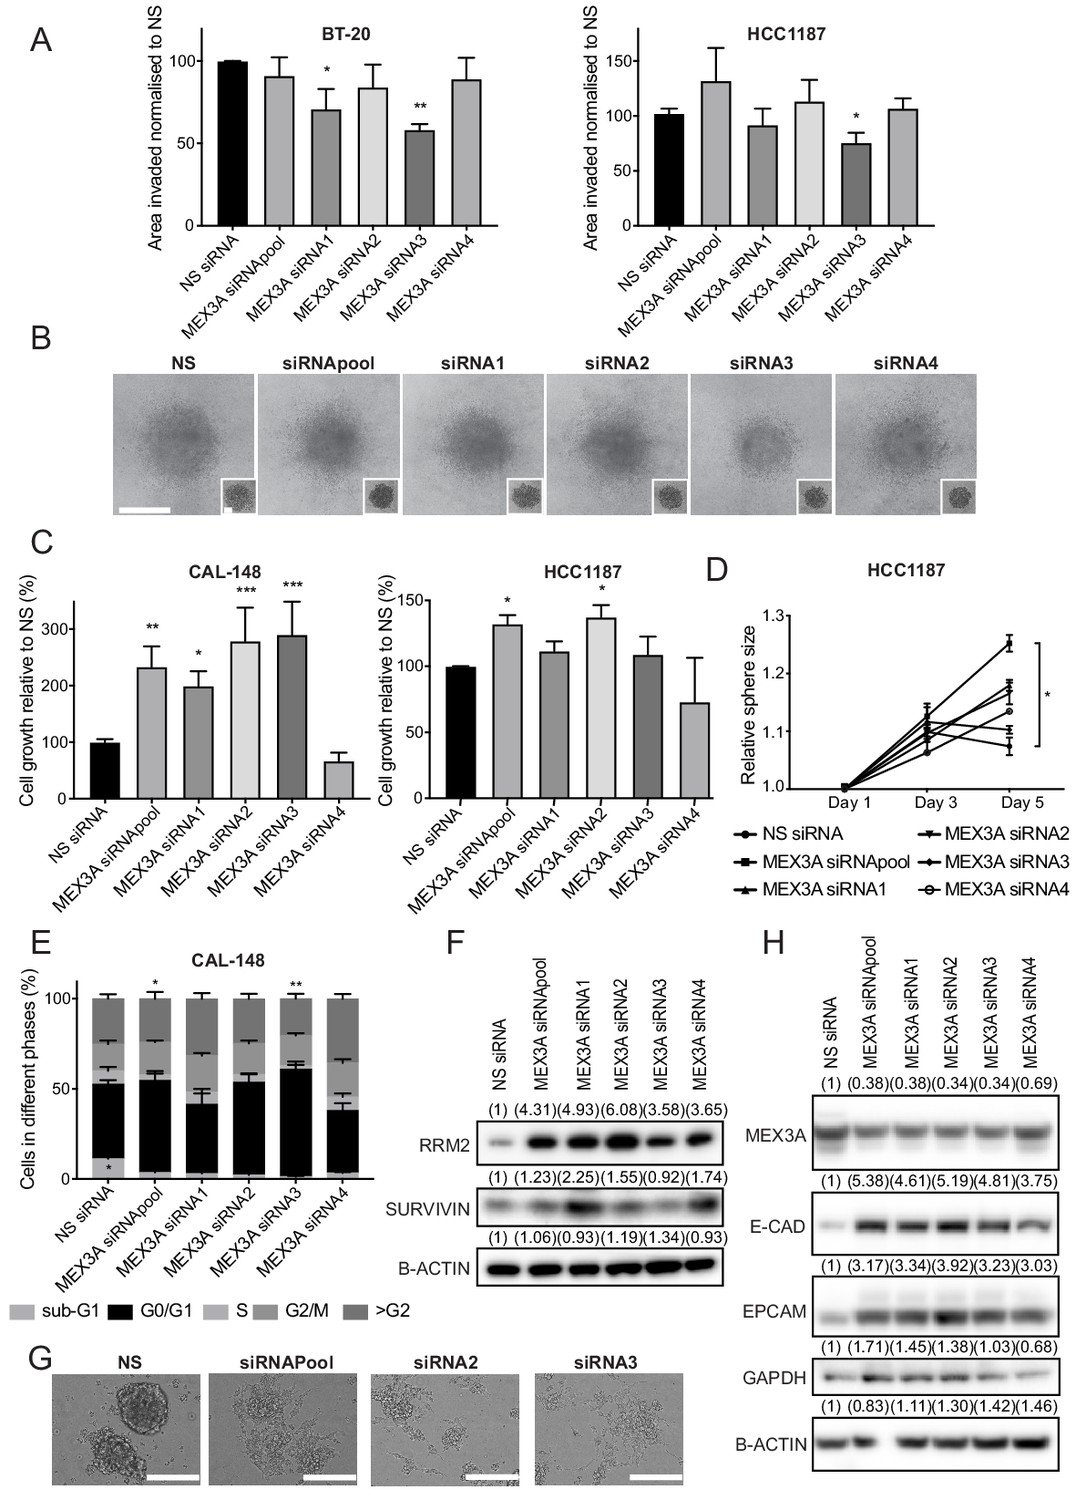
MEX3A, a novel SOX11 downstream effector, regulates cell growth and (E/M) state of ER- breast cancer cells.
(A) Invasion assay results after overlaying BT-20 and HCC1187 spheroids with Collagen I, at day two after siRNA transfection specific for MEX3A or control (NS). Graph shows the area invaded in pixel2 normalised against NS siRNA. *p = 0.0181, **p = 0.0014 for BT-20 and *p = 0.0220 for HCC1187 cells. (B) Representative images of BT-20 spheroids 48 hr after adding Collagen I and at time 0 hr (shown in small inset, 2 days after transfection) made from cells transfected with either control siRNA or MEX3A siRNAs. Scale bar: 200 μm. (C) Cell growth assays 5 days after CAL-148 and HCC1187 cells were transfected with siRNA specific for MEX3A or NS controls (siRNAs require 48 hr for efficient knockdown; this was taken into account to select day five as final point). Relative results to NS siRNA are shown. Experiments performed three times. *p = 0.0342, **p = 0.0052 ***p = 0.0005 (siRNA2), ****p < 0.0003 (siRNA3) for CAL-148 cells and *p=0.0337 (siRNApool) and *p = 0.0477 for HCC1187 cells. (D) Sphere size measured 3, and 5 days after HCC1187 cells were transfected with siRNA specific for MEX3A. Relative results to NS siRNA are shown. Experiments performed three times *p = 0.0240. (E) Cell cycle analysis performed by flow cytometry at day 4 after siRNA transfection specific for MEX3A in CAL-148 cells. Graph shows % of cell in each phase of the cell cycle. *p = 0.0147 (phase S siRNApool vs siRNA NS) and *p = 0.0094 (phase S siRNA3 vs siRNA NS) and *p = 0.0419 (phase subG1 NS vs siRNA3). Experiments performed four times. (F) Western blot of RRM2 and SURVIVIN in total cell lysates of CAL-148 at day four after siRNA transfection specific for MEX3A. β-ACTIN was used as loading control. Densitometry results normalised against NS siRNA are shown in brackets. (G) Examples of morphological changes observed in CAL-148 cells after 4 days of MEX3A knockdown compared to NS control. Scale bar: 200 μm. (H) Western Blot of EPCAM and E-CADHERIN in CAL-148 cells transfected with siRNA specific for MEX3A or NS control. β-ACTIN was used as loading control. Densitometry results normalised against NS siRNA are in brackets. NS: non-silencing.
Figure 8—figure supplement 1
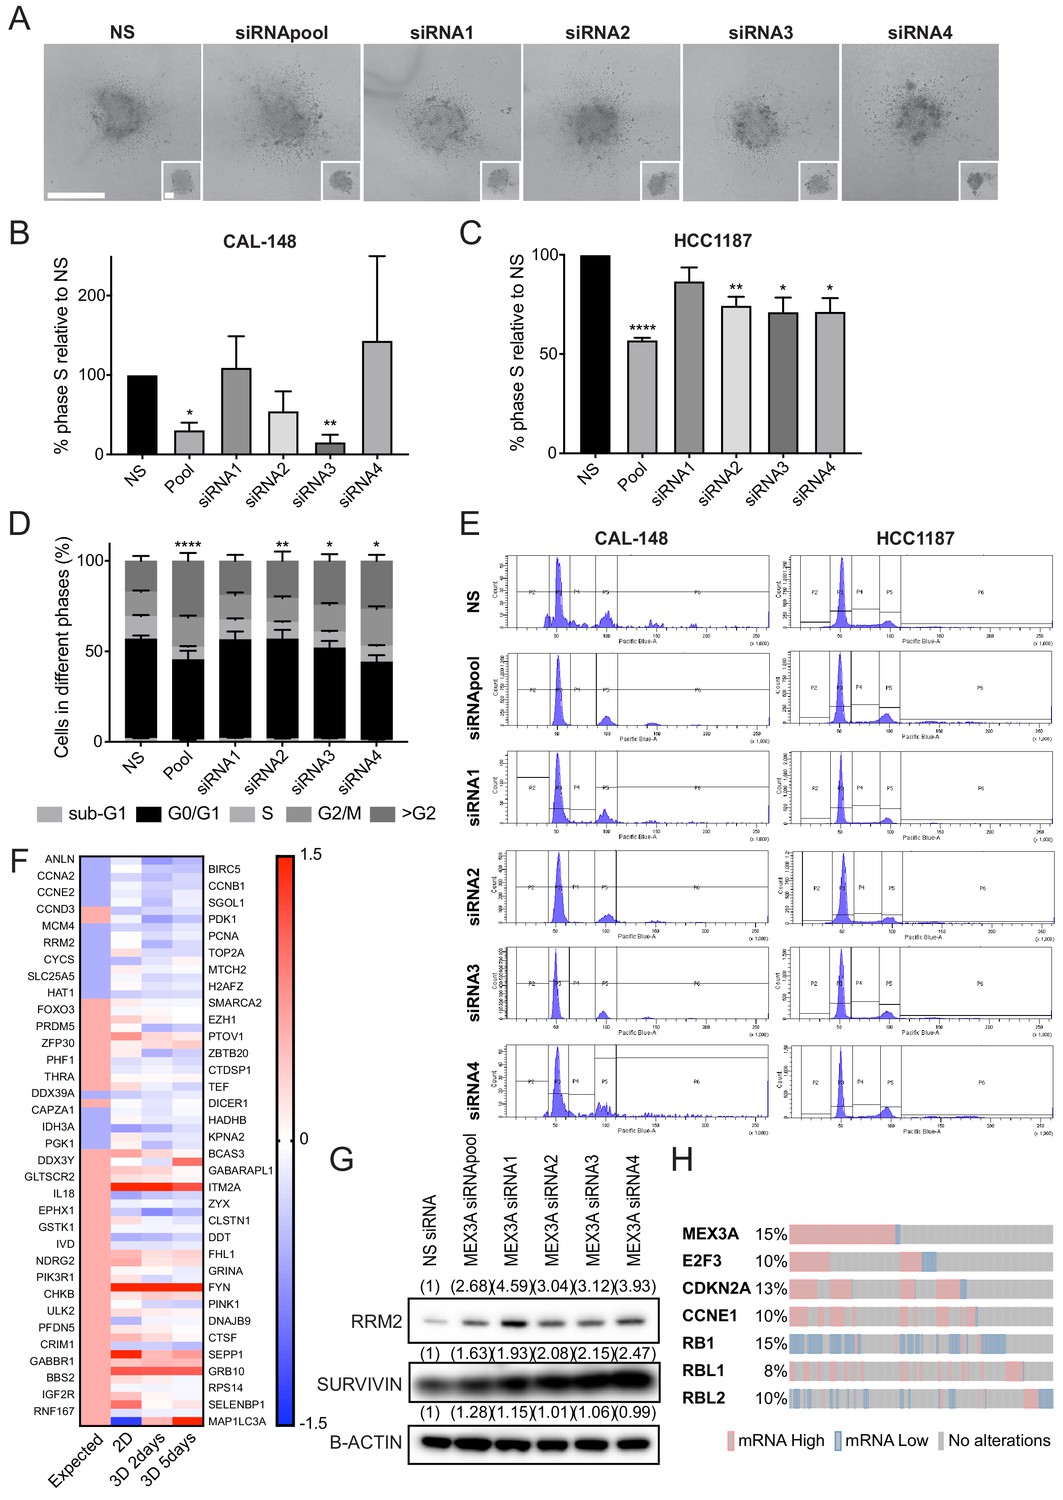
MEX3A regulates growth of ER- breast cancer cells.
(A) Representative images of HCC1187 spheroids 48 hr after adding Collagen I and at time 0 hr (shown in small inset, 2 days after transfection) made from cells transfected with either control siRNA or MEX3A siRNAs. Scale bar: 200 μm. (B) Percentage of cells in S phase normalised against cells transfected with the NS siRNA in CAL-148 cells at day 4. Experiments performed three times. (C) Percentage of cells in S phase normalised against cells transfected with the NS siRNA in HCC1187 cells at day 2. Experiments performed four times. (D) Cell cycle analysis performed by flow cytometry at day 2after siRNA transfection specific for MEX3A in HCC1187 cells. Graph shows % of cell in each phase of the cell cycle. Experiments performed four times. (E) Representative flow cytometry histograms of cell cycle analysis of CAL-148 and HCC1187 cells after transfection with specific MEX3A siRNAs. (F) Heatmap representing the values of a consensus stem cell quiescence signature in the RNA-sequencing results of comparing iSOX11 and iEV cells grown in 2D for 2 days or 3D with DOX for 2 or 5 days. (G) Western blot of RRM2 and SURVIVIN in total cell lysates of BT-20 at day 2 after siRNA transfection specific for MEX3A. β-ACTIN was used as loading control. Densitometry results normalised against NS siRNA are shown in brackets. DOX: Doxycycline, NS: non-silencing.
Figure 8—figure supplement 2
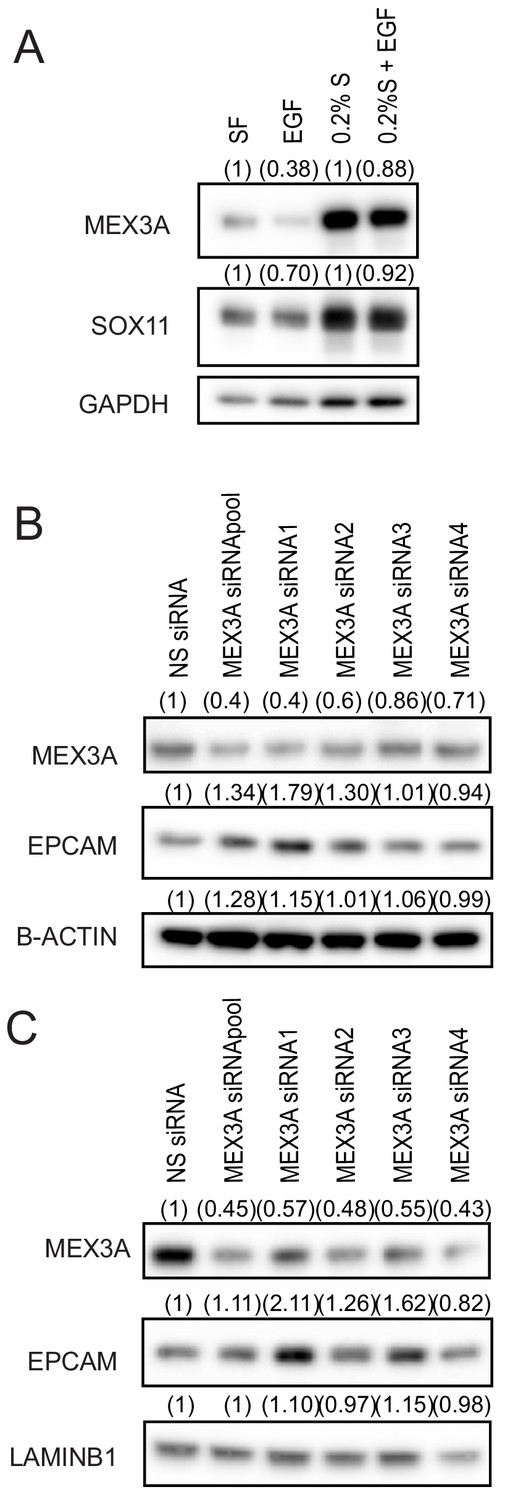
MEX3A regulates epidermal state of ER- breast cancer cells.
(A) Western blot to detect MEX3A in CAL-148 cells that were grown in serum free media or media supplemented with 0.2% FBS for 24 hr in presence or absence of EGF 1 ng/ml. GAPDH was used as loading control. Densitometry results normalised against NS siRNA are in brackets. (B) Western blot to detect MEX3A and EPCAM in BT-20 cells transfected with siRNA specific for MEX3A or NS control. β-ACTIN was used as loading control. Densitometry results normalised against NS siRNA are in brackets. (C) Western blot to detect MEX3A and EPCAM in HCC1187 cells transfected with siRNA specific for MEX3A or NS control. LAMIN B1 was used as loading control. Densitometry results normalised against NS siRNA are in brackets. FBS: Fetal bovine serum, NS: non-silencing.
Tables
Table 1
iSOX11 spheroids express reactivated embryonic wound signature.
Genes upregulated in mouse epidermal cells at E13.5 and at wound edge that are directly regulated by Sox11 and Sox4 in both E16.5 epidermis and keratinocytes in Miao et al., 2019 are significantly upregulated in iSOX11 cells grown as spheroids.
| 3D (2 days) | Log2 fold-change | p-Values |
|---|---|---|
| GNG2 | 2.30823519 | 4.85E-05 |
| RCOR2 | 1.57478431 | 2.90E-05 |
| MARCKSL1 | 1.06239497 | 7.15E-08 |
| EVL | 0.8482472 | 9.60E-06 |
| SNN | 0.78560135 | 3.11E-05 |
| FBL1M1 | 0.78250288 | 3.12E-05 |
| ETV4 | 0.77064674 | 8.27E-05 |
| VCAN | 0.67955833 | 0.00094939 |
| TWIST2 | 0.64425385 | 0.01949167 |
| PXDN | 0.63841224 | 1.14E-05 |
| ARHGEF2 | 0.58601526 | 2.88E-06 |
| TMSB10 | 0.56607317 | 0.00030783 |
| C4orf48 | 0.54288141 | 0.03406946 |
Key resources table
| Reagent type (species) or resource | Designation | Source or reference | Identifiers | Additional information |
|---|---|---|---|---|
| Gene (Homo sapiens) | SOX11 | DNASU | Gene ID: 6664 Clone HsCD00295480 19 | |
| Strain, strain background (Mus musculus, Female) | NSG-Foxn1null | in house | from breeding colony at ICR Biological Services Unit | |
| Cell line (Homo sapiens) | MCF10DCIS.com | Dr. Gillian Farnie | ||
| Cell line (Homo sapiens) | CAL-148 | DMSZ | ACC 460 | |
| Cell line (Homo sapiens) | BT-20 | ATCC | HTB-19 | |
| Cell line (Homo sapiens) | HCC1187 | ATCC | CRL-2322 | |
| Cell line (Homo sapiens) | MCF10A | ATCC | CRL-10317 | |
| Cell line (Homo sapiens) | BT474 | ATCC | HTB-20 | |
| Cell line (Homo sapiens) | BT549 | ATCC | HTB-122 | |
| Cell line (Homo sapiens) | HCC202 | Dr. Paul Huang, ICR, London | CRL-2316 | |
| Cell line (Homo sapiens) | MX-1 | DMSZ | CVCL_4774 | |
| Cell line (Homo sapiens) | UACC893 | ATCC | CRL-1902 | |
| Transfected construct (Homo sapiens) | pInducer21-SOX11 | this paper | SOX11 coding sequence (GENEID: 6664) was subcloned into pInducer21 (ORF-EG) plasmid Cat# 46948 (See Expression vectors in Materials and methods) | Lentiviral construct to transfect and express SOX11 sequence |
| Transfected construct (Homo sapiens) | pInducer13-SOX11 shRNA 174 | this paper | specific shRNA174 for SOX11 from pGIPZ plasmids from Horizon was subcloned into pInducer13 (miR-LUP) plasmid Cat# 46936 (See Expression vectors in Materials and methods) | Lentiviral construct to transfect and express the shRNA |
| Transfected construct (Homo sapiens) | pInducer13- shRNA NS | this paper | NS: non-silencing shRNA from pGIPZ plasmid from Horizon was subcloned into pInducer13 (miR-LUP) plasmid Cat# 46936 (See Expression vectors in Materials and methods) | Lentiviral construct to transfect and express the shRNA |
| Transfected construct (Homo sapiens) | siRNA: siGENOME Non-Targeting siRNA #1 | Horizon Discovery | D-001210-01-20 | |
| Transfected construct (Homo sapiens) | siRNA: siGENOME SMARTpool TUBB3 siRNA | Horizon Discovery | MQ-020099-03-0020 | |
| Transfected construct (Homo sapiens) | siRNA: siGENOME TUBB3 siRNA #3 | Horizon Discovery | MQ-020099-03-0020 | |
| Transfected construct (Homo sapiens) | siRNA: siGENOME TUBB3 siRNA #4 | Horizon Discovery | MQ-020099-03-0020 | |
| Transfected construct (Homo sapiens) | siRNA: siGENOME TUBB3 siRNA #5 | Horizon Discovery | MQ-020099-03-0020 | |
| Transfected construct (Homo sapiens) | siRNA: siGENOME TUBB3 siRNA #19 | Horizon Discovery | MQ-020099-03-0020 | |
| Transfected construct (Homo sapiens) | siRNA: siGENOME SMARTpool MEX3A siRNA | Horizon Discovery | MQ-022355-01-0020 | |
| Transfected construct (Homo sapiens) | siRNA: siGENOME MEX3A siRNA #1 | Horizon Discovery | MQ-022355-01-0020 | |
| Transfected construct (Homo sapiens) | siRNA: siGENOME MEX3A siRNA #2 | Horizon Discovery | MQ-022355-01-0020 | |
| Transfected construct (Homo sapiens) | siRNA: siGENOME MEX3A siRNA #3 | Horizon Discovery | MQ-022355-01-0020 | |
| Transfected construct (Homo sapiens) | siRNA: siGENOME MEX3A siRNA #4 | Horizon Discovery | MQ-022355-01-0020 | |
| Antibody | Anti-SOX11 (Rabbit monoclonal) | Abcam | Clone EPR8191(2) Cat# ab78078 | WB: (1:1000) |
| Antibody | Anti-SOX11 (Mouse monoclonal) | EBioscience | SOX11-C1 Cat# 50-9773-82 | IF: (1:200) |
| Antibody | Anti-TUBB3 (Mouse monoclonal) | Abcam | Clone 2G10 Cat# ab78078 | WB: (1:1000) IF: (1:100) |
| Antibody | Anti-MEX3A (Rabbit polyclonal) | Abcam | Cat# ab79046 | WB: (1:1000) IF: (1:100) |
| Antibody | Anti-CD24 (Mouse monoclonal) | Creative Biolabs | Cat# SWA11 | WB: (1:1000) |
| Antibody | Anti-VIMENTIN (Rabbit monoclonal) | Abcam | Cat# Ab92547 (EPR3776) | WB: (1:1000) IF: (1:400) |
| Antibody | Anti-RCOR2 (CoREST2) (Rabbit polyclonal) | Abcam | Cat# ab37113 | WB: (1:1000) |
| Antibody | Anti-N-CADHERIN (Rabbit monoclonal) | Cell Signaling | Cat# 13116 | WB: (1:1000) IF: (1:50) |
| Antibody | Anti-E-CADHERIN (Mouse monoclonal) | BD Bioscience | Clone 36 Cat# 610182 | WB: (1:1000) IF: (1:200) |
| Antibody | Anti-EPCAM (Rabbit monoclonal) | Cell Signaling | Clone D1B3 Cat# 2626 | WB: (1:1000) |
| Antibody | Anti-RRM2 (R2) (Mouse monoclonal) | Santa Cruz | Clone A-5 Cat# sc-398294 | WB: (1:1000) |
| Antibody | Anti-SURVIVIN (Rabbit monoclonal) | Cell Signaling | Clone 71G4B7 Cat# 2808 | WB: (1:1000) |
| Antibody | Anti-GAPDH (Rabbit monoclonal) | Cell Signaling | Clone D16H11 Cat# 5174 | WB: (1:5000) |
| Antibody | Anti-LAMINB1 (Rabbit polyclonal) | Abcam | Cat# ab16048 | WB: (1:1000) |
| Antibody | Anti-β-TUBULIN (Mouse monoclonal) | Sigma | Cat# T4026 | WB: (1:1000) |
| Antibody | Anti-β-ACTIN (Mouse monoclonal) | Cell Signaling | Clone 8H10D10 Cat# 3700 | WB: (1:1000) |
| Antibody | Anti-β-K5 (Rabbit polyclonal) | Biolegend | Cat# PRB-160P | IF: (1:200) |
| Antibody | Anti-β-K14 (Rabbit polyclonal) | Biolegend | Cat# PRB-155P | IF: (1:200) |
| Antibody | Anti-β-CD24 (Mouse monoclonal) | Invitrogen/ Thermofisher | Cat# SN3 | IF: (1:50) |
| Antibody | Anti-β-SMA (Rabbit monoclonal) | Invitrogen/ Thermofisher | EPR5368 Cat# Ab202509 | IF: (1:50) |
| Antibody | Anti-CD24–PE–Cy7 (Mouse monoclonal) | BD Bioscience | Cat# 561646 | Flow cytometry: (1:50) |
| Antibody | Anti-CD44–APC (Mouse monoclonal) | BD Bioscience | Cat# 559942 | Flow cytometry: (1:50) |
| Recombinant DNA reagent | pInducer21 (Plasmid) | Addgene | Cat# 46948 | |
| Recombinant DNA reagent | pInducer13 (Plasmid) | Addgene | Cat# 46936 | |
| Recombinant DNA reagent | Firefly Luciferase 2 lentiviral particles | Amsbio | Cat# LVP325 | |
| recombinant DNA reagent | pLV-mCherry (Plasmid) | Addgene | Cat# 36084 | |
| Sequence-based reagent | TaqMan probe SOX11 | Thermofisher Scientific | Hs00846583_s1 | |
| Sequence-based reagent | TaqMan probe TUBB3 | Thermofisher Scientific | Hs00801390_s1 | |
| Sequence-based reagent | TaqMan probe MEX3A | Thermofisher Scientific | Hs00863536_m1 | |
| Sequence-based reagent | TaqMan probe GPC2 | Thermofisher Scientific | Hs00415099_m1 | |
| Sequence-based reagent | TaqMan probe MAPK4 | Thermofisher Scientific | Hs00969401_m1 | |
| Sequence-based reagent | TaqMan probe LBH | Thermofisher Scientific | Hs00368853_m1 | |
| Sequence-based reagent | TaqMan probe SERPINA3 | Thermofisher Scientific | Hs00153674_m1 | |
| Sequence-based reagent | TaqMan probe OLFM2 | Thermofisher Scientific | Hs01017934_m1 | |
| Sequence-based reagent | TaqMan probe N-CADHERIN | Thermofisher Scientific | Hs00983056_m1 | |
| Sequence-based reagent | TaqMan probe ST6GALNAC5 | Thermofisher Scientific | Hs05018504_s1 | |
| Sequence-based reagent | TaqMan probe GAPDH | Thermofisher Scientific | Hs02786624_g1 | |
| Peptide, recombinant protein | Animal-Free Recombinant Human EGF | Peprotech | Cat# AF-100-15 | |
| Commercial assay or kit | RNAeasyPlus Micro kit | Qiagen | Cat# 74034 | |
| Commercial assay or kit | RNAClean and concentrator-5 | Zymo Research | Cat# R1013 | |
| Commercial assay or kit | Agilent RNA Pico kit | Agilent Technologies | Cat# 5067-1513 | |
| Commercial assay or kit | QuantiTect Reverse Transcription kit | Qiagen | Cat# 205311 | |
| Commercial assay or kit | TaqMan Gene Expression Master Mix | Thermofisher Scientific | Cat# 4369016 | |
| Commercial assay or kit | Aldefluor assay | StemCell Technologies | Cat# 01700 | |
| Commercial assay or kit | PKH26 Dye Solution | SIGMA | Cat# MINI26 | |
| Commercial assay or kit | Tumour dissociation kit, human | Miltenyi | Cat# 130-095-929 | |
| Chemical compound, drug | Doxycycline hyclate | Sigma | Cat# D9891 | |
| Chemical compound, drug | NeuroCult SM1 without vitamin A | StemCell Technologies | Cat # 05731 | |
| Chemical compound, drug | Methylcellulose | R&D Systems | Cat # HSC002 | |
| Chemical compound, drug | Cell titer-Glo | Promega | Cat # G7572 | |
| Chemical compound, drug | Collagen I, High Concentration, Rat Tail | Corning | Cat # 354249 | |
| Chemical compound, drug | XenoLight D-Luciferin Potassium Salt | Perkin Elmer | Cat # 122799 | |
| Chemical compound, drug | Lipofectamine 2000 | Invitrogen | 11668019 | |
| Chemical compound, drug | Lipofectamine RNAiMAX | Invitrogen | 13778075 | |
| Software, algorithm | PRISM | Graphpad | ||
| Software, algorithm | BD FACS Diva software | BD Bioscience | ||
| Software, algorithm | Image J | National Institutes of Health (NIH) | ||
| Other | EVOS FL microscope | Thermofisher Scientific | ||
| Other | Confocal microscope | Leica | Model TCS‐SP2 | |
| Other | Celigo cytometer | Nexcelom | ||
| Other | 96-well ultra-low-attachment plates | Corning | Cat # 7007 | |
| Other | Luminescence plate reader | Perkin Elmer | Victor X5 58 | |
| Other | FACS | BD Bioscience | FACSAriaIII | |
| Other | Flow cytometer | BD Bioscience | BD FACS LSRII | |
| Other | Stereotaxic frame | Stoelting | ||
| Other | IVIS Lumina imaging systems | Perkin Elmer | ||
| Other | gentleMACS Octo Dissociator with Heaters | Perkin Elmer | ||
| Other | DAPI | Sigma | IF: 1:5000 FC/FACS: 1:5000 |
Additional files
-
Supplementary file 1
RNA-seq results when SOX11 is induced in cells grown in 2D, 3D for 2 days or 3D for 5 days.
- https://cdn.elifesciences.org/articles/58374/elife-58374-supp1-v2.xlsm
-
Supplementary file 2
Gene ontology analysis of the genes differentially expressed in the 3 RNA-seq datasets when SOX11 is induced in cells grown in 2D, 3D for 2 days or 3D for 5 days.
- https://cdn.elifesciences.org/articles/58374/elife-58374-supp2-v2.xlsm
-
Supplementary file 3
Genes differentially expressed the 3 RNA-seq datasets when SOX11 is induced in cells grown in 2D, 3D for 2 days or 3D for 5 days.
- https://cdn.elifesciences.org/articles/58374/elife-58374-supp3-v2.xlsx
-
Supplementary file 4
Expression values of the genes from stem cell quiescence signature in the three datasets obtained in DCIS when SOX11 is induced in cells grown in 2D, 3D for 2 days or 3D for 5 days.
- https://cdn.elifesciences.org/articles/58374/elife-58374-supp4-v2.xlsx
-
Supplementary file 5
Co-occurrence and correlation of MEX3A RNA levels with cell cycle related genes in TCGA breast cancer dataset.
- https://cdn.elifesciences.org/articles/58374/elife-58374-supp5-v2.xlsm
-
Supplementary file 6
Cell lines and culture media.
- https://cdn.elifesciences.org/articles/58374/elife-58374-supp6-v2.xlsx
-
Supplementary file 7
qPCR probes.
- https://cdn.elifesciences.org/articles/58374/elife-58374-supp7-v2.xlsx
-
Supplementary file 8
Antibodies used for western blotting.
- https://cdn.elifesciences.org/articles/58374/elife-58374-supp8-v2.xlsx
-
Supplementary file 9
Antibodies used for IF and IHC.
- https://cdn.elifesciences.org/articles/58374/elife-58374-supp9-v2.xlsx
-
Transparent reporting form
- https://cdn.elifesciences.org/articles/58374/elife-58374-transrepform-v2.docx
Download links
A two-part list of links to download the article, or parts of the article, in various formats.
Downloads (link to download the article as PDF)
Open citations (links to open the citations from this article in various online reference manager services)
Cite this article (links to download the citations from this article in formats compatible with various reference manager tools)
SOX11 promotes epithelial/mesenchymal hybrid state and alters tropism of invasive breast cancer cells
eLife 9:e58374.
https://doi.org/10.7554/eLife.58374


