Intestinal microbiology shapes population health impacts of diet and lifestyle risk exposures in Torres Strait Islander communities
- Microbiome and Host Health Programme, South Australian Health and Medical Research Institute, Australia
- SAHMRI Microbiome Research Laboratory, School of Medicine, College of Medicine and Public Health, Flinders University, Australia
- Centre for Chronic Disease Prevention, Australian Institute of Tropical Health and Medicine, College of Public Health, Medical and Veterinary Sciences, James Cook University, Australia
- South Australian Health and Medical Research Institute, Australia
- School of Health Sciences, University of South Australia, Australia
- Department of Nutrition, Harvard T. H. Chan School of Public Health, United States
- Department of Nutrition and Dietetics, College of Nursing and Health Sciences, Flinders University, Australia
Figures
Figure 1 with 1 supplement
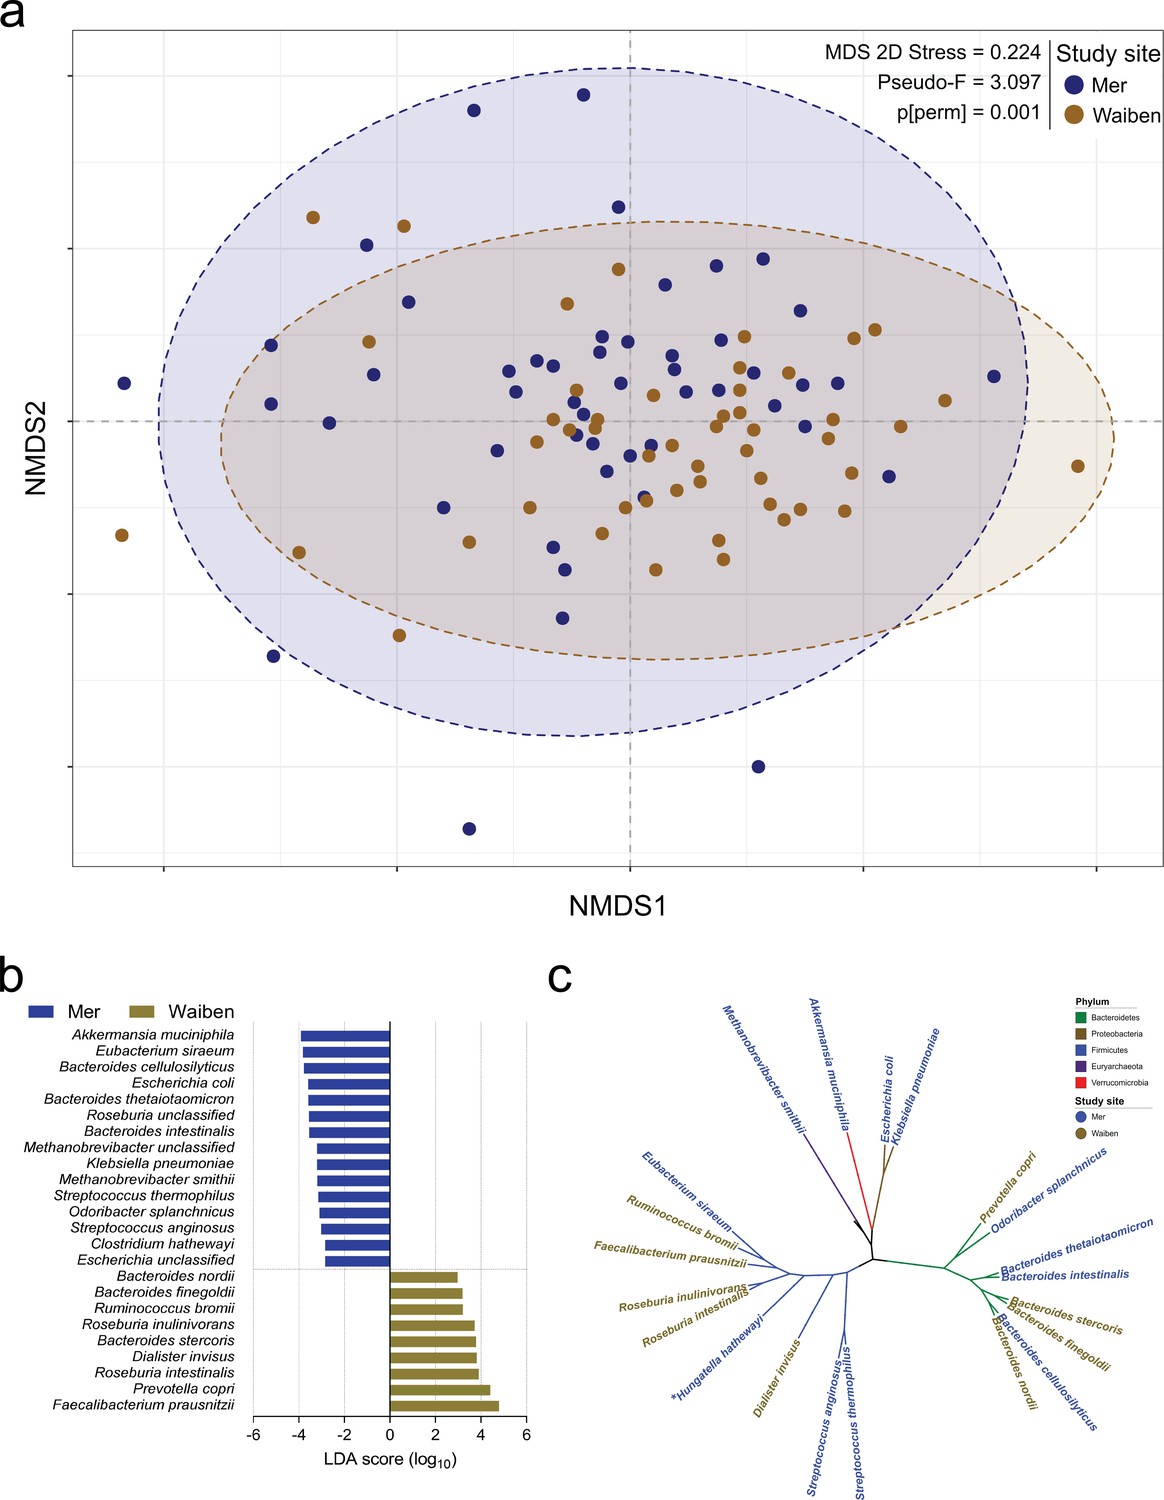
Island-specific differences in the species composition of the microbiome.
(a) Non-metric Multidimensional Scaling of the Bray Curtis similarity resemblance matrix, with ellipses at 95% confidence interval. n = 100 (b) Fold differences in LDA mean proportions of differentially abundant species in Waiben and Mer. Bars were sorted based on the sequential ranking of significance and separated by the two populations. Only taxa significant at a logarithmic LDA score ≥3 and a factorial Kruskal-Wallis test Alpha (α)≤0.05 are shown. n = 100 (c) A phylogenetic tree based on the NCBI taxonomy of differentially abundant species identified using LEfSe. All species designated ‘unclassified’ were not used in generating the tree. Branches/edges are colored according to phylum rank classification and terminal nodes/species labels are colored based on study site overrepresentation. n = 100.
Figure 1—figure supplement 1
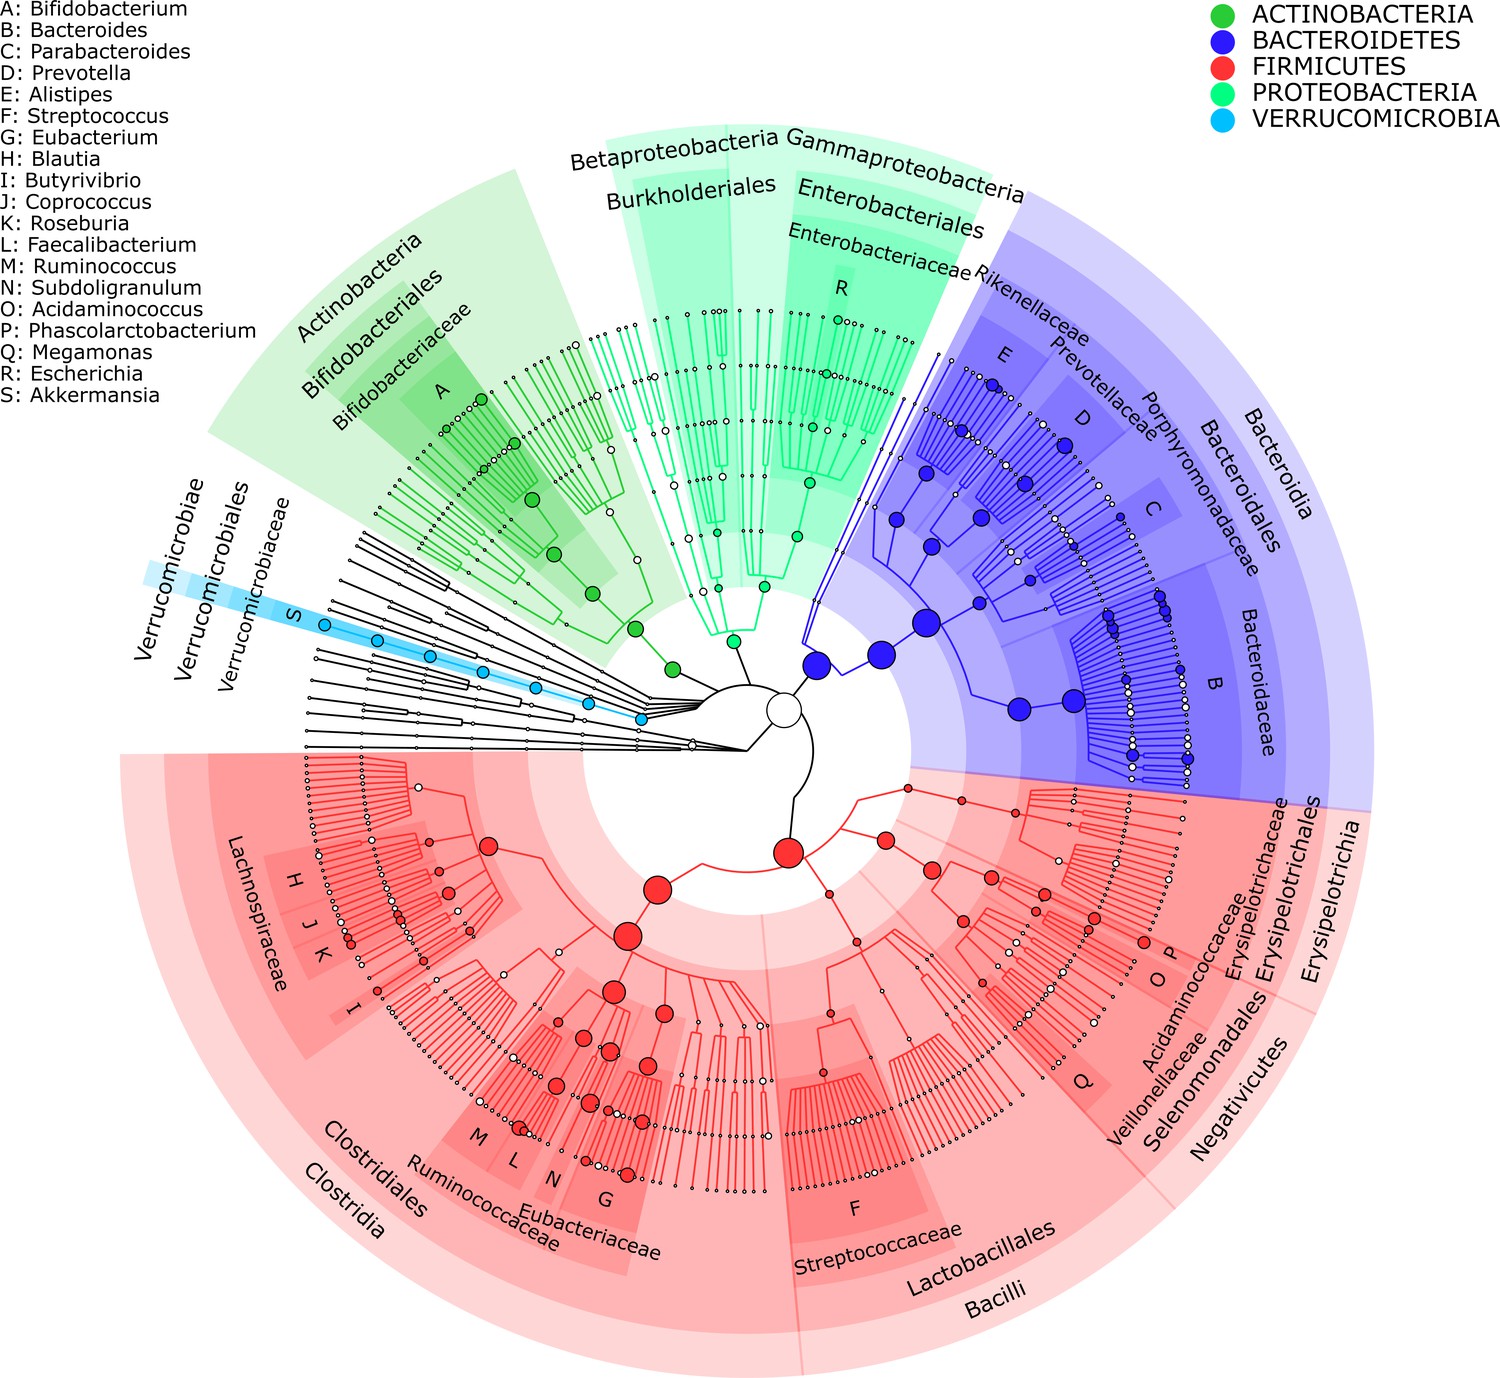
Taxonomic profile of the 100 Torres Strait Islander participants included in the study.
The size of the nodes represents the logarithmically scaled relative abundances of taxa. Only clades consisting of at least five markers, with nodes constituting at least 1% relative abundance, are highlighted. Annotations begin from the phylum level.
Figure 2 with 1 supplement
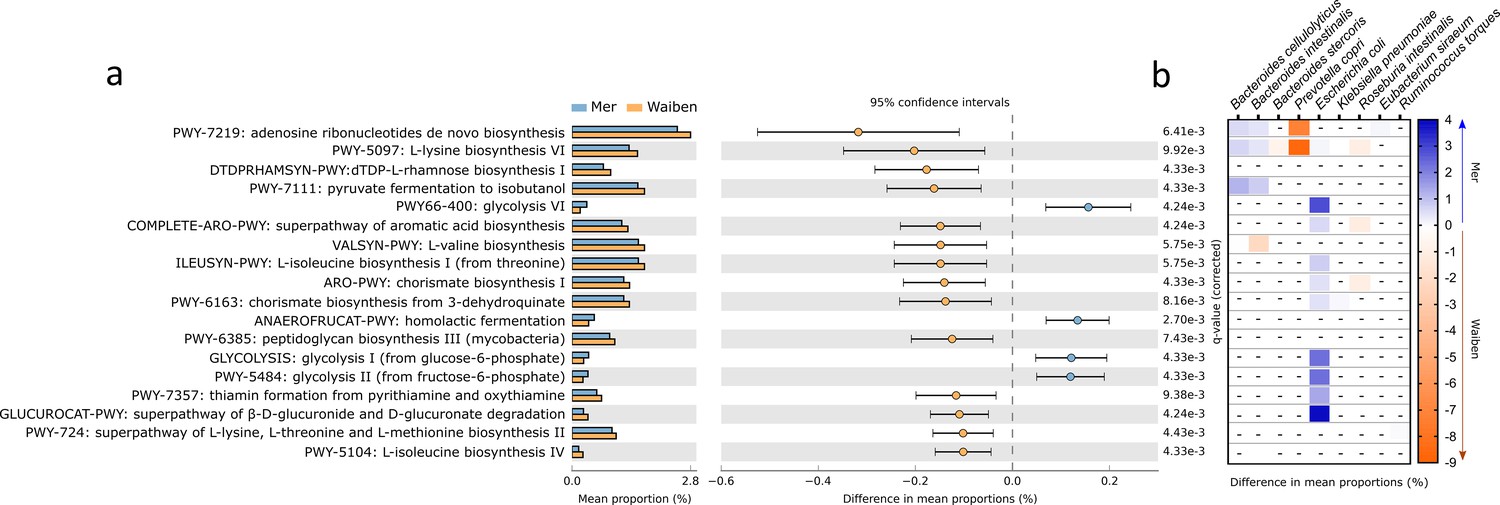
Functional pathways of the gut microbiota that significantly differed in abundance between Mer and Waiben communities.
(a) Pathway abundances at the whole community level were statistically compared between the groups, and the 95% confidence interval of the effect-size for each pathway was determined using a non-parametric bootstrap method. (b) The heatmap represents community pathway abundances stratified into significant contributions from bacterial species to between-group differences. The color scale depicts the magnitude of the difference of stratified pathway abundances between the groups. All statistical comparisons were performed using the Mann-Whitney test and corrected for multiple testing using the false discovery rate method. Statistical significance for all comparisons was determined at p<0.05. Heatmap boxes with an ‘-’ indicated non-significant stratified pathway abundance differences between the groups.
Figure 2—figure supplement 1

Heatmap representation of stratified contribution to whole-community pathway abundances.
Bacterial species that significantly contributed to the stratified pathway abundances between the groups are depicted (Mann-Whitney test with false discovery rate correction for multiple testing, p<0.05). The color scale represents the magnitude of contribution of each stratified pathway abundance to whole-community pathway abundance. Heatmap boxes with an ‘-’ indicated non-significant stratified pathway abundance differences between the groups.
Figure 3 with 1 supplement
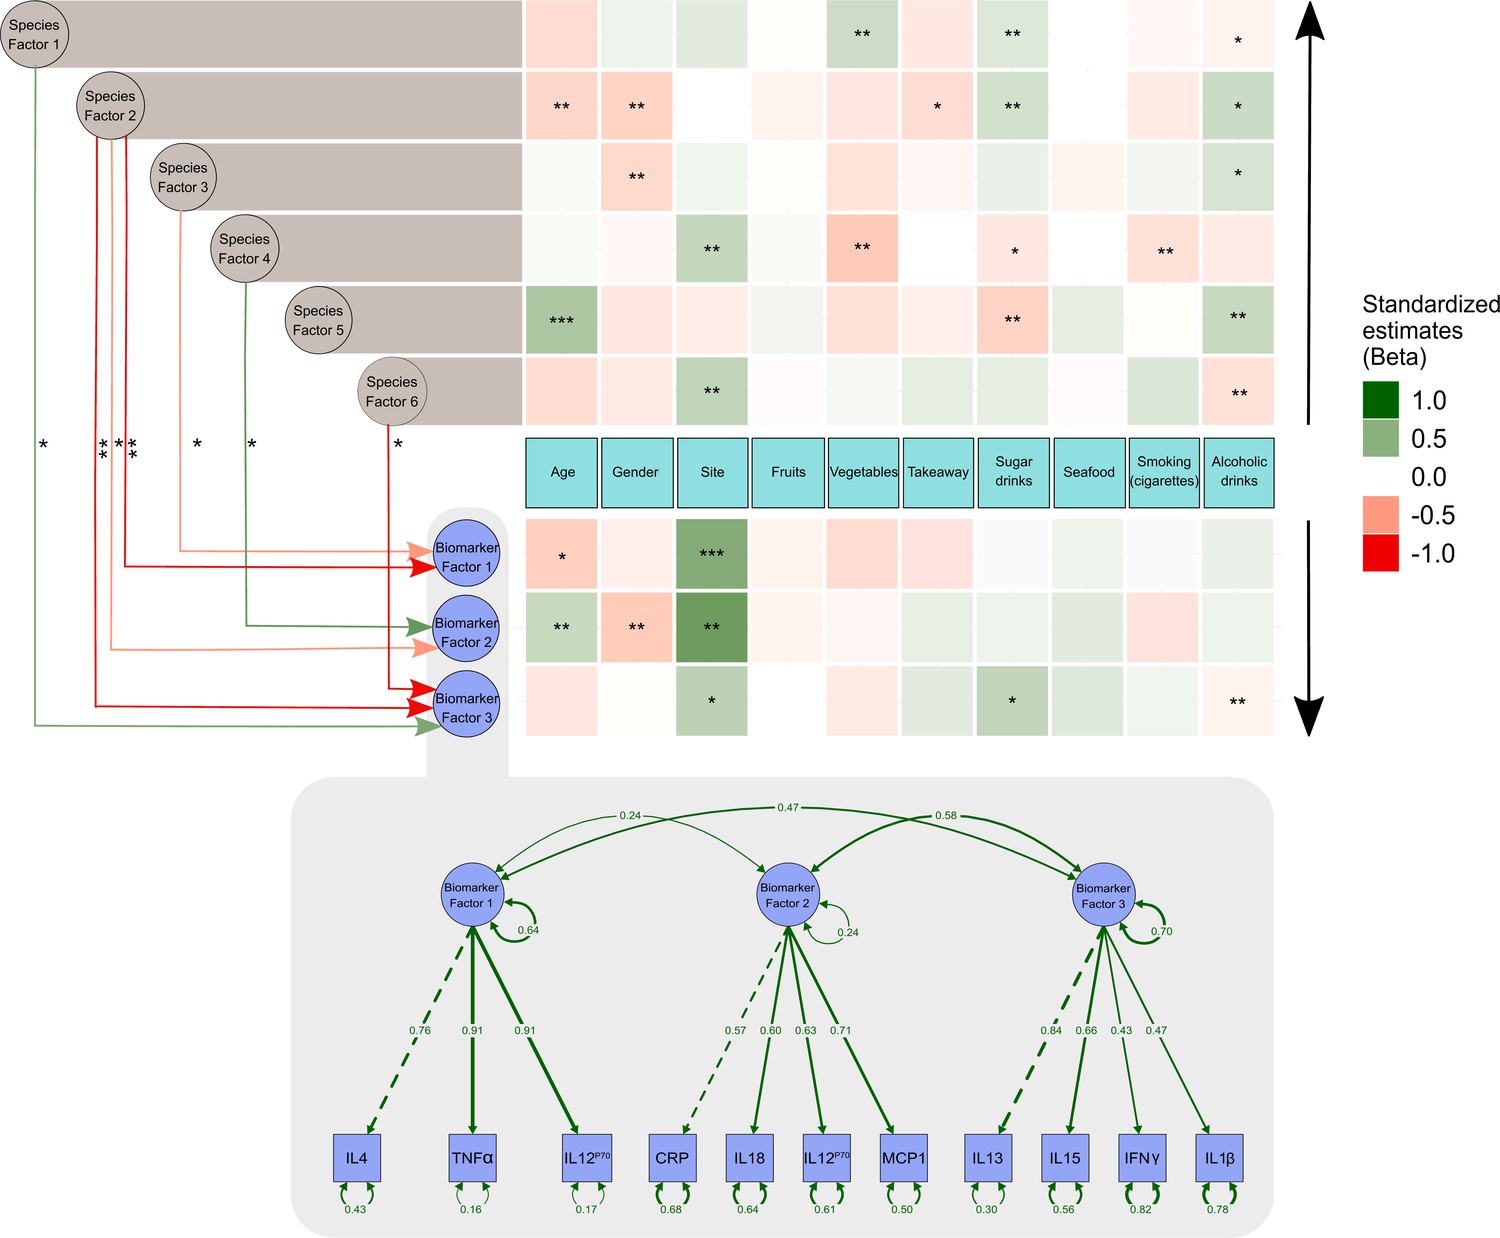
Structural equation model describing the pattern of interrelationships between exposures, microbiome, and host inflammation.
A modified path diagram of the final SEM supporting the mediatory effect of the gut microbiota on inflammation. The heatmaps represent direct associations of diet, behavior, and demographics with the gut microbiota and inflammatory biomarkers. Only significant paths of the effect of the gut microbiota on inflammation are shown. Standardized β coefficients are reported. Species Factors 1–6 denote latent variables of the community gut microbiota modeled as exploratory factor analysis (EFA) regression scores of the species relative abundance; Biomarker Factors 1–3 denote latent variables representing community inflammatory biomarkers as grouped using EFA. *p 0.1–0.05, **p 0.05–0.001, ***p<0.001. Edge colors : Green: positive association; red: negative association. Black arrows indicate the direction of association of diet, demographics, and behavioral exposures with both inflammatory biomarkers and the gut microbiota.
Figure 3—figure supplement 1
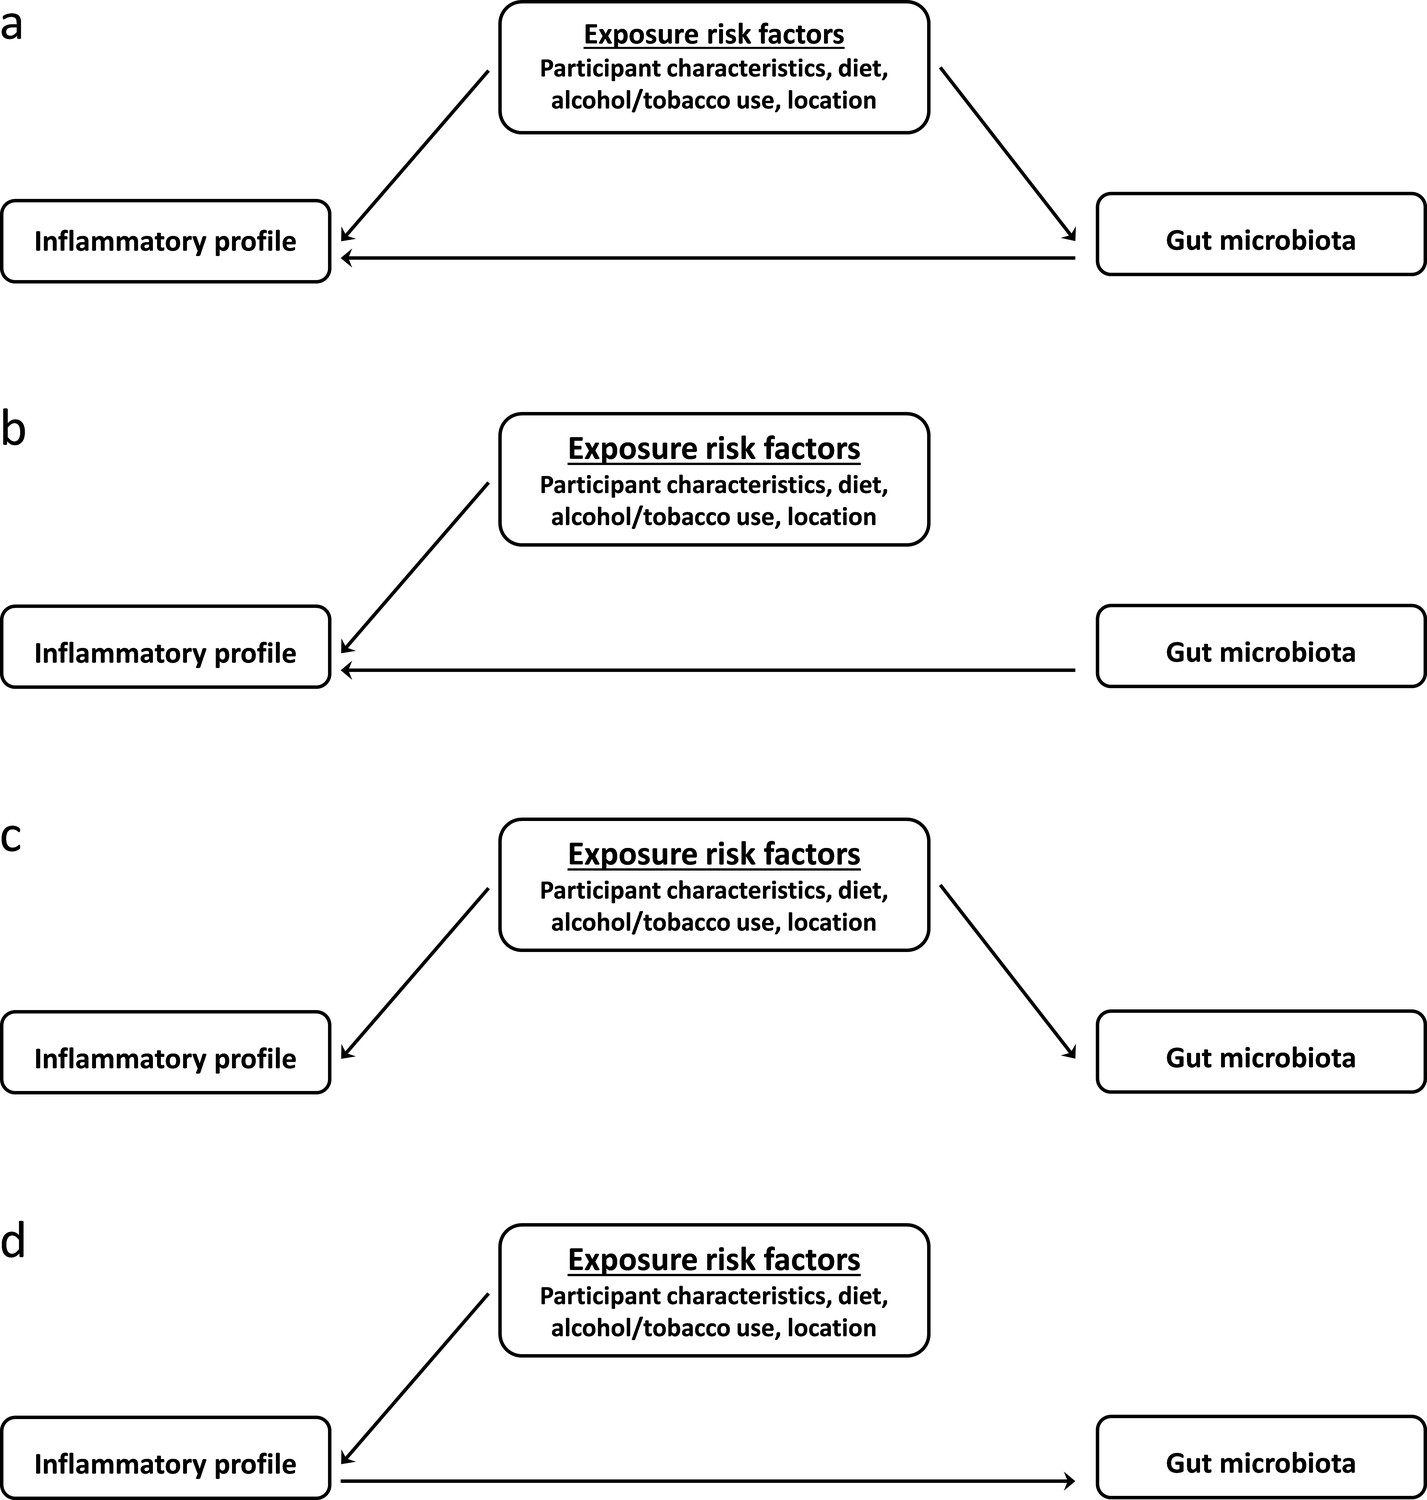
Theoretical models for assessing the structure of associations between the various human exposures, the gut microbiota, and the host’s inflammatory profile.
(a) Final framework (framework 1): The gut microbiome mediates, in part, the relationship between exposure risk factors and host inflammation. (b) Framework 2: The gut microbiome and exposure risk factors both, independently, impact host inflammation. (c) Framework 3: Exposure risk factors are associated with gut microbiome and inflammatory profile, but there is no relationship between microbiome and inflammation. (d) Framework 4: Exposure risk factors are associated with the inflammatory profile, and the inflammatory profile predicts the gut microbiome composition.
Figure 4 with 3 supplements
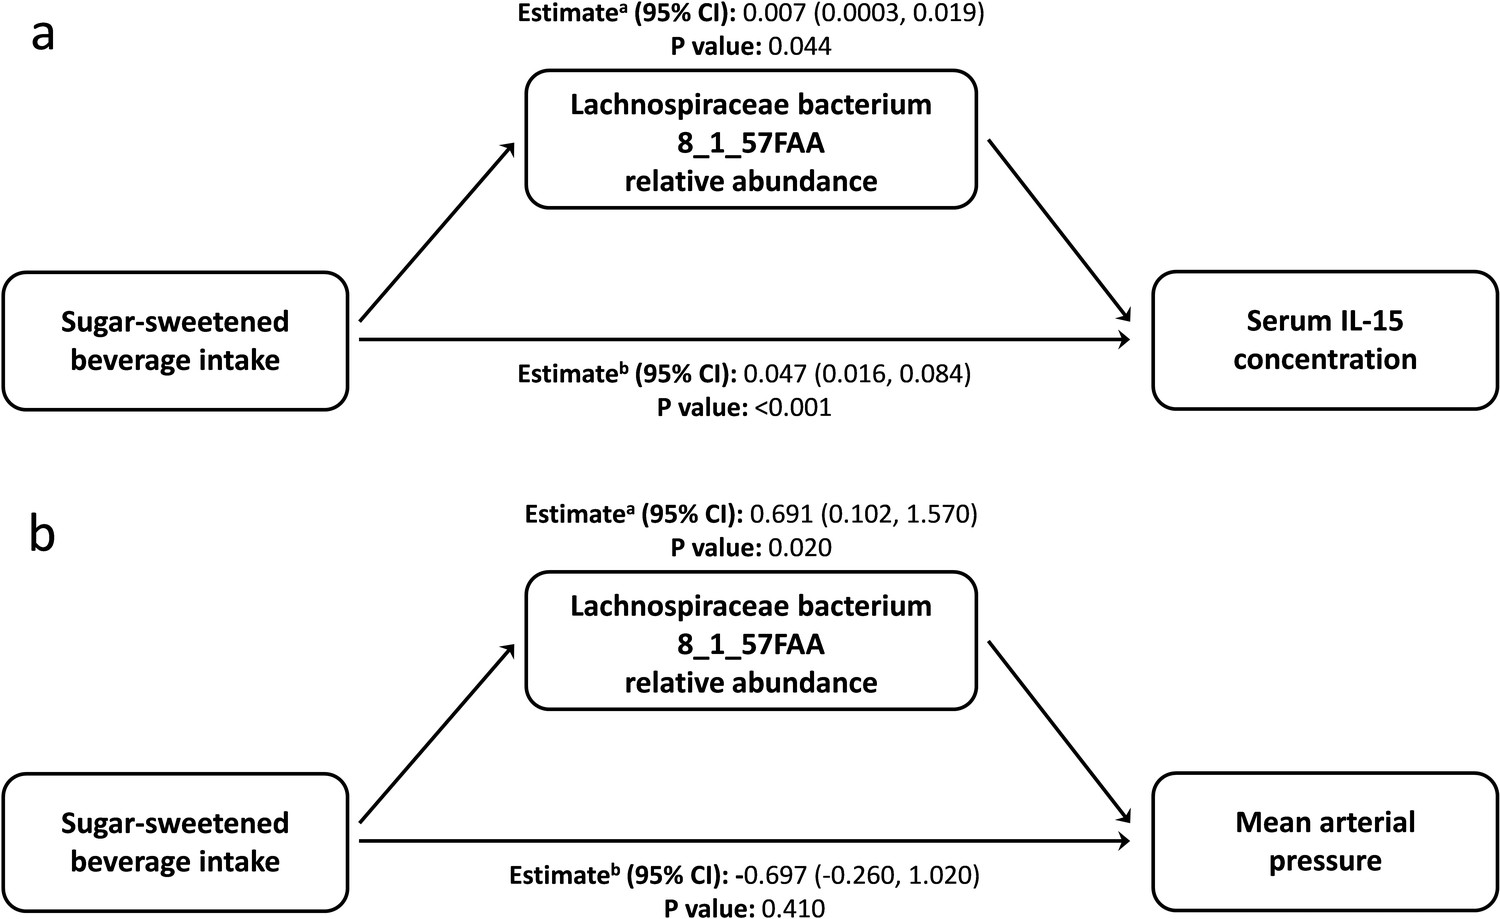
Lachnospiraceae bacterium 8_1_57FAA mediates the unadjusted relation of sugar-sweetened beverage intake with the serum concentration of Interleukin 15 and mean arterial pressure.
(a) Lachnospiraceae bacterium 8_1_57FAA mediates the unadjusted relation of sugar-sweetened beverage intake with the serum concentration of Interleukin 15. The total effect (95% confidence interval) for the model was 0.054 (0.023, 0.090), P-value: <0.001. n = 100 (b) Lachnospiraceae bacterium 8_1_57FAA mediates the unadjusted relation of sugar-sweetened beverage intake with mean arterial pressure. The total effect (95% confidence interval) for the model was −0.006 (–1.530, 1.420), P-value: 0.950. n = 100 a ACME (average causal mediation effects); b ADE (average direct effects).
Figure 4—figure supplement 1
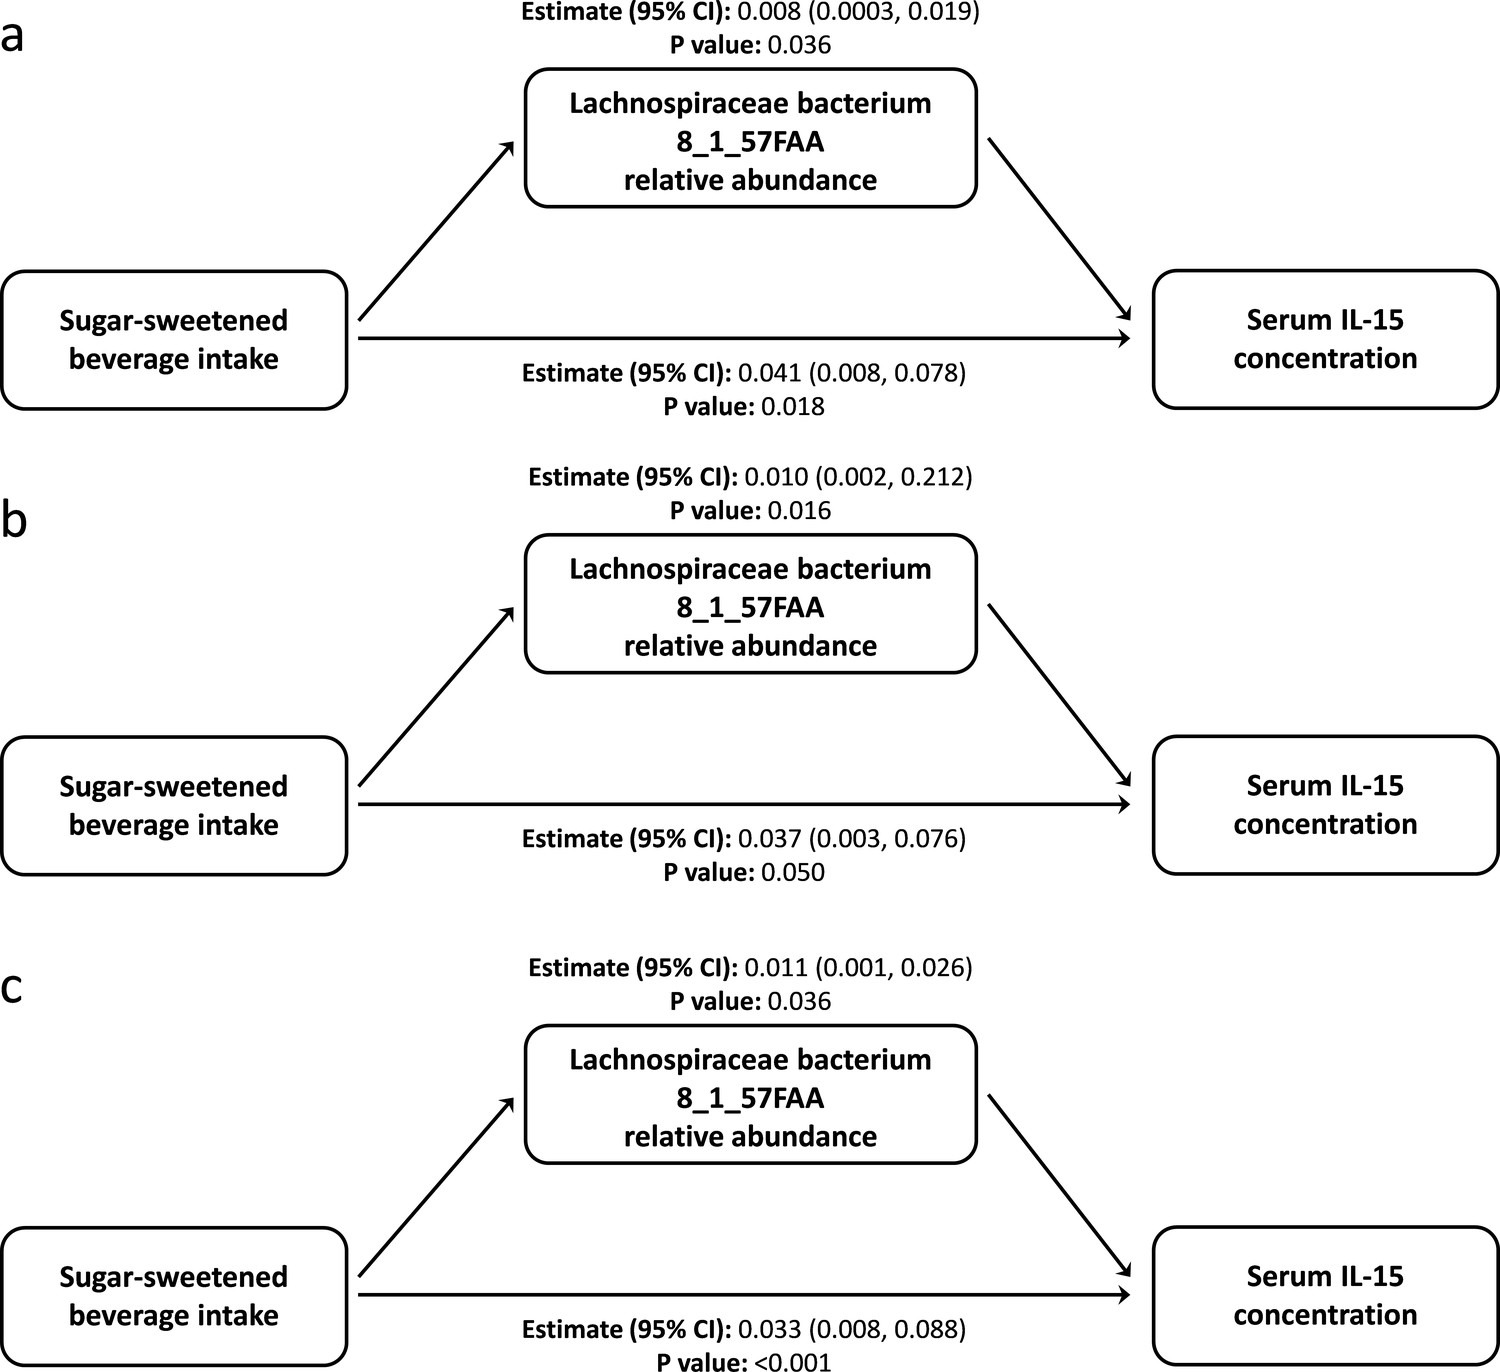
Role of Lachnospiraceae bacterium 8 1 57FAA in mediating the relation of sugar-sweetened beverage intake with the serum concentration of Interleukin 15.
(a) Age-adjusted model. The total effect (95% confidence interval) for the model was 0.049 (0.015, 0.086) P-value: 0.004. (b) Age- and island-adjusted model. The total effect (95% confidence interval) for the model was 0.046 (0.008, 0.085) P-value: 0.016. (c) Multivariate-adjusted model. Includes adjustment for age, island, body mass index, gender, cigarette use, and intakes of fruits, vegetables, takeaways, seafood, and alcohol. The total effect (95% confidence interval) for the model was 0.045 (–0.0003, 0.088) P-value: 0.084.
Figure 4—figure supplement 2
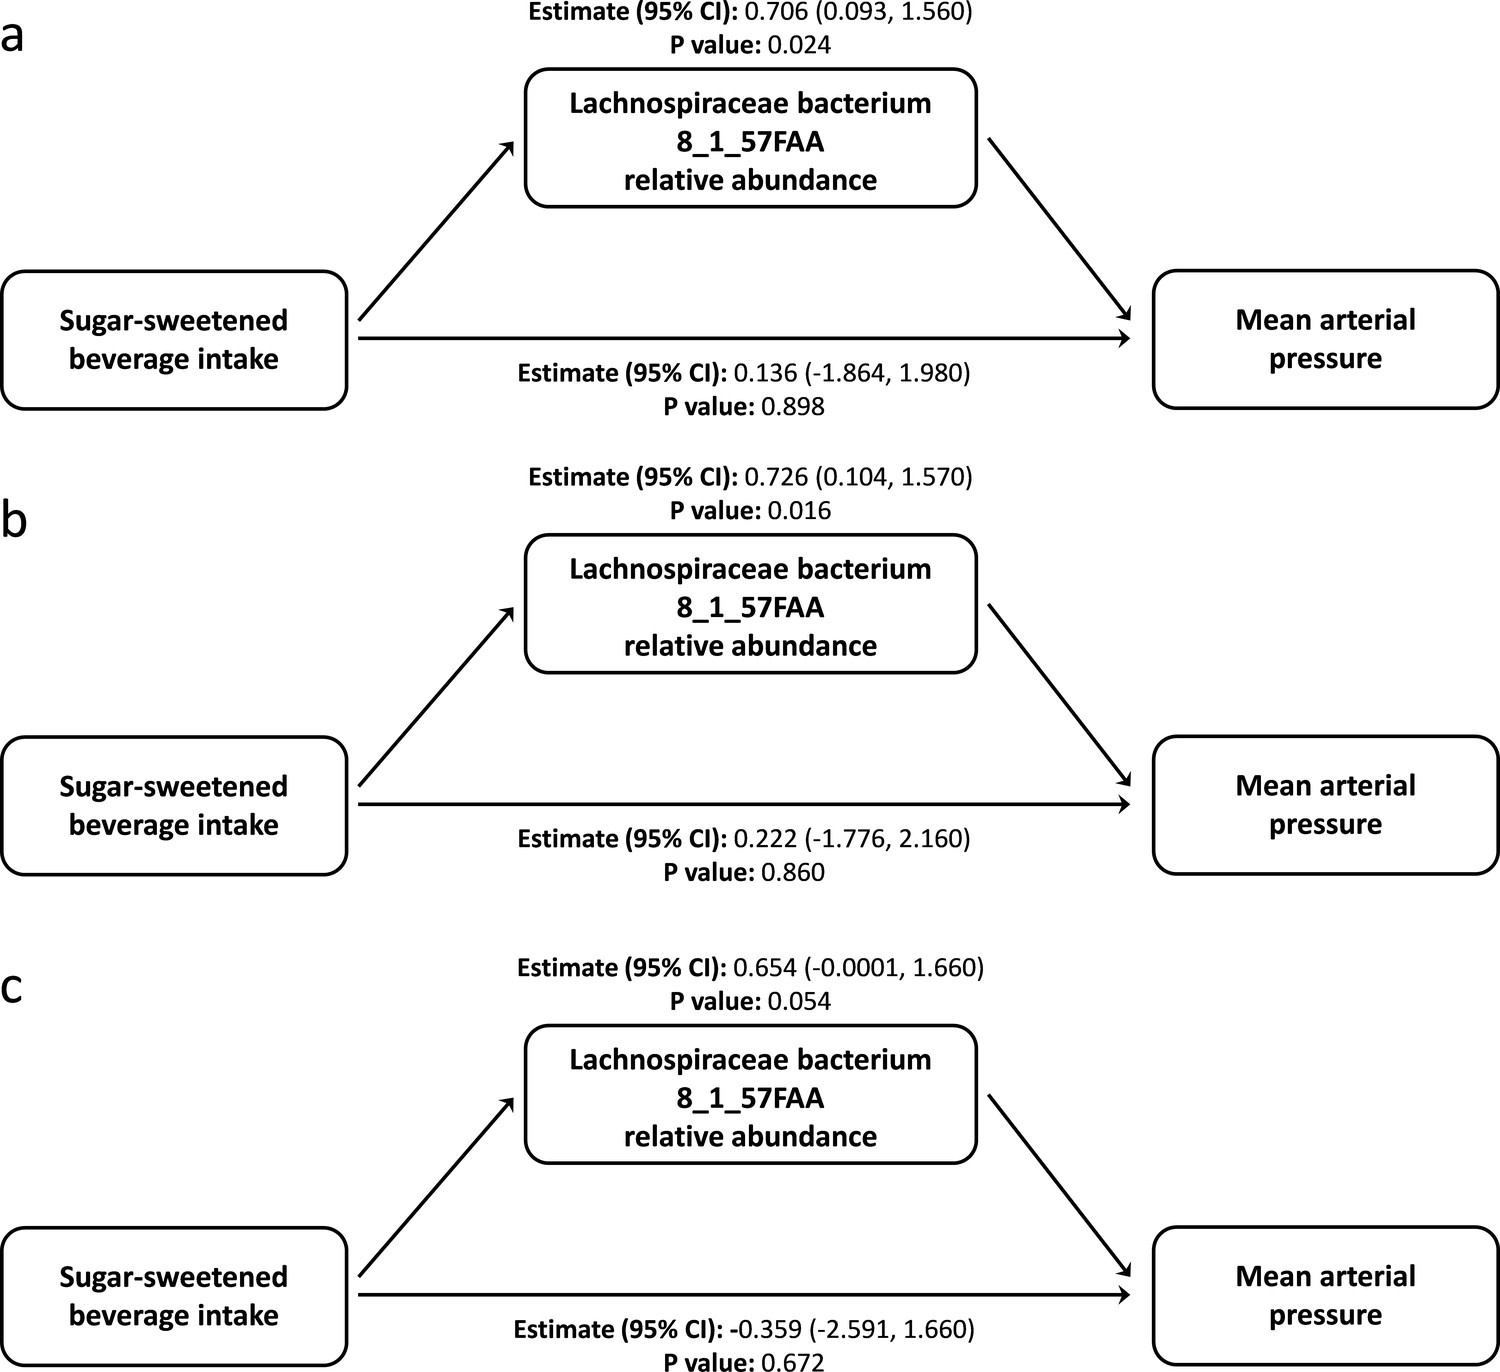
Role of Lachnospiraceae bacterium 8 1 57FAA in mediating the relation of sugar-sweetened beverage intake with the mean arterial pressure.
(a) Age-adjusted model. The total effect (95% confidence interval) for the model was 0.842 (−0.822, 2.520) P-value: 0.300. (b) Age-and island-adjusted model. The total effect (95% confidence interval) for the model was 0.948 (−0.694, 2.670) P-value: 0.246. (c) Multivariate-adjusted model. Includes adjustment for age, island, body mass index, gender, cigarette use, and intakes of fruits, vegetables, takeaways, seafood, and alcohol. The total effect (95% confidence interval) for the model was 0.295 (−1.730, 2.170) P-value: 0.808.
Figure 4—figure supplement 3

16S rRNA-based phylogeny of Lachnospiraceae.
Lachnospiraceae family-restricted blast search (blast parameters e-value = 1 e-10, Max targets = 250) using Lachnospiraceae bacterium 8_1_57FAA 16 rRNA as a query against the NCBI non-redundant genes database was performed. The resulting top 250 best blast hits were used to construct a Grishin distance tree using the fast-minimum evolution model in NCBI BLAST. Terminal node labels are Taxonomic Name (Sequence ID).
Figure 5
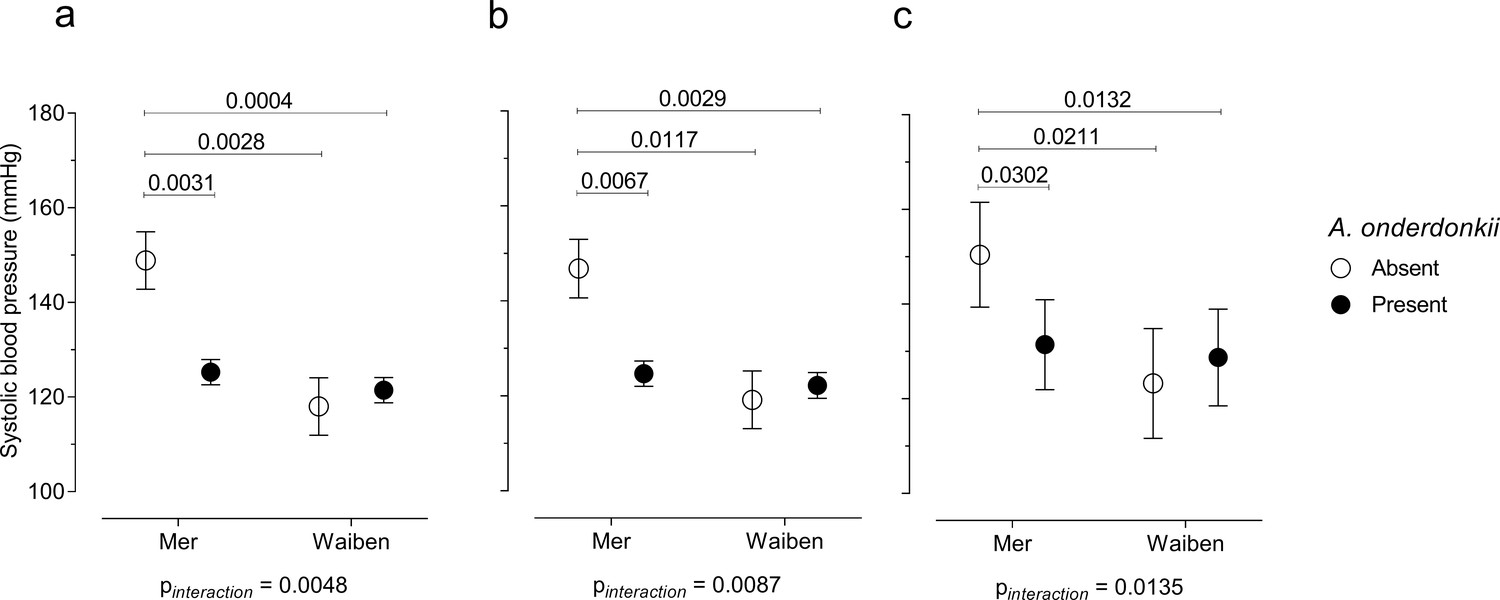
Systolic blood pressure in the context of an interaction between Alistipes onderdonkii and island systolic blood pressure.
(a) Unadjusted model, (b) age-adjusted model, and (c) multivariate-adjusted model which includes the adjustment for age, body mass index, gender, smoking status, and intakes of fruits, vegetables, takeaways, sugar-sweetened beverages, seafood, and alcohol. Only significant P values (p<0.05) are shown n = 100.
Tables
Table 1
Characteristics of Waiben and Mer residents.
| Characteristic | Waiben (n = 50) | Mer (n = 50) | Unadjusted P-value * | Age-adjusted P-value † | |
|---|---|---|---|---|---|
| Age [years] | 40 (31, 54) | 58 (36, 65) | 0.003 | NA | |
| Exposure chronic disease risk factors | |||||
| Sugar-sweetened beverage consumption [serves/day] | 1 (0, 1) | 1 (0, 1) | 0.576 | 0.562 | |
| Fruit consumption [serves/day] | 2 (1, 3) | 2 (1, 2) | 0.680 | 0.682 | |
| Vegetable consumption [serves/day] | 3.5 (2.0, 5.0) | 3.5 (2.0, 4.0) | 0.609 | 0.606 | |
| Takeaway consumption [serves/week] | 1 (0, 2) | 0 (0, 1) | 0.011 | 0.009 | |
| Seafood consumption [serves/week] | 2 (1, 3) | 2 (1, 5) | 0.020 | 0.021 | |
| Alcoholic beverage consumption [serves/day] | 0.33 (0.00, 0.99) | 0.20 (0.00, 1.88) | 0.597 | 0.592 | |
| Smoking [cigarettes/day] | 0.00 (0.00, 5.25) | 0.00 (0.00, 2.25) | 0.804 | 0.800 | |
| Physical activity [min/week] | 180 (90, 236) | 210 (150, 360) | 0.925 | 0.925 | |
| Biological chronic disease risk factors | |||||
| Glucose [mmol/L] ‡ | 5.2 (4.7, 5.7) | 5.6 (4.8, 6.5) | 0.056 | 0.050 | |
| HbA1c [mmol/mol] ‡ | 38 (34, 42) | 43 (36.5, 45) | 0.127 | 0.109 | |
| Systolic blood pressure [mmHg] | 121 (112.5, 129.5) | 129 (115.3, 139.5) | 0.028 | 0.025 | |
| Mean arterial pressure [mmHg] | 87.8 (72.0–113.7) | 95.8 (61.0–126.3) | 0.034 | 0.033 | |
| Body mass index [kg/m2] | 31.1 (25.8, 37.9) | 32.1 (25.5, 36.5) | 0.893 | 0.893 | |
| Waist circumference [cm] | 105 (92, 116) | 116 (101, 125) | 0.019 | 0.016 | |
| Waist to hip ratio | 0.62 (0.53, 0.69) | 0.68 (0.61, 0.75) | 0.035 | 0.027 | |
| Inflammatory biomarkers ‡ | |||||
| Interferon γ [pg/mL] | 0.69 (0.61, 0.83) | 0.96 (0.67, 1.18) | <0.001 | <0.001 | |
| C-Reactive protein [mg/L] | 0.36 (0.23, 0.51) | 1.36 (0.63, 1.76) | <0.001 | <0.001 | |
| Interleukin-1β [pg/mL] | 0.39 (0.19, 0.61) | 0.37 (0.23, 0.5) | 0.534 | 0.536 | |
| Interleukin-12p40 [pg/mL] | 1.98 (1.26, 3.47) | 6.32 (3.31, 11.37) | <0.001 | <0.001 | |
| Interleukin-12p70 [pg/mL] | 0.46 (0.41, 0.51) | 0.82 (0.62, 1.07) | <0.001 | <0.001 | |
| Interleukin-13 [pg/mL] | 1.72 (1.48, 1.94) | 1.82 (1.82, 2.07) | 0.008 | 0.008 | |
| Interleukin-15 [pg/mL] | 7.37 (4.36, 10.7) | 8.76 (6.89, 12.23) | 0.281 | 0.272 | |
| Interleukin-18 [pg/mL] | 11.34 (4.57, 18.17) | 21.38 (13.26, 37.51) | <0.001 | <0.001 | |
| Interleukin-4 [pg/mL] | 4.97 (4.61, 6.09) | 6.80 (5.95, 9.23) | <0.001 | <0.001 | |
| MCP-1/CCL2 [pg/mL] | 52.77 (32.89, 88.41) | 111.60 (67.65, 149.9) | <0.001 | <0.001 | |
| Tumor necrosis factor α [pg/mL] | 0.17 (0.11, 0.30) | 0.47 (0.40, 0.68) | <0.001 | <0.001 | |
| Species-alpha diversity | |||||
| Count [Chao1 species richness] | 68.5 (64.0, 72.3) | 68.0 (57.8, 73.3) | 0.805 | 0.805 | |
| Distribution [Shannon evenness index] | 0.68 (0.61, 0.71) | 0.71 (0.66, 0.75) | 0.027 | 0.026 | |
| Variety [Shannon diversity index] | 2.83 (2.50, 2.98) | 2.94 (2.73, 3.20) | 0.061 | 0.060 | |
-
Results are median (Q1, Q3). * ANOVA between Mer and Waiben. † ANCOVA between Mer and Waiben adjusted for age. ‡ analysis performed on log-transformed data. Abbreviations: MCP: Monocyte Chemoattractant Protein; MIP: Macrophage Inflammatory Protein.
Author response table 1
| Waiben | Mer | Unadjusted p value | |
|---|---|---|---|
| BMI | |||
| kg/m2 | 31.1 (25.8, 37.9) | 32.1 (25.5, 36.5) | 0.893 |
| Underweight (<18.5) | 1 (2%) | 1 (2%) | >0.99 |
| Normal (18.5-24.9) | 11 (22%) | 11 (22%) | >0.99 |
| Overweight (25-29.9) | 9 (18%) | 9 (18%) | >0.99 |
| Obese (≥30) | 29 (58%) | 29 (58%) | >0.99 |
| Type 2 diabetes | |||
| Yes | 15 (30%) | 24 (48%) | 0.10 |
Additional files
-
Supplementary file 1
Intestinal microbiology shapes population health impacts of diet and lifestyle risk exposures in Torres Strait Islander communities: Supplementary files.
- https://cdn.elifesciences.org/articles/58407/elife-58407-supp1-v1.docx
-
Transparent reporting form
- https://cdn.elifesciences.org/articles/58407/elife-58407-transrepform-v1.docx
-
Reporting standard 1
STROBE checklist.
- https://cdn.elifesciences.org/articles/58407/elife-58407-repstand1-v1.docx
Download links
A two-part list of links to download the article, or parts of the article, in various formats.
Downloads (link to download the article as PDF)
Open citations (links to open the citations from this article in various online reference manager services)
Cite this article (links to download the citations from this article in formats compatible with various reference manager tools)
Intestinal microbiology shapes population health impacts of diet and lifestyle risk exposures in Torres Strait Islander communities
eLife 9:e58407.
https://doi.org/10.7554/eLife.58407


