DNA methylation meta-analysis reveals cellular alterations in psychosis and markers of treatment-resistant schizophrenia
- University of Exeter Medical School, University of Exeter, Barrack Road, United Kingdom
- Division of Psychiatry, University College London, United Kingdom
- Department of Psychiatry, Brain Center Rudolf Magnus, University Medical Center Utrecht, Heidelberglaan, Netherlands
- Department of Psychiatry and Neuropsychiatric Genetics Research Group, Trinity Translational Medicine Institute, Trinity College Dublin, St. James Hospital, Ireland
- Social, Genetic and Developmental Psychiatry Centre, Institute of Psychiatry, Psychology and Neuroscience (IoPPN), King’s College London, United Kingdom
- NIHR BioResource Centre Maudsley, South London and Maudsley NHS Foundation Trust (SLaM), King’s College London, United Kingdom
- South London and Maudsley NHS Mental Health Foundation Trust, United Kingdom
- National Institute for Health Research (NIHR), Mental Health Biomedical Research Centre, South London and Maudsley NHS Foundation Trust and King's College London, United Kingdom
- APC Microbiome Ireland, University College Cork, Ireland
- Centre for Neuroimaging and Cognitive Genomics (NICOG), School of Psychology and Discipline of Biochemistry, National University of Ireland Galway, Ireland
- Psychosis Studies, Institute of Psychiatry, Psychology and Neuroscience (IoPPN), King’s College London, United Kingdom
- National Psychosis Service, South London and Maudsley NHS Foundation Trust, United Kingdom
- Department of Psychiatry and Neuropsychiatric Genetics Research Group, Trinity Translational Medicine Institute, Trinity College Dublin, Ireland
- Department of Psychiatry, Medical Sciences Division, University of Oxford, United Kingdom
- Department of Psychiatry, University Medical Center Utrecht, Netherlands
- Department of Medical Epidemiology and Biostatistics, Karolinska Institutet, Sweden
- Department of Medical Epidemiology and Biostatistics Sweden, Karolinska Institutet, Sweden
- Department of Clinical Neuroscience, Center for Psychiatry Research, Karolinska Institutet and Stockholm Health Care Services, Sweden
- Department of Psychiatry, Brain Center Rudolf Magnus, University Medical Center Utrecht, Netherlands
- Department of Psychiatry, Icahn School of Medicine at Mount Sinai, United States
- Institute for Molecular Medicine FIMM, University of Helsinki, Finland
- Department of Public Health, University of Helsinki, Finland
- Faculty of Health, Medicine and Life Sciences, Maastricht University, Netherlands
- College of Pharmacy, University of Manitoba, Canada
- Centre for Neuroimaging and Cognitive Genomics (NICOG), School of Medicine, National University of Ireland Galway, Ireland
- Department of Psychiatry, Royal College of Surgeons in Ireland, Ireland
- Division of Biomedical Sciences, Institute of Health Research and Innovation, University of the Highlands and Islands, United Kingdom
- Department of Psychiatry and Psychotherapy, Jena University Hospital, Germany
- Department of Psychiatry and Psychotherapy, Philipps University Marburg/ Marburg University Hospital UKGM, Germany
- MRC Centre for Neuropsychiatric Genetics and Genomics, School of Medicine, Cardiff University, United Kingdom
- Department of Psychiatry and Neuropsychology, Faculty of Health, Medicine and Life Sciences, Maastricht University, Netherlands
- The Institute of Medical Sciences, Univeristy of Aberdeen, United Kingdom
- Department of Public Health Solutions, Mental Health Unit, National Institute for Health and Welfare, Finland
- Department of Psychology and National Magnetic Resonance Research Center (UMRAM), Aysel Sabuncu Brain Research Centre (ASBAM), Bilkent University, Turkey
- Molecular and Cellular Therapeutics, Royal College of Surgeons in Ireland, Ireland
- Departments of Genetics and Psychiatry, University of North Carolina at Chapel Hill, United States
- Neuroscience Genetics, Eli Lilly and Company, United Kingdom
- Department of Psychosis Studies, Institute of Psychiatry, King’s College London, United Kingdom
- School of Life Sciences, University of Essex, United Kingdom
Figures
Figure 1 with 6 supplements
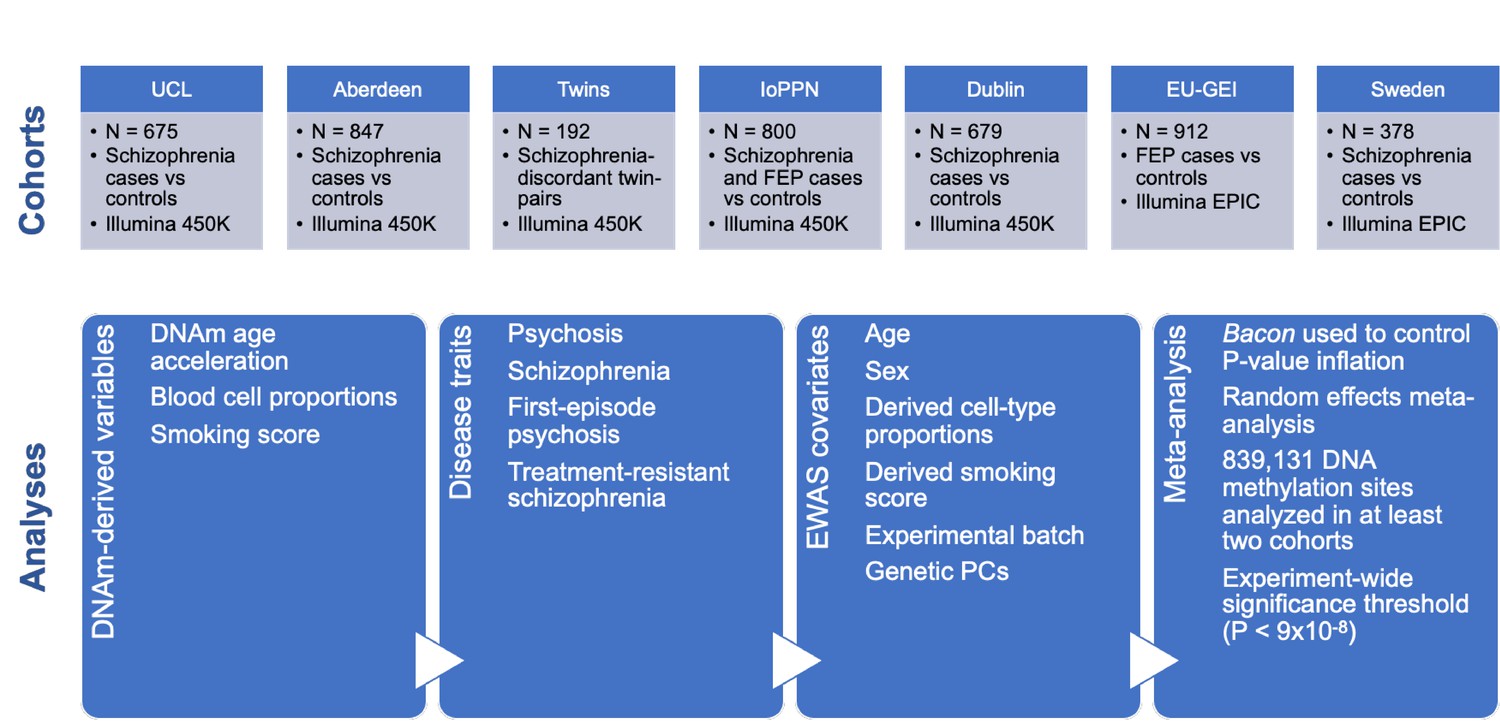
Overview of the sample cohorts and analytical approaches used in this study of altered DNA methylation in psychosis and schizophrenia.
Figure 1—figure supplement 1
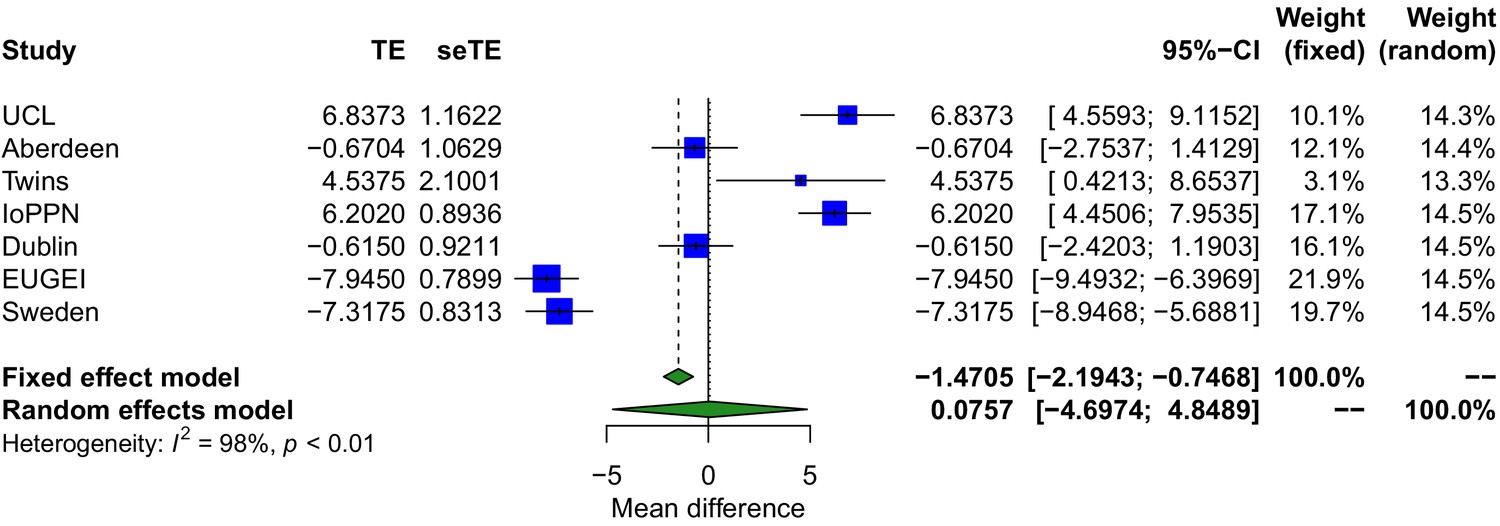
Forest plot showing the difference in mean age between psychosis cases and controls across each cohort.
TE: treatment effect (i.e., the mean difference between cases and controls); seTE: standard error of the treatment effect.
Figure 1—figure supplement 2

Scatterplot of the relationship between the first two genetic principal components merged with HapMap phase 3 data for individual cohorts.
With the exception of the IoPPN and EUGEI cohorts, there is little ethnic heterogeneity in each of the cohorts with samples being predominantly of Caucasian origin.
Figure 1—figure supplement 3
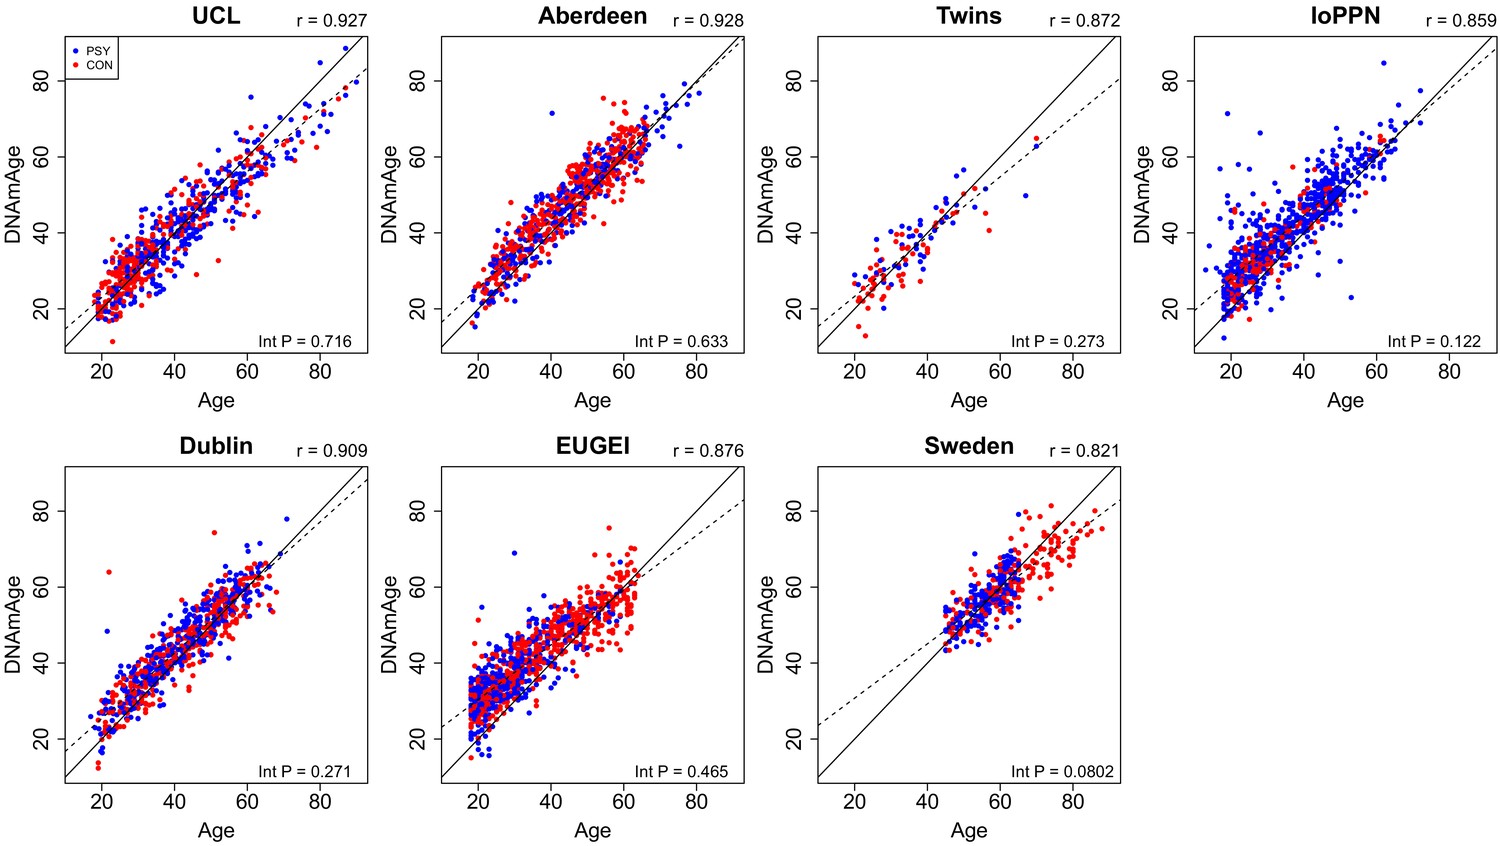
Scatterplots of DNAmAge derived from the DNA methylation data against actual chronological age for each of the cohorts.
DNAmAge was calculated using the algorithm described by Horvath, 2013. Each point represents an individual and is colored by psychosis status (blue = psychosis, red = control). The solid diagonal line depicts x=y, that is, where the estimated and actual values are the same. The dashed diagonal line depicts the line of best fit. Presented at the top of the graph is the Pearson’s correlation coefficient (r) between the estimated and actual age across all samples in that cohort. Also shown in the bottom right-hand corner of each panel is an interaction p-value from a test for different correlations between DNAmAge and actual age between psychosis cases and controls.
Figure 1—figure supplement 4
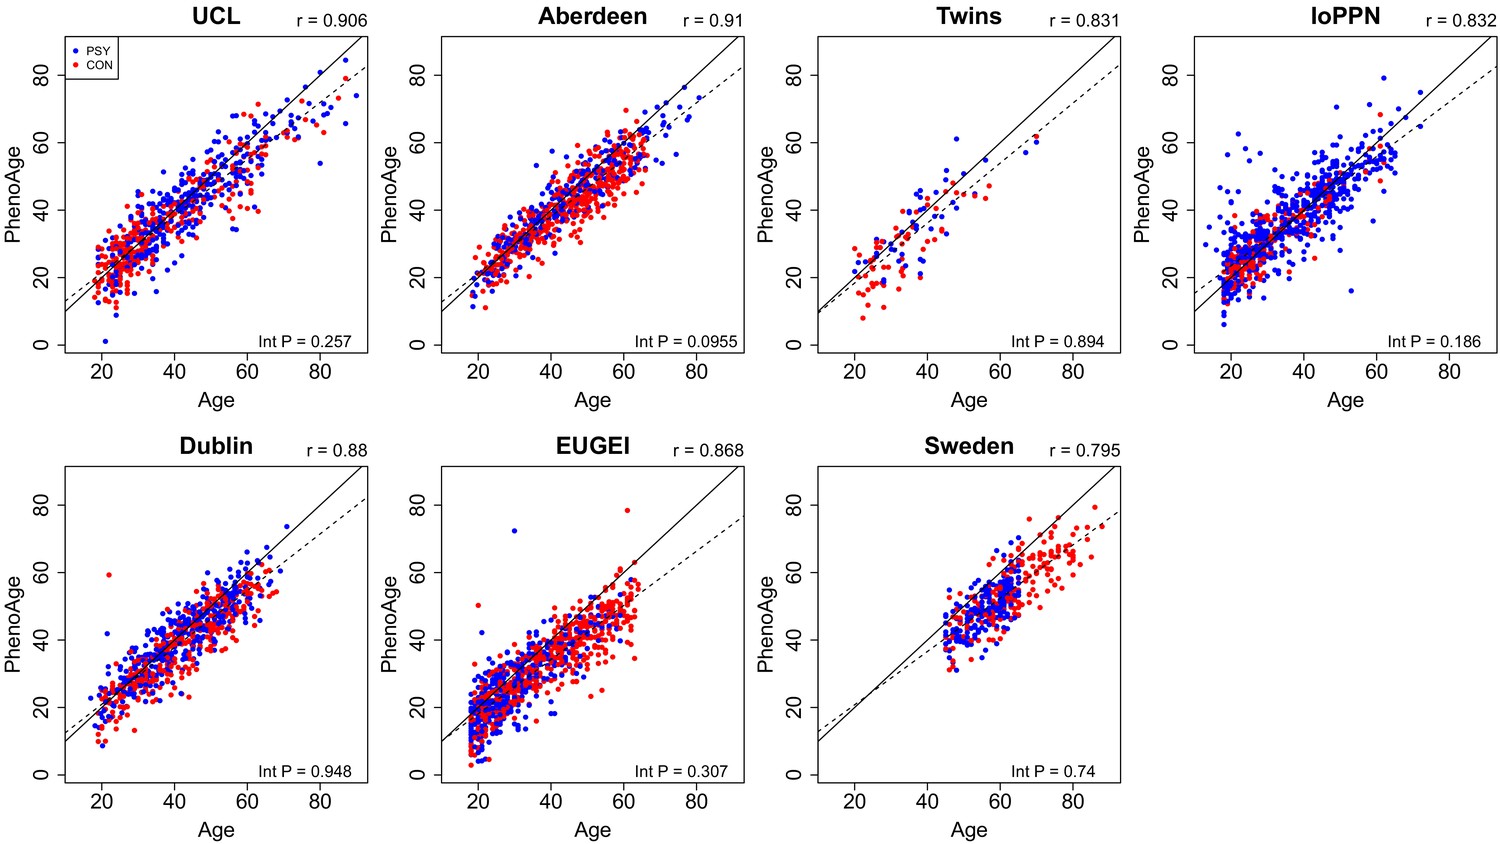
Scatterplots of PhenoAge derived from DNA methylation data against actual chronological age for each of the cohorts.
PhenoAge was calculated using the algorithm described by Levine et al., 2018. Each point represents an individual and is colored by psychosis status (blue = psychosis, red = control). The solid diagonal line depicts x=y, that is, where the estimated and actual values are the same. The dashed diagonal line depicts the line of best fit. Presented at the top of the graph is the Pearson’s correlation coefficient (r) between the estimated and actual age across all samples in that cohort. Also shown in the bottom right-hand corner of each panel is an interaction p-value from a test for different correlations between PhenoAge and actual age between psychosis cases and controls.
Figure 1—figure supplement 5

Scatterplots of DNAmAge derived from the DNA methylation data against actual chronological age for each of the cohorts.
DNAmAge was calculated using the algorithm described by Horvath, 2013. Each point represents an individual and is colored by medication status (yellow = schizophrenia cases not prescribed clozapine, green = treatment-resistant schizophrenia cases prescribed clozapine). The solid diagonal line depicts x=y, that is, where the estimated and actual values are the same. The dashed diagonal line depicts the line of best fit. Presented at the top of the graph is the Pearson’s correlation coefficient (r) between the estimated and actual age across all samples in that cohort. Also shown in the bottom right-hand corner of each panel is an interaction p-value from a test for different correlations between DNAmAge and actual age for schizophrenia patients prescribed clozapine and schizophrenia patients prescribed alternative medications.
Figure 1—figure supplement 6
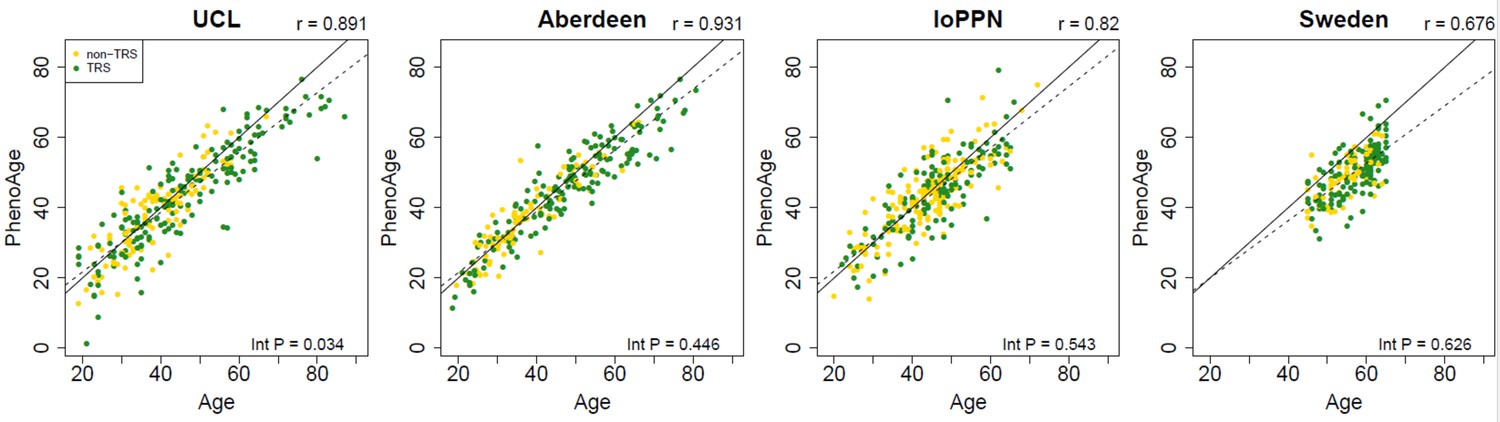
Scatterplots of PhenoAge derived from the DNA methylation data against actual chronological age for each of the cohorts.
PhenoAge was calculated using the algorithm described by Levine et al., 2018. Each point represents an individual and is colored by schizophrenia status (yellow = schizophrenia cases not prescribed clozapine, green = treatment-resistant schizophrenia cases prescribed clozapine). The solid diagonal line depicts x=y, that is, where the estimated and actual values are the same. The dashed diagonal line depicts the line of best fit. Presented at the top of the graph is the Pearson’s correlation coefficient (r) between the estimated and actual age across all samples in that cohort. Also shown in the bottom right-hand corner of each panel is an interaction p-value from a test for different correlations between PhenoAge and actual age for schizophrenia patients prescribed clozapine and schizophrenia patients prescribed alternative medications.
Figure 2 with 3 supplements
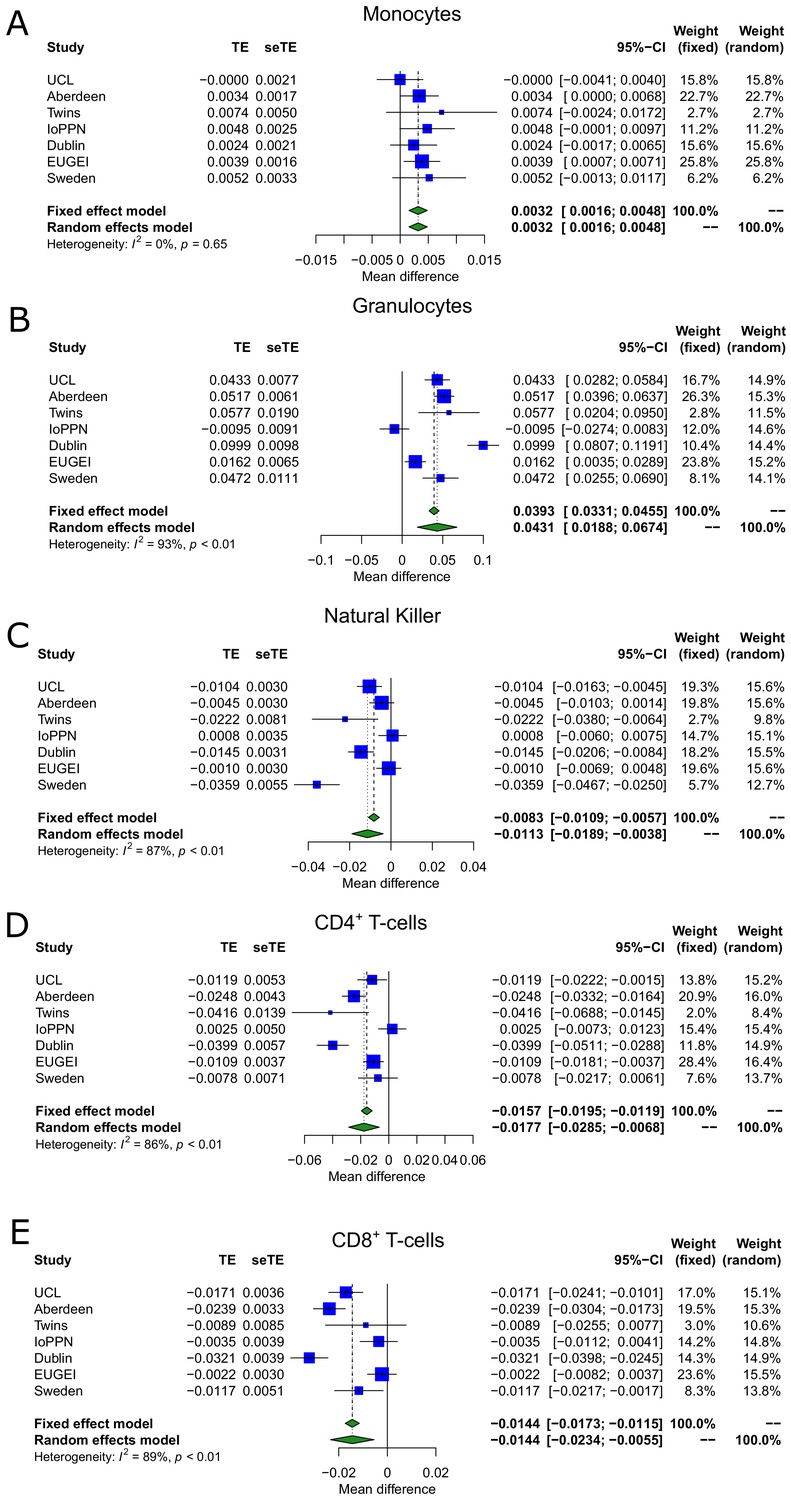
Blood cell-type proportions derived from DNA methylation data are altered in psychosis.
Shown are forest plots from meta-analyses of differences in blood cell proportions derived from DNA methylation data between psychosis patients and controls for (A) monocytes, (B) granulocytes, (C) natural killer cells, (D) CD4+ T-cells, and (E) CD8+ T-cells. TE: treatment effect (i.e., the mean difference between cases and controls); seTE: standard error of the treatment effect.
Figure 2—figure supplement 1
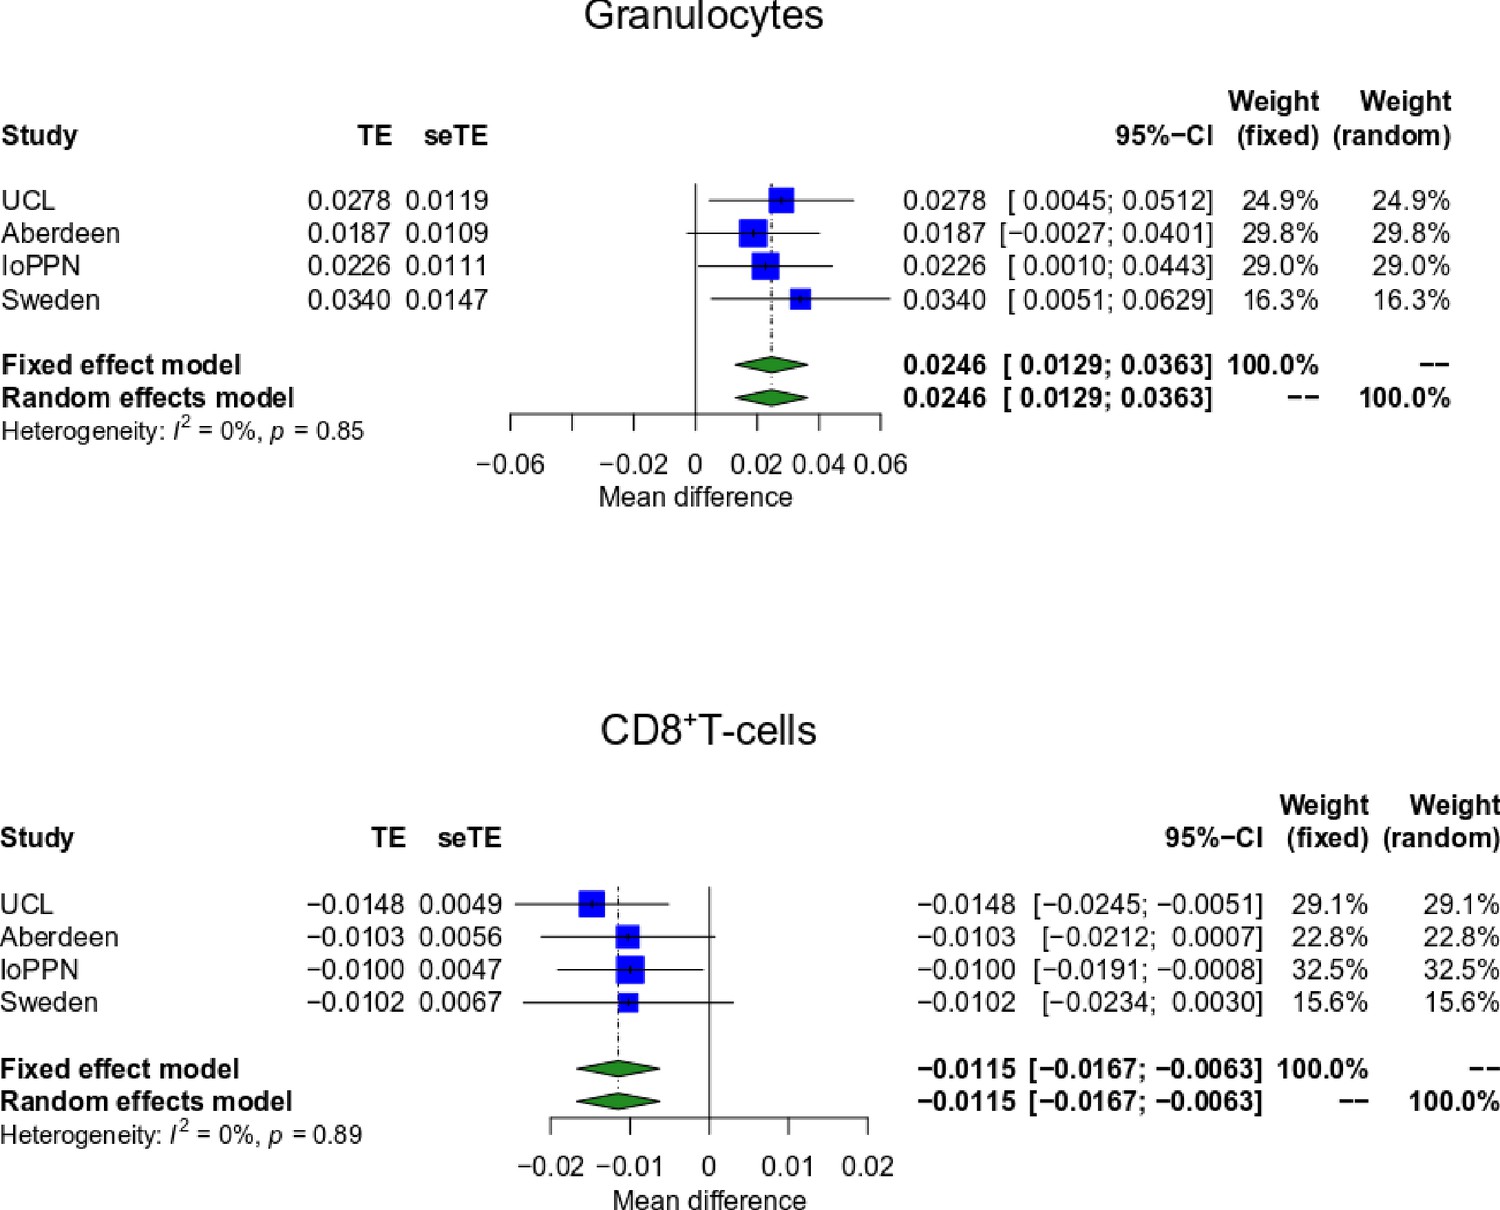
Treatment-resistant schizophrenia patients prescribed clozapine are characterized by altered blood cell proportions.
Shown are forest plots from meta-analyses of differences in estimated blood cell proportions derived from DNA methylation data between treatment-resistant schizophrenia patients prescribed clozapine and schizophrenia patients prescribed other medications for granulocytes, CD8+ T-cells. TE: treatment effect (i.e., the mean difference between cases and controls); seTE: standard error of the treatment effect.
Figure 2—figure supplement 2
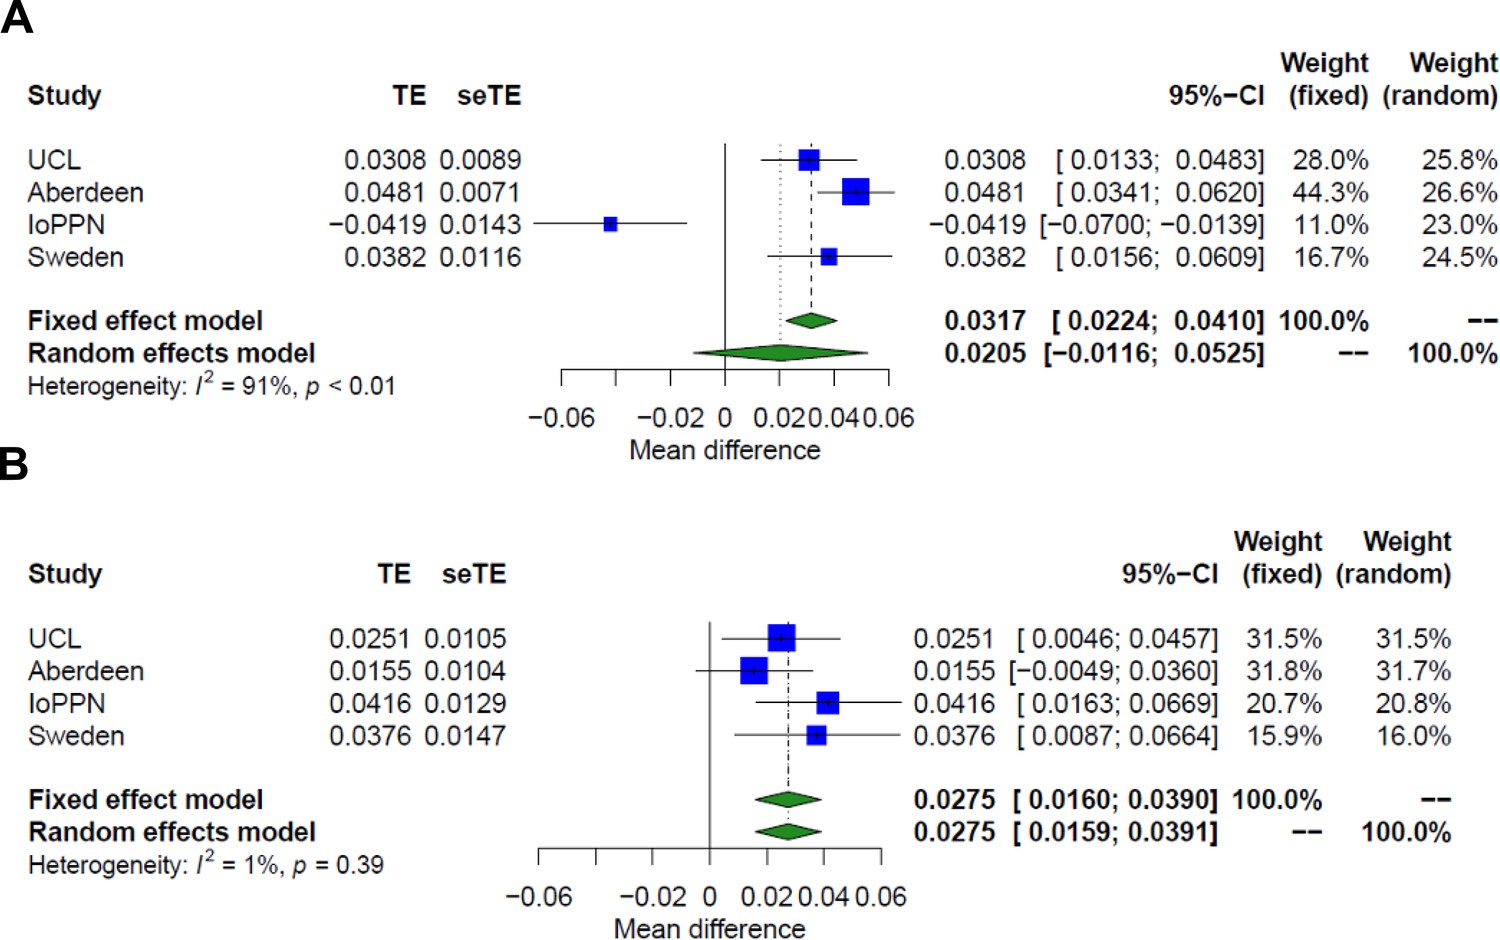
Additive effect of schizophrenia and treatment resistance on granulocyte proportions.
Shown are forest plots from meta-analyses of differences in estimated granulocyte proportions derived from DNA methylation data between (A) schizophrenia patients and controls and (B) treatment-resistant schizophrenia patients prescribed clozapine, and schizophrenia patients prescribed other medications. TE: treatment effect (i.e., the mean difference between cases and controls); seTE: standard error of the treatment effect.
Figure 2—figure supplement 3

Additive effect of schizophrenia and treatment resistance on CD8+ T-cell proportions.
Shown are forest plots from meta-analyses of differences in estimated granulocyte proportions derived from DNA methylation data between (A) schizophrenia patients and controls and (B) treatment-resistant schizophrenia patients prescribed clozapine and schizophrenia patients prescribed other medications. TE: treatment effect (i.e., the mean difference between cases and controls); seTE: standard error of the treatment effect.
Figure 3 with 3 supplements
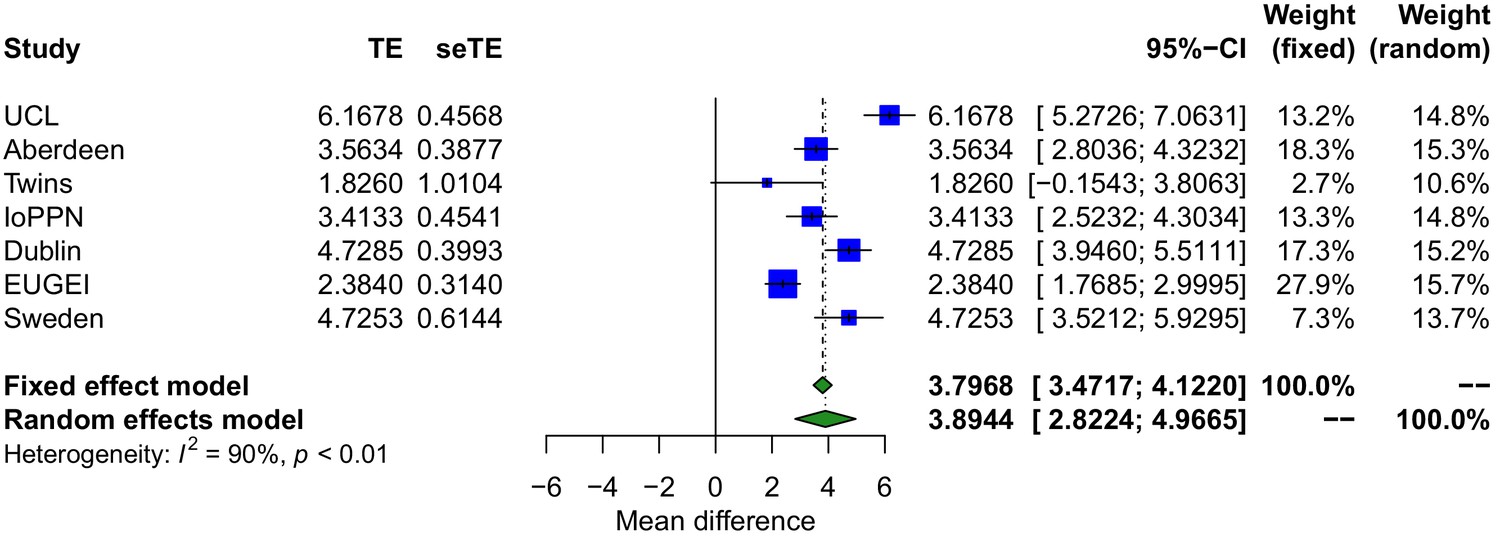
Smoking scores derived from DNA methylation data highlight that psychosis patients are characterized by an elevated exposure to tobacco smoking.
Forest plot from a meta-analysis of differences in smoking score derived from DNA methylation data between psychosis patients and controls. The smoking score was calculated from DNA methylation data using the method described by Elliott et al., 2014. TE: treatment effect (i.e., the mean difference between cases and controls); seTE: standard error of the treatment effect.
Figure 3—figure supplement 1
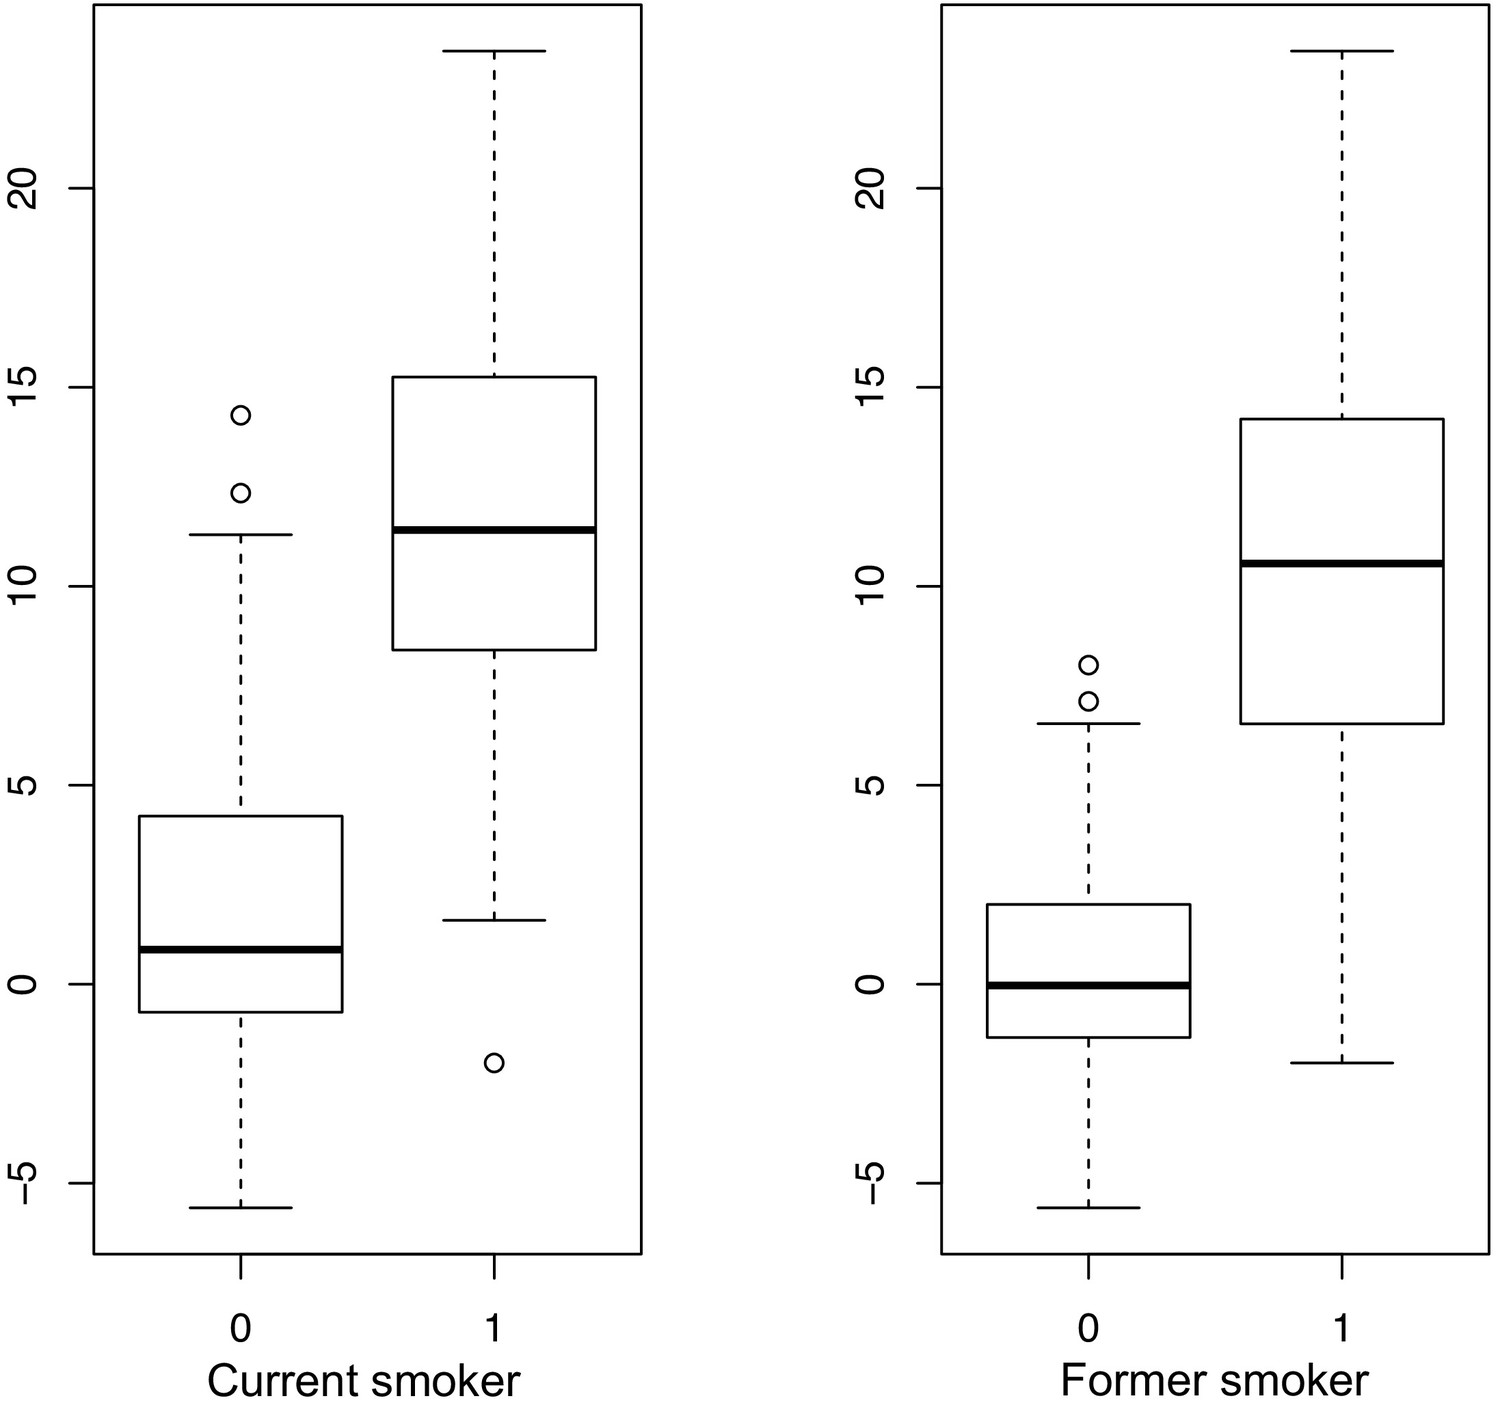
Current and former smokers are characterized by a significantly higher smoking score derived from DNA methylation data than non-smokers.
Shown is the DNA methylation smoking score (y-axis) from individuals in the IoPPN cohort for whom self-reported smoking data was available regarding current (left panel) and former (right panel) smoking behavior. 0 = no, 1 = yes.
Figure 3—figure supplement 2
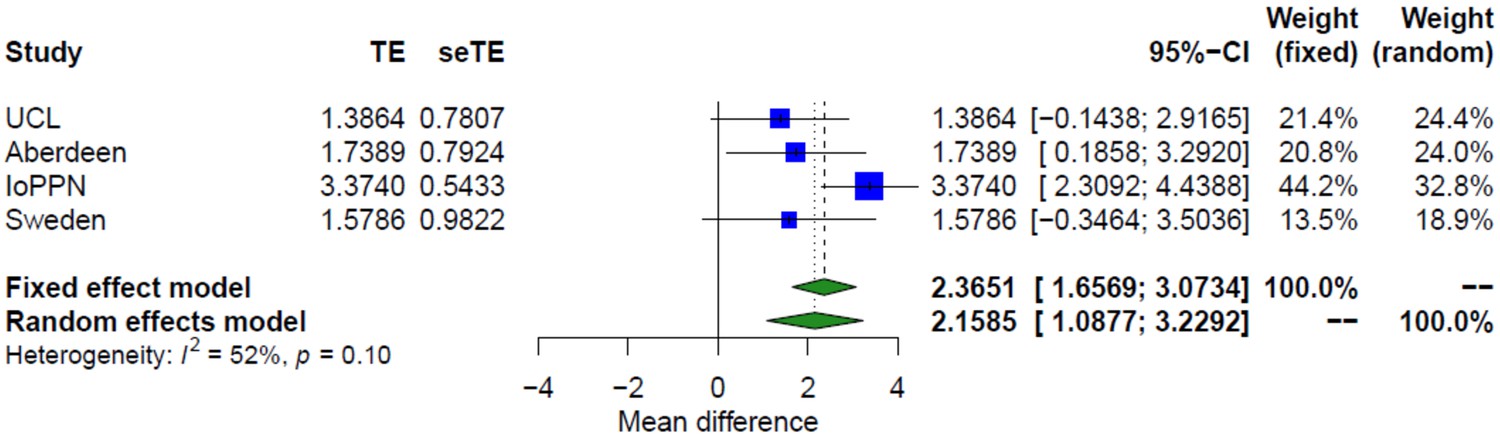
Treatment-resistant schizophrenia is associated with significantly higher DNA methylation-derived smoking scores.
Forest plot from meta-analyses of differences in smoking derived from DNA methylation data between treatment-resistant schizophrenia patients prescribed clozapine and schizophrenia patients prescribed other medications. TE: treatment effect (i.e., the mean difference between cases and controls); seTE: standard error of the treatment effect.
Figure 3—figure supplement 3
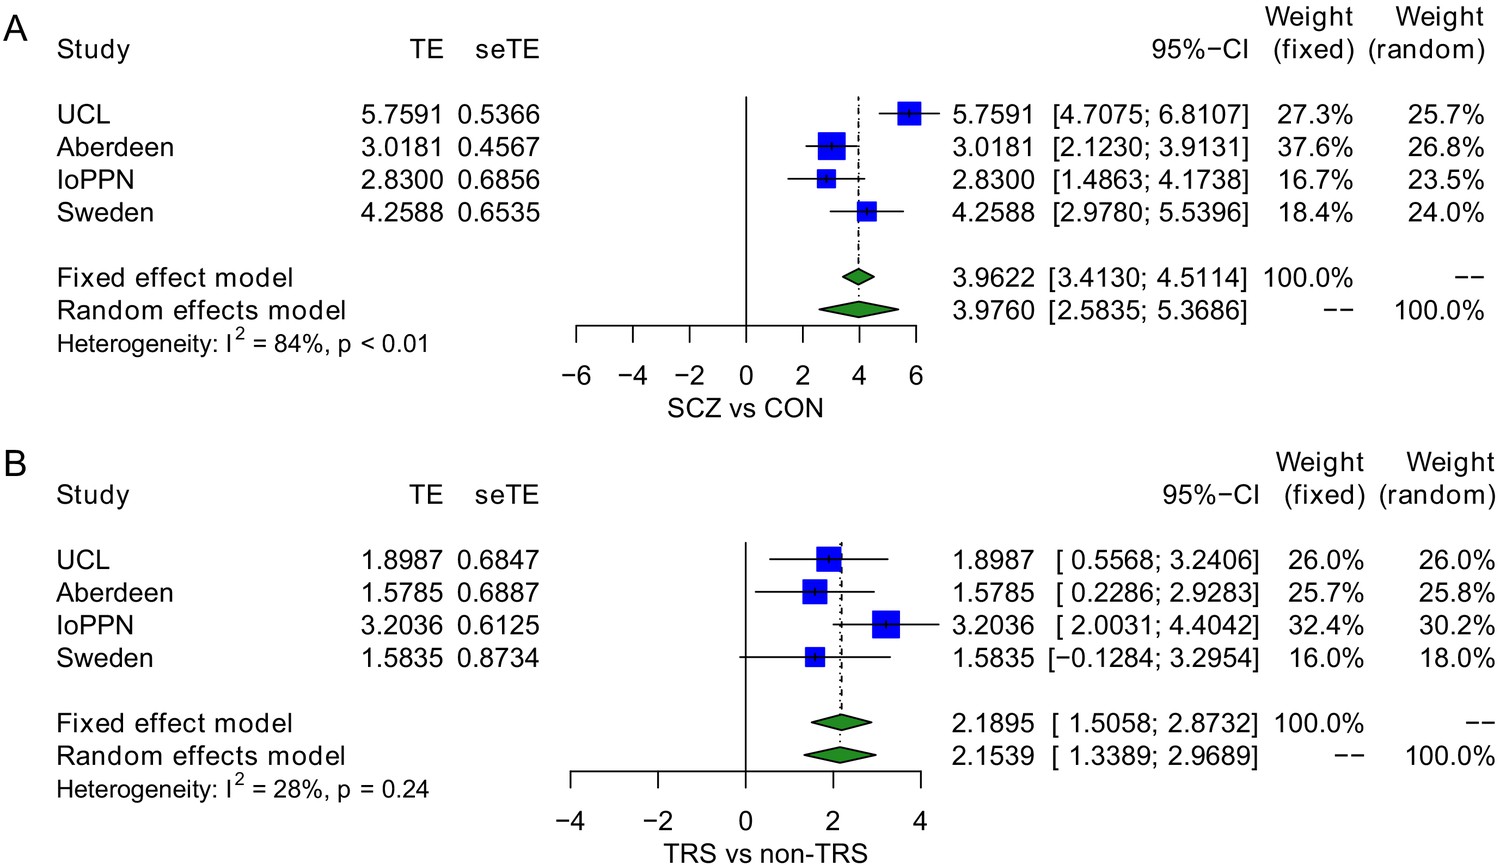
Treatment-resistant schizophrenia (TRS) patients show an elevated exposure to tobacco smoking relative to non-TRS and controls in a model testing both schizophrenia diagnosis status and TRS status simultaneously.
(A) Schizophrenia diagnosis was associated with a significant increase in smoking score (mean difference = 3.98; p=2.19×10⁻⁸) with (B) TRS status associated with an additional increase within cases (mean difference = 2.15; p=2.22×10⁻⁷). TE: treatment effect (i.e., the mean difference between cases and controls); seTE: standard error of the treatment effect.
Figure 4 with 1 supplement
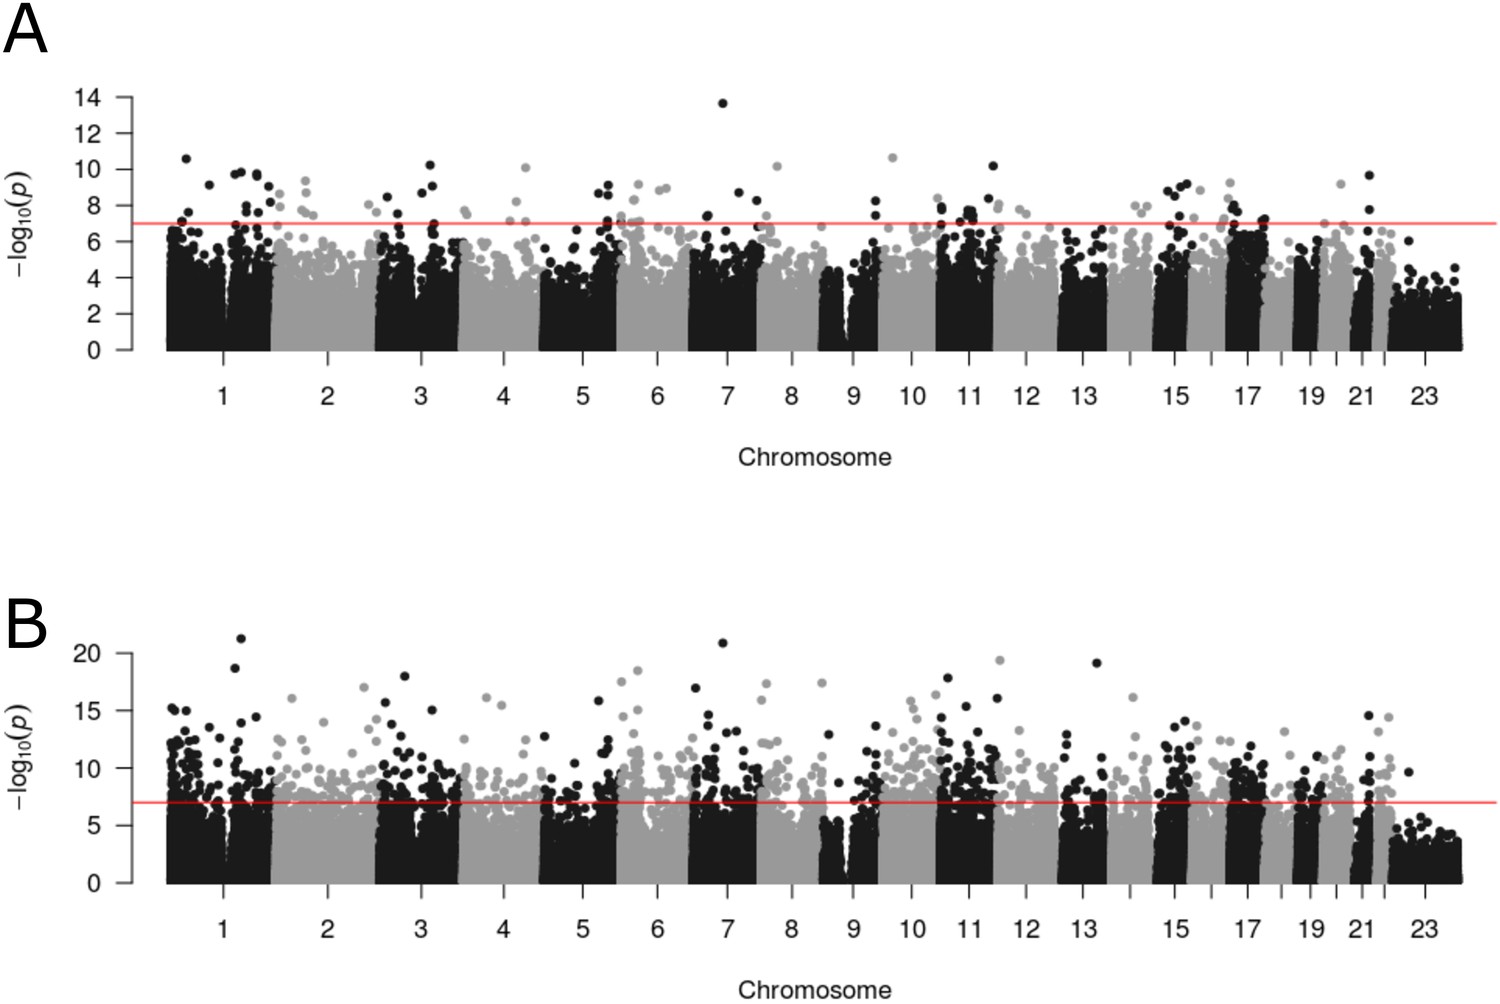
Differential DNA methylation at multiple loci across the genome is associated with psychosis and schizophrenia.
Manhattan plots depicting the –log10 p-value from the epigenome-wide association study meta-analysis (y-axis) against genomic location (x-axis). (A) presents results from the analysis comparing psychosis patients and controls, and (B) presents results from the analysis comparing diagnosed schizophrenia cases and controls.
Figure 4—figure supplement 1
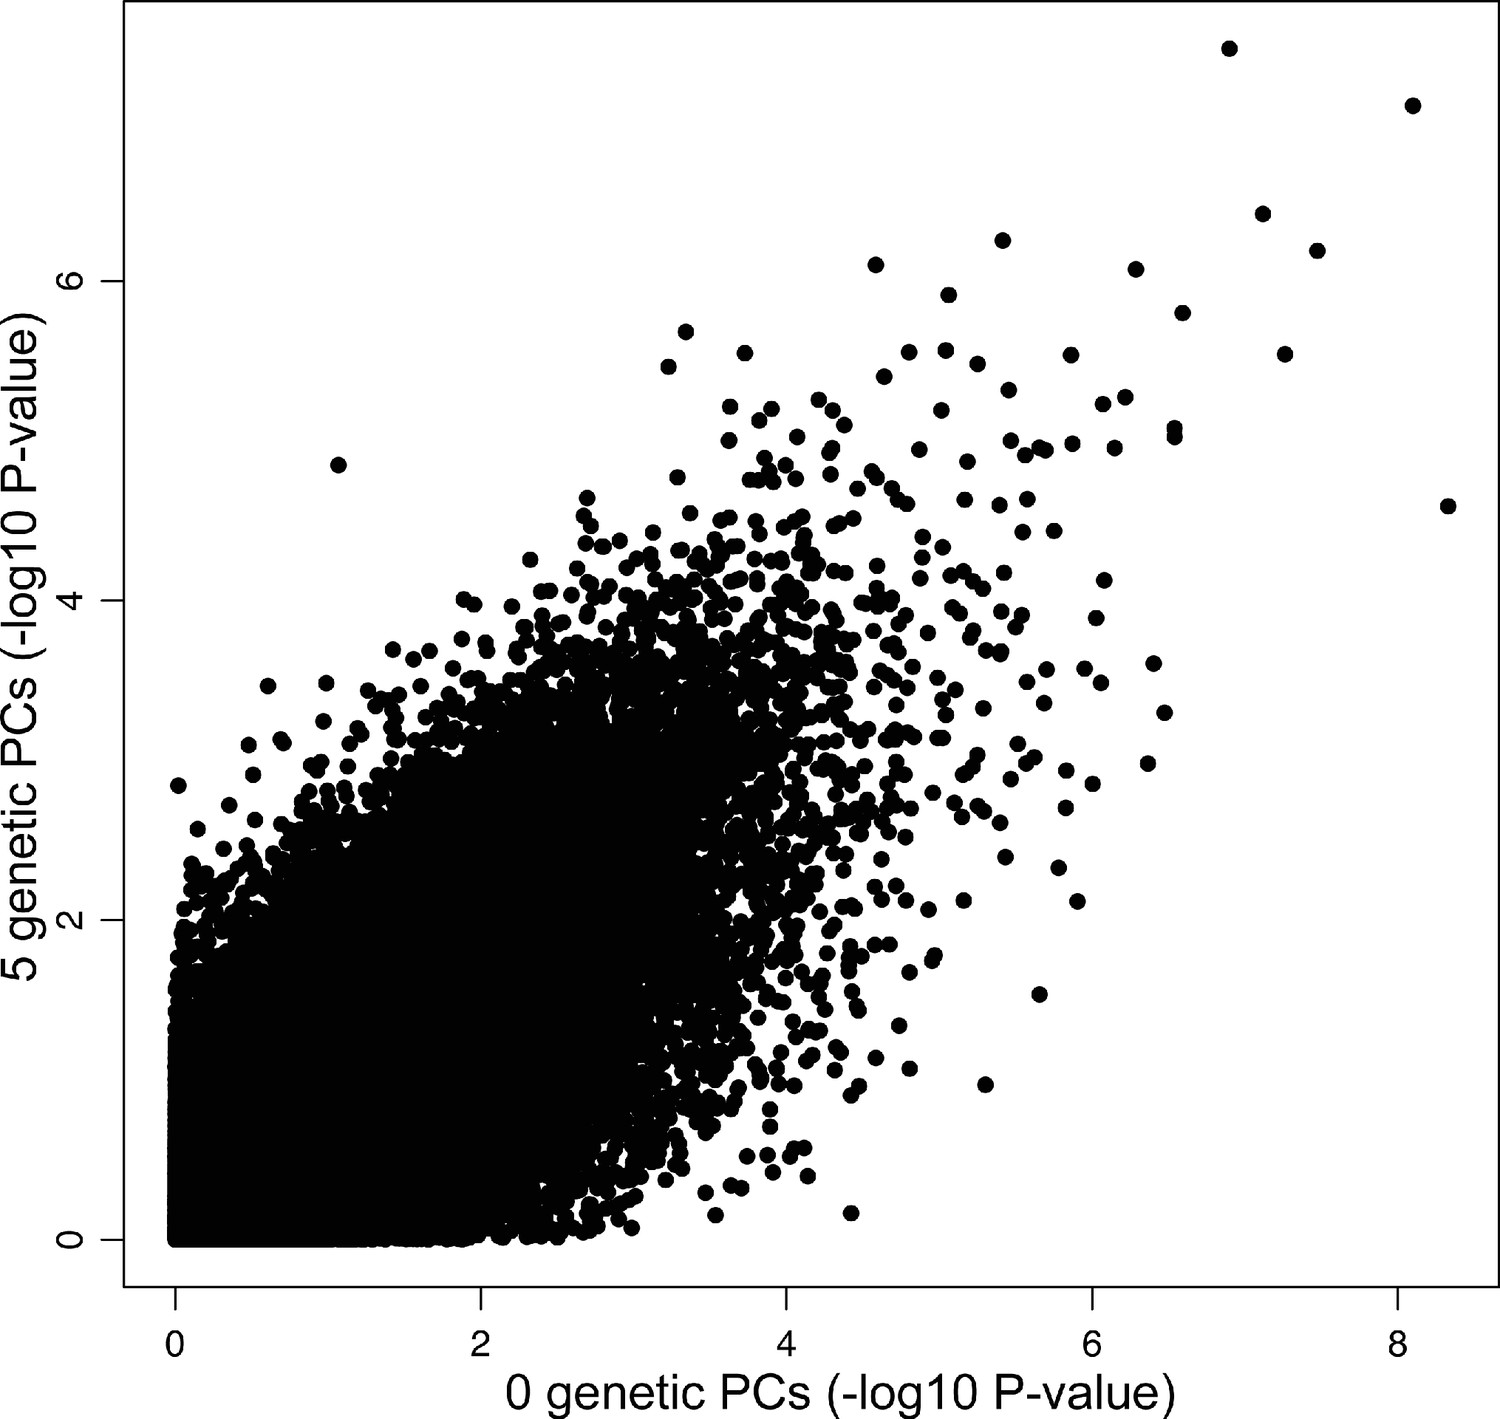
Including genetic principal components (PCs) into DNA methylation analysis models has little effect on the results in ethnically heterogeneous cohorts.
Shown is a scatterplot of statistics (–log10 p-value) from an epigenome-wide association study (EWAS) of psychosis in the IoPPN cohort without the inclusion of any genetic PCs in the analysis model (x-axis) compared to an EWAS of psychosis including five genetic PCs in the analysis model (y-axis).
Figure 5
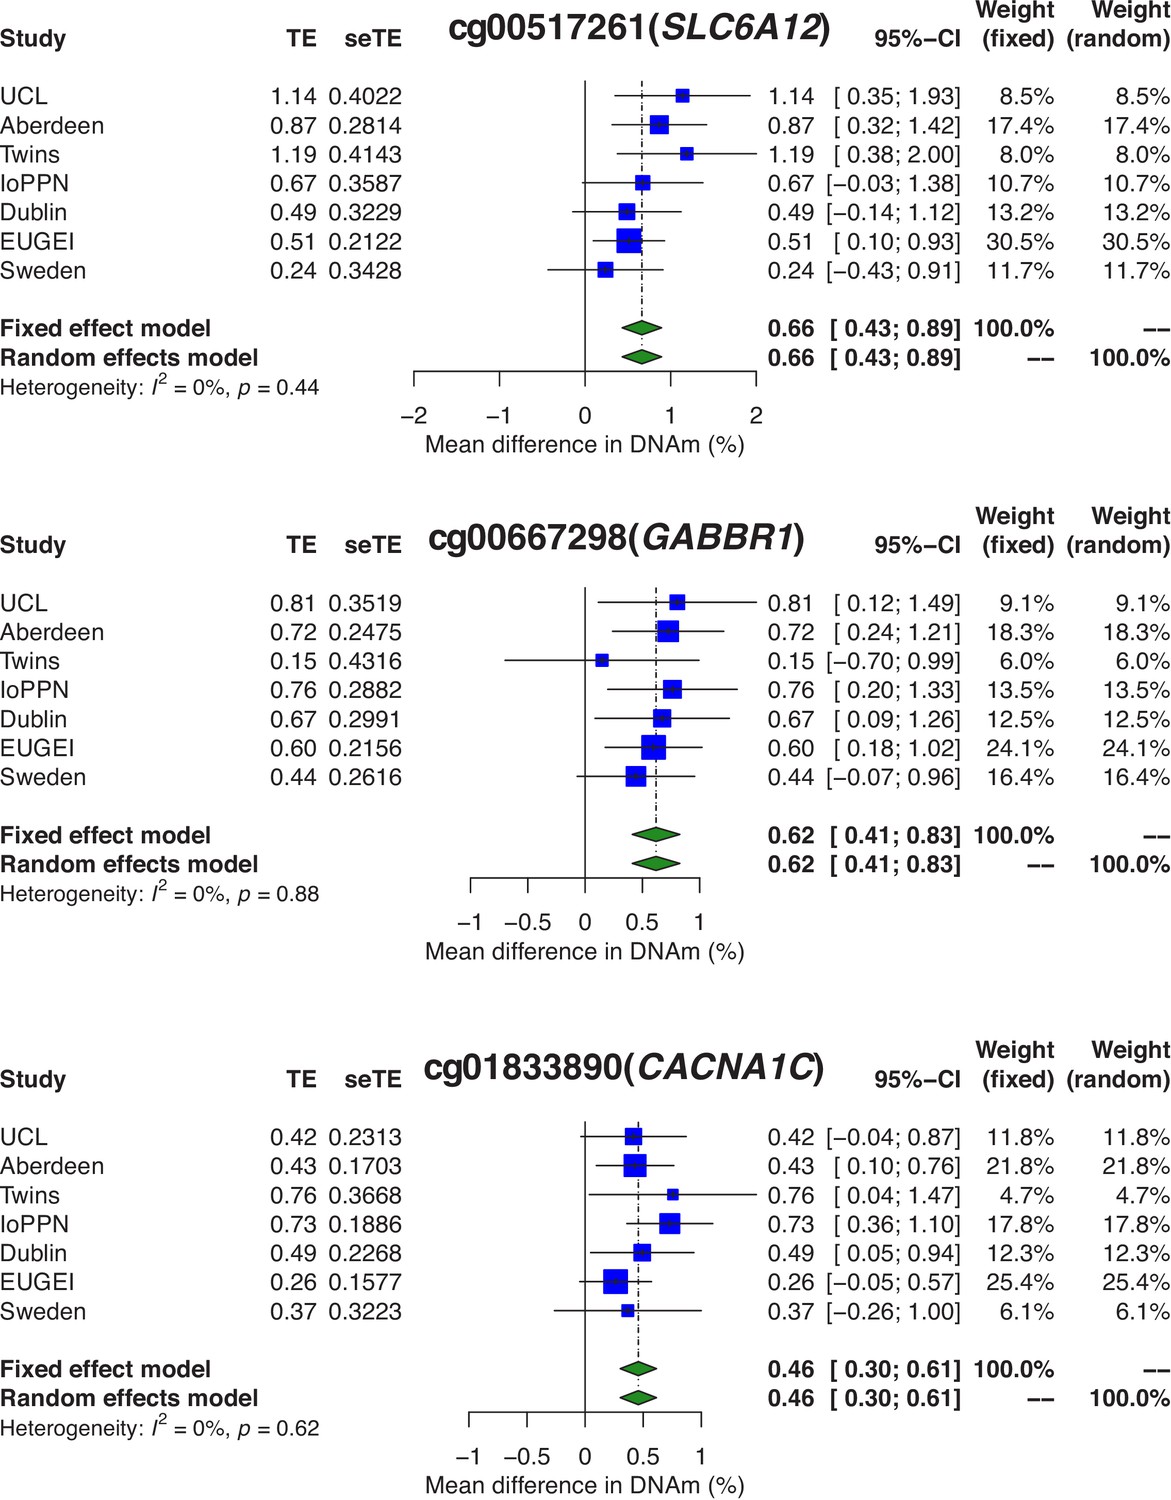
Psychosis-associated differential DNA methylation at sites annotated to genes previously implicated in disease etiology.
Shown are forest plots for differentially methylated positions (DMPs) annotated to the GABA transporter SLC6A12 (cg00517261; p=1.53×10⁻⁸), the GABA receptor GABBR1 (cg00667298; p=5.07×10⁻⁹), and the calcium voltage-gated channel subunit gene CACNA1C (cg01833890; p=8.42×10⁻⁹). TE: treatment effect (i.e., the mean difference between cases and controls); seTE: standard error of the treatment effect.
Figure 6

Comparison of effect sizes for schizophrenia-associated differentially methylated positions (DMPs) overlapping with epigenome-wide association study (EWAS) results for other traits.
Shown for each overlapping DMP is the association effect size for the other trait (x-axis) taken from the online EWAS catalog (http://ewascatalog.org/) compared to the effect size identified in our meta-analysis of schizophrenia (y-axis).
Figure 7
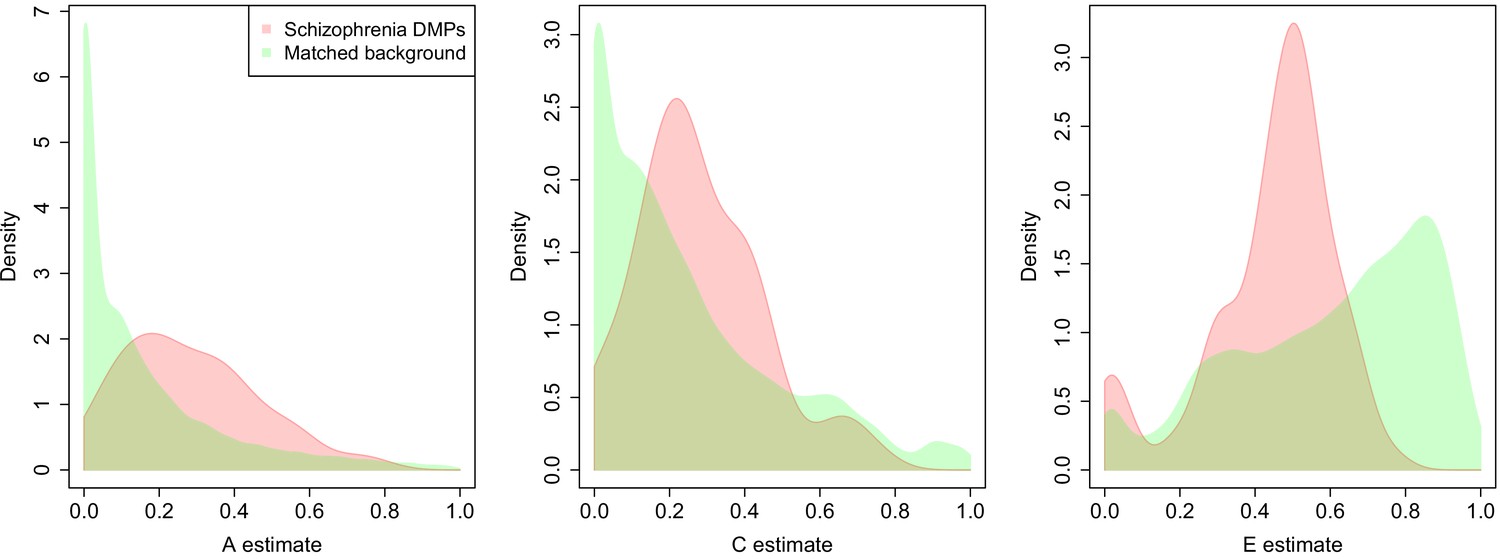
DNA methylation at sites associated with schizophrenia is more strongly influenced by genetic factors and common environmental influences than equivalent matched sites across the genome.
A series of density plots for estimates of additive genetic effects (A, left), common environmental effects (C, middle), and non-shared environmental effects (E, right) derived using data from a dataset generated by Hannon et al., 2018b: schizophrenia DMPs (red) and matched background sites (green).
Figure 8 with 2 supplements
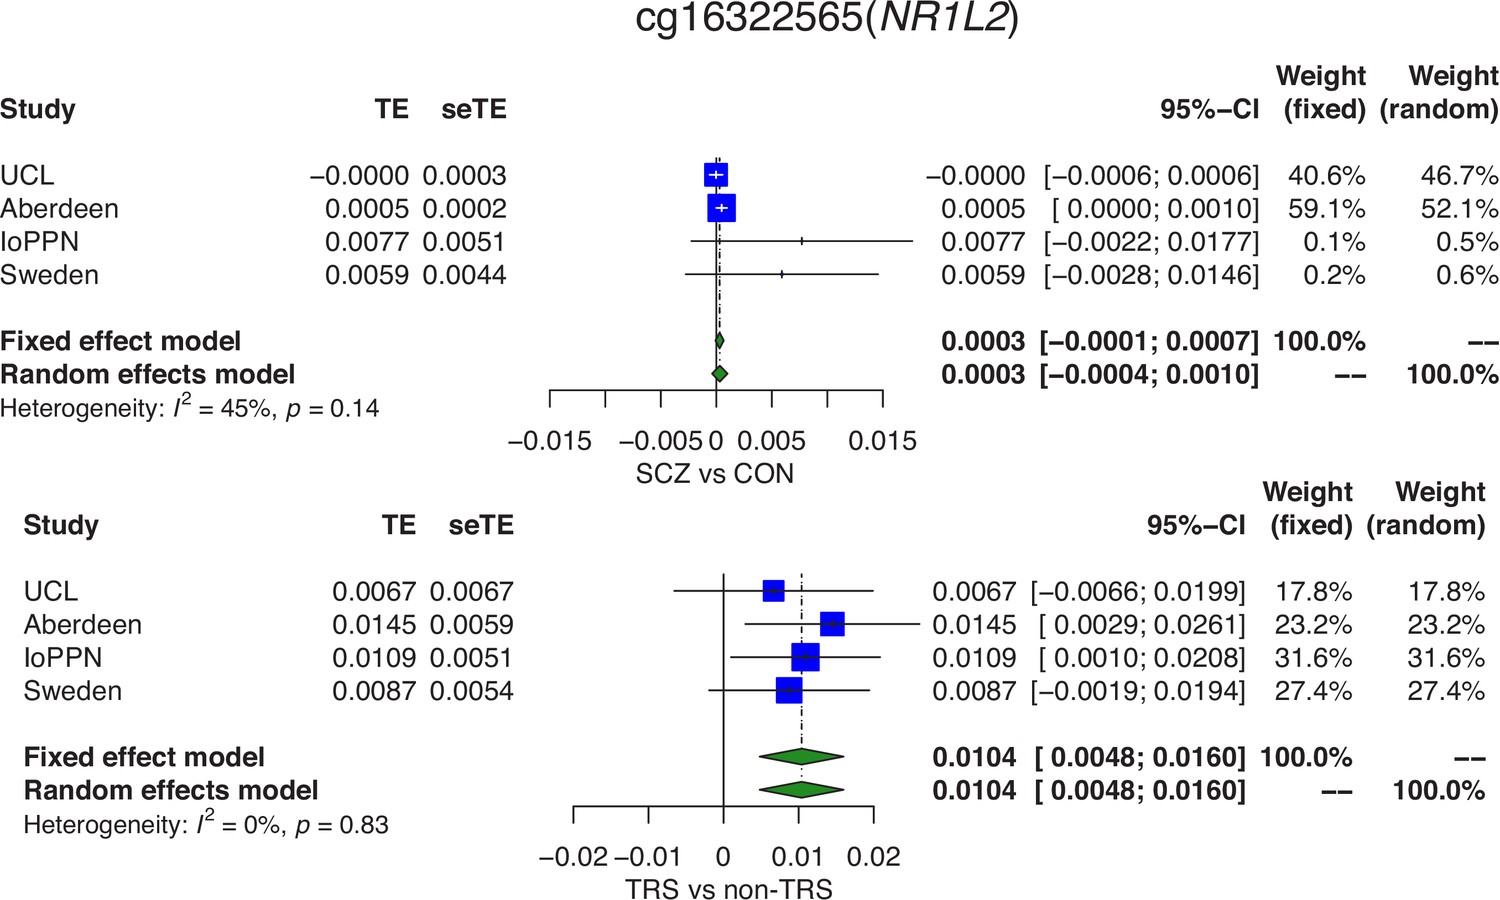
Differences in DNA methylation between schizophrenia cases and controls are partially influenced by a subset of cases with treatment-resistant schizophrenia (TRS).
Forest plots from a meta-analysis of differences in DNA methylation at cg16322565 located in the NR1L2 gene on chromosome 3 between (A) schizophrenia patients and controls and (B) TRS patients prescribed clozapine and non-TRS prescribed other medications. TE: treatment effect (i.e., the mean difference between cases and controls); seTE: standard error of the treatment effect.
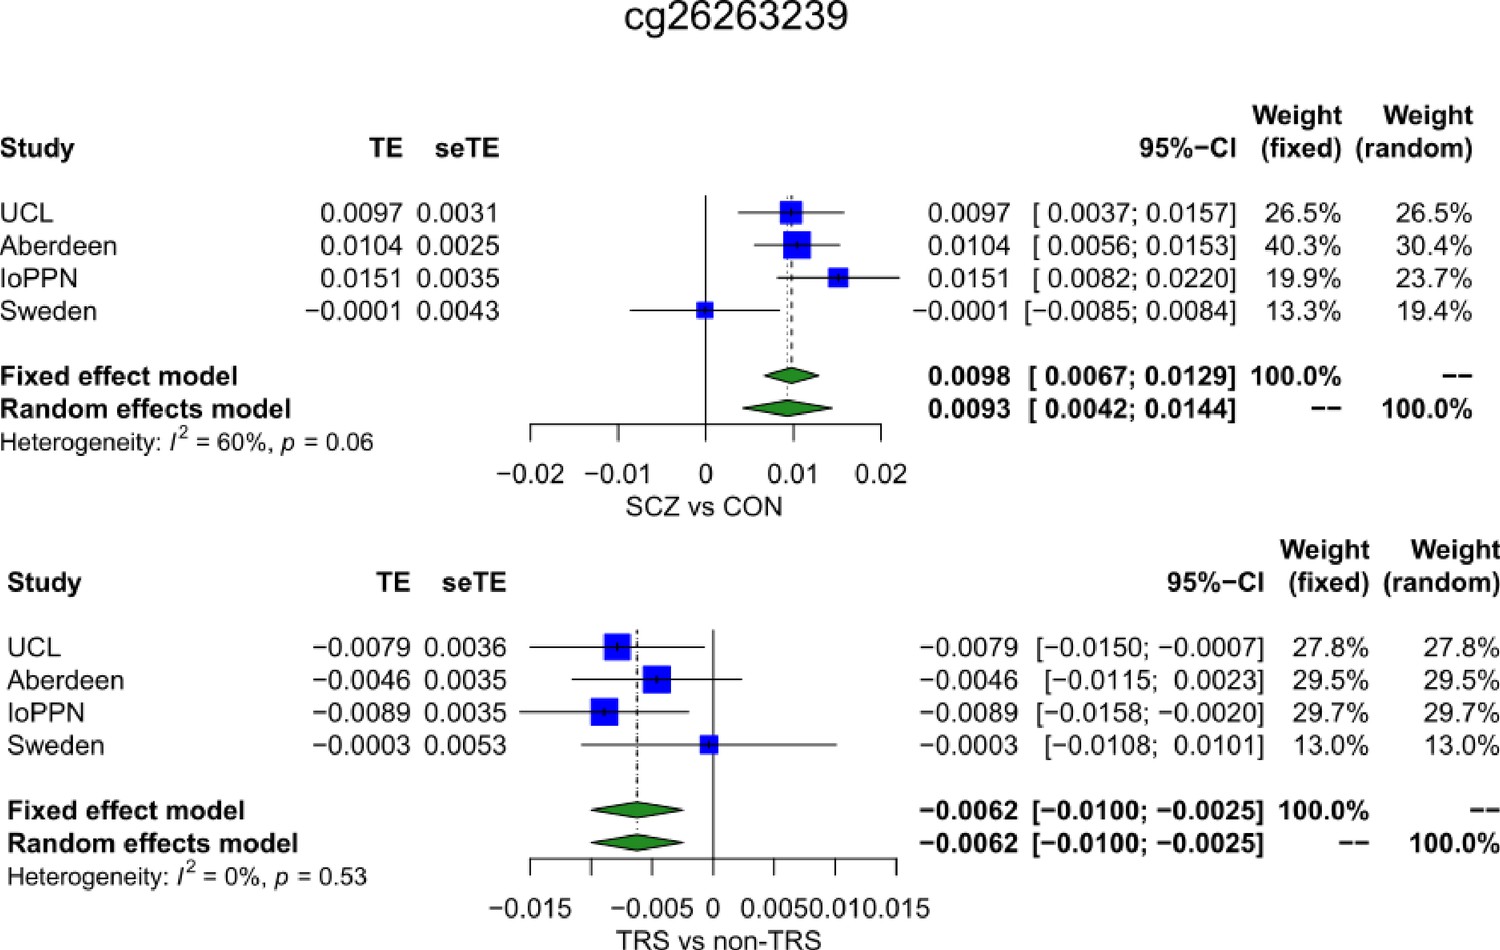
Figure 8—figure supplement 1

Forest plot of a site where DNA methylation is significantly associated with schizophrenia and within cases, with treatment-resistant schizophrenia.
TE: treatment effect (i.e., the mean difference between cases and controls); seTE: standard error of the treatment effect.
Figure 8—figure supplement 2
Forest plot of a site where DNA methylation is significantly associated with schizophrenia and within cases, with treatment-resistant schizophrenia but with an opposite directions of effect.
TE: treatment effect (i.e., the mean difference between cases and controls); seTE: standard error of the treatment effect.
Author response image 1
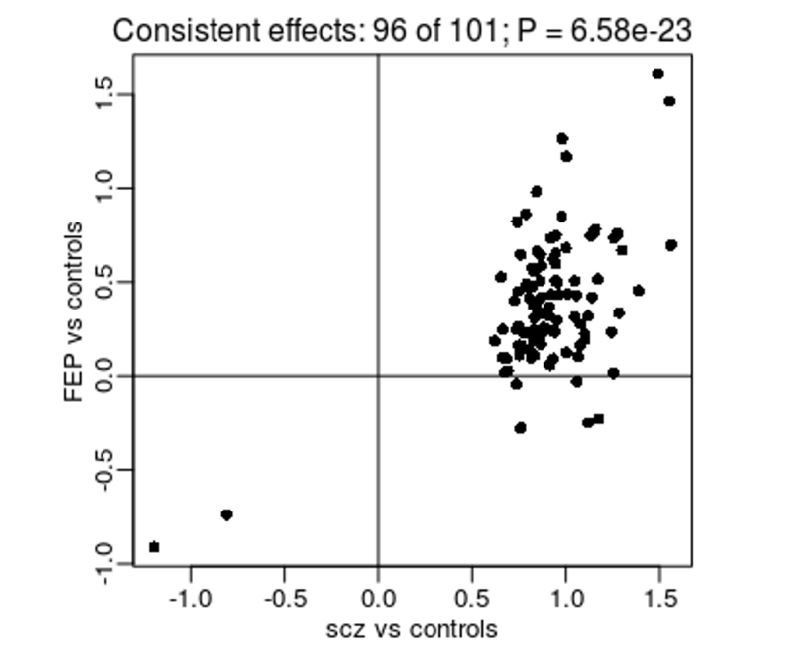
Comparison of effect sizes from an EWAS of diagnosed SZ (x-axis) and FEP (y-axis) for SZ-associated DMPs.
Shown is the mean difference (% DNAm) between cases and controls.
Author response image 2

Limited evidence for a relationship between age and DNAm at SZ-associated DMPs.
Shown is a histogram of –log10(p-values) for the interaction term between age and schizophrenia status across all 1,048 SZ-associated DMPs.
Author response image 3
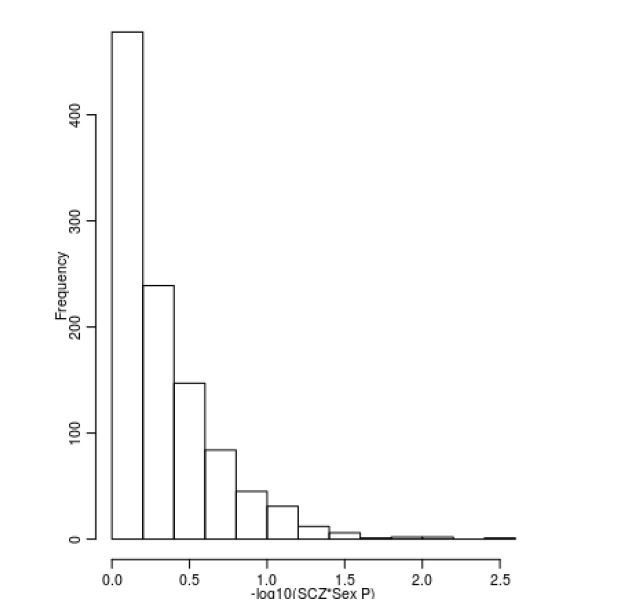
Limited evidence for a relationship between sex and DNAm at SZ-associated DMPs.
Shown is a histogram of –log10(p-values) for the interaction term between sex and schizophrenia status across all 1,048 SZ-associated DMPs.
Author response image 4

Comparison of results from our EWAS meta-analysis with those for 167 replicated SZ-associated DMPs identified by Montano et al.
Overall there is a significant enrichment of consistent results between the analyses for these DMPs. The red crosses highlight the two DNAm sites that were reported as significant by Montano et al. and also passed our multiple testing threshold in our meta-analysis.
Author response image 5
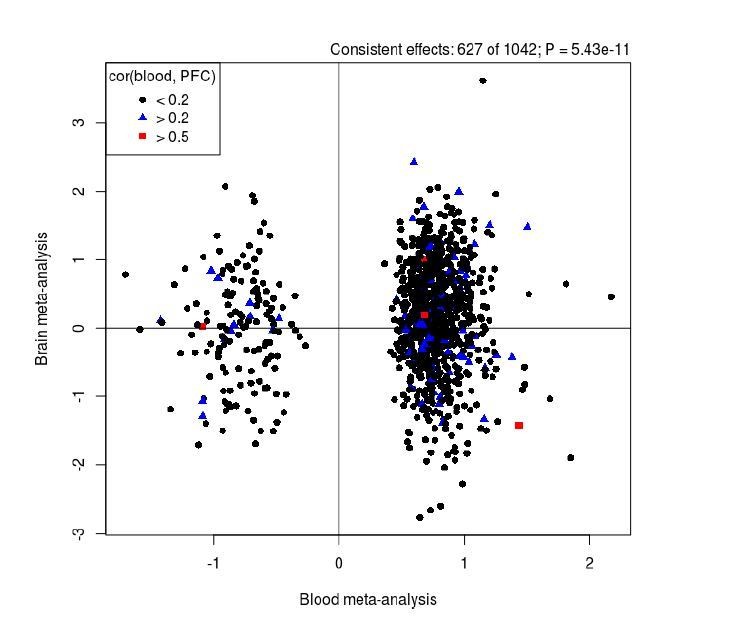
Comparison of results from our EWAS meta-analysis (x-axis) with those identified in an analysis of human PFC (y-axis).
Overall there is a significant enrichment of consistent results between the analyses for SZ-associated DMPs. Black dots represent DMPs that we found to show low covariation (r < 0.2) between blood and cortex tissue in a previous analysis of matched samples from the same individuals (Hannon et al., Epigenetics, PMID: 26457534), with blue (r > 0.2) and red (r > 0.5) symbols highlighting sites with stronger covariation in DNAm between tissues.
Tables
Table 1
Summary of cohort demographics included in the psychosis epigenome-wide association study (EWAS) meta-analysis.
| Cohort | UCL | Aberdeen | Twins | IoPPN | Dublin | EU-GEI | Sweden | Total | |
|---|---|---|---|---|---|---|---|---|---|
| Total sample | 675 | 847 | 192 | 800 | 679 | 912 | 378 | 4483 | |
| % Cases | 52.3 | 48.9 | 45.3 | 74.6 | 51.3 | 42.9 | 50.0 | 53.1 | |
| % Schizophrenia | 52.3 | 48.9 | 45.3 | 36.3 | 51.3 | 0.0 | 50.0 | 37.5 | |
| % First-episode psychosis | 0.0 | 0.0 | 0.0 | 38.4 | 0.0 | 42.9 | 0.0 | 15.6 | |
| % Males | All | 58.7 | 71.1 | 52.1 | 63.0 | 71.0 | 54.4 | 59.5 | 62.6 |
| Cases | 72.0 | 68.4 | 54.0 | 65.3 | 71.6 | 64.2 | 60.3 | 66.8 | |
| Controls | 44.1 | 73.7 | 50.5 | 56.2 | 70.4 | 47.0 | 58.7 | 57.8 | |
| Chi-square test p-value | 3.81E-13 | 0.103 | 0.730 | 0.024 | 0.804 | 3.68E-07 | 0.834 | 9.35E-10 | |
| Age (years) | Mean | 40.4 | 44.6 | 35.3 | 28.8 | 41.7 | 35.3 | 60.0 | 40.5 |
| SD | 15.0 | 12.9 | 10.8 | 9.46 | 12.0 | 12.8 | 8.86 | 14.7 | |
| Mean in controls | 43.7 | 44.2 | 37.9 | 27.8 | 41.4 | 30.7 | 56.3 | 41.6 | |
| Mean in cases | 36.8 | 44.9 | 33.3 | 30.3 | 42.0 | 38.7 | 63.7 | 39.4 | |
| t-test p-value | 6.55E-09 | 0.529 | 0.033 | 0.007 | 0.505 | 1.24E-22 | 1.05E-16 | ||
Table 2
Results of a meta-analysis of differences in blood cell composition estimates derived from DNA methylation data between schizophrenia cases and controls.
| Cell type | Measure type | Number of cohorts | Random effects model | Fixed effects model | Heterogeneity p-Value | ||||
|---|---|---|---|---|---|---|---|---|---|
| Mean difference | SE | p-Value | Mean difference | SE | p-Value | ||||
| Monocytes | Proportion | 7 | 0.00320 | 0.00083 | 0.000115 | 0.00320 | 0.00083 | 0.000115 | 0.6490 |
| Granulocytes | Proportion | 7 | 0.04312 | 0.01241 | 0.000509 | 0.03930 | 0.00315 | 1.21E-35 | 2.22E-16 |
| Natural killer cells | Proportion | 7 | −0.01135 | 0.00385 | 0.003221 | −0.00827 | 0.00133 | 4.48E-10 | 2.43E-08 |
| CD4+ T-cells | Proportion | 7 | −0.01767 | 0.00555 | 0.00144 | −0.01569 | 0.00196 | 1.15E-15 | 1.23E-07 |
| CD8+ T-cells | Proportion | 7 | −0.01444 | 0.00457 | 0.001586 | −0.01443 | 0.00148 | 1.31E-22 | 8.13E-10 |
| B-cells | Proportion | 7 | −0.00495 | 0.00280 | 0.077103 | −0.00477 | 0.00102 | 2.75E-06 | 2.25E-07 |
| PlasmaBlast | Abundance | 5 | 0.05626 | 0.02987 | 0.059671 | 0.05332 | 0.00722 | 1.55E-13 | 8.45E-13 |
| CD8pCD28nCD45RAn | Abundance | 5 | 0.06280 | 0.22674 | 0.781792 | 0.10797 | 0.14981 | 0.4711 | 0.0826 |
| CD8 naive T-cells | Abundance | 5 | 7.21687 | 3.12594 | 0.02096 | 8.03957 | 1.89169 | 2.14E-05 | 0.0443 |
| CD4 naive T-cells | Abundance | 5 | 11.77240 | 4.72532 | 0.012726 | 11.77240 | 4.72532 | 0.0127 | 0.824 |
Author response table 1
Summary of the overlap between SZ-associated DMPs and DMPs associated with other traits in either whole blood or cord blood using results from the online EWAS catalog (http://ewascatalog.org/).
Shown are traits with more than one overlapping DMP.
| Trait | Total Overlap | Discordant direction of effect | Concordant direction of effect | P-value |
|---|---|---|---|---|
| Age | 30 | 28 | 2 | 8.68E-07 |
| Alcohol consumption per day | 8 | 7 | 1 | 0.070313 |
| Body mass index | 11 | 0 | 8 | 0.007813 |
| C-reactive protein | 10 | 0 | 10 | 0.001953 |
| Gestational age | 105 | 33 | 72 | 0.000178 |
| HIV infection | 8 | 4 | 4 | 1 |
| Inflammatory bowel disease | 2 | 0 | 0 | NA |
| Maternal smoking in pregnancy | 7 | 2 | 5 | 0.453125 |
| Primary Sjogrens syndrome | 31 | 0 | 0 | NA |
| Rheumatoid arthritis | 20 | 14 | 6 | 0.115318 |
| Serum high-density lipoprotein cholesterol | 12 | 12 | 0 | 0.000488 |
| Serum low-density lipoprotein cholesterol | 2 | 0 | 2 | 0.5 |
| Serum total cholesterol | 5 | 0 | 5 | 0.0625 |
| Sex | 54 | 0 | 1 | 1 |
| Smoking | 16 | 4 | 1 | 0.375 |
Author response table 2
Summary of the overlap between psychosis-associated DMPs and DMPs associated with other traits in either whole blood or cord blood using results from the online EWAS catalog (http://ewascatalog.org/).
Shown are traits with more than one overlapping DMP
| Trait | Total Overlap | Discordant direction of effect | Concordant direction of effect | P-value |
|---|---|---|---|---|
| Age | 3 | 3 | 0 | 0.25 |
| Body mass index | 4 | 3 | 0 | 0.25 |
| C-reactive protein | 5 | 1 | 4 | 0.375 |
| Gestational age | 20 | 9 | 11 | 0.823803 |
| HIV infection | 3 | 2 | 1 | 1 |
| Primary Sjogrens syndrome | 3 | 0 | 0 | NA |
| Rheumatoid arthritis | 4 | 0 | 4 | 0.125 |
| Sex | 19 | 0 | 1 | 1 |
| Smoking | 6 | 3 | 0 | 0.25 |
Additional files
-
Supplementary file 1
Supplementary Tables 1-14.
- https://cdn.elifesciences.org/articles/58430/elife-58430-supp1-v2.xlsx
-
Transparent reporting form
- https://cdn.elifesciences.org/articles/58430/elife-58430-transrepform-v2.docx
Download links
A two-part list of links to download the article, or parts of the article, in various formats.
Downloads (link to download the article as PDF)
Open citations (links to open the citations from this article in various online reference manager services)
Cite this article (links to download the citations from this article in formats compatible with various reference manager tools)
DNA methylation meta-analysis reveals cellular alterations in psychosis and markers of treatment-resistant schizophrenia
eLife 10:e58430.
https://doi.org/10.7554/eLife.58430


