Light-induced engagement of microglia to focally remodel synapses in the adult brain
- ESF International Graduate School on Analysis, Imaging and Modelling of Neuronal and Inflammatory Processes, Germany
- Institut für Biochemie und Zellbiologie, Otto-von-Guericke-University, Medical Faculty, Germany
- Molecular Neuroplasticity, German Center for Neurodegenerative Diseases (DZNE), Germany
- Medical Faculty, Otto-von-Guericke University, Germany
- Center for Behavioral Brain Sciences (CBBS), Germany
Figures
Figure 1 with 8 supplements
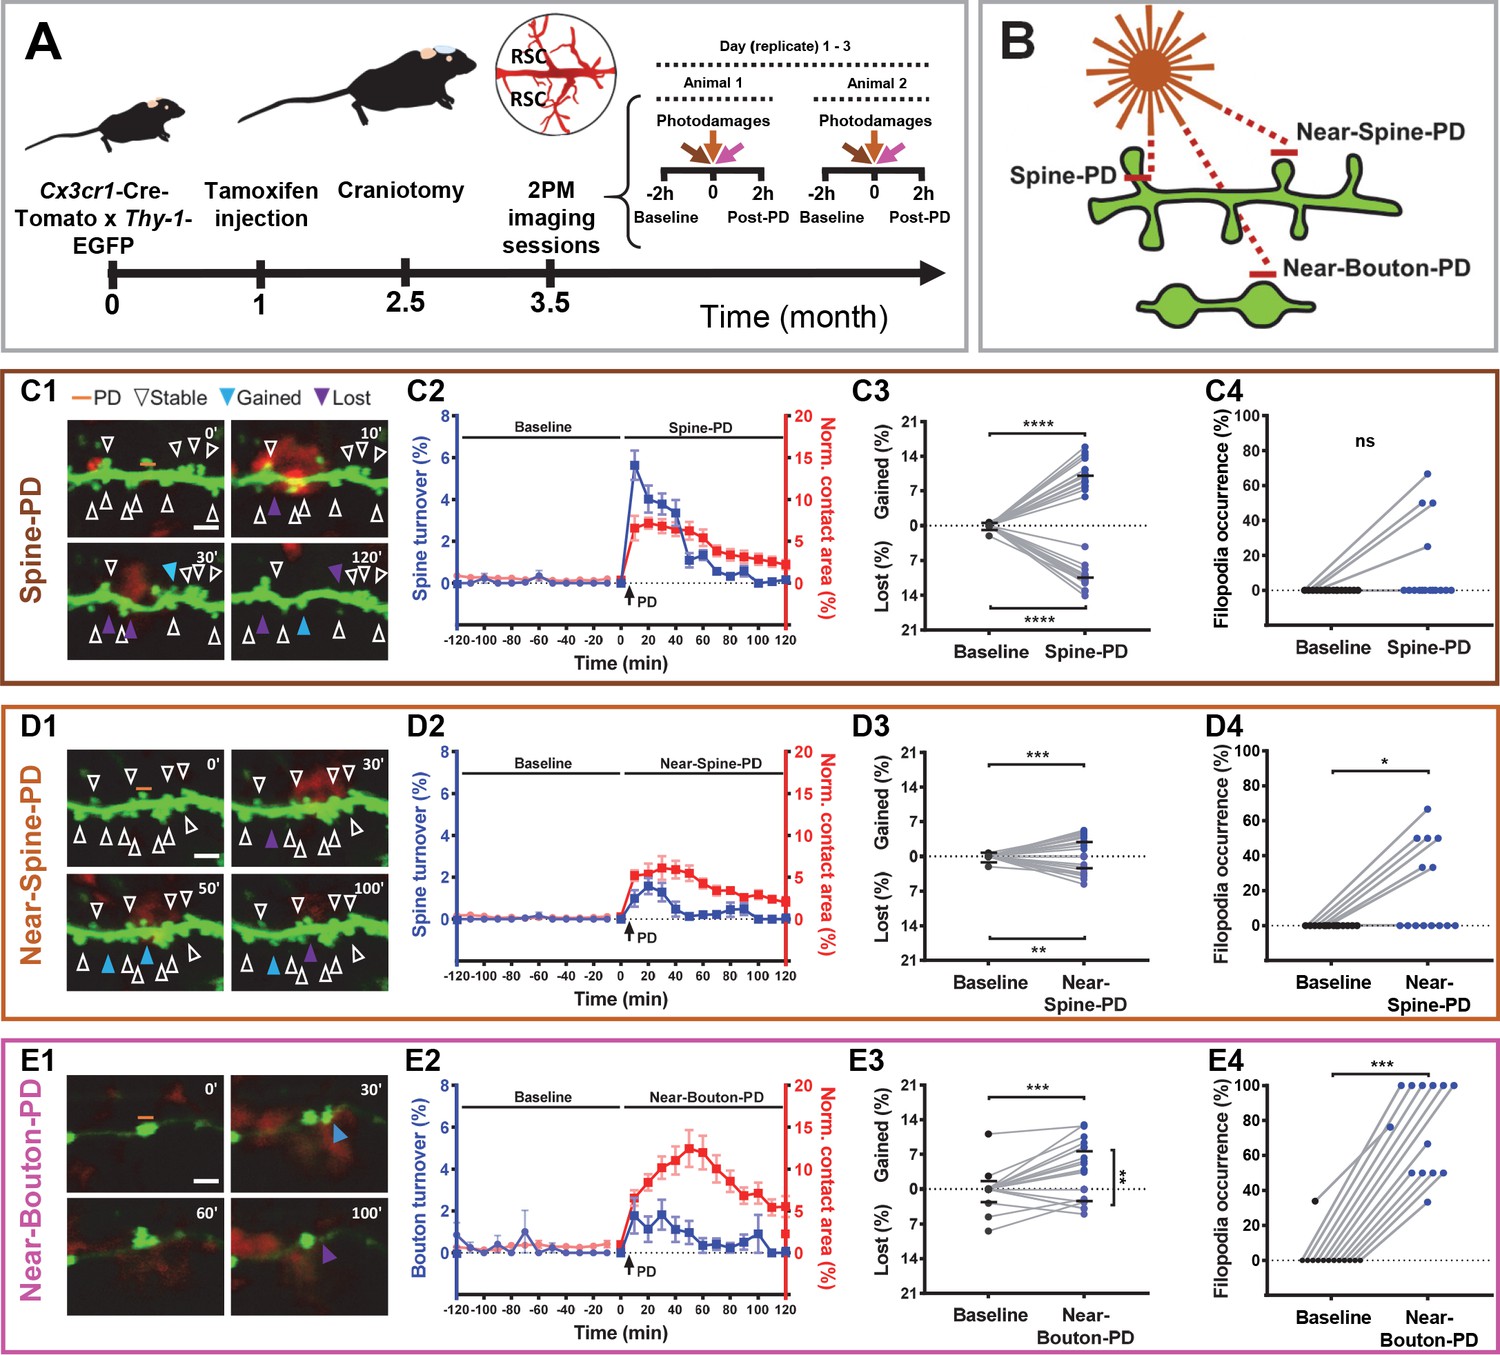
Synaptic photodamage induces microglia contact and promotes spine and bouton turnover and filopodia formation in the RSC.
(A) Timeline of the experiments. Mice received intraperitoneal injections of tamoxifen at 1 month of age to trigger the expression of red fluorescent protein in microglia. After 1.5 months, a glass coverslip was implanted over the RSC and 1 month later imaging of the RSC was performed. Typically, the baseline (2 hr) and responses to three types of PD (2 hr) were imaged in parallel at three locations, in two animals per day. (B) Short horizontal bars (≈1 μm) illustrate locations of laser-irradiated areas in three types of photodamage experiments. (C–E) Summary graphs showing structural changes after photodamage (white line = scale bar, 3 µm). From left to right, sequential images of microglia (red) - dendrite/axons (green) interactions (yellow) before the photodamage (0 min) and 10, 30, 50, 60, and 120 min afterwards (orange line denotes position of PD laser target). Stable (white arrowheads pointing to spines/boutons that remained stable over 2 hr of imaging), gained (blue arrowheads pointing to spines/boutons appeared from time point to time point) and lost (purple arrowheads pointing to spine/boutons disappeared) structures were identified in these images (C1,D1,E1). Using this information, we calculated turnover rates and normalized microglia-neuron contact areas (colocalization) before and after photodamage (shown on the same plot as mean + s.e.m. with two different y-axes) (Spine-PD: n = 16 mice, 47 dendrites; Near-Spine-PD: n = 16, 35 dendrites; Near-Bouton-PD: n = 14, 34 axons). The contact area curves of baseline and after photodamage differ significantly (Spine-PD: p=0.001, Near-Spine-PD: p=0.016 and Near-Bouton-PD: p=0.040, Generalized Estimated Equation (GEE)) (C2,D2,E2). The colocalization area curve of Near-Bouton-PD was different in comparison with the Spine-PD and Near-Spine-PD curves (Spine-PD vs. Near-Spine-PD: p=0.687; Spine-PD vs. Near-Bouton-PD: p=0.003, and Near-Spine-PD vs. Near-Bouton-PD: p=0.006; GEE). The middle plot shows the average percentage change (during 2 hr) in gained and lost spines 2 hr before (baseline) and after photodamage (C3,D3,E3) (Spine-PD: n = 16 mice, 47 dendrites; Near-Spine-PD: n = 16, 35 dendrites; Near-Bouton-PD: n = 14, 34 axons). Plots on the right show the changes in filopodia occurrence (percentage of replicates per mouse where at least one filopodium was observed) after the photodamage (C4,D4,E4), paired two-sided Wilcoxon test was used for comparisons (Spine-PD, n = 16 mice, 47 dendrites; Near-Spine-PD, n = 16, 35 dendrites; Near-Bouton-PD, n = 14, 34 axons). All data points indicate the average value per mouse. Significant differences are shown as *p<0.05; **p<0.01; ***p<0.001; ns - not significant. Figure 1—Videos 1–3 correspond to images shown in panels (C1), (D1), and (E1), respectively.
-
Figure 1—source data 1
Time-course analysis for microglia-neuron contact area and turnover before and after PD and between experiments (Spine-PD, Near-Spine-PD and Near-Bouton-PD).
*p-value after GEE analysis.
- https://cdn.elifesciences.org/articles/58435/elife-58435-fig1-data1-v2.xlsx
-
Figure 1—source data 2
Analysis of structural changes induced by different types of photodamage (Spine-PD, Near-Spine-PD and Near-Bouton-PD).
Data were combined across 13 time points to compute the average values of each parameter over 2 hr. For this analysis, replicates were averaged per mouse. *p-values correspond to the Wilcoxon paired test.
- https://cdn.elifesciences.org/articles/58435/elife-58435-fig1-data2-v2.xlsx
-
Figure 1—source data 3
These data sets contain the mean values of each parameter per animal, related to each panel in Figure 1.
- https://cdn.elifesciences.org/articles/58435/elife-58435-fig1-data3-v2.xlsx
Figure 1—figure supplement 1
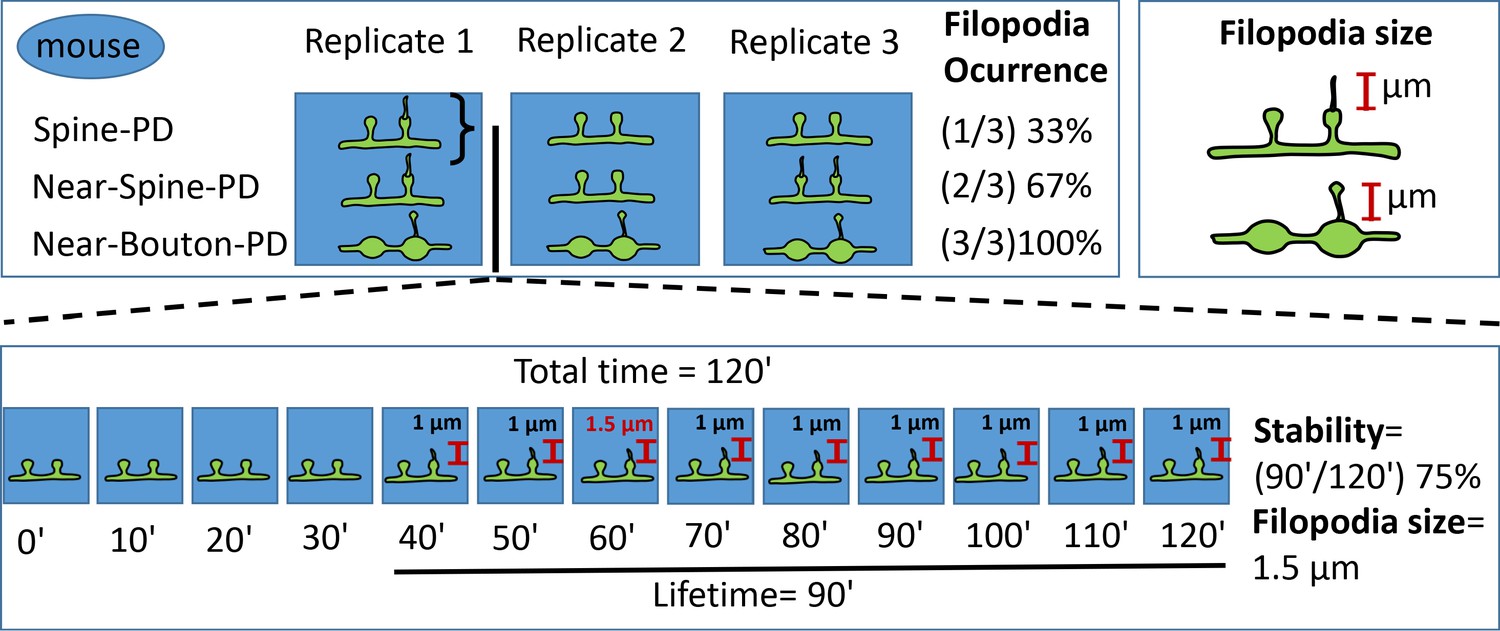
Scheme illustrating filopodia quantification for spines and boutons.
For each mouse, three replicates of three different photodamage types (Spine-PD, Near-Spine-PD and Near-Bouton-PD) were obtained. Each replicate contains 13 timepoints taken before (0 min) and after the photodamage (10 min −120 min). Three parameters were calculated to describe filopodia formation: filopodia occurrence %, size and stability %. Filopodia occurrence was calculated based on the number of replicates and a single value was obtained per mouse. Filopodia size was calculated as the maximum size observed during 120 min in each replicate. Filopodia stability was calculated as the total time that the filopodia was evident divided by the total time and expressed in %. To generate a single value per mouse, the values of filopodia stability and size per each replicate were averaged per animal.
Figure 1—figure supplement 2
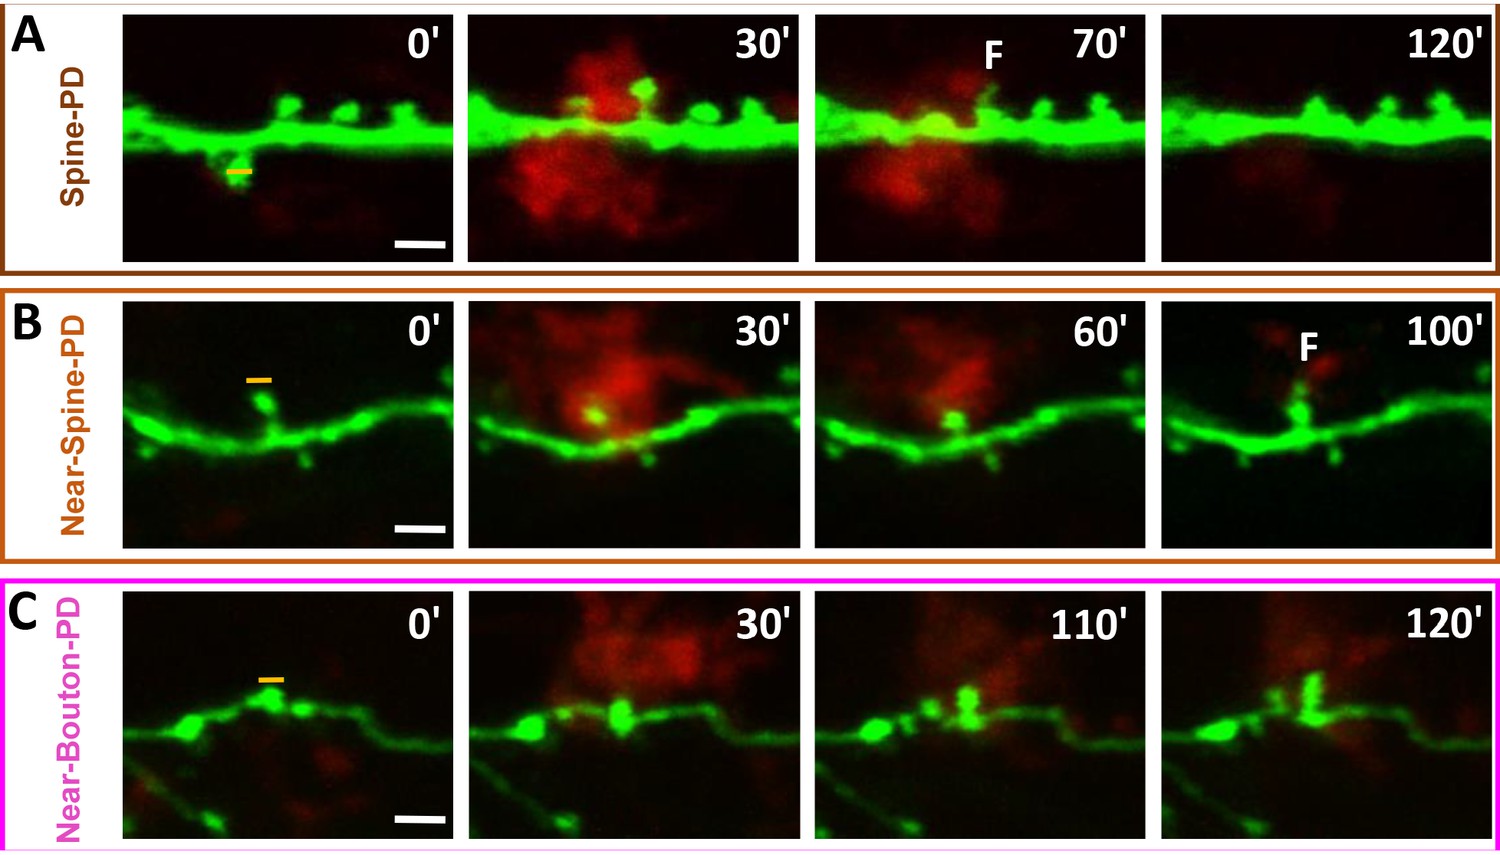
Time-lapse sequences of filopodia formation from spines and boutons after photodamage.
(A) Formation of filopodium protruding from the head of a spine contacted by microglia after photodamage. Such transient filopodia formation occurred after photodamage from spines close to the target position. (B) Formation of head filopodia from the targeted spine after and during microglia contact. (C) Filopodia formation from the targeted and adjacent boutons after photodamage. All structures with filopodia formation were contacted by microglia (orange line points to the photodamage position; scale bar in white, 3 µm). Figure 1—Videos 4–6 correspond to images shown in panels (A), (B), and (C), respectively.
Figure 1—video 1
Structural changes after Spine-PD (10' - 120') compared with a basal image (0’).
The position of PD target is marked by an orange line. A dendrite, microglial process and contact between them are shown in green, red, and yellow, respectively.
Figure 1—video 2
Structural changes after Near-Spine-PD (10' - 120') compared with a basal image (0’).
The position of PD target is marked by an orange line. A dendrite, microglial process and contact between them are shown in green, red, and yellow, respectively.
Figure 1—video 3
Structural changes after Near-Bouton-PD (10' - 120') compared with a basal image (0’).
The position of PD target is marked by an orange line. An axon, microglial process and contact between them are shown in green, red, and yellow, respectively.
Figure 1—video 4
Formation of transient head filopodium from a spine adjacent to the microglia-contacted structure selected for PD.
The position of PD target is marked by an orange line. A dendrite, microglial process and contact between them are shown in green, red, and yellow, respectively.
Figure 1—video 5
Head filopodia formation from the spine near to PD after microglia contact in a Near-Spine-PD experiment.
The position of PD target is marked by an orange line. A dendrite, microglial process and contact between them are shown in green, red, and yellow, respectively.
Figure 1—video 6
Formation of filopodia from both adjacent and targeted boutons during microglia contact and after Near-Bouton-PD.
The position of PD target is marked by an orange line. An axon, microglial process and contact between them are shown in green, red, and yellow, respectively.
Figure 2
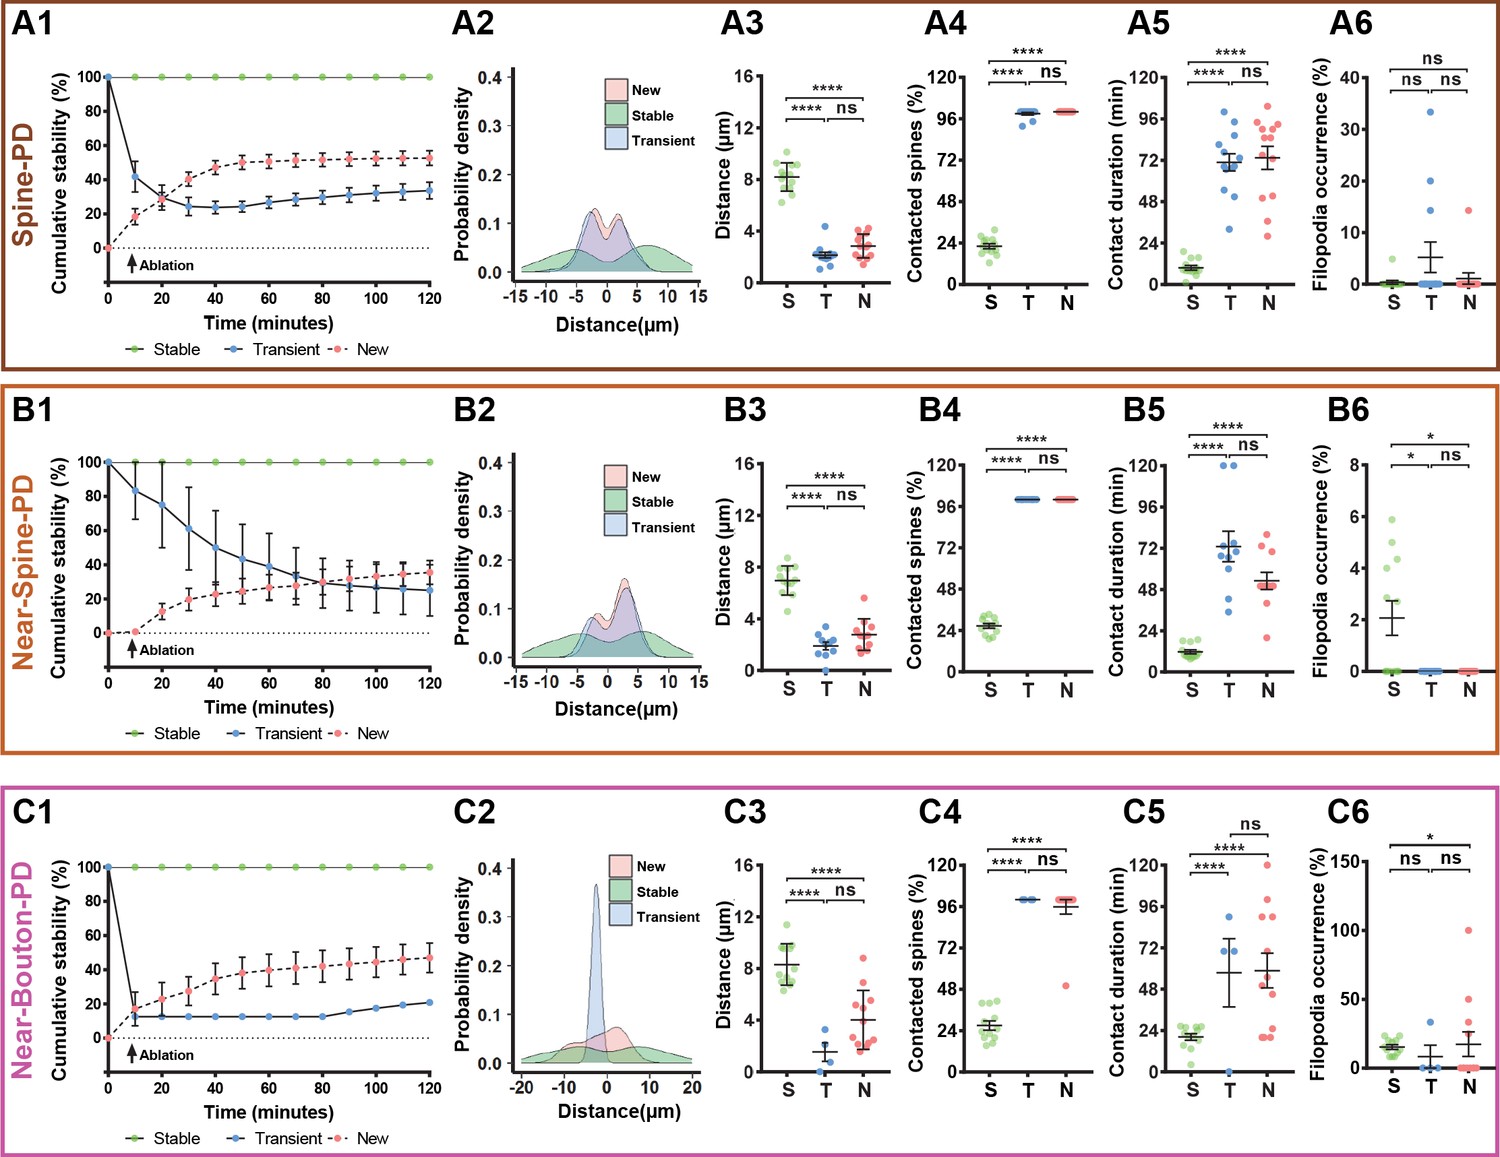
Characterization of microglia interaction with spines and boutons after photodamage.
Spines or boutons (which were studied after PD of spine (A1–A6), near to spine (B1–B6) and near to bouton (C1–C6) were categorized according to their stability as stable (defined as the spines or boutons that persisted for 120 min), transient (defined as existing spines or boutons that can disappear or reappear during the 120 min studied) or new (defined as newly formed spines) and averaged per mouse. The total sample size was for Spine-PD: n = 16 mice, 47 dendrites, 700 spines (Stable = 506, New = 61, Transient = 133); for Near-Spine-PD: n = 16 mice, 35 dendrites, 490 spines (Stable = 439, New = 24, Transient = 27); for Near-Bouton-PD: n = 14 mice, 34 axons, 230 boutons (Stable = 196, New = 27, Transient = 7). Left graphs show cumulative stability percentage curves (A1,B1,C1), highlighting a separation between the three categories of spines/boutons according to their stability (dots represents the mean value per time). The distribution of spines and boutons across dendrite and axons are shown in A2,B2,C2. 0 value in X axis represents the position of the selected spine or bouton for photodamage, which were not included in these plots. From middle to right graphs (Spine-PD: Stable 16 mice/45 dendrites/506 spines, New 14/37/61, Transient 14/42/133; Near-Spine-PD: Stable 16 mice/35 dendrites/439 spines, New 15/20/24, Transient 13/17/27; Near-Bouton-PD: Stable 14 mice/35 axons/196 boutons, New 14/25/27, Transient 5/6/7), quantification of the distance between each individual spine/bouton with the targeted PD position (A3,B3,C3), the number of spines/boutons that had been contacted by microglia during 2-hour imaging session (A4,B4,C4), duration of microglia contact with individual spines and boutons (A5,B5,C5), and filopodia occurrence rate (A6,B6,C6) after microglial contact with damaged and near damaged spines or boutons. Means and s.e.m. as error bars are showed in all plots and each dot represents an animal. Statistical significance is represented by asterisks (*p<0.05; **p<0.01; ***p<0.001; ****p<0.0001; ns - not significant) for multiple comparisons after paired two-sided Wilcoxon test.
-
Figure 2—source data 1
These data sets contain the mean values of each parameter per animal, related to each panel in Figure 2.
- https://cdn.elifesciences.org/articles/58435/elife-58435-fig2-data1-v2.xlsx
Figure 3 with 5 supplements
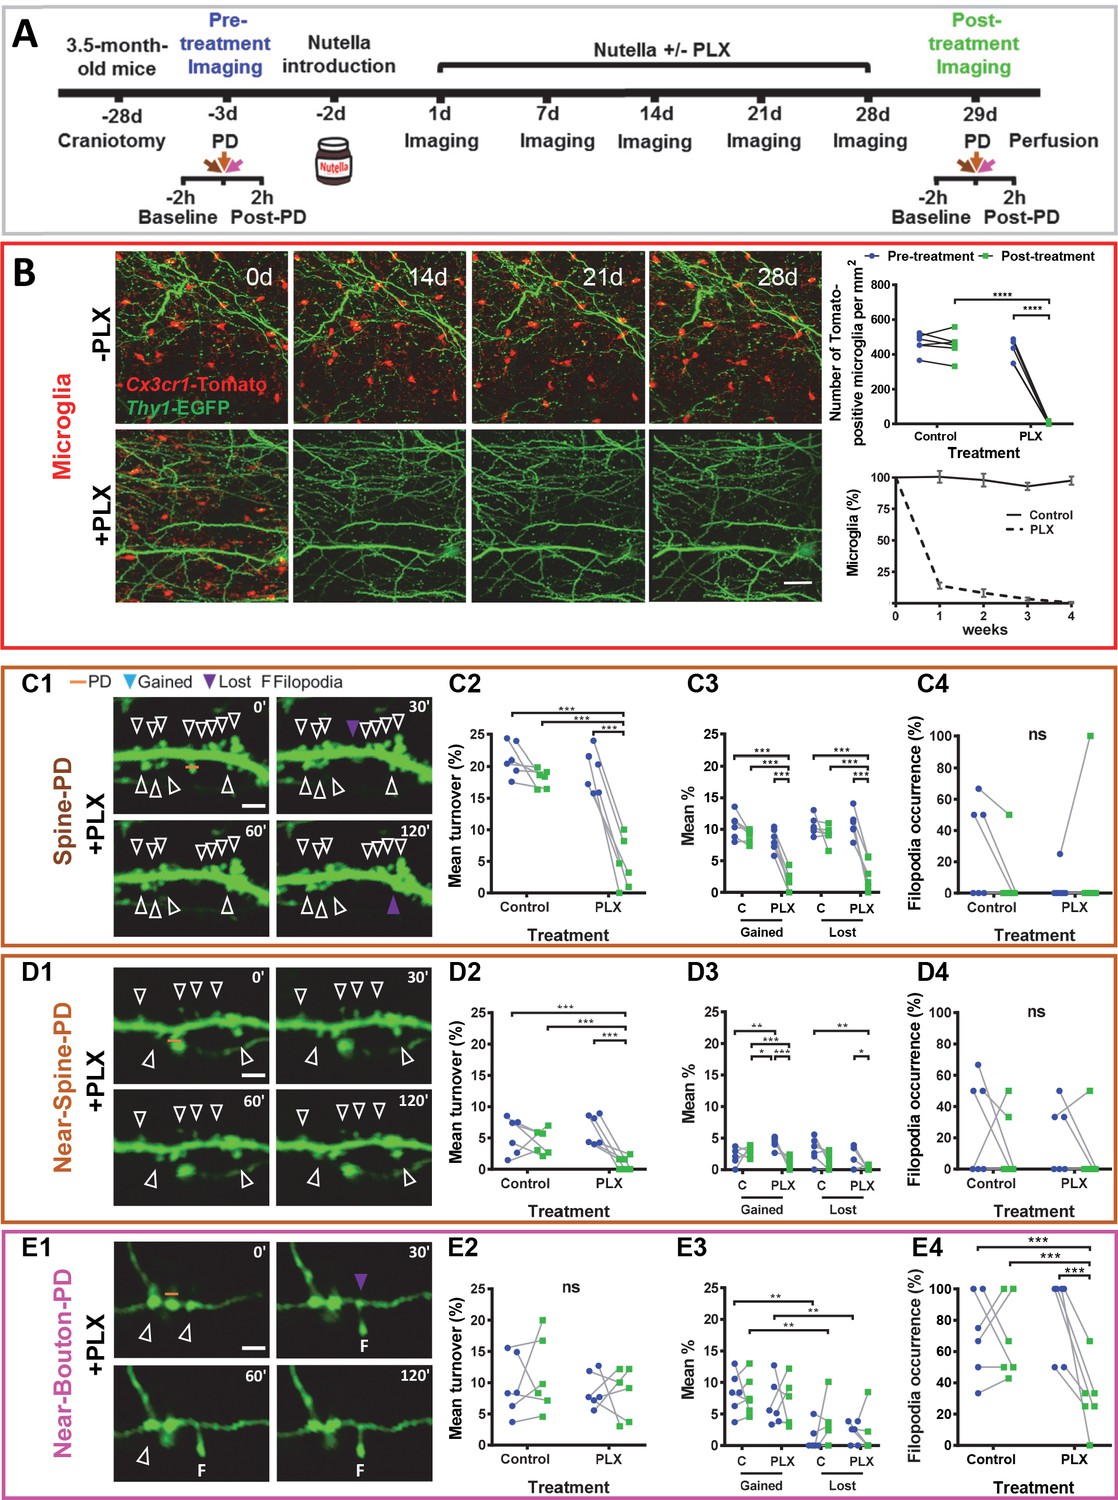
Microglia depletion prevents synaptic photodamage-induced spine turnover and bouton filopodia formation in the RSC.
(A) Experimental design. (B) Representative images of microglia (red) from a control mouse (-PLX) and a mouse treated with PLX3397 (+PLX) mixed with Nutella. Scale bar, 50 µm. The upper-right graph shows the quantification of microglia depletion before (blue) and after 4 weeks of treatment with PLX3397 (green) in the control and treated groups. Significant depletion was found only after the treatment with PLX3397 (p<0.001) (n = 6 mice for each group). The lower graph (mean+ s.e.m.) shows the percentage of surviving microglia in control and treated mice (n = 4 mice for each group). (C,D,E) Summary results for three types of PD experiments. From left to right: representative time-lapse imaging of dendrites and axons before (0') and after the photodamage (30', 60', 120') (C1,D1,E1). PD laser targets are marked by orange lines. No evidence of microglial processes or direct colocalization was found. The following panels show the change in overall mean turnover (C2,D2,E2), mean percentage of spines gained and lost (C3,D3,E3), and filopodia occurrence (C4,D4,E4) before (blue) and after the PLX3397 treatment (green) in the control and treated groups (For Spine-PD: Control-Pre, n = 6 mice, 18 dendrites; Control-Post, n = 6, 15 dendrites; PLX-Pre, n = 6, 23 dendrites; PLX-Post, n = 6, 16 dendrites. For Near-Spine-PD: Control-Pre, n = 6 mice, 13 dendrites; Control-Post, n = 6, 18 dendrites; PLX-Pre, n = 6, 18 dendrites; PLX-Post, n = 6, 16 dendrites. For Near-Bouton-PD: Control-Pre, n = 6 mice, 16 axons; Control-Post, n = 6, 20 axons; PLX-Pre, n = 6, 14 axons; PLX-Post, n = 6, 20 axons). Data points indicate the average value per mouse. *p<0.05; **p<0.01; ***p<0.001, ns - not significant for GEE post-hoc pairwise comparison with Tukey method (Figure 3—source datas 1 and 2). Figure 3—Videos 1–3 correspond to images shown in panels (C1), (D1), and (E1), respectively. See also Figure 3—figure supplements 1 and 2.
-
Figure 3—source data 1
GEE analysis of structural changes induced by different types of photodamage (Spine-PD, Near-Spine-PD and Near-Bouton-PD).
The GEE analysis was used to test whether the mean changes of each parameter (Mean Turnover %, Mean Gained %, Mean Lost %, Filopodia Occurrence %) from pre- to post-treatment measurements were different in the two treatment groups (Control and PLX). GEE models for each parameter were built as follows: time (pre- and post-treatment measurements) as repeated measures (with independent correlation structure), treatment groups (PLX and Control) as a fixed factor, time as a covariate and the interaction term between treatment and groups. For this analysis, we used the averaged values per mice. The confidence level used was 0.95.
- https://cdn.elifesciences.org/articles/58435/elife-58435-fig3-data1-v2.xlsx
-
Figure 3—source data 2
Tukey’s post-hoc tests of structural changes induced by different types of photodamage (Spine-PD, Near-Spine-PD and Near-Bouton-PD).
- https://cdn.elifesciences.org/articles/58435/elife-58435-fig3-data2-v2.xlsx
-
Figure 3—source data 3
These data sets contain the mean values of each parameter per animal, related to each panel in Figure 3.
- https://cdn.elifesciences.org/articles/58435/elife-58435-fig3-data3-v2.xlsx
Figure 3—figure supplement 1
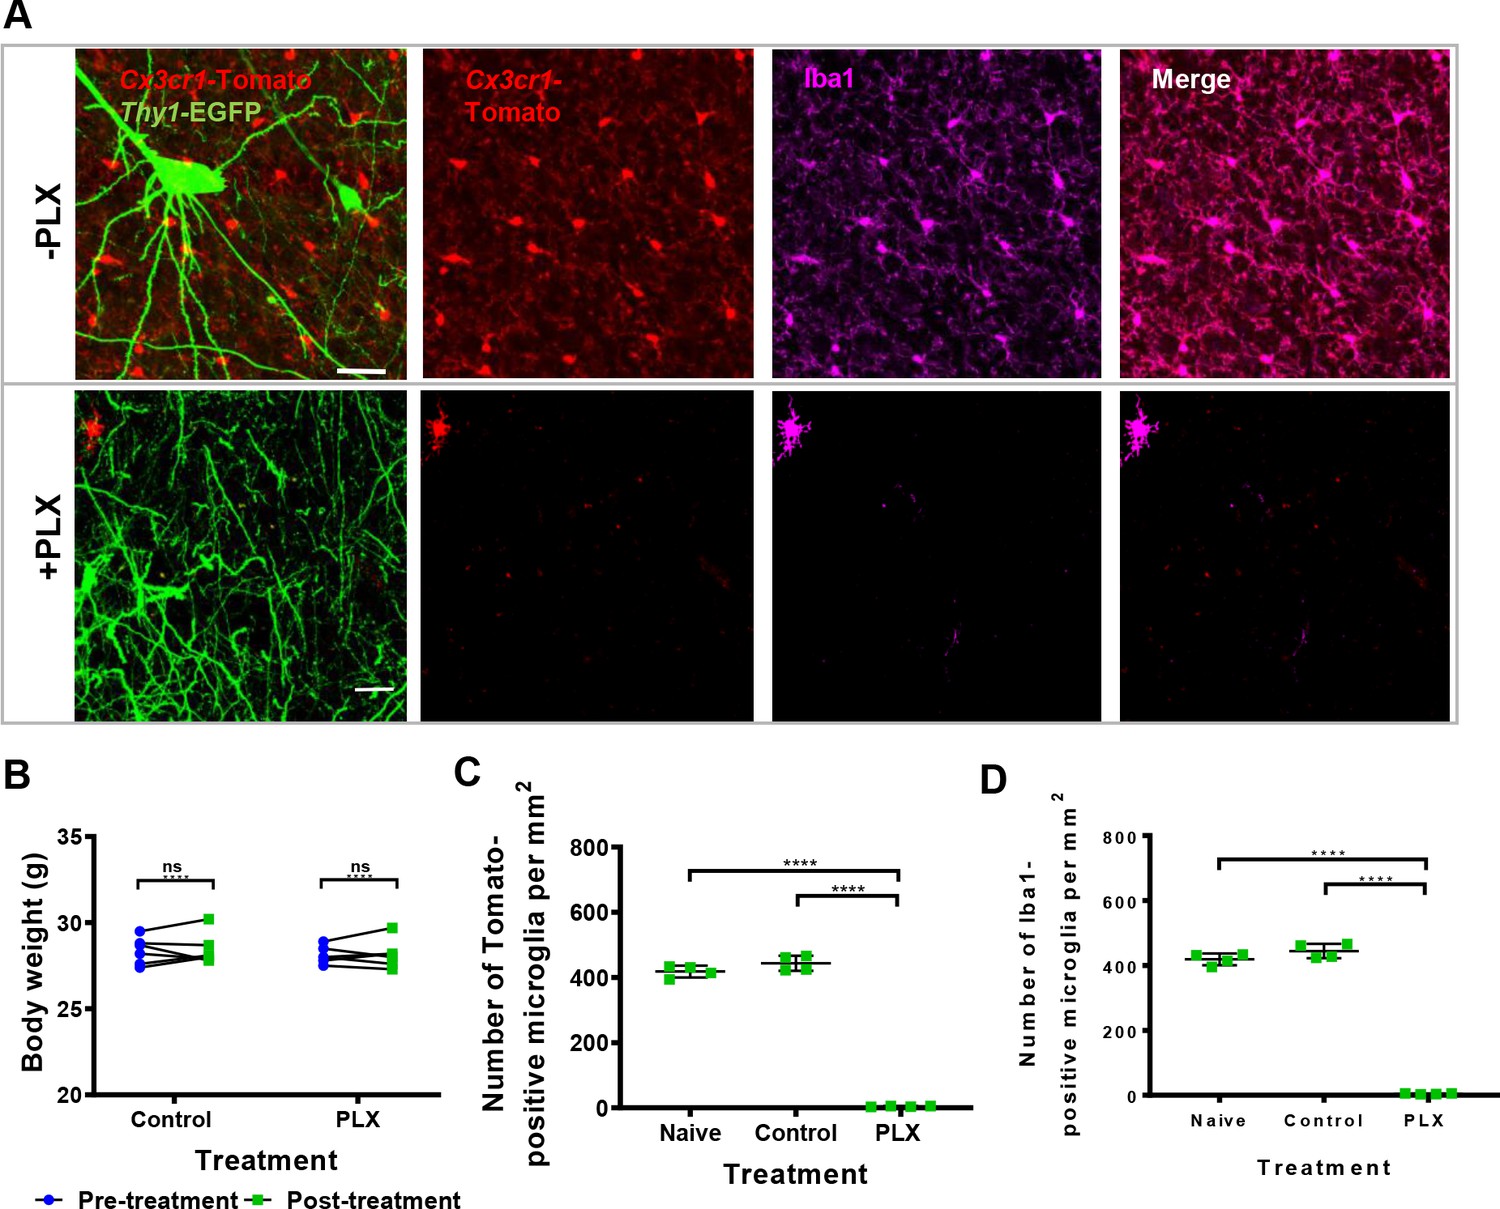
Ex-vivo confirmation of microglia depletion after the administration of PLX.
(A) Immunofluorescence confocal imaging of microglia shows colocalization of Cx3cr1 promoter-driven expression of dtTomato and endogenous expression of Iba1 after 4 weeks of treatment in control (PLX-) and PLX-treated mice (PLX+). (B) Changes in body weight (pre- versus post-treatment) in both control and treated groups (n = 6 for each group). (C,D) Quantification of the number of dtTomato- and Iba-1-positive microglia cells per mm2 after 4 weeks of treatment in fixed brain sections from normal chow-fed (naïve, n = 4 mice, three fields per mouse), Nutella-fed (control, n = 4 mice, three fields per mouse) and PLX mixed with Nutella-fed (PLX, n = 4 mice, three fields per mouse) mice. Points represent mean values per mouse. Significant differences are showed by asterisks: *p<0.05; **p<0.01; ***p<0.001; ****p<0.0001; ns - not significant, for two-sided Mann-Whitney U-test.
-
Figure 3—figure supplement 1—source data 1
These data sets contain the mean value of each parameter per animal, related to each panel in Figure 3—figure supplement 1.
- https://cdn.elifesciences.org/articles/58435/elife-58435-fig3-figsupp1-data1-v2.xlsx
Figure 3—figure supplement 2

Baseline evaluation and filopodia characterization.
Before performing the photoablation, specific dendritic and axonal segments were tracked for two hour-baseline, and the cumulative turnover was calculated before and after the treatment and between groups (control and PLX). Points represent mean values per mouse and error bars represent the SEM values. (A), (E,I) Comparison of densities of spines and boutons before and after the treatment and between groups. (B), (F,J) Cumulative turnover during the baseline pre- and post-treatment and between groups (control and PLX) (total number of mice/dendrites or axons showed are For Spine-PD: Control-Pre 6/18, Control-Post 6/15, PLX-Pre 6/23, PLX-Post 6/16; For Near-Spine-PD: Control-Pre 6/13, Control-Post 6/18; PLX-Pre 6/18, PLX-Post 6/16; For Near-Bouton-PD: Control-Pre 6/16, Control-Post 6/20, PLX-Pre 6/14, PLX-Post 6/20). (C,G,K) Changes of the length and D,H,L the stability of filopodia (includes only experiments/animals where filopodia were observed: For Spine-PD: Control-Pre, n = 3 mice, four dendrites, five filopodia; Control-Post, n = 1 mouse, one dendrite, one filopodium; PLX-Pre, n = 1, one dendrite, one filopodium; PLX-Post, n = 1, three dendrites, three filopodia. For Near-Spine-PD: Control-Pre, n = 3, four dendrites, four filopodia; Control-Post, n = 2, two dendrites, two filopodia; PLX-Pre, n = 3, three dendrites, three filopodia; PLX-Post, n = 1, one dendrite, one filopodium. For Near-Bouton-PD: Control-Pre, n = 5, 10 axons, 14 filopodia; Control-Post, n = 6, 13 axons, 14 filopodia events; PLX-Pre, n = 6, 12 axons, 16 filopodia; PLX-Post, n = 5, seven axons, seven filopodia). Comparisons between pre- and post-treatment and between groups were performed. Statistical significance is represented by asterisks: *p<0.05; **p<0.01; ***p<0.001; ****p<0.0001; ns - not significant for multiple comparisons after GEE analysis.
-
Figure 3—figure supplement 2—source data 1
These data sets contain the mean of each parameter per animal, related to each panel in Figure 3—figure supplement 2.
- https://cdn.elifesciences.org/articles/58435/elife-58435-fig3-figsupp2-data1-v2.xlsx
Figure 3—video 1
Structural changes after Spine-PD (10' - 120') compared with a basal image (0’) in a microglia-depleted brain.
The position of PD target is marked by an orange line. A dendrite and microglial process are shown in green and red, respectively. No putative contact between both cells was evident in these images.
Figure 3—video 2
Structural changes after Near-Spine-PD (10' - 120') compared with a basal image (0’) in a microglia-depleted brain.
The position of PD target is marked by an orange line. A dendrite and microglial process are shown in green and red, respectively. No putative contact between both cells was evident in these images.
Figure 3—video 3
Structural changes after Near-Bouton-PD (10' - 120') compared with a basal image (0’) in a microglia-depleted.
The position of PD target is marked by an orange line. A dendrite and microglial process are shown in green and red, respectively. No putative contact between both cells was evident in these images.
Tables
Key resources table
| Reagent type (species) or resource | Designation | Source or reference | Identifiers | Additional information |
|---|---|---|---|---|
| Strain, strain background (Mice) | Gt(ROSA)26Sortm9(CAG-tdTomato)Hze | The Jackson Laboratories | Stock No: 007905 RRID:IMSR_JAX:007905 | On C57BL/6 background |
| Strain, strain background (Mice) | Cx3cr1tm2.1(cre/ERT2)Jung | The Jackson Laboratories | Stock No: 020940 RRID:IMSR_JAX:020940 | On C57BL/6 background |
| Strain, strain background (Mice) | Tg(Thy1-EGFP)MJrs | The Jackson Laboratories | Stock No: 007788 RRID:IMSR_JAX:007788 | On C57BL/6 background |
| Antibody | anti-Iba1, rabbit polyclonal antibody | Wako | Cat# 019–19741, RRID:AB_839504 | IF(1:500) |
| Chemical compound, drug | PLX3397 | MedChemExpress | HY-16749/CS-4256 | |
| Software, algorithm | Fiji | http://imagej.net/Fiji | RRID:SCR_002285 | |
| Software, algorithm | R | (https://www.R-project.org/) R Foundation for Statistical Computing | RRID:SCR_001905 | |
| Software, algorithm | GraphPad Prism | GraphPad Software (http://www.graphpad.com/) | RRID:SCR_002798 |
Additional files
-
Source code 1
R code for GEE analysis.
- https://cdn.elifesciences.org/articles/58435/elife-58435-code1-v2.txt.zip
-
Transparent reporting form
- https://cdn.elifesciences.org/articles/58435/elife-58435-transrepform-v2.docx
Download links
A two-part list of links to download the article, or parts of the article, in various formats.
Downloads (link to download the article as PDF)
Open citations (links to open the citations from this article in various online reference manager services)
Cite this article (links to download the citations from this article in formats compatible with various reference manager tools)
Light-induced engagement of microglia to focally remodel synapses in the adult brain
eLife 9:e58435.
https://doi.org/10.7554/eLife.58435


