Manipulation of the human tRNA pool reveals distinct tRNA sets that act in cellular proliferation or cell cycle arrest
- Department of Molecular Genetics, Weizmann Institute of Science, Israel
- Department of Molecular Cell Biology, Weizmann Institute of Science, Israel
Figures
Figure 1 with 1 supplement
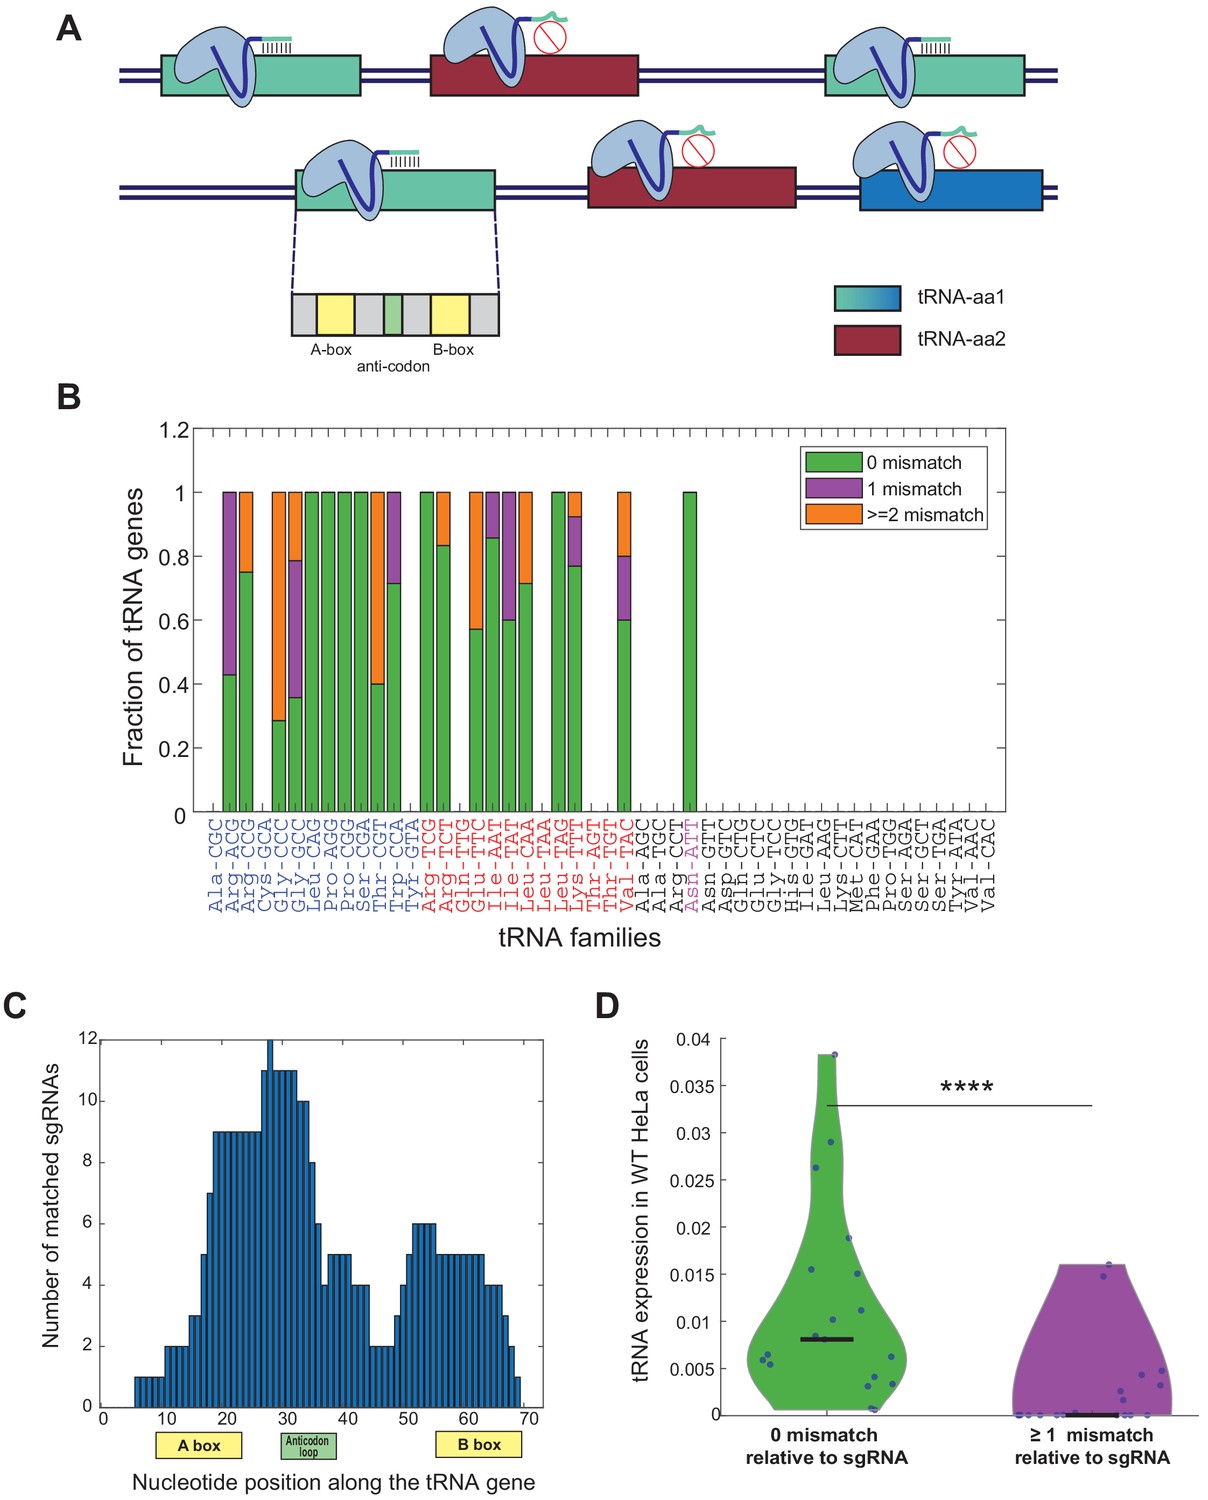
sgRNA library design for genomic editing of human tRNA genes.
(A) A schema illustrating the sgRNA design for tRNA targeting. The hypothetical tRNA-aa1 family (blue tRNA genes) is targeted by the light-blue sgRNA. Three out of the four tRNA genes (light blue tRNA genes) are fully match to the sgRNA sequence, while the fourth gene has sequence dissimilarities (dark blue tRNA gene), thus predicted not to be targeted by the sgRNA. The hypothetical tRNA-aa2 family (bordeaux tRNA genes) is not predicted to be targeted by the light-blue sgRNA, due to lack of complementarity between the sequences. In addition, the sgRNAs are designed to target functional sequence regions along the tRNA gene to maximize the manipulation effect on the targeted tRNA. (B) A bar plot representing the sequence similarity of the tRNA genes to the corresponding sgRNAs. Each bar denotes a tRNA family in the human genome, overall, 19 out of the 46 tRNA families and one (AsnATT) out of two pseudo tRNA families were targeted. The y-axis denotes the fraction of CRISPR-targeted tRNA genes for each tRNA family (considering only tRNA genes with tRNA score >50, except of the pseudogene AsnATT tRNA family which consists of two genes with tRNA score <50 (colored in pink) [Lowe and Chan, 2016]). The colors in the bars describe the variety of sequence similarity of the tRNA family to the sgRNA sequence (full match in green, one mismatch in purple and two or more mismatches in orange). The tRNA identity is colored according to the differentiation (blue)/proliferation (red)/others (black) classification. (C) A histogram of the location of the sgRNA sequences along the tRNA genes. The x-axis depicts the nucleotide position along the tRNA, with the A box, B box, and the anticodon loop marked. The y-axis depicts the number of sgRNAs that are complementary to each nucleotide. (D) A violin plot describing the distribution of expression levels, in WT HeLa cells, of perfectly matched and non-perfectly matched tRNA genes to their corresponding sgRNAs. The expression of each tRNA family in HeLa cells was calculated by the sum expression of the tRNA genes, averaged over two biological repeats. The distributions are significantly different, -Wilcoxon rank-sum test, p<10−4.
-
Figure 1—source data 1
sgRNA sequences.
- https://cdn.elifesciences.org/articles/58461/elife-58461-fig1-data1-v2.xlsx
Figure 1—figure supplement 1
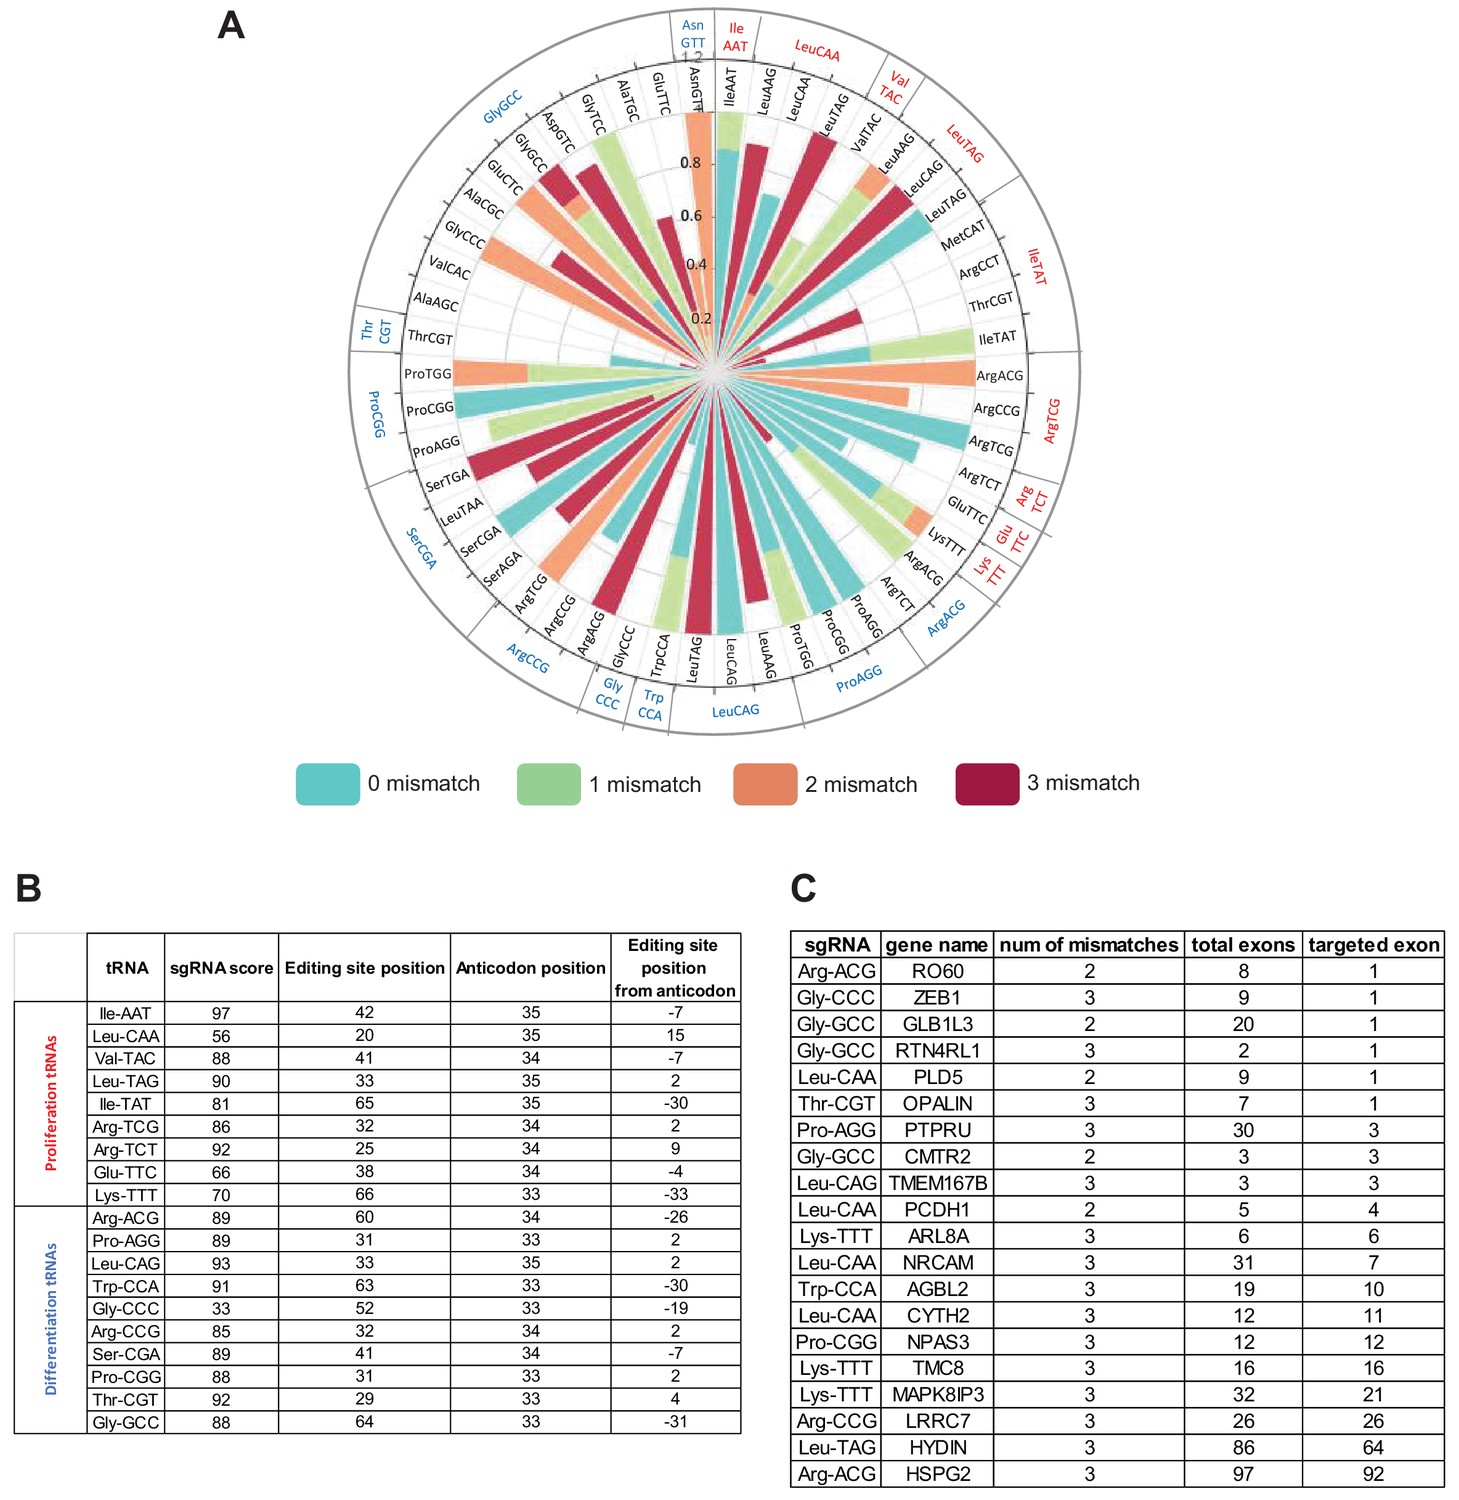
sgRNA targeting parameters and OFF-targets potential.
(A) A rose chart representing the tRNA targets of the sgRNA library. For each sgRNA (presented in the outmost circle), the tRNA families that are considered as potential targets (both ON-targets and OFF-targets) are detailed in the middle circle. The bars in the innermost circle indicate, for each tRNA family, the fraction of genes with 0 mismatches (blue) one mismatch (green) two mismatches (orange) and three mismatches (Bordeaux). (B) A table representing various parameters of the sgRNA library. The sgRNA parameters include the score for each sgRNA as well as the editing position. The sgRNA score was determined using CHOP-CHOP, a CRISPR web toolbox (Montague et al., 2014). Also given information regarding the anticodon position and the distance between the editing site and the anticodon. (C) A table describing potential OFF-targets in protein coding genes. For each sgRNA, several parameters are mentioned for each OFF- target gene: the identity of the sgRNA, the OFF-target gene name, number of mismatches relative to the sgRNA sequence, total number of exons and the exon number in which the target site is located.
Figure 2 with 1 supplement
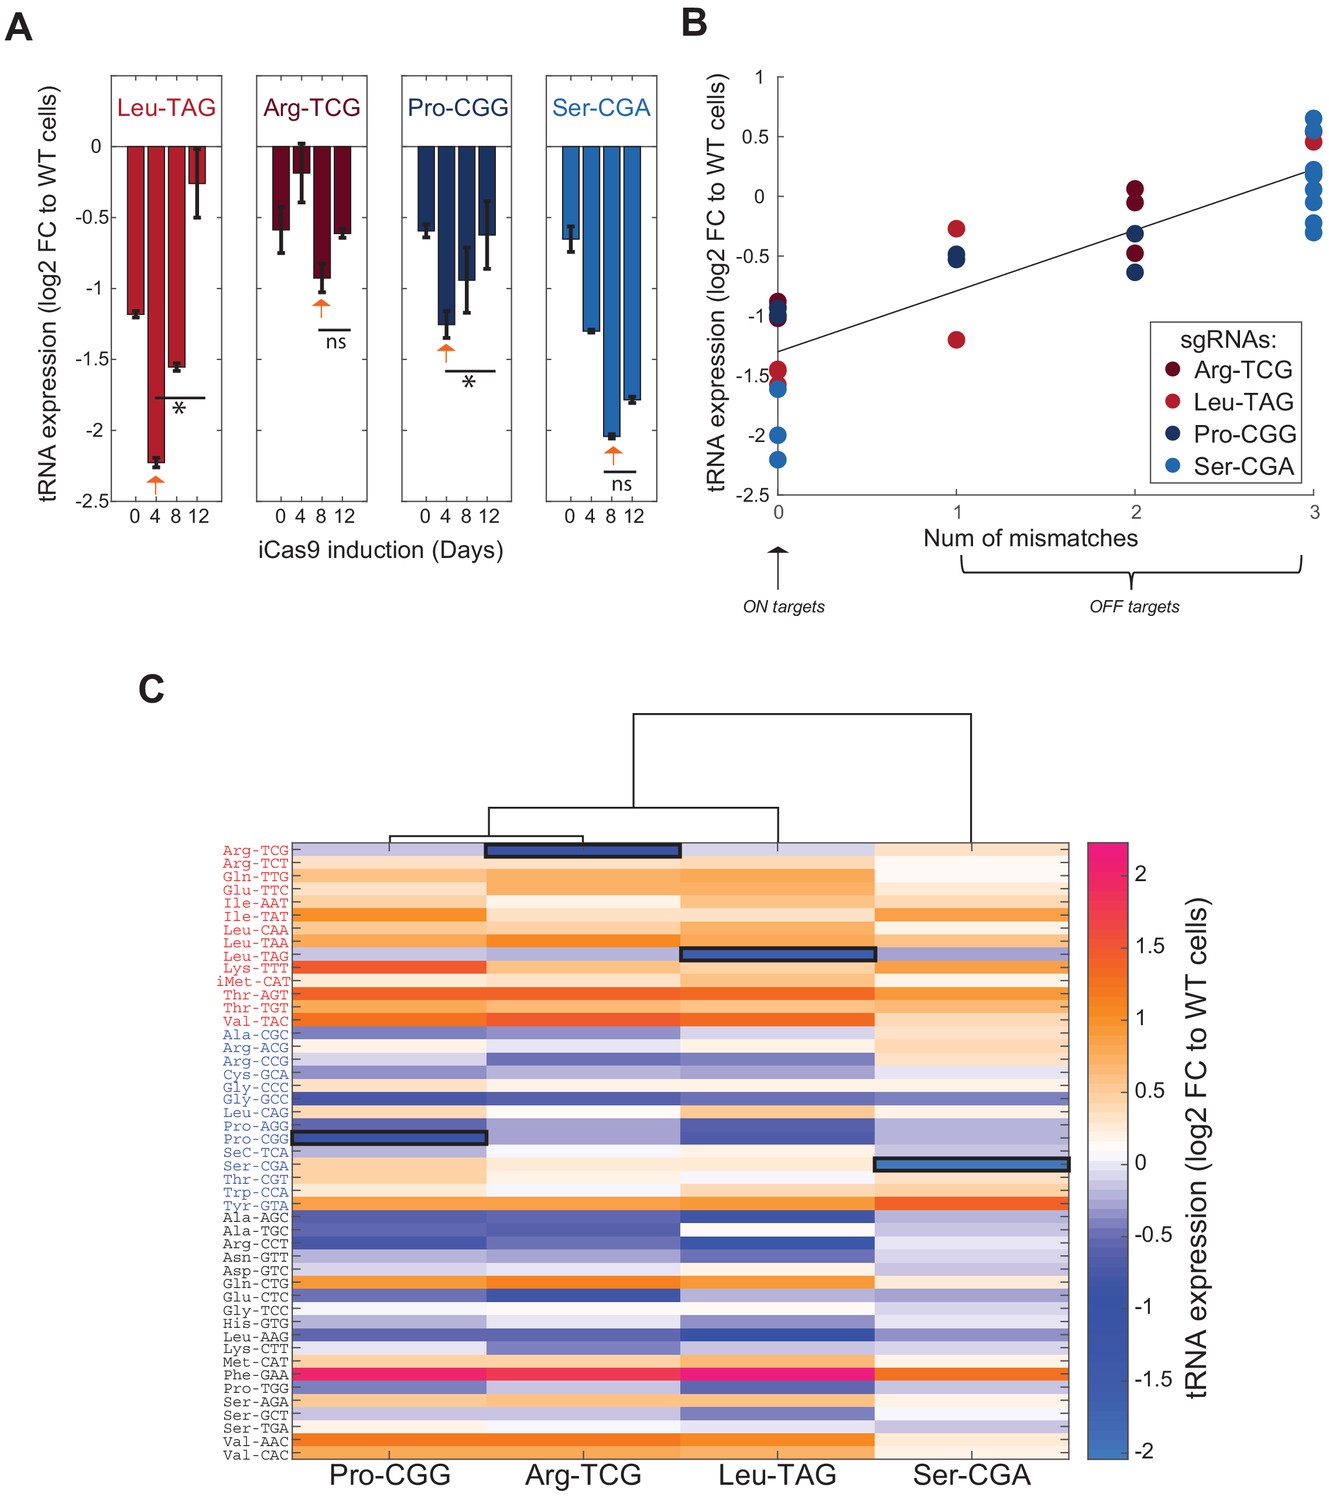
Genomic editing of proliferation-demanded tRNAs exerts a negative selection and a global change in the cellular tRNA pool in HeLa cells.
(A) Bar plots describing the tRNA expression dynamics along the iCas9 induction for each CRISPR-targeted tRNA. The y-axis depicts the fold-change (log2) in the tRNA expression of the CRISPR-targeted tRNA in the treated cells relative to WT cells, summed over all gene members of the CRISPR-targeted tRNA family. Each bar represents a time point during the iCas9 induction (n = 2) and the error bars depicts the standard errors. The orange arrows point on the maximized expression reduction of the CRISPR-targeted tRNA during the iCas9 induction. The two left plots describe the proliferation edited tRNA families and the two left plots describe the differentiation edited tRNA families. * indicates p<0.05 and ns indicates non-significant p-value of two-sample T-tests comparing between the sample with the highest expression reduction and the last time point. (B) A scatter plot of the correlation between the number of mismatches of the CRISPR-targeted tRNAs (both ON-target and OFF-targets) relative to the corresponding sgRNA sequence and their change in expression in CRISPR-targeted HeLa cells (Pearson correlation, r = 0.87, p<10−4). Each dot represents a tRNA gene family with a potential to be targeted by a sgRNA (with 0–3 mismatches), while the sgRNA is indicated by the color. The ON-targets have 0 mismatch, while OFF-targets consists between 1–3 mismatches. The y-axis depicts the fold-change (log2) in the tRNA expression of the potential targets in the CRISPR-treated HeLa cells relative to WT HeLa cells, averaged over two biological repeats. (C) A heat map representing the differential expression of the cellular tRNA pool in CRISPR-targeted tRNA cells. Each column represents a cell population with CRISPR-targeted tRNA family, and each row represents a tRNA isodecoder, grouped by their type (proliferation-red/differentiation-blue/other-black). The color code depicts the fold-change (log2) in tRNA expression in the CRISPR-targeted tRNA sample at day8 of the iCas9 induction relative to the WT sample at the same day, averaged over two biological repeats. The expression level of the ON-target tRNA in each sample is marked in black square. The dendrogram represents the hierarchical clustering of the different CRISPR-targeted tRNA samples based on changes in tRNA expression profile.
-
Figure 2—source data 1
Primer sequences for genomic tRNA sequencing.
- https://cdn.elifesciences.org/articles/58461/elife-58461-fig2-data1-v2.xlsx
Figure 2—figure supplement 1
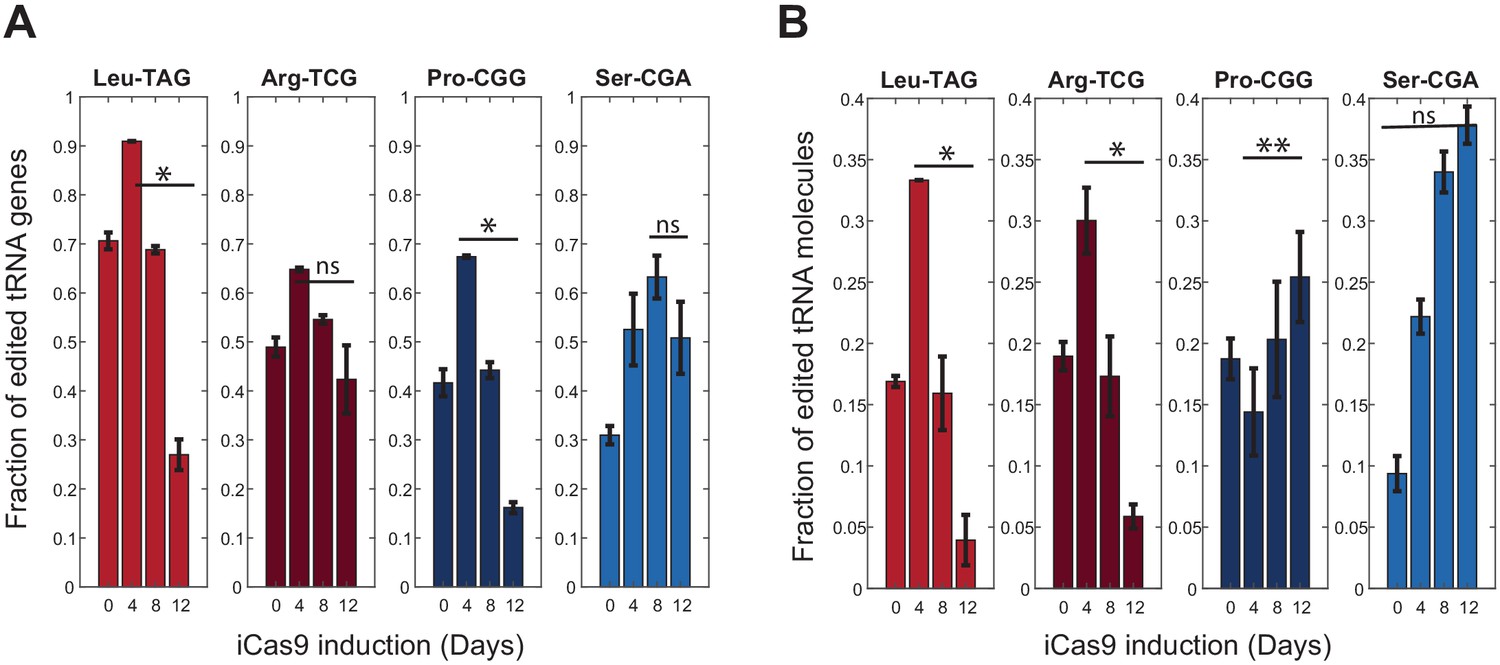
Fraction of edited tRNAs in CRISPR-targeted HeLa cells from genomic and mature tRNA sequencing.
(A) Bar plots describing the changes in the fraction of edited tRNA reads from genomic tRNA sequencing (B) Bar plots describing the changes in the fraction of edited tRNA reads from mature tRNA sequencing. Each bar represents a time point during the iCas9 induction (n = 2), error bars depicts standard errors. The two left plots describe the proliferation CRISPR-targeted tRNA samples and the two left plots describe the differentiation CRISPR-targeted tRNA samples. ** indicates p<0.01, * indicates p<0.05 and ns indicates non-significant p-value of two-sample T-tests comparing between the sample with the highest fraction of edited tRNA reads and the last time point.
Figure 3 with 1 supplement
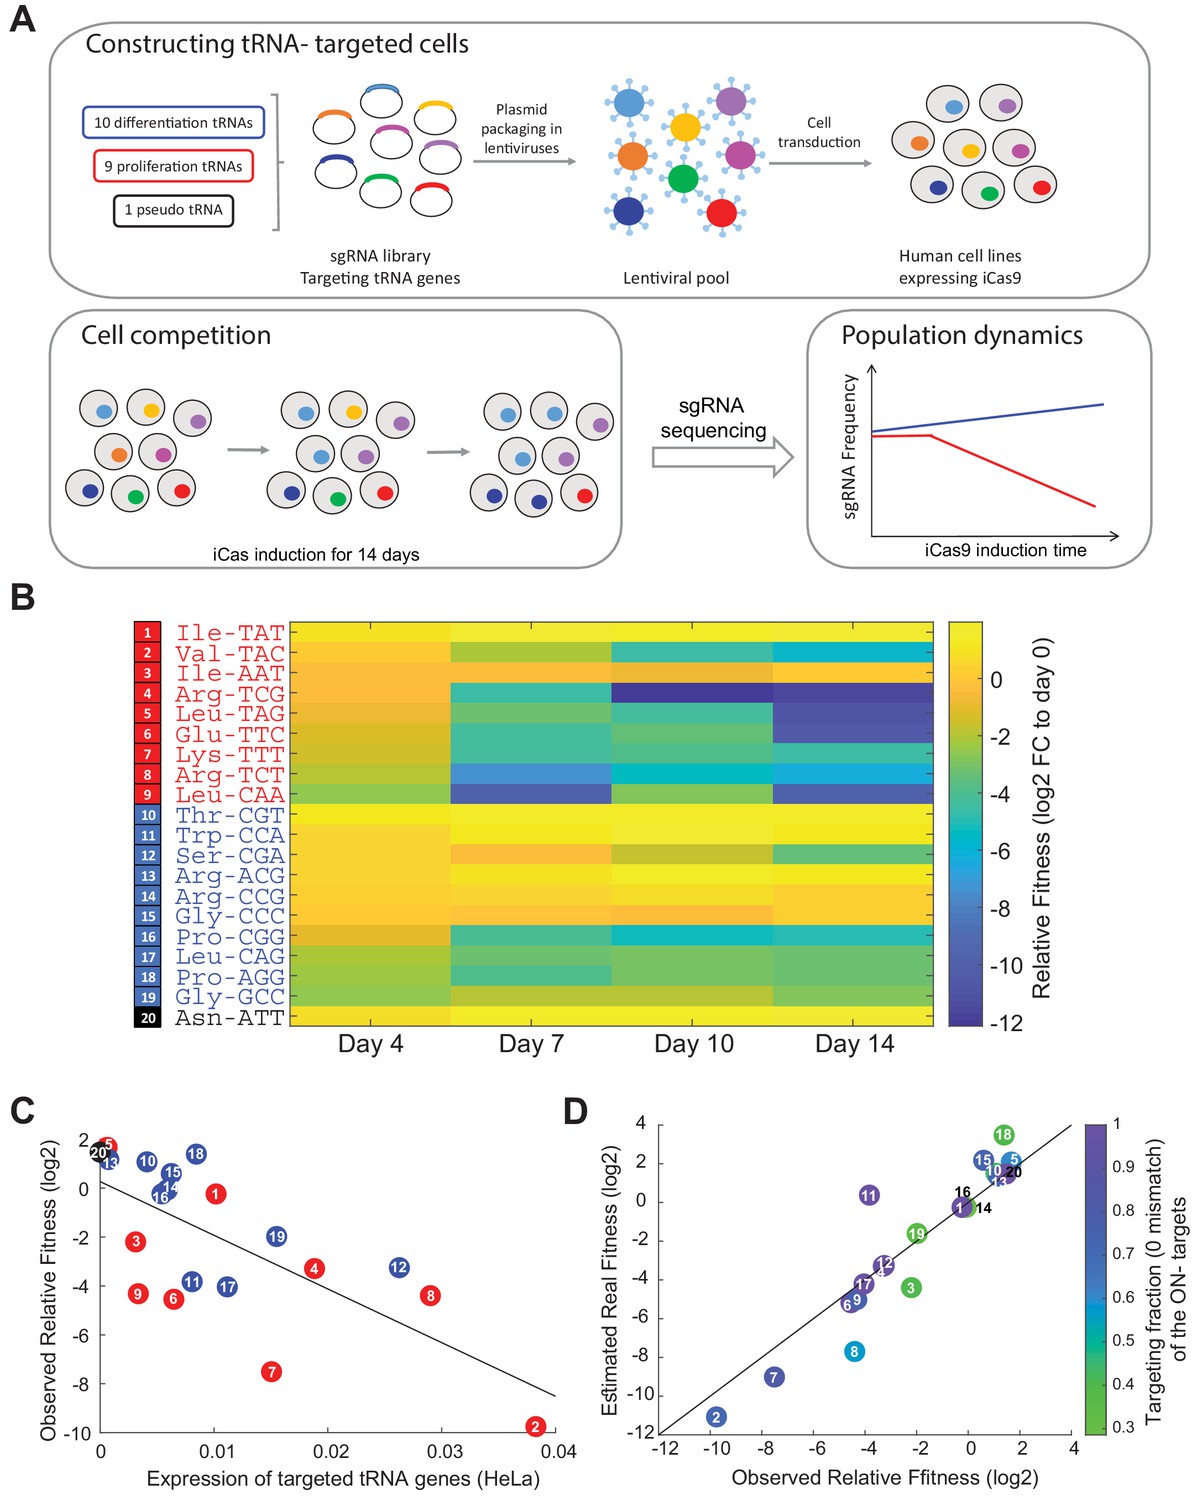
Proliferation-tRNA are essential for cellular growth in HeLa cells.
(A) The experimental design. We designed a CRISPR-sgRNA library, in which each sgRNA targets specific tRNA gene family. Overall, we targeted nine proliferation-tRNAs, 10 differentiation- tRNAs and one pseudo tRNA family. Following cloning of the sgRNAs into a lenti-plasmid, we produced a lenti-viral pool that contained the entire sgRNA pool. Then, we transduced human cell lines (HeLa, WI38 fast and WI38 slow) expressing an inducible Cas9 with the lenti-viral sgRNA pool. We performed a CRISPR-edited tRNA cell competition by induction of the iCas9 in parallel to antibiotic selection (two biological repeats for each cell line). The iCas9 induction continued for 14 days, during which we sampled the heterogonous population every 3–4 days. Lastly, we deep-sequenced the sgRNAs in each sample, to evaluate the growth dynamics of the targeted-tRNA cells. (B) A heat map representation of the relative fitness of CRISPR-targeted tRNA variants in HeLa cells. Each row represents a CRISPR-targeted tRNA variant, colored according to the tRNA classification (proliferation-tRNAs in red, differentiation-tRNAs in blue and pseudo tRNA in black). Each column represents a time point during the iCas9 induction. The color code depicts a proxy of each row’s relative fitness - fold-change (log2) of the sgRNA read frequency in each time point relative to the sgRNA read frequency in day 0 of the iCas9 induction (see Materials and methods). The values were averaged over two biological repeats. (C) A scatter plot of the correlation between the expression of tRNAs in WT HeLa cells and their relative fitness upon CRISPR-targeting (regression model, relative fitness as a linear function of tRNA expression, had a slope of −219.5 and intercept of 0.26; Pearson correlation, r = −0.71, p<10−3). Expression levels for each targeted tRNA families is summed over all isodecoder genes of the family and is averaged over two biological repeats. Observed relative fitness of the CRISPR-targeted tRNA cells is shown given frequency of each tRNA family in day 7 of the competition. The colors and numbers denote the tRNA group. (D) Shown here is the estimated real relative fitness (log2) of each tRNA-targeted HeLa cells based on the observed relative fitness (log2), using a linear equation system. The observed and estimated real essentiality are correlated (regression model, estimated real relative fitness as a linear function of observed relative fitness, had a slope of 1.19 and intercept of 0.37; Pearson correlation, r = 0.93, p<10−5). The color code depicts the fraction of isodecoder genes of each ON-target tRNA family with full complementarity to the respective sgRNA. tRNA numbering in sub figures C and D is identical to those presented in sub figure B.
Figure 3—figure supplement 1
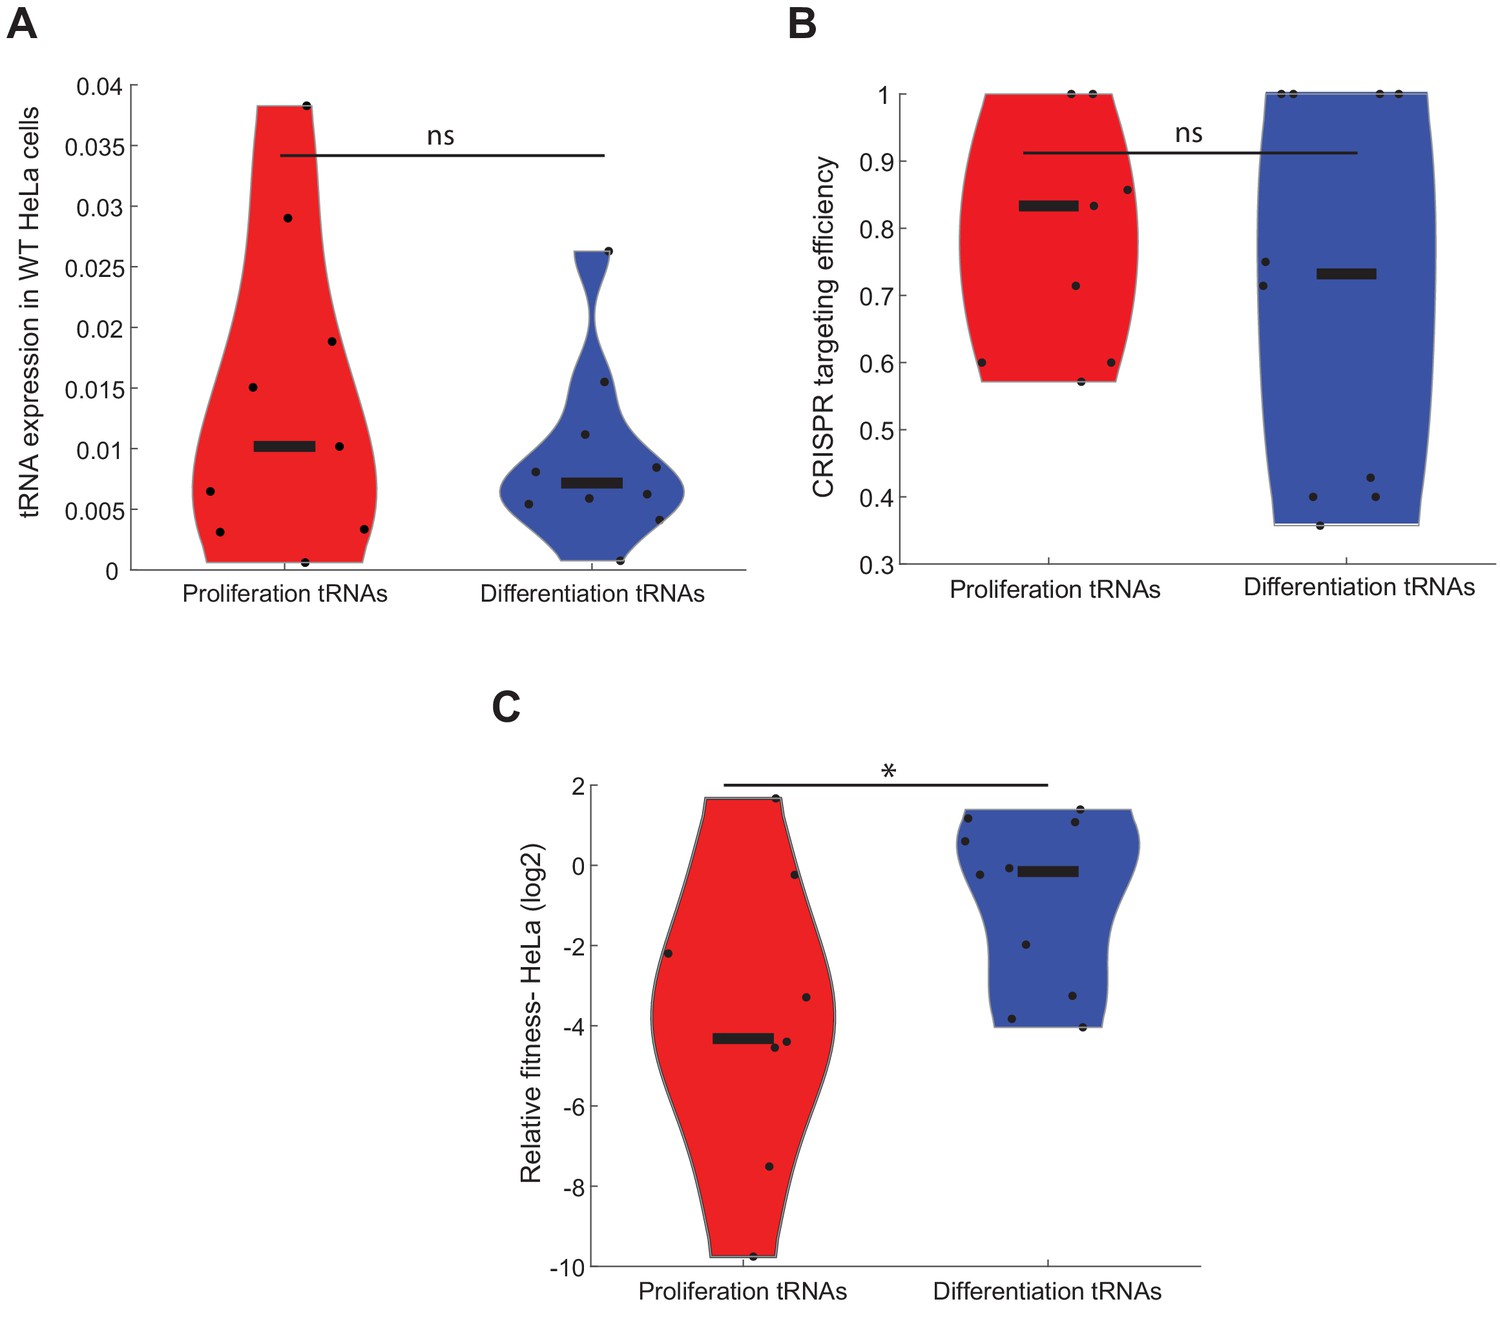
Comparison of tRNA expression, targeting efficiency and relative fitness between differentiation and proliferation-tRNAs.
Comparisons of (A) tRNA expression level in WT cells, (B) targeting efficiency, and (C) relative fitness between targeted proliferation and differentiation-tRNAs in HeLa cells. Each dot depicts a single tRNA family. Wilcoxon rank-sum test was conducted to examine significance of difference between the distributions (* indicates p<0.05, ns indicates non- significant p value).
Figure 4 with 3 supplements
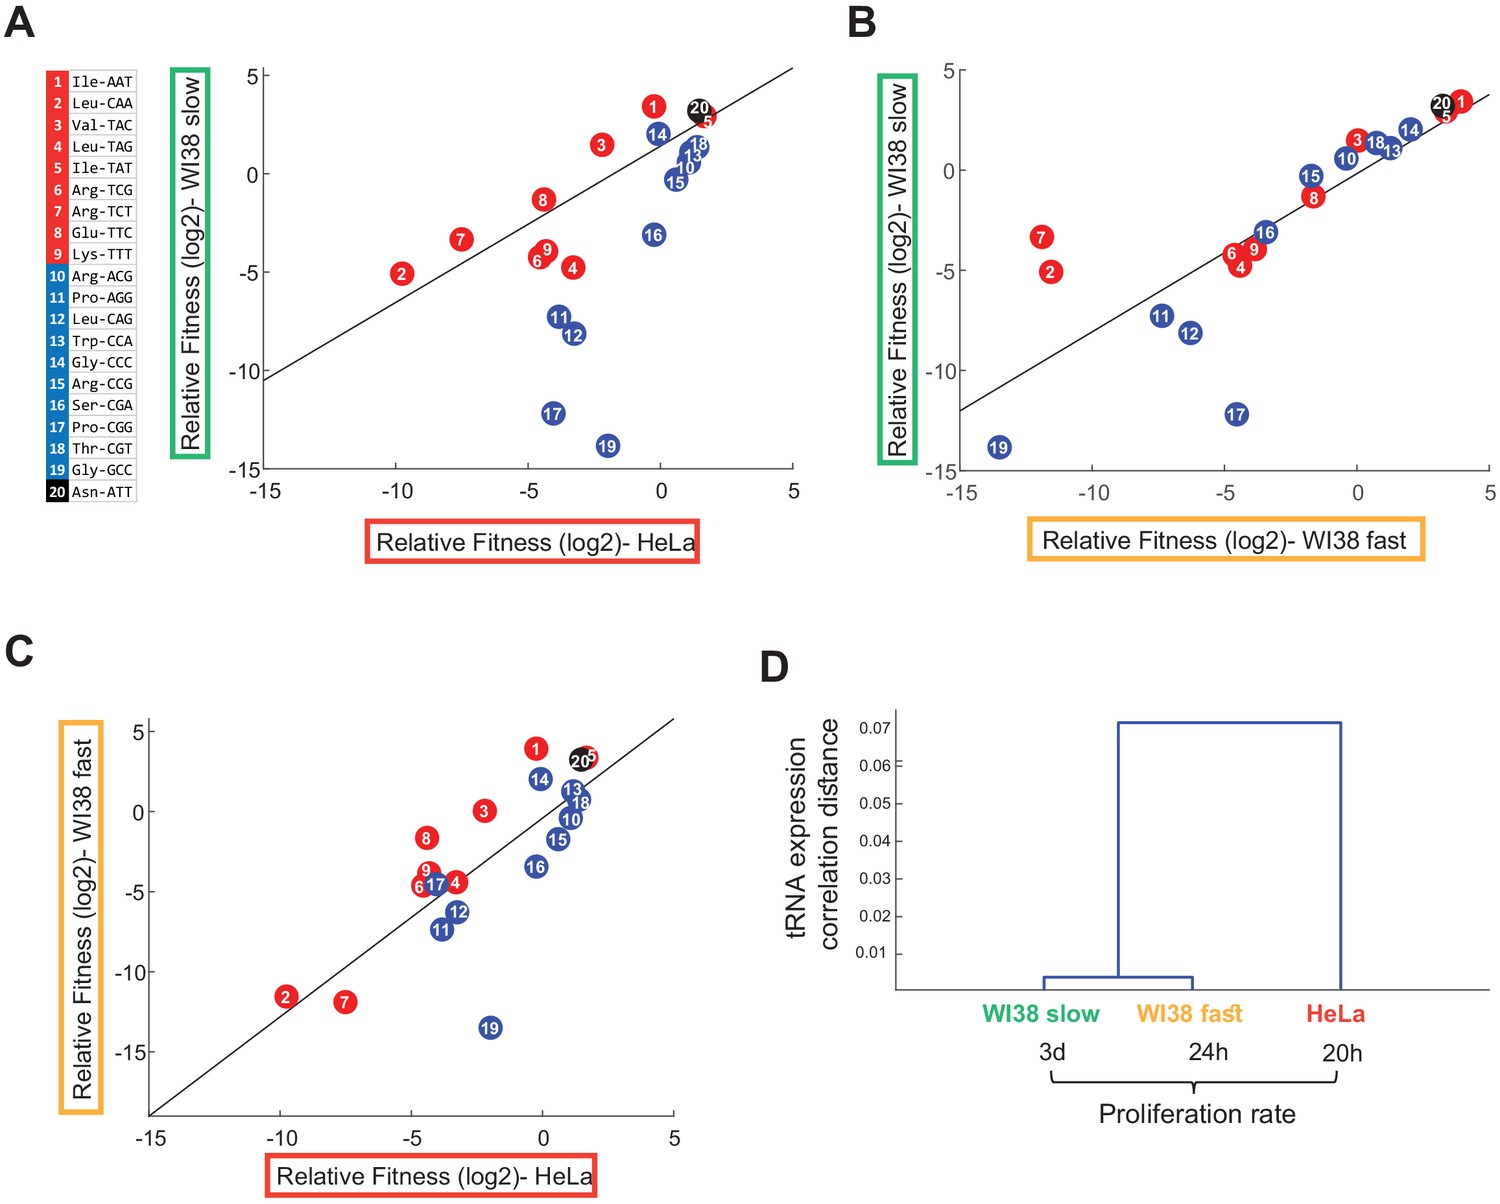
The tRNA essentiality depends on cell line origin and the proliferation rate.
(A-C) Scatter plots that indicate the correlation between the relative fitness (log2) of the edited tRNA cells between all pairwise combinations of three cell lines (Person correlation, (A) HeLa vs WI38 Slow: r = 0.54, p<0.05; (B) WI38 Fast vs WI38 Slow: r = 0.81, p<10−4; (C) HeLa vs WI38 Fast: r = 0.76, p<10−4). The relative fitness of each CRISPR-targeted tRNA variant in each cell lines was determined based on day 7 of the cell competition, and was averaged over two biological repeats. (D) Hierarchical clustering of the tested cell lines based on the tRNA pool expression in WT cells.
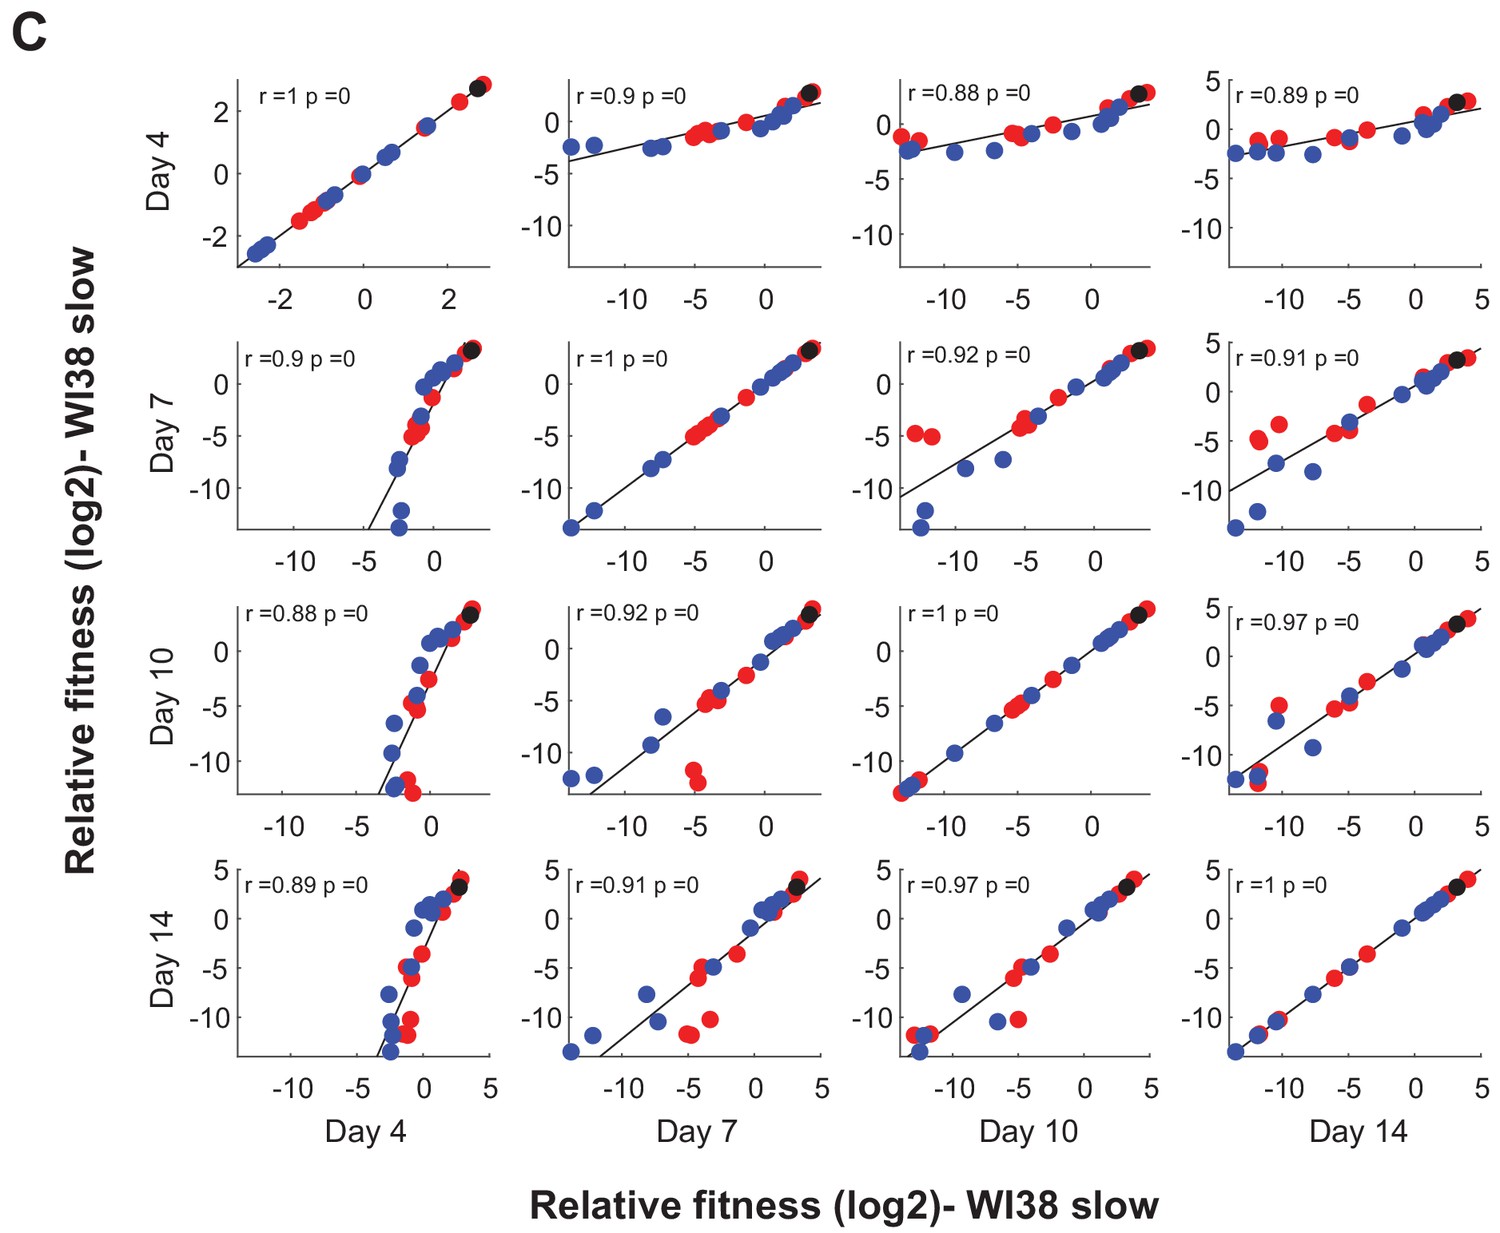
Figure 4—figure supplement 1
Comparison between relative fitness of tRNA- targeted cell in different time points of iCas9 induction.
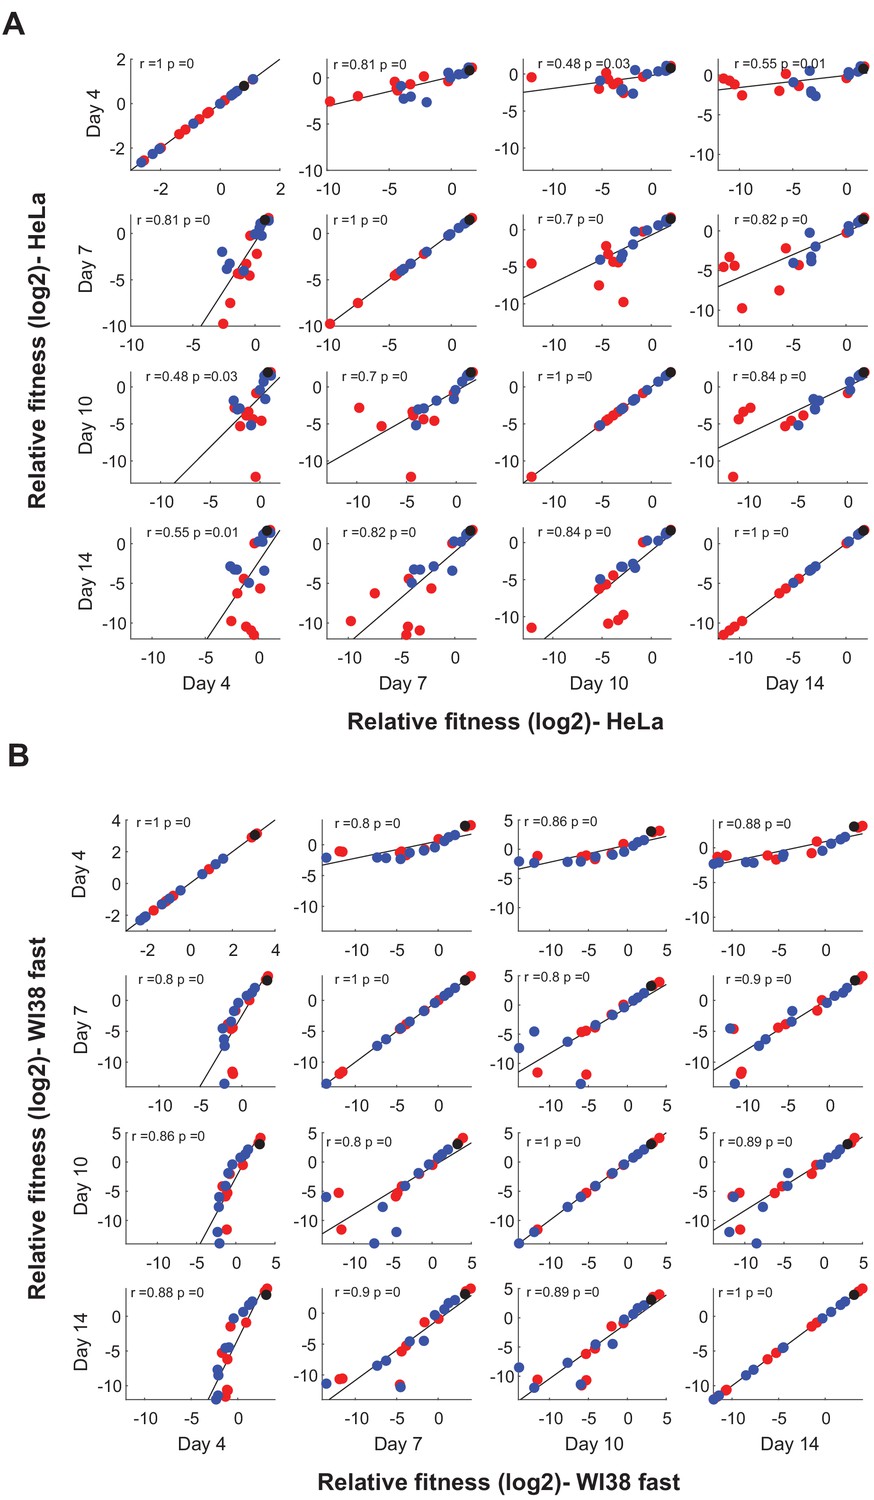
(A-C) Scatter plots representing the correlation between the relative fitness of the CRISPR-targeted tRNA variants in different days along the cell competition (days 4, 7, 10, and 14). The colors depict the tRNA family (red-proliferation-tRNAs; blue-differentiation-tRNAs; black-pseudo tRNA). The correlation coefficient r and p-values are detailed for each scatter plot. (A) HeLa cells (B) WI38 fast cells (C) WI38 slow cells.
Figure 4—figure supplement 2
Comparison between relative fitness of tRNA- targeted cell in different time points of iCas9 induction.
Continue from Figure 4—figure supplement 1.
Figure 4—figure supplement 3
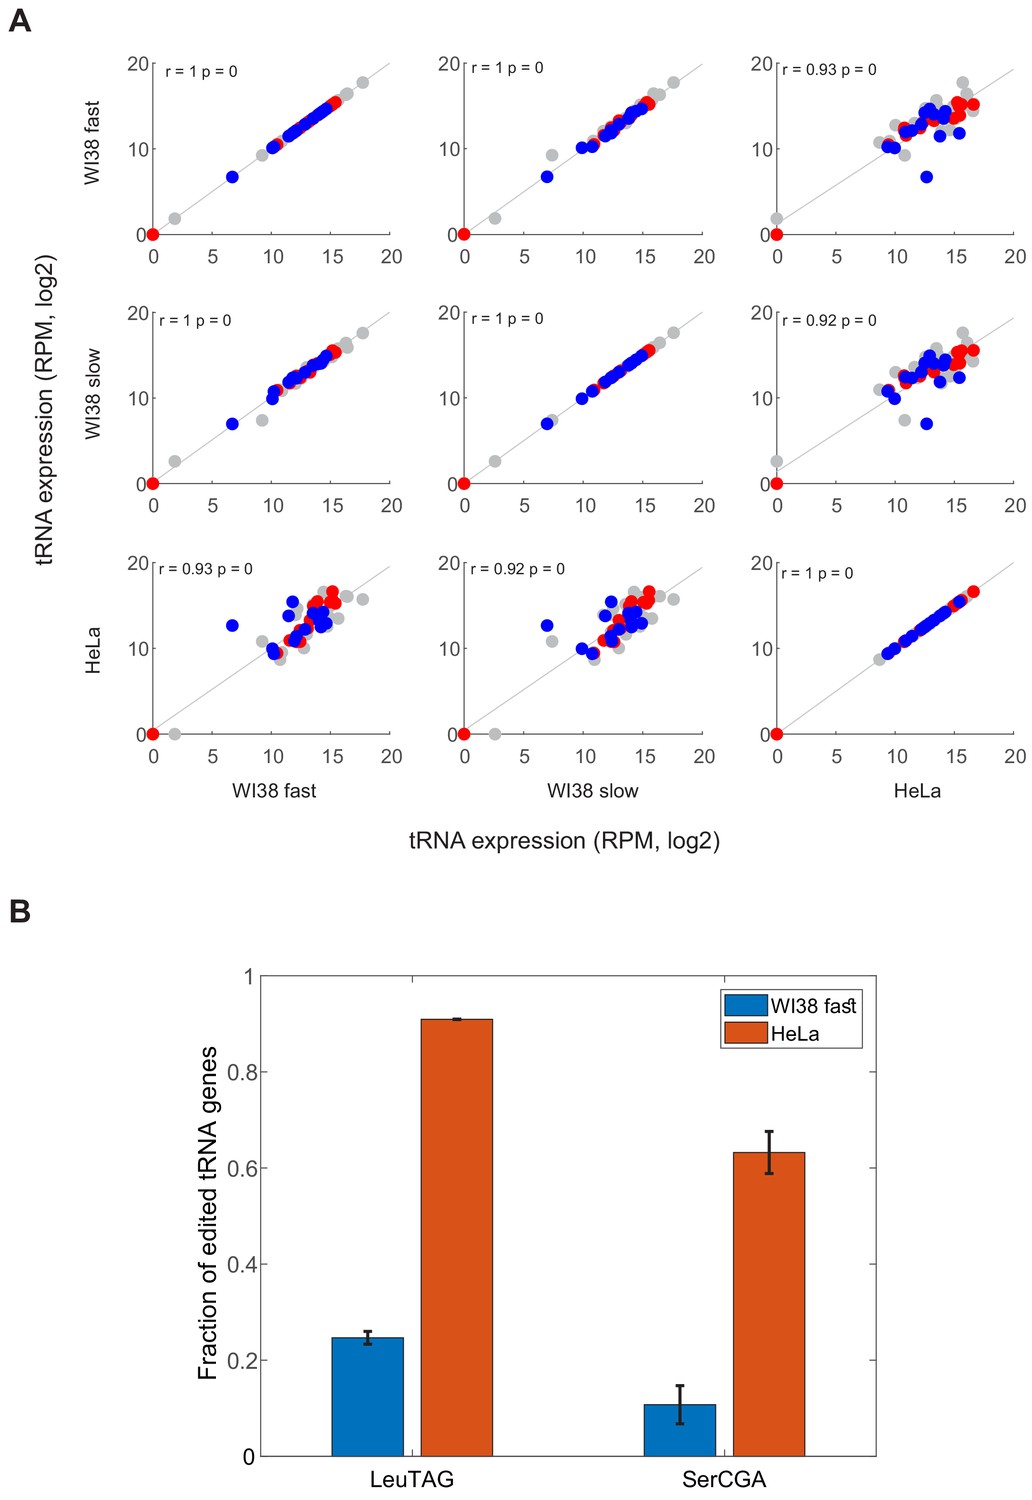
Comparison of tRNA expression and tRNA editing between cell lines.
(A) Scatter plots representing the correlation between expression levels of the tRNA pool in WT WI38 fast, WI38 slow and HeLa cells, averaged over two biological repeats. Each dot is a tRNA family, while the expression is summed over all tRNA isodecoders that belong to the tRNA family (RPM), in log2. The colors depict the group of the tRNA family (red-proliferation-tRNAs; blue-differentiation-tRNAs; grey-other tRNAs). The Pearson correlation coefficient r and p-values are detailed for each scatter plot. (B) The maximal fraction of the edited tRNA genes from the total tRNA reads in tRNA-targeted WI38 fast and HeLa cells. For each cell line and sgRNA, the maximal fraction of targeted tRNAs was reached in a specific day of the iCas9 induction (LeuTAG, WI38 fast - day 8; LeuTAG, HeLa - day 4; SerCGA, WI38 fast - day 4, SerCGA, HeLa - day 8).
Figure 5 with 1 supplement
Essentiality of tRNAs for the response to cell cycle arresting signals.
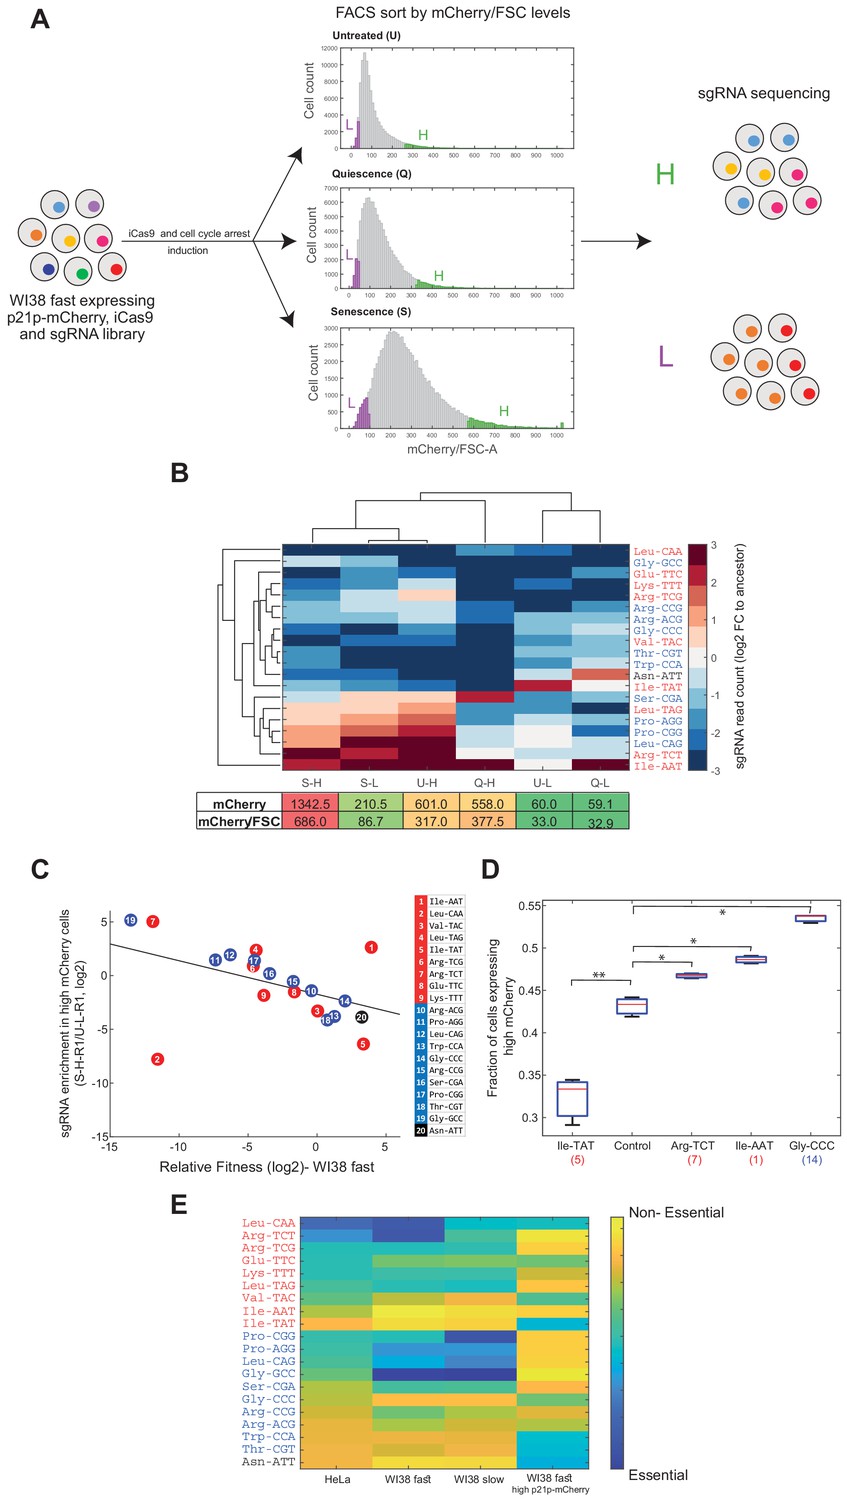
(A) A multiplexed assay for tRNA essentiality for growth arrest signals. The tRNA-sgRNA library was transduced into WI38 fast cells that express iCas9 under doxy inducible promoter and mCherry gene under the endogenous promoter of human p21. After the induction of iCas9, we split the cell population (ancestor sample) into three populations, each treated with different conditions to stimulate the entrance to a cell cycle arrest state. After 2 days, we measured the mCherry/FSC levels of each population using FACS. The distributions of the three populations, based on the mCherry/FSC are shown in the middle (U - untreated; Q - quiescence; S - senescence). Then, each population was sorted according to the mCherry/FSC ratio, while sampling the top and bottom 5% of each population (High bin-labeled in green; Low bin-labeled in purple). Then, we extracted the genomic DNA of each sample and deep sequenced the sgRNAs, looking for enriched and depleted sgRNAs (relative to the ancestor sample). (B) Hierarchical clustering of the sorted samples and the sgRNAs based on the averaged changes (two biological repeats) in the sgRNA read count of each sorted sample normalized to the ancestor sample (log2). The lower table depicts the mean mCherry level and the mean mCherry/FSC ratio of each sorted population, based on the FACS measurements. (C) A scatter plot comparing the essentiality of tRNAs to cellular proliferation and enterance into cell arrest in WI38 fast cells. (regression model, sgRNA abundancy in high p21-mCherry cells as a linear function of the relative fitness of tRNA-targeted WI38 fast cells, had a slope of −0.38 and intercept of −1.47; Pearson correlation, r = −0.45, p<0.05). Colors of tRNA families are as in previous Figures. (D) A box plot presenting the fraction of cells expressing high mCherry levels (>1700 relative fluorescence intensity (arbitrary units)) in each CRISPR-targeted tRNA variant (three biological repeats). The control sample is expressing a random sgRNA with no target sequence in the human genome. The number in parentheses on the x-axis denotes the number of the targeted tRNA family genes, as in subfigure C. A two-sample t-test was conducted to compare each sample to the control. * indicates p<0.05; ** indicates p<0.01. (E) A heat map summarizing the essentiality of each tRNA to different cell lines and proliferation states. Each row represents a tRNA family, classified to proliferation (red), differentiation (blue), or pseudo (black) tRNAs. Each column represents a cell line or condition. The color code depicts the essentiality of the tRNA. The essentiality is the (log2) fold-change in sgRNA read count in each experiment (as described in; Figure 4A Figure 4B; Figure 4C and subfigure C).
Figure 5—figure supplement 1
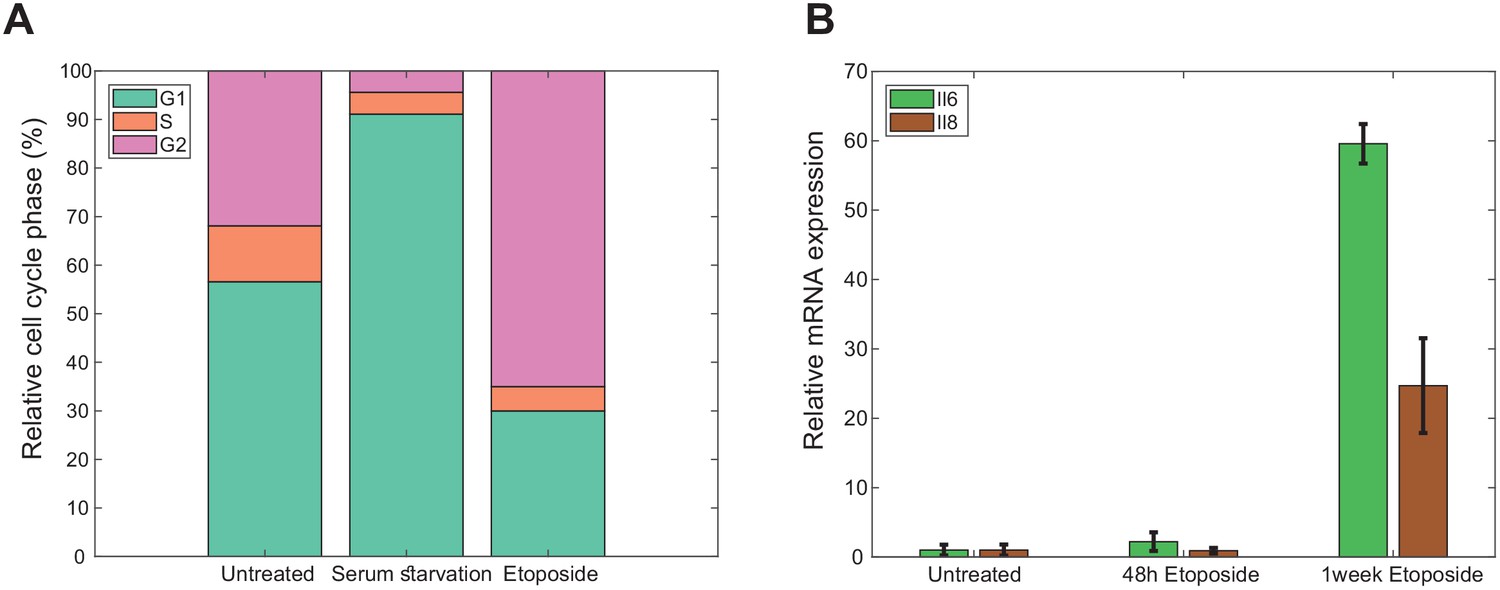
Serum starvation and Etoposide treatments induced quiescence and senescence respectively in WI38 fast cells.
(A) Cell cycle analysis of arrest-triggered cell populations. Each stacked bar represents a population that was untreated or treated to trigger entering into a cell cycle arrest state (i.e. serum starvation to induce quiescence, and low dosage of Etoposide to induce senescence) for 48 hr. In each bar, the percentage of cells at different cell cycle phases is shown. The results are averaged over two biological repeats. (B) Relative mRNA expression of senescence markers. mRNA expression of Il6 and Il8 in each sample is normalized to the expression of GAPDH, and presented as fold-change to the averaged expression of untreated samples (n = 2, error bars represent standard errors).
Tables
Key resources table
| Reagent type (species) or resource | Designation | Source or reference | Identifiers | Additional information |
|---|---|---|---|---|
| Strain, strain background (Escherichia coli) | Dh5α | Thermo- Fisher | 18265017 | |
| Cell line (Homo-sapiens) | HeLa-iCas9 | George Church’s lab (Harvard Medical school) | ||
| Cell line (H. sapiens) | WI38 fast | Milyavsky et al., 2003 Moshe Oren’s lab (Weizmann Institute) | Referred to as WI-38/hTERTfast, 484 | |
| Cell line (H. sapiens) | WI38 slow | Milyavsky et al., 2003 Moshe Oren’s lab (Weizmann Institute) | Referred to as WI-38/hTERTslow, 48 PDL | |
| Cell line (H. sapiens) | 293T | ATCC | CRL-3216 | |
| Recombinant DNA reagent | pB-Cas9 andpB-support vector | George Church’s lab (Harvard Medical school) | iCas9 plasmid | |
| Recombinant DNA reagent | LentiGuide-Puro | Addgene | RRID:Addgene_52963 | sgRNA plasmid |
| Recombinant DNA reagent | PMD2.G | Addgene | RRID:Addgene_12259 | Lenti-virus packaging plasmid |
| Recombinant DNA reagent | psPAX2 | Addgene | RRID:Addgene_12260 | Lenti-virus packaging plasmid |
| Recombinant DNA reagent | p21p-mCherry-NLS | Plasmid bank of the Weizmann Institute | 2280 | |
| Sequenced-based reagent | Reverse-transcription-DNA primer | Mordret et al., 2019 | CACGACGCTCTTCCGATCTT | |
| Sequenced-based reagent | Reverse-transcription-RNA primer | Mordret et al., 2019 | rArGrArUrCrGrGrArArGrArGrCrGrUrCrGrUrG | |
| Sequenced-based reagent | 3’-ligation adaptor | Mordret et al., 2019 | AGATCGGAAGAGCACA | |
| Sequence-based reagent | E. coli-tyr-tRNA | Sigma-Aldrich | R3143 | |
| Sequence-based reagent | S. cerevisia-phe-tRNA | Sigma-Aldrich | R4018 | |
| Sequence-based reagent | sgRNAseq_F | This paper | PCR primers | GCTTACCGTAACTTGAAAGTATTTCGATTTCTTGG |
| Sequence-based reagent | sgRNAseq_R | This paper | PCR primers | CTTTTTCAAGTTGATAACGGACTAGCCTTATTTTAAC |
| Peptide, recombinant protein | TGIRT-III | InGex | 5073018 | |
| Commercial assay or kit | PEG virus precipitation kit | BioVision | K904-50/200 | |
| Commercial assay or kit | Gibson Assembly Master Mix | NEB | E2611 | |
| Commercial assay or kit | NucleoSpin miRNA kit | Macherey-Nagal | 740971.50 | |
| Commercial assay or kit | PureLink genomic DNA mini kit | Invitrogene | K182000 | |
| Commercial assay or kit | AB high-capacity cDNA reverse-transcription kit | Applied Biosystems | 4368814 | |
| Chemical compound, drug | Etoposide | Sigma-Aldrich | 33419-42-0 | 2.5 µM |
| Chemical compound, drug | Puromycin | Sigma-Aldrich | 58-58-2 | 2 µg/ml |
| Chemical compound, drug | Blasticidin | InvivoGen | BLL-38-02A | 10 µg/ml |
| Chemical compound, drug | Doxycycline | Sigma-Aldrich | 10592-13-9 | 1 µg/ml |
| Chemical compound, drug | Hygromycin | Thermo Fisher | 10687010 | 200 µg/ml |
| Software, algorithm | Kaluza | beckman | RRID:SCR_016182 | Flow cytometry analysis software |
| Software, algorithm | FlowJo software v10.2 (Tree Star) | BD biosciences | RRID:SCR_008520 | Flow cytometry analysis software |
| Software, algorithm | homerTool | Duttke et al., 2019 | ||
| Software, algorithm | Bowtie2 | Langmead and Salzberg, 2012 | RRID:SCR_005476 | |
| Software, algorithm | BedTools-coverage count | Quinlan and Hall, 2010 | RRID:SCR_006646 | |
| Software, algorithm | samtools | Li et al., 2009 | RRID:SCR_002105 | |
| Software, algorithm | Cutadapt | Martin, 2011 | RRID:SCR_011841 | |
| Software, algorithm | CRISPResso | Pinello et al., 2016 | https://github.com/pinellolab/CRISPResso2.git | |
| Software, algorithm | vsearch | Rognes et al., 2016 | ||
| Other | Agencourt AMPure XP | Beckman Coulter | A63881 | SPRI-beads |
| Other | Hoechst 33342 | abcam | ab228551 | 10 µg/ml |
| Other | Dynabeads myOne SILANE | life Technologies | 37002D |
Additional files
Download links
A two-part list of links to download the article, or parts of the article, in various formats.
Downloads (link to download the article as PDF)
Open citations (links to open the citations from this article in various online reference manager services)
Cite this article (links to download the citations from this article in formats compatible with various reference manager tools)
Manipulation of the human tRNA pool reveals distinct tRNA sets that act in cellular proliferation or cell cycle arrest
eLife 9:e58461.
https://doi.org/10.7554/eLife.58461


