The role of cochlear place coding in the perception of frequency modulation
- Department of Psychology, University of Minnesota, United States
Figures
Figure 1
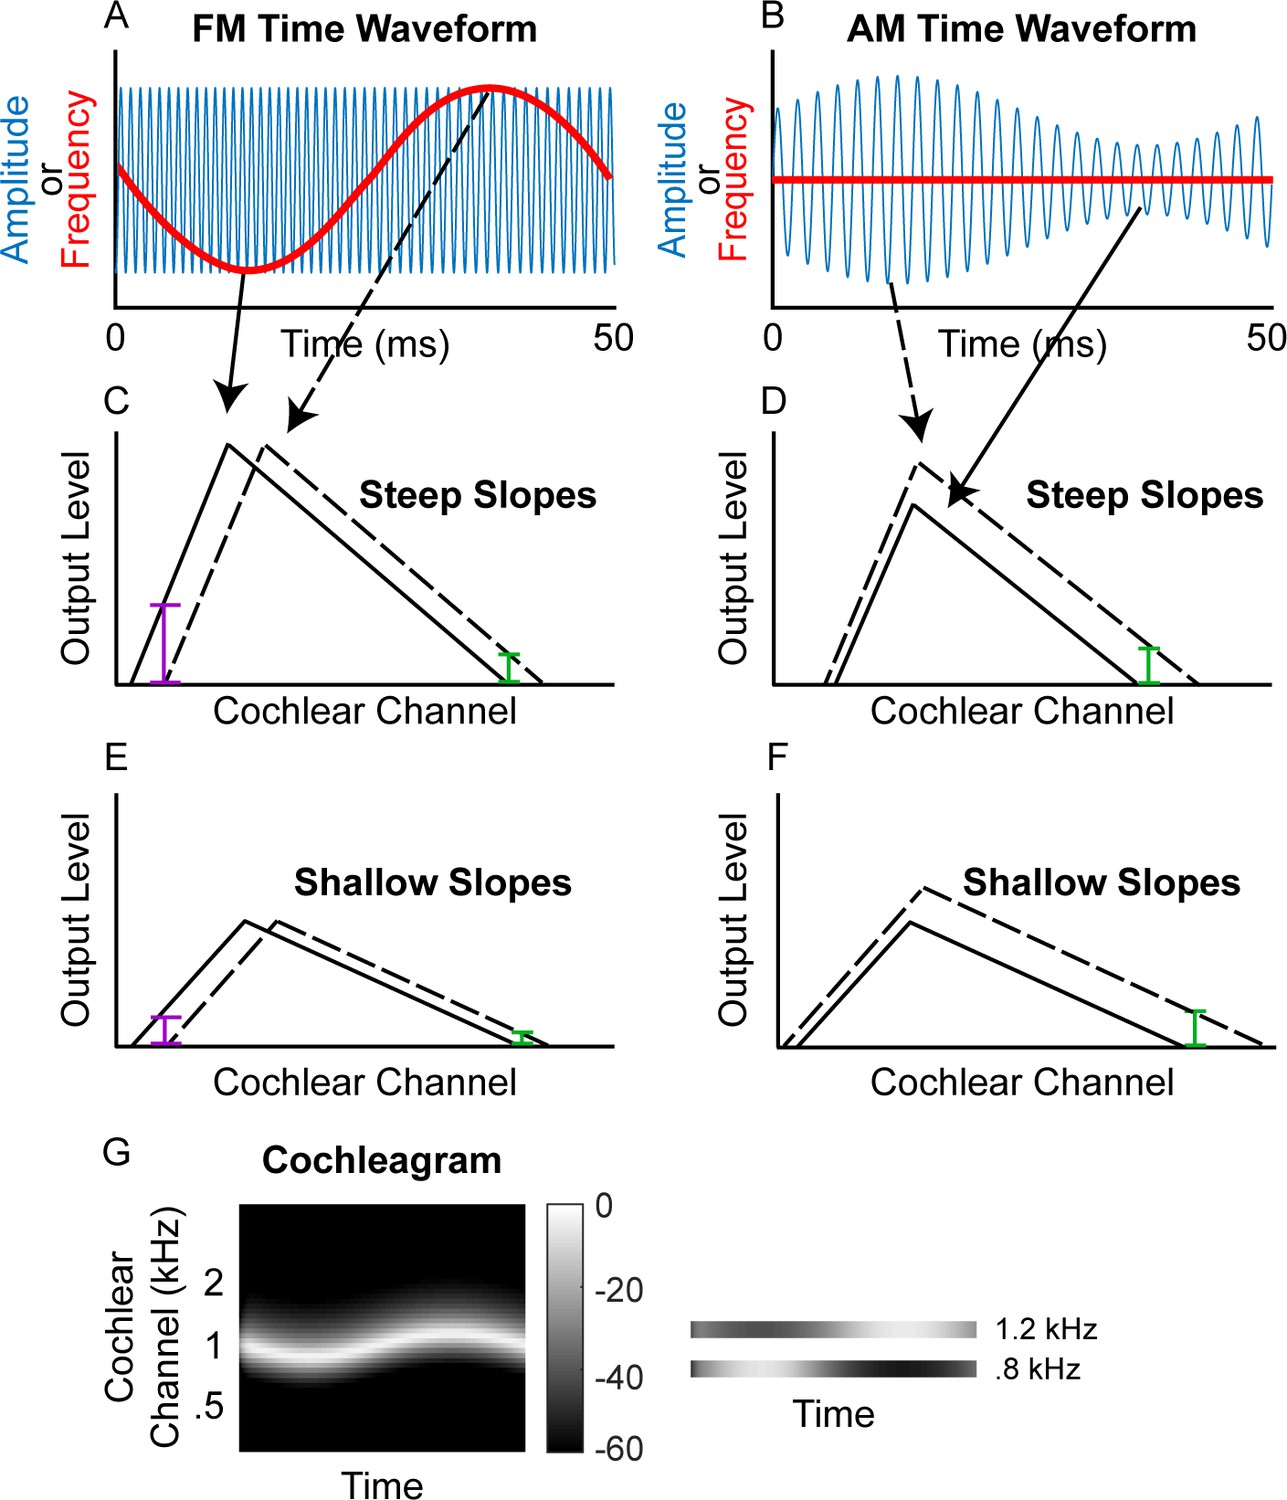
Schematic of (A) FM and (B) AM time waveforms (fc = 1 kHz; fm = 20 Hz) and the resulting changes in basilar-membrane excitation for steep (C and D) and shallow (E and F) slopes.
In A and B, the blue time waveforms represent amplitude over time, while the superimposed red waveforms are the same stimuli plotted in terms of instantaneous frequency over time. Panels C and E demonstrate that a place code for FM would result in a greater change in output level on the low-frequency side of the excitation pattern (purple bars) relative to the high-frequency side (green bars) and that shallower filter slopes result in poorer FM coding (larger colored bars in C than in E) but not poorer AM coding (same size colored bars in D and F). (G) Schematic cochleagram of an FM tone, showing how the output from two separate cochlear channels (right) with center frequencies on either side of the carrier frequency is AM that is out of phase.
Figure 2 with 1 supplement
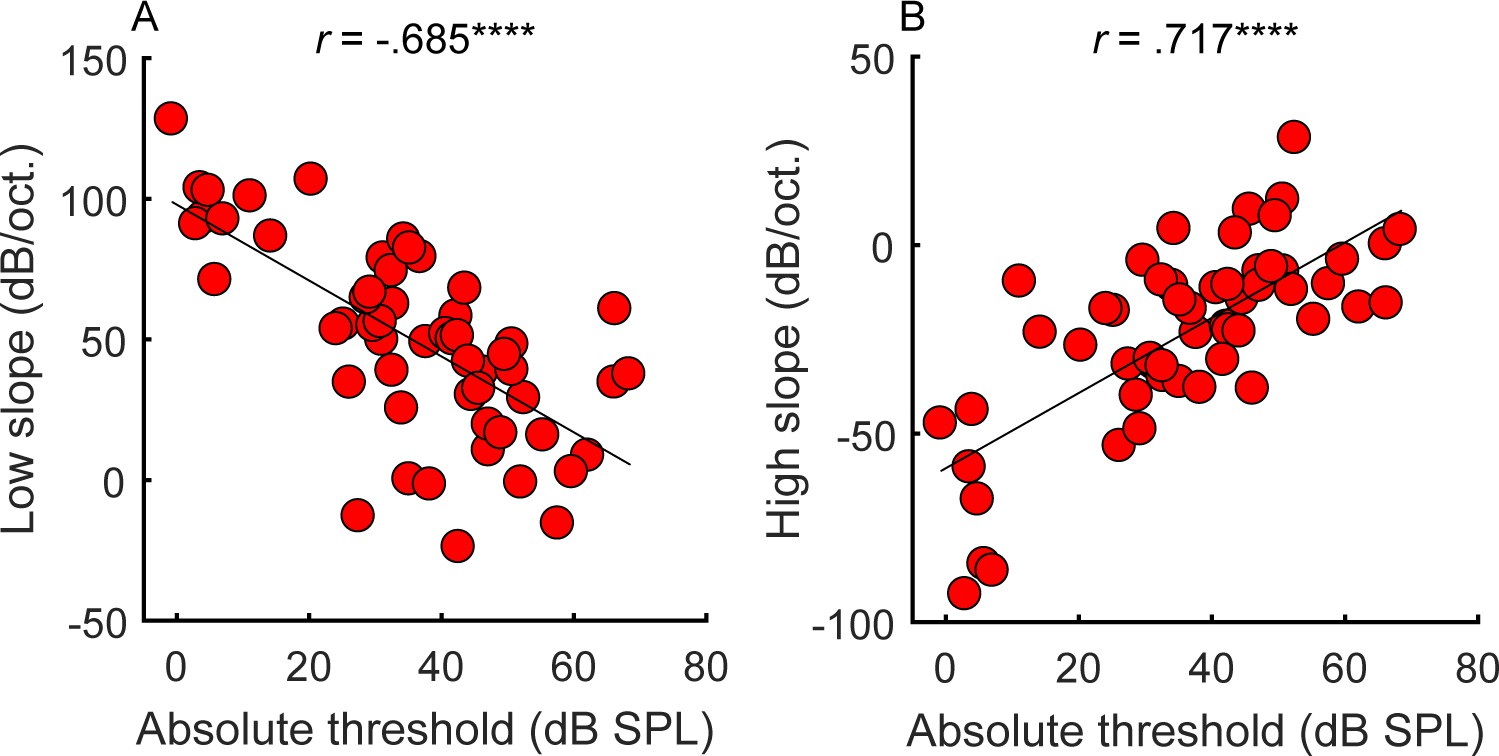
Correlations between average absolute thresholds at 1 kHz in the tested ear (x-axis) and the steepness of the (A) low and (B) high side of the cochlear filter slopes (n = 55).
Participants with greater hearing loss at 1 kHz tended to have shallower filter slopes. Correlations marked with an * are significant after Holm’s correction (****p<0.0001).
-
Figure 2—source data 1
Figure 2 data.
Rows are individual subjects.
- https://cdn.elifesciences.org/articles/58468/elife-58468-fig2-data1-v2.xlsx
Figure 2—figure supplement 1

Example forward masking pattern for a single subject.
Absolute thresholds for the 20 ms tone in quiet (unfilled circles) and when preceded by a 500 ms, 1 kHz pure-tone forward masker (filled circles). The level of the tone must be much higher to be perceived when the tone is very close in frequency to the masker as opposed to when it is farther away. The slopes were calculated by conducting two linear regressions: one between the thresholds of the four lowest (low slope) and one between the four highest (high slope) tone-pip frequencies.
-
Figure 2—figure supplement 1—source data 1
Individual masking pattern.
- https://cdn.elifesciences.org/articles/58468/elife-58468-fig2-figsupp1-data1-v2.xlsx
Figure 3
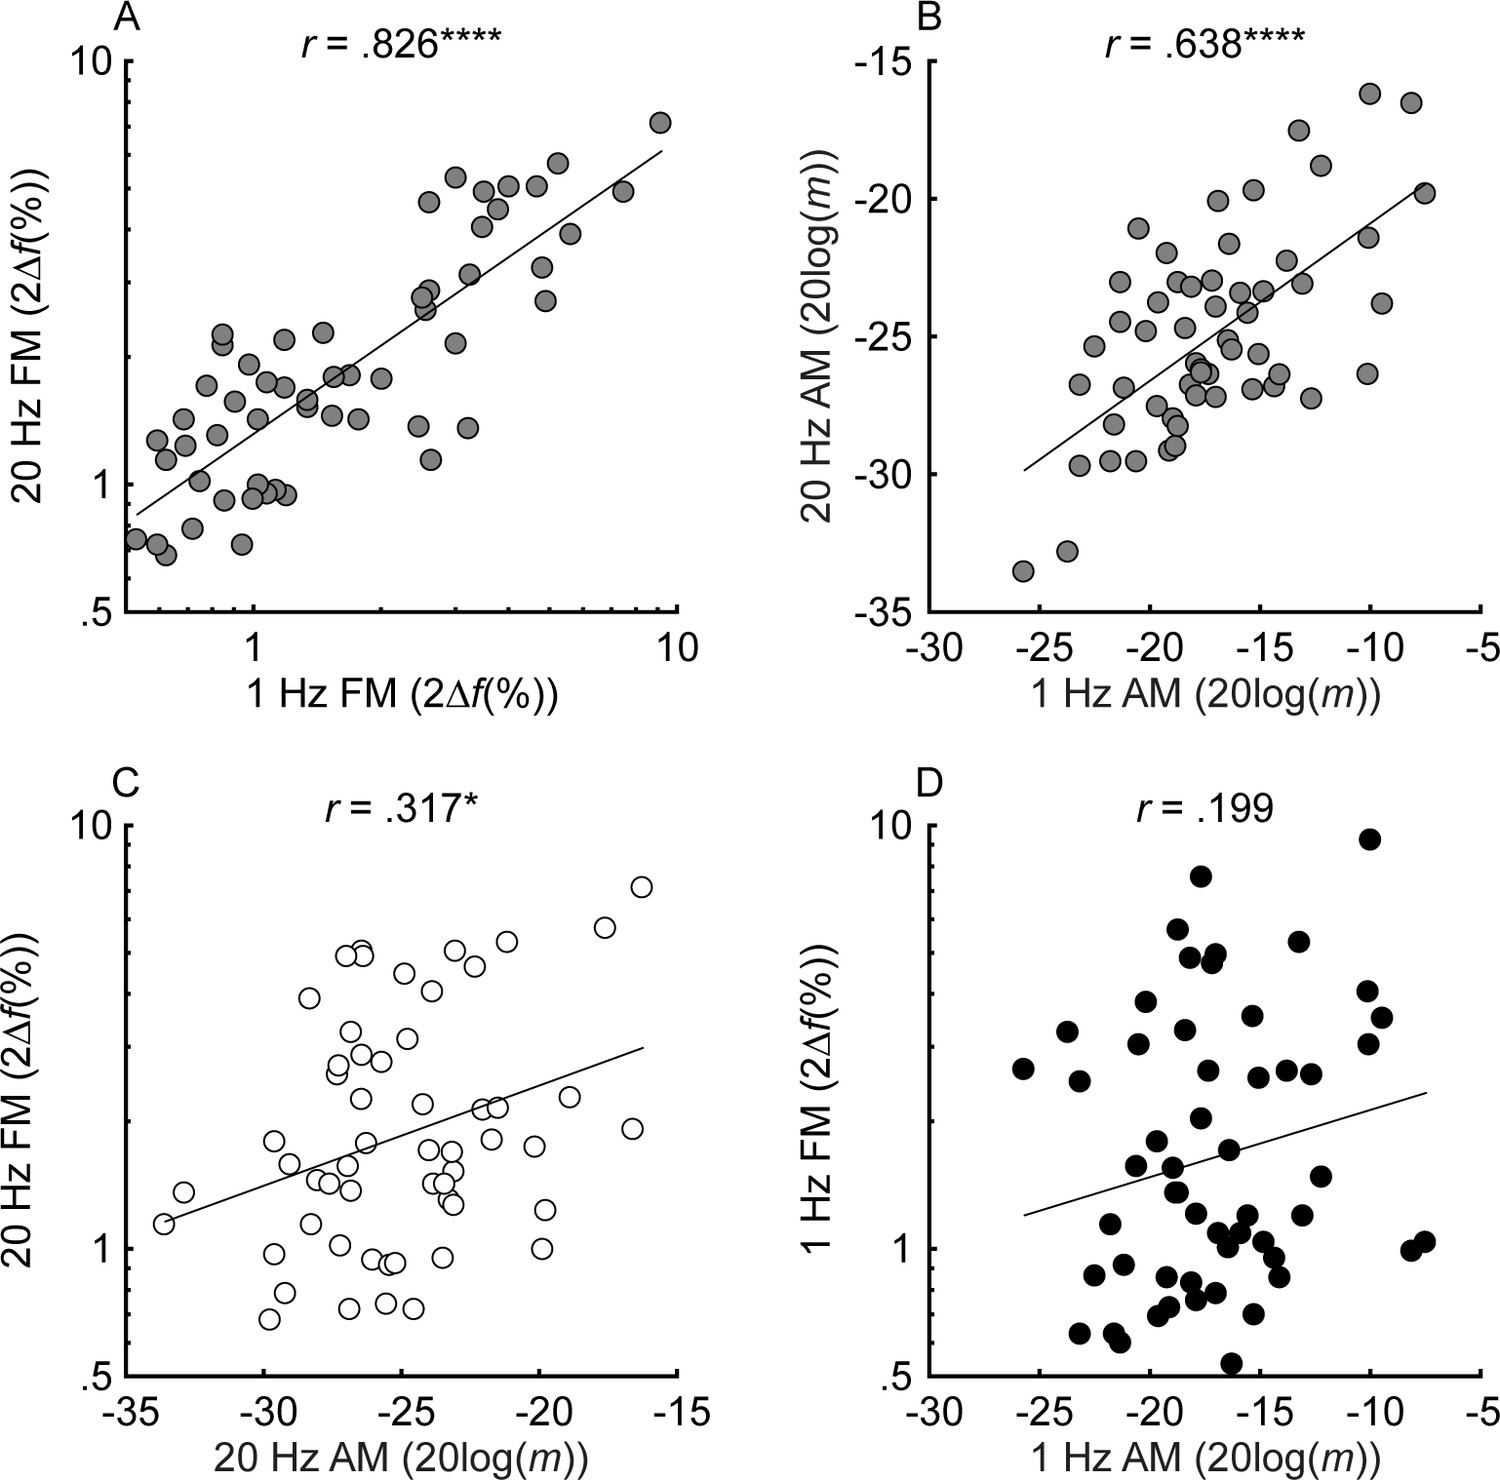
Individual thresholds for slow (fm = 1 Hz) and fast (fm = 20 Hz) FM and AM detection (n = 55).
Black, white, and gray circles represent slow, fast, and mixed modulation rates, respectively. FM and AM thresholds are plotted in percent peak-to-peak frequency change (2∆f(%)) and 20log(m), where ∆f is the frequency excursion from the carrier and m is the modulation depth (ranging from 0 to 1). For all tasks, lower values represent better thresholds. Shown in the different panels are the relationships between thresholds in slow and fast FM (A), slow and fast AM (B), fast AM and FM (C), and slow AM and FM (D). Correlations marked with an * are significant after Holm’s correction (****p<0.0001, ***p<0.001, **p<0.01, and *p<0.05).
-
Figure 3—source data 1
Figure 3 data.
Rows are individual subjects. Slow = 1 Hz modulation rate; Fast = 20 Hz modulation rate.
- https://cdn.elifesciences.org/articles/58468/elife-58468-fig3-data1-v2.xlsx
Figure 4 with 2 supplements
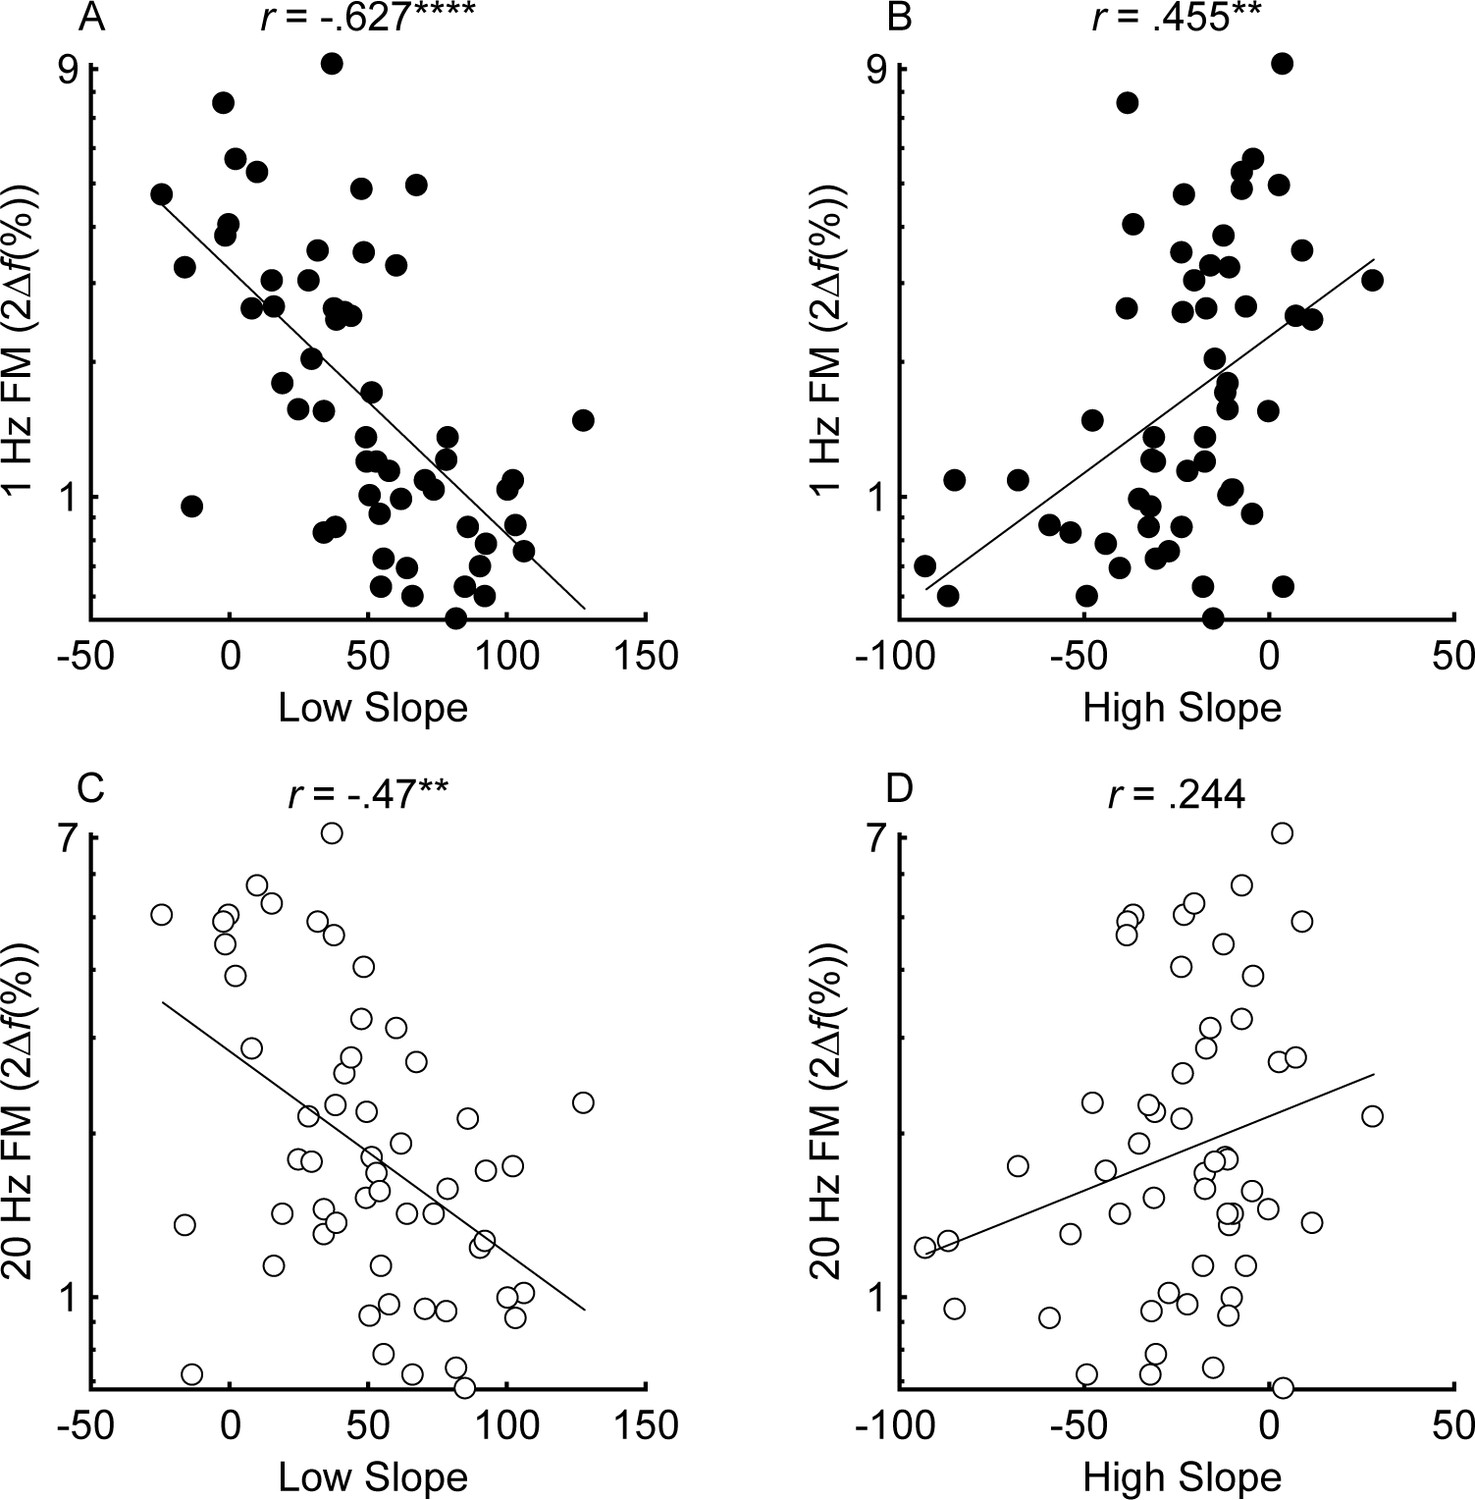
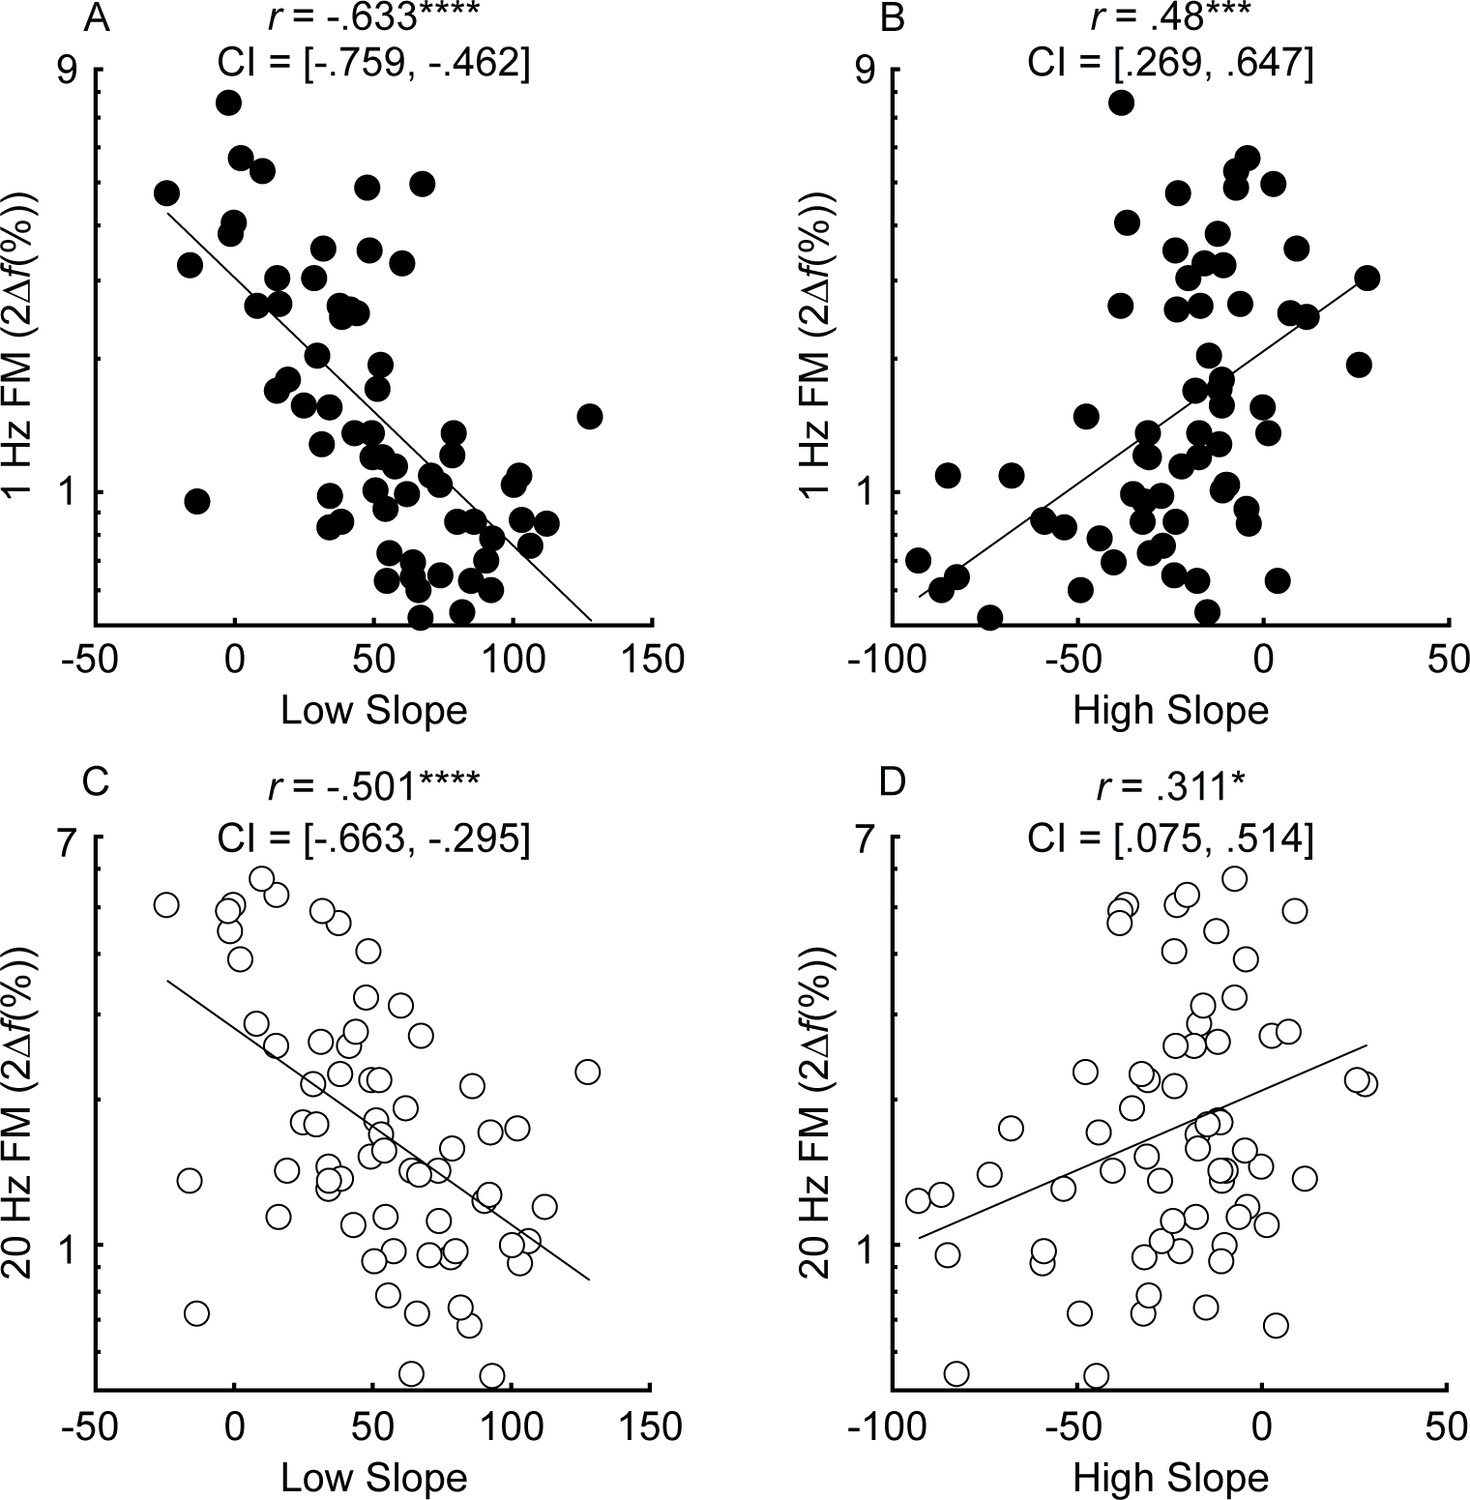
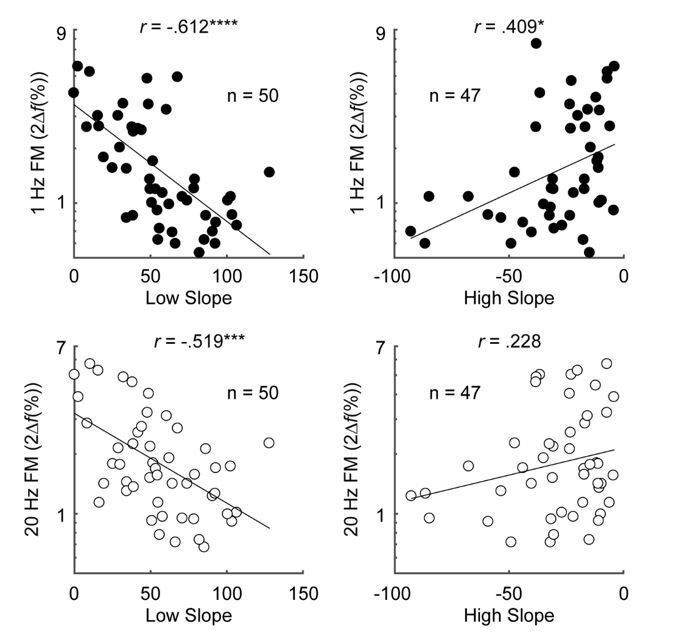
Correlations between the low slope (A and C) and high slope (B and D) and slow (fm = 1 Hz; black) and fast (fm = 20 Hz; white) FM detection (n = 55).
Correlations marked with an * are significant after Holm’s correction (****p<0.0001, ***p<0.001, **p<0.01, and *p<0.05).
-
Figure 4—source data 1
Figure 4 data.
Rows are individual subjects. Slow = 1 Hz modulation rate; Fast = 20 Hz modulation rate.
- https://cdn.elifesciences.org/articles/58468/elife-58468-fig4-data1-v2.xlsx
Figure 4—figure supplement 1
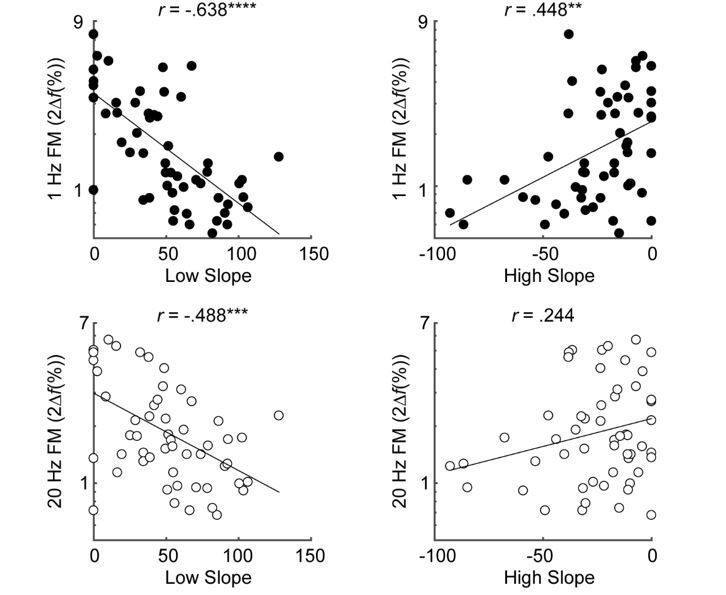
Frequency selectivity and FM detection correlations when both ears are included from subjects with asymmetric hearing loss (n = 66 ears).
Correlations between the low slope (A and C) and high slope (B and D) and slow (fm = 1 Hz; black) and fast (fm = 20 Hz; white) FM detection. Correlations marked with an * are significant after Holm’s correction (****p<0.0001, ***p<0.001, **p<0.01, and *p<0.05).
-
Figure 4—figure supplement 1—source data 1
Rows are individual subjects.
Slow = 1 Hz modulation rate; Fast = 20 Hz modulation rate.
- https://cdn.elifesciences.org/articles/58468/elife-58468-fig4-figsupp1-data1-v2.xlsx
-
Figure 4—figure supplement 1—source data 2
Rows are individual subjects.
Slow = 1 Hz modulation rate; Fast = 20 Hz modulation rate.
- https://cdn.elifesciences.org/articles/58468/elife-58468-fig4-figsupp1-data2-v2.xlsx
Figure 4—figure supplement 2

Relationship between place coding fidelity and FM sensitivity with outlier included.
Correlations between the low slope (A and C) and high slope (B and D) and slow (fm = 1 Hz; black) and fast (fm = 20 Hz; white) FM detection (n = 56). Correlations marked with an * are significant after Holm’s correction (****p<0.0001, ***p<0.001, **p<0.01, and *p<0.05).
Figure 5 with 2 supplements
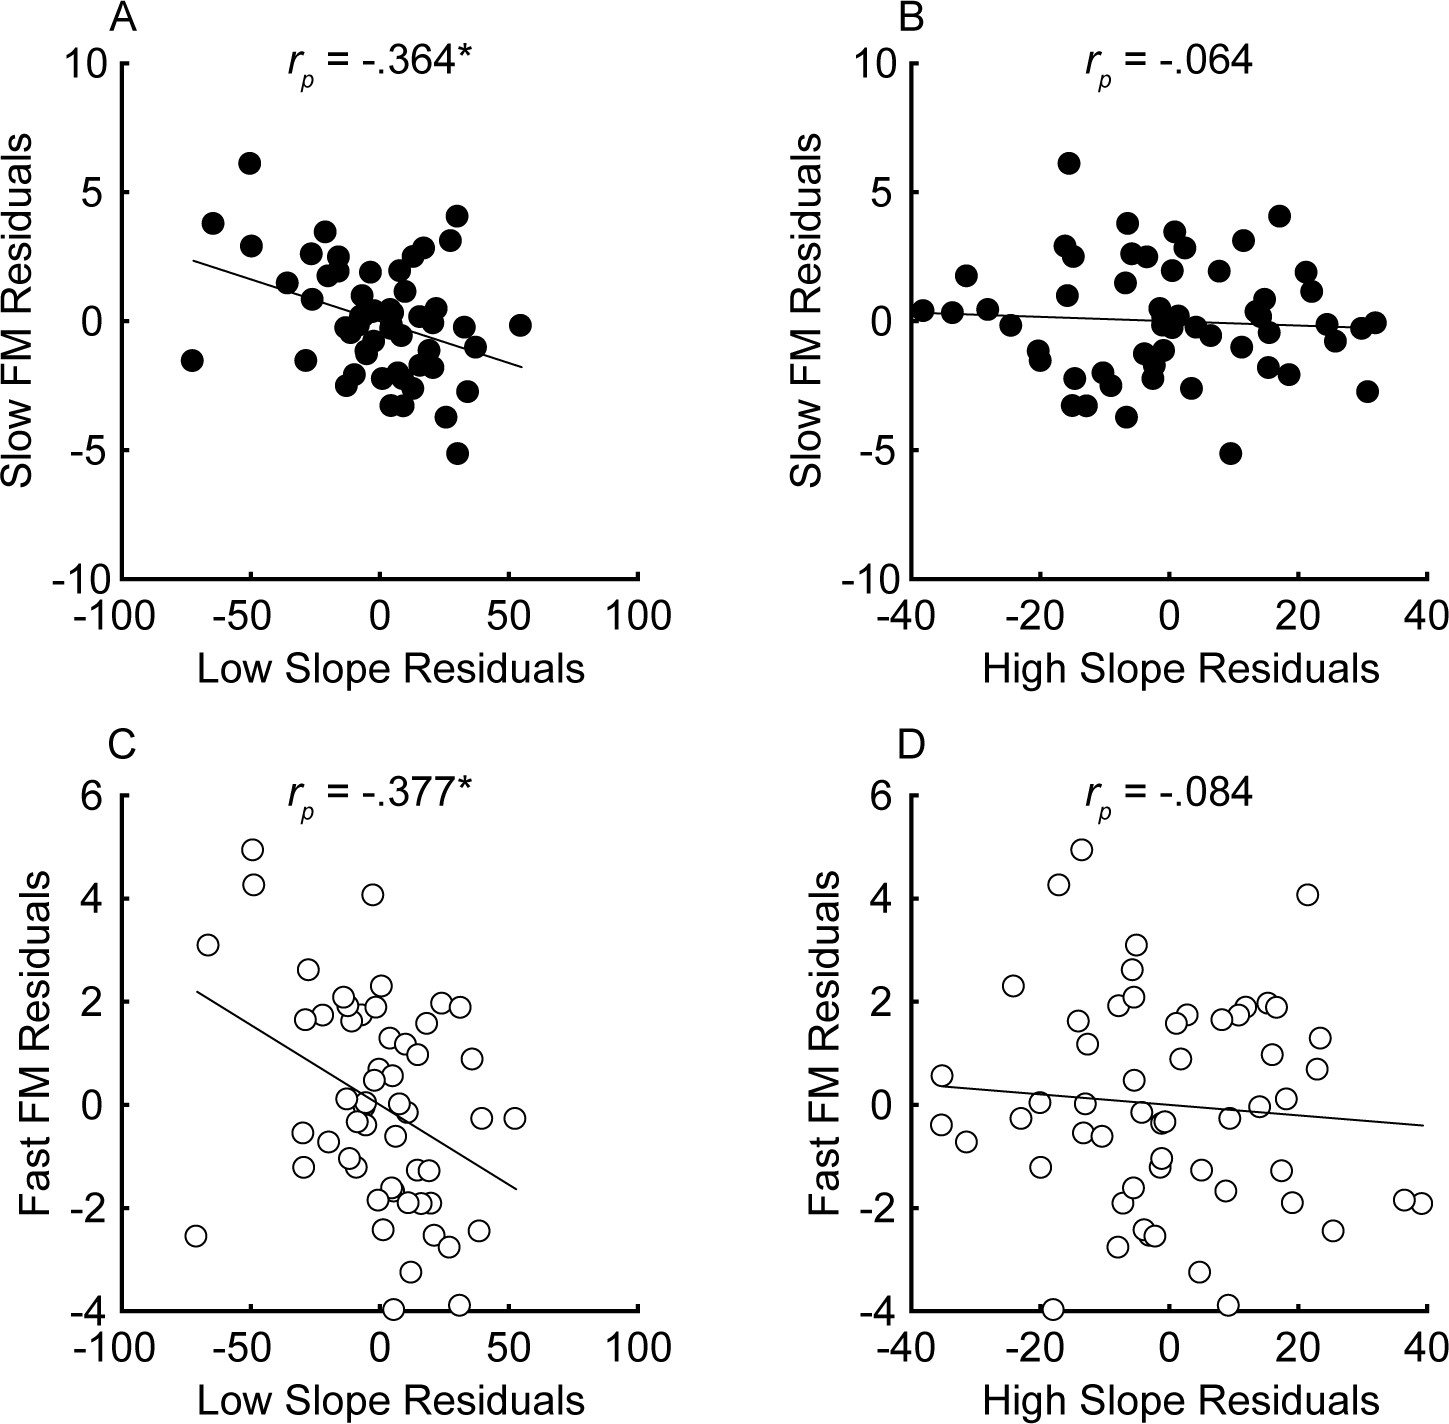
Partial correlations between the steepness of the masking function slopes (x-axis) and FM detection (y-axis) for slow (A and B) and fast FM (C and D) after variance due to audibility, sensitivity to AM, and age has been partialled out for n = 55 participants.
Units of the x and y axes are arbitrary because they correspond to the residual variance for slow (fm = 1 Hz; black) and fast FM detection (fm = 20 Hz; white). Correlations marked with an * are significant after Holm’s correction (****p<0.0001, ***p<0.001, **p<0.01, and *p<0.05).
-
Figure 5—source data 1
Figure 5 data.
Rows are individual subjects. Slow = 1 Hz modulation rate; Fast = 20 Hz modulation rate.
- https://cdn.elifesciences.org/articles/58468/elife-58468-fig5-data1-v2.xlsx
Figure 5—figure supplement 1

Partial correlations between place coding fidelity and FM sensitivity when both ears are included for asymmetric subjects (n = 66 ears) for slow (A and B) and fast FM (C and D).
Pictured are the steepness of the masking function slopes (x-axis) and FM detection (y-axis) after variance due to audibility, sensitivity to AM, and age has been partialled out. Units of the x and y axes are arbitrary because they correspond to the residuals. Correlations marked with an * are significant after Holm’s correction (****p<0.0001, ***p<0.001, **p<0.01, and *p<0.05).
-
Figure 5—figure supplement 1—source data 1
Rows are individual subjects.
Slow = 1 Hz modulation rate; Fast = 20 Hz modulation rate.
- https://cdn.elifesciences.org/articles/58468/elife-58468-fig5-figsupp1-data1-v2.xlsx
-
Figure 5—figure supplement 1—source data 2
Rows are individual subjects.
Slow = 1 Hz modulation rate; Fast = 20 Hz modulation rate.
- https://cdn.elifesciences.org/articles/58468/elife-58468-fig5-figsupp1-data2-v2.xlsx
Figure 5—figure supplement 2

Partial correlations between place coding fidelity and FM sensitivity with outlier included for slow (A and B) and fast FM (C and D).
Pictured are the steepness of the masking function slopes (x-axis) and FM detection (y-axis) after variance due to audibility, sensitivity to AM, and age has been partialled out for n = 56 participants. Units of the x and y axes are arbitrary because they correspond to the residuals. Correlations marked with an * are significant after Holm’s correction (****p<0.0001, ***p<0.001, **p<0.01, and *p<0.05).
Figure 6
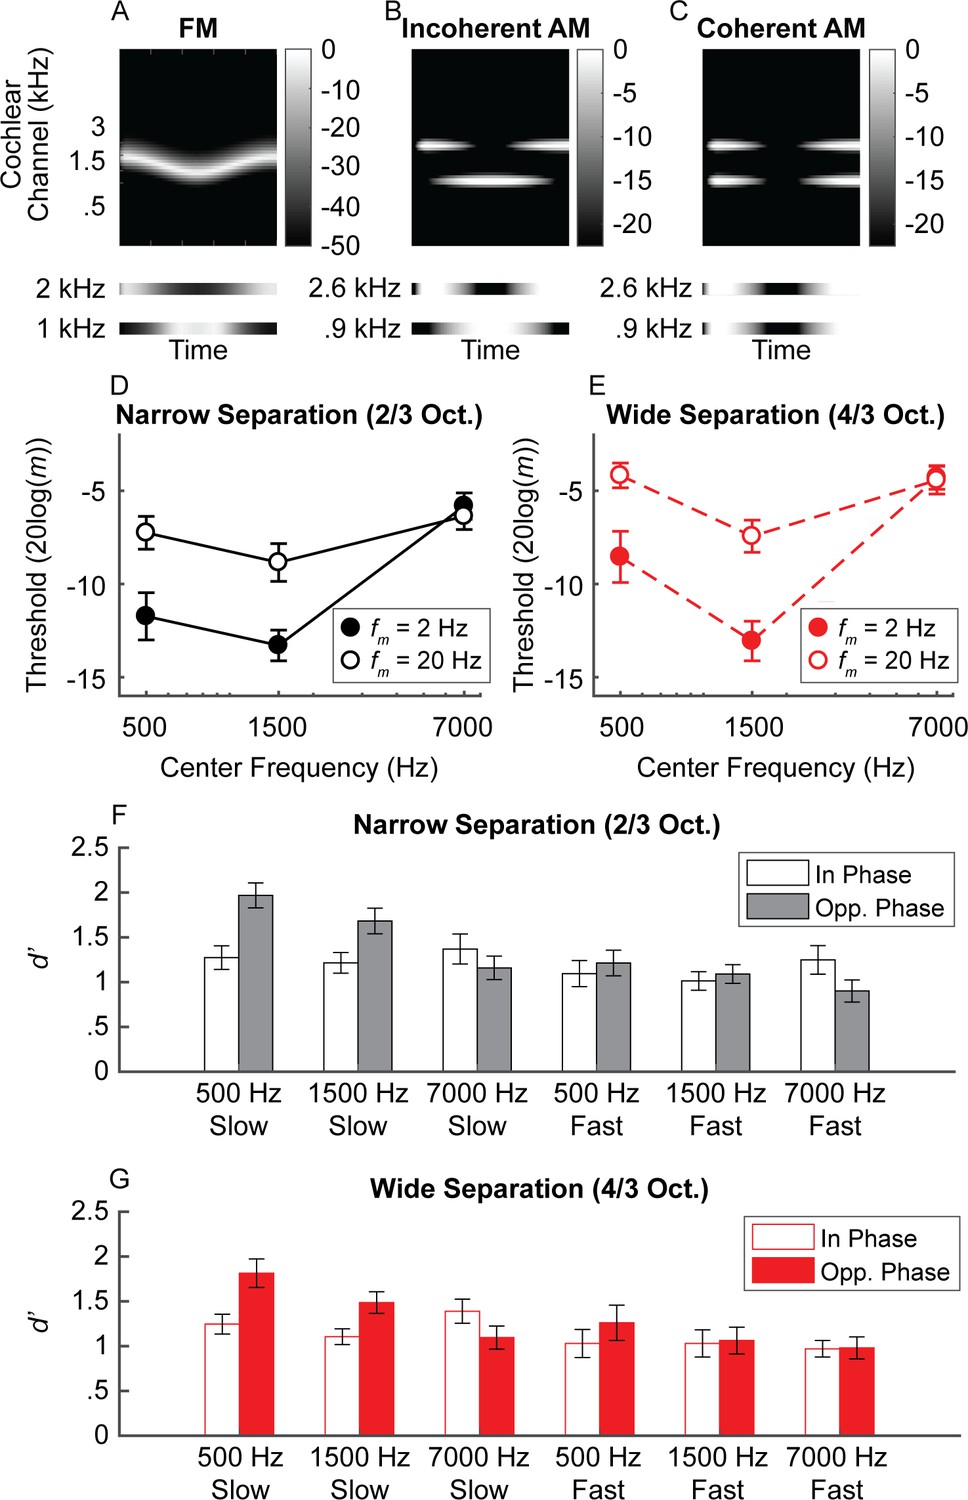
Experiment 2 schematic cochleagram and results.
(A) Schematic cochleagram of an FM tone. The magnitude responses for two off-frequency filters (bottom) are 180-degrees out of phase for any given snapshot in time. (B and C) The schematic cochleagrams of two-component AM dyads with envelopes that are in opposite phase (incoherent) versus in phase (coherent). Incoherent envelopes lead to rate-place fluctuations similar to that observed in FM. (D and E) Average sensitivity for discriminating incoherent AM at slow (filled circles) and fast (open circles) rates in the narrow (black) and wide (red) frequency separation conditions. Sensitivity for simulated FM is best at lower center frequencies and slow rates, with slightly higher thresholds at very low center frequencies, similar to traditional FM sensitivity (Sek and Moore, 1995). (F and G) Sensitivity for detecting in-phase (open bars) and opposite-phase (filled bars) AM for two-component dyads. Sensitivity for opposite-phase AM (i.e., simulated FM) is only boosted for low center frequencies at slow rates, meaning a unified neural place code can account for limits in human FM sensitivity. N = 20 in all measures. Error bars represent ±1 standard error of the mean.
-
Figure 6—source data 1
Figure 6 data.
Rows are individual subjects. Nrw = 2/3 octave frequency separation; Wide = 4/3 octave frequency separation; Slow = 2 Hz modulation rate; Fast = 20 Hz modulation rate; In = in phase; Out = out of phase. The number in each column label (e.g., 500) corresponds to the center frequency.
- https://cdn.elifesciences.org/articles/58468/elife-58468-fig6-data1-v2.xlsx
Author response image 1
Correlations between FM sensitivity (y-axes) and fidelity of place coding (x-axes) (n=55) with extreme slope data points (i.e., negative low slopes and/or positive high slopes) replaced with 0.
Author response image 2
Correlations between FM sensitivity (y-axes) and fidelity of place coding (x-axes) with extreme slope data points removed.
Tables
Table 1
Summary of participants.
| Measured ear | # of Participants | Notes |
|---|---|---|
| Worse ear | 38 | Subjects with symmetric 1 kHz thresholds (asymmetry <= 10 dB; n = 37) or who could only be assessed in their worse ear due to time constraints (n = 1). |
| Better ear | 7 | Subjects with 1 kHz thresholds in the worse ear that exceeded the study criterion (n = 6) or indicated the SL in their worse ear was uncomfortable (n = 1). |
| Both ears (worse ear used in analyses) | 11 | 1 kHz asymmetry > 10 dB; n = 3 had normal hearing in their better ear, and n = 8 had SNHL in both ears. |
Additional files
-
Supplementary file 1
Table legends.
(a) AM incoherence discrimination results. (b) Complex AM detection results. (c) Results with outlier subject included (n = 56) generally demonstrate the same trends as the main text, with the exception that the correlation between slow FM and slow AM detection thresholds was significantly different from the correlation between fast FM and fast AM detection thresholds (Z = 2.13, p=0.032, two-tailed), an effect that was not present with the outlier removed (see ‘Correlations between FM and AM detection’ in main text). (d) AM discrimination conditions. The units for all columns except Octave Separation are in Hz.
- https://cdn.elifesciences.org/articles/58468/elife-58468-supp1-v2.docx
-
Transparent reporting form
- https://cdn.elifesciences.org/articles/58468/elife-58468-transrepform-v2.pdf
Download links
A two-part list of links to download the article, or parts of the article, in various formats.
Downloads (link to download the article as PDF)
Open citations (links to open the citations from this article in various online reference manager services)
Cite this article (links to download the citations from this article in formats compatible with various reference manager tools)
The role of cochlear place coding in the perception of frequency modulation
eLife 9:e58468.
https://doi.org/10.7554/eLife.58468


