Drivers and sites of diversity in the DNA adenine methylomes of 93 Mycobacterium tuberculosis complex clinical isolates
- Laboratory for Pathogenesis of Clinical Drug Resistance and Persistence, San Diego State University, United States
- Trudeau Institute, United States
- Department of Microbiology and Immunology, Albert Einstein College of Medicine, United States
- Department of Public Health Sciences, Karolinska Institute, Sweden
Figures
Figure 1 with 1 supplement

Study design and approach to whole-methylome analysis.
(A) Isolate selection. M. tuberculosis clinical isolates were obtained from tuberculosis (TB) patient sputa from four countries of high TB-burden (India, Moldova, South Africa, and The Philippines), and Sweden (primarily isolated from migrants originating in high TB-burden countries). Isolates were cultured, DNA extracted and sent to the Genomic Medicine Genomics Center at UCSD for amplification-free sequencing (PacBio RSII, P6C4 chemistry). Clinical isolates were supplemented by technical replicate control runs of avirulent reference strains, and publicly available clinical isolates along with technical triplicates of H37Rv (BioProject Nos. PRJNA555636, PRJNA329548, PRJEB8783). (B) Methylome assembly and annotation. Raw kinetic data were log-transformed, scaled, and standardized according to run-specific statistics in unmodified bases (Figure 1—figure supplement 1). Variation between technical replicates were used to adjust priors based on coverage to build pdfs for a Bayesian classifier. Methylation status of characterized motifs was classified with a Bayes’ classifier based on kinetics of unmodified and modified bases for each motif (Materials and methods). We processed all motifs of identified MTBC complex methyltransferases (Zhu et al., 2016) and assembled the methylome of each isolate with each motif site classified as methylated, hypomethylated, or indeterminate. We annotated each assembled methylome with overlapping and proximal features transferred by Rapid Annotation Transfer Tool (RATT) (Otto et al., 2011) from virulent type strain H37Rv. (C) Methylome variation. We mapped MTase genotypes to methylation levels of their motifs to describe novel active, partially active, and inactive alleles responsible for varying degrees of motif methylation (Supplementary file 1). We analyzed heterogeneity with SMALR (Beaulaurier et al., 2015) to characterize the capacity for methylomic variation within isogenic colonies and to probe for phase variation. We applied phylogenetic analysis of MTase genotypes and their corresponding methylation activity profiles to determine how DNA methylation across evolutionary time and identify epigenetic convergence across lineages. (D) Comparative and functional methylomics. We surveyed whole methylomes to identify motif sites and isolates with anomalous patterns. To examine motif sites consistently classified as hypomethylated for previously described causes of hypomethylation (Beaulaurier et al., 2019), we screened against published TFBS affinities (Minch et al., 2015) for interactions with DNA methylation (Supplementary file 5). We also screened for proximal motif sites among hypomethylated bases, which can create epigenetic ‘switches’ (Hernday et al., 2002). To identify putative cis-regulatory interactions with DNA methylation (Supplementary file 6), MTase motif sites were integrated with promoter element annotations (transcription start sites and sigma factor binding motifs).
Figure 1—figure supplement 1
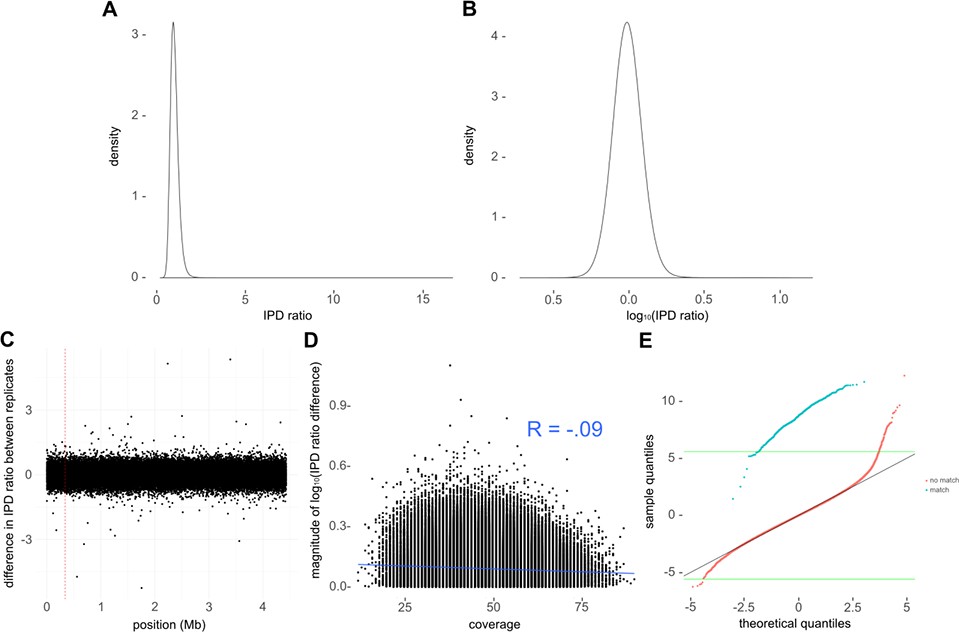
Kinetic data pre-processing and quality control.
(A) Distribution of inter-pulse duration (IPD) ratios across all bases for one of the replicate runs of avirulent type strain H37Ra. (B) log10-transformation converts log-normal distribution in A into normal distribution of log10 (IPD ratio). (C) Difference in sequencing kinetics (log2 (IPD ratio)) for each base between replicate H37Ra SMRT-sequencing runs across the genome. Only a subsample of bases (n = 100,000) are shown. Note that there were four discrepant bases the H37Ra replicates, each of which were single base insertions. This error rate (roughly 1/106, or QV60) is in line with that expected of a good PacBio run at our average coverage (Koren et al., 2013). We removed the insertions from the discrepant run before comparing the IPD ratios between runs. The red-dashed vertical line indicates the first position removed. (D) Difference in log10 (IPD ratio) between replicate runs as a function of coverage. This comparison showed a weak (R = −0.0872, Pearson’s correlation coefficient) but significant correlation (p = 1.04×10⁻¹⁰) with decreased discrepancy as coverage increased. (E) Quantile–Quantile plot comparing log10-transformed IPD ratios at a subset of mamA motif sites (blue) and at non-mamA motifs (red) to theoretical values in a perfect normal distribution (black diagonal line). Green horizontal lines depict extremes expected to appear only once in the theoretical normal distribution.
Figure 2 with 2 supplements
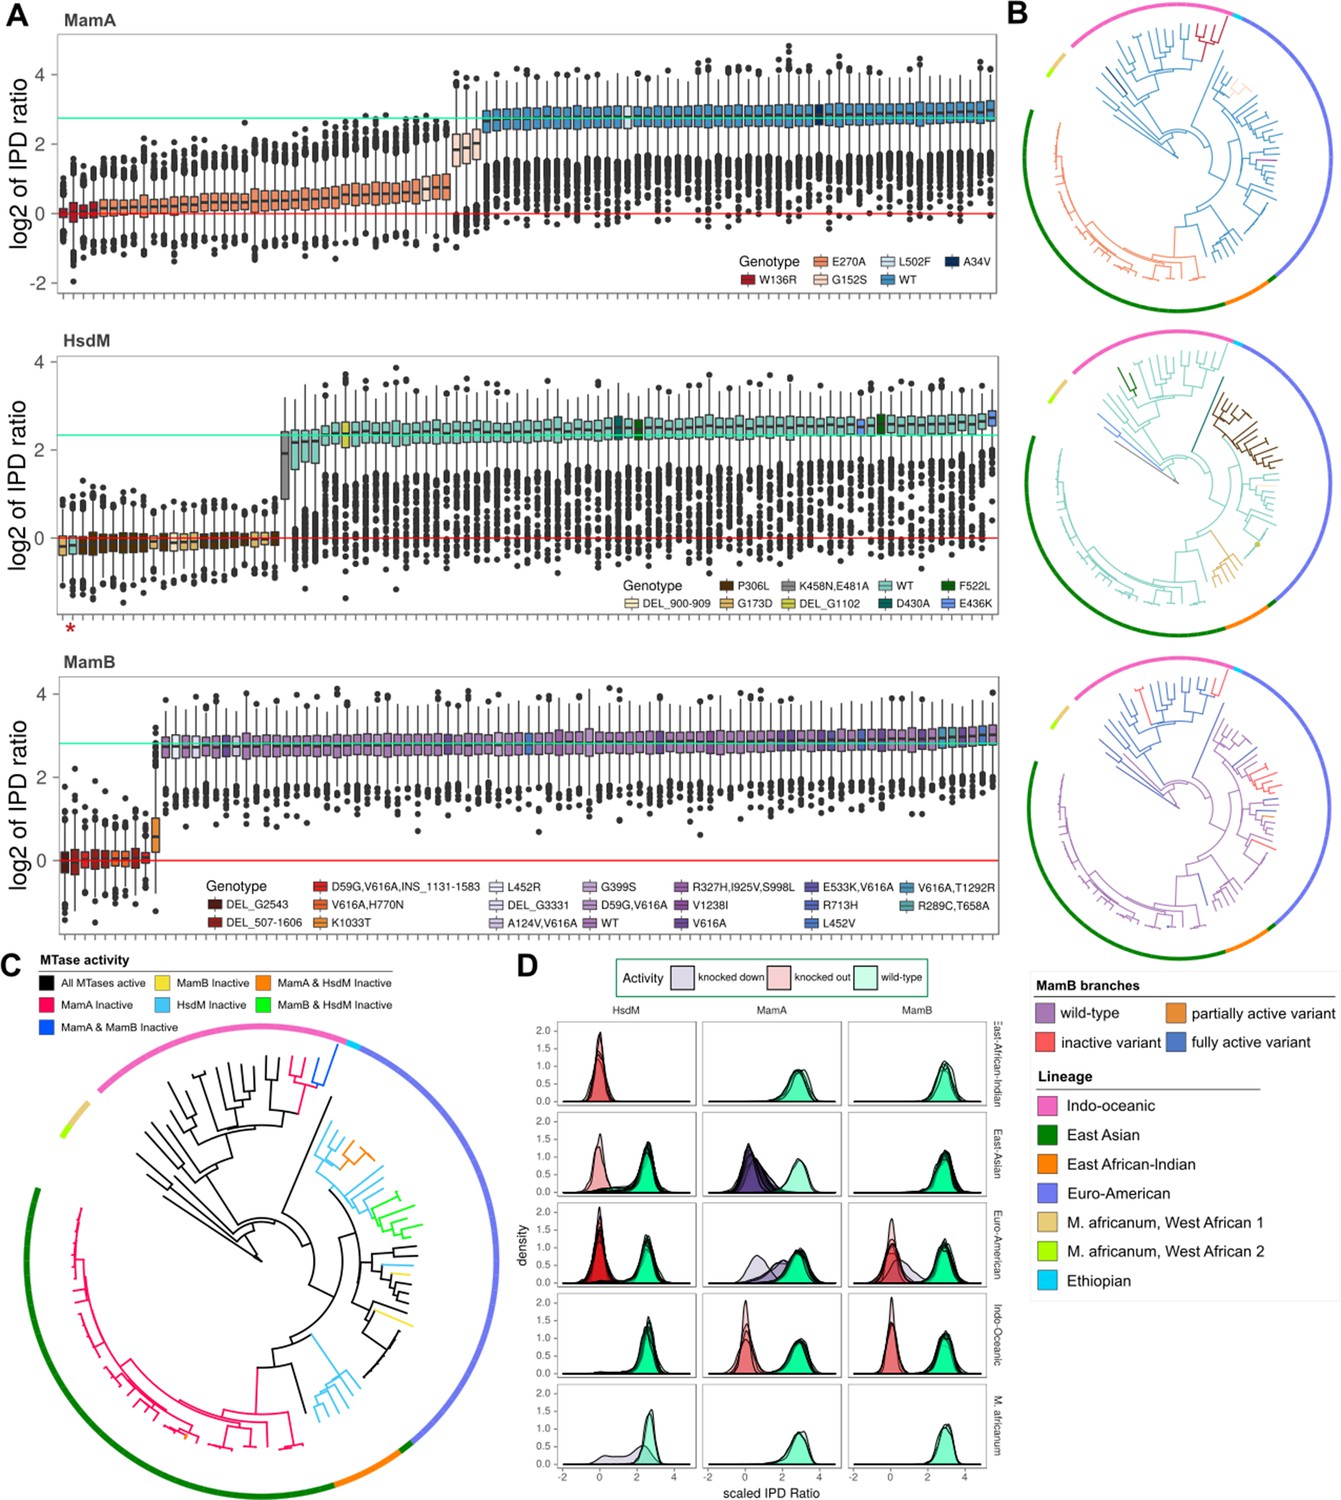
MTase activity patterns and genotypes across clinical and reference strains.
(A), Boxplots of inter-pulse duration (IPD) ratio distributions within MamA (top pane), HsdM (middle pane), and MamB (bottom pane) target motifs for each M. tuberculosis or M. africanum isolate. Boxplots are colored by mamA, hsdM, and mamB genotype. In one isolate, hsdS L119S mutation disrupted methylation capacity and is marked by an asterisk (*). In each pane, horizontal lines mark the mean log2 (IPD ratio) of motif sites for isolates with active (mint line) and inactive (red line) MTases. (B) SNP-based phylogenetic trees with mutations mapped for each MTase. Isolates are colored by MTase genotype using the same colors as the boxplots in A, except for MamB, which is colored by MTase activity. The phylogeny was built using maximum likelihood on a concatenation of 22,393 SNPs with M. bovis and M. canetti as outgroups. Colors of the outer rung indicate lineage. (C) Phylogeny of isolates in this study with branches colored according to the MTase activity profile. Colors of the outer rung indicate lineage according to the same color scheme as B. (D) Density traces of sequencing kinetics for each isolate at every motif site, organized into panes by MTase (columns) and lineage (rows), and colored by the activity of their MTase. The fill underneath each density trace is rendered translucent such that overlapping distributions from multiple isolates appear progressively darker as a function of the number of overlapping distributions.
-
Figure 2—source data 1
Scaled log2 (IPD ratios) for each site with MTase genotype.
- https://cdn.elifesciences.org/articles/58542/elife-58542-fig2-data1-v1.csv
-
Figure 2—source data 2
Scaled log2 (IPD ratios) for each site across isolates with lineage metadata.
- https://cdn.elifesciences.org/articles/58542/elife-58542-fig2-data2-v1.csv
Figure 2—figure supplement 1
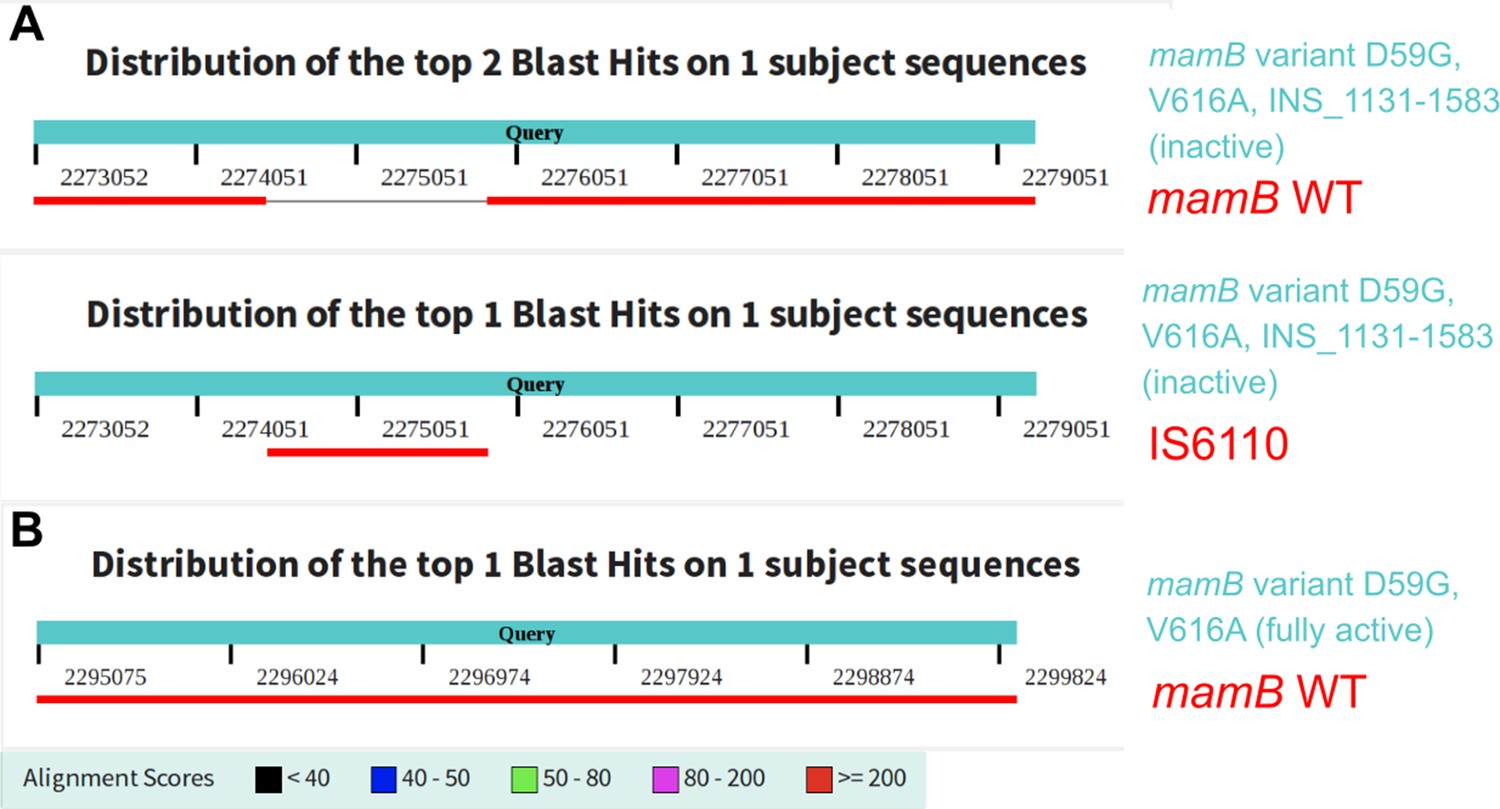
Correction of a mischaracterized mamB variant effect via direct comparative genomics.
Alignment of wild-type mamB and insertion element IS6110 to mutant mamB genes from clinical M. tuberculosis isolates. Recently, a clinical M. tuberculosis isolate (SRA:ERP009820) was reported with inactive DNA methyltransferase MamB and to harbor only mamB variant D59G (Chiner-Oms et al., 2019). Our analysis of that same isolate revealed a 1356 bp insertion of an IS6110 element, as well as variant V616A. Alignment to transposable element IS6110 determined the identity of this large insertion. (A) Alignment summary from a megablast of the wild-type mamB sequence against the variant mamB gene with the large insertion. Below is the alignment summary from a megablast of IS6110 against the variant mamB gene. (B) Alignment summary from a megablast of the wild-type mamB sequence against the mamB gene in a clinical isolate which shared the mamB variant D59G and V616A, but lacked the large insertion, and had active methylation of MamB target sites. The alignment had 0 gaps and two mismatches (identity 4819/4821).
Figure 2—figure supplement 2
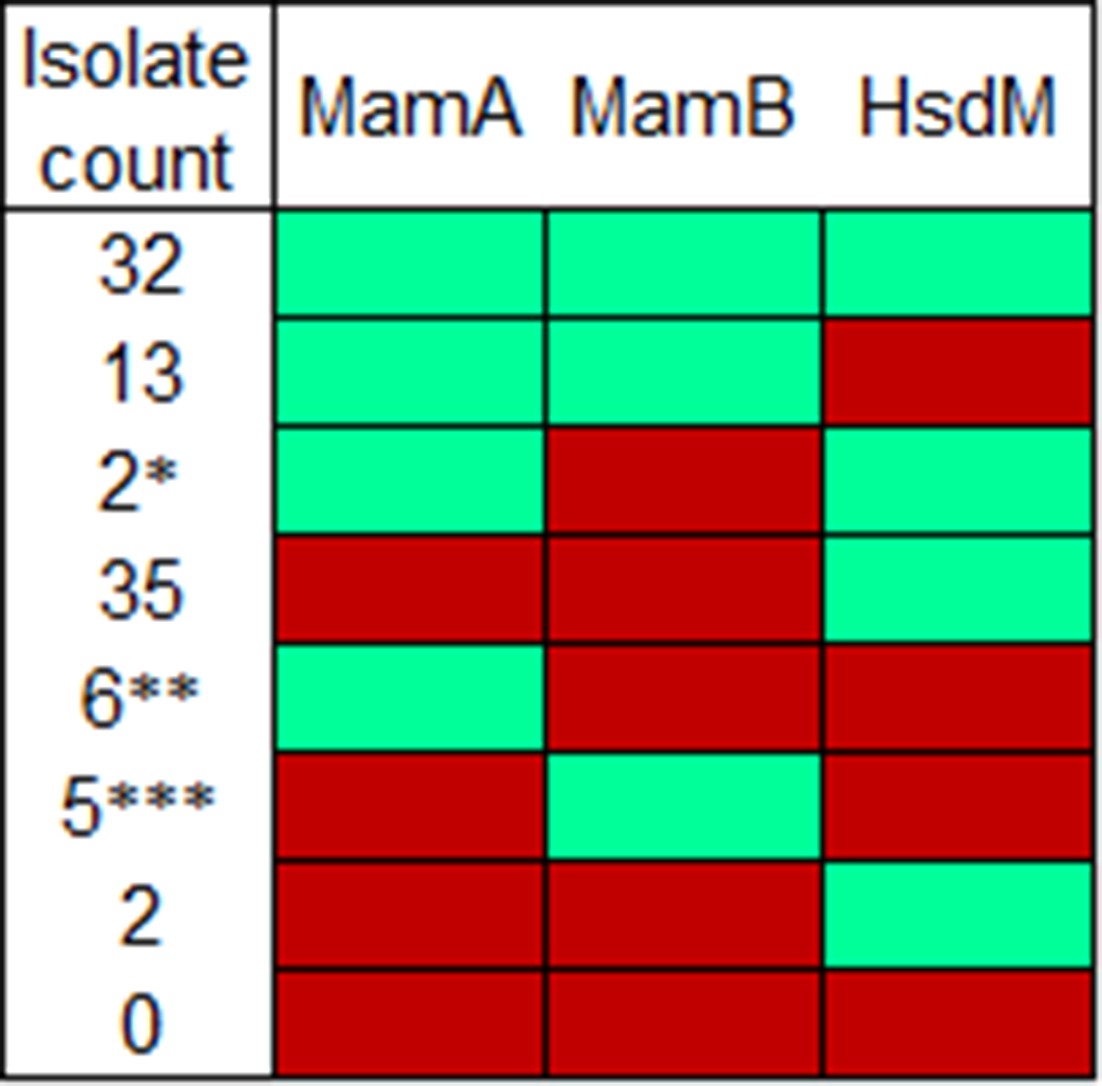
Methyltransferase activity by isolate count.
Activity profiles measured here by number of isolates in the dataset with that profile. Mint represents normal methyltransferase activity while red represents reduced or absent activity. *Includes partially active variant K1033T. **Includes reference strains H37Rv and H37Ra. ***Includes partially active variant G152S.
Figure 3 with 1 supplement
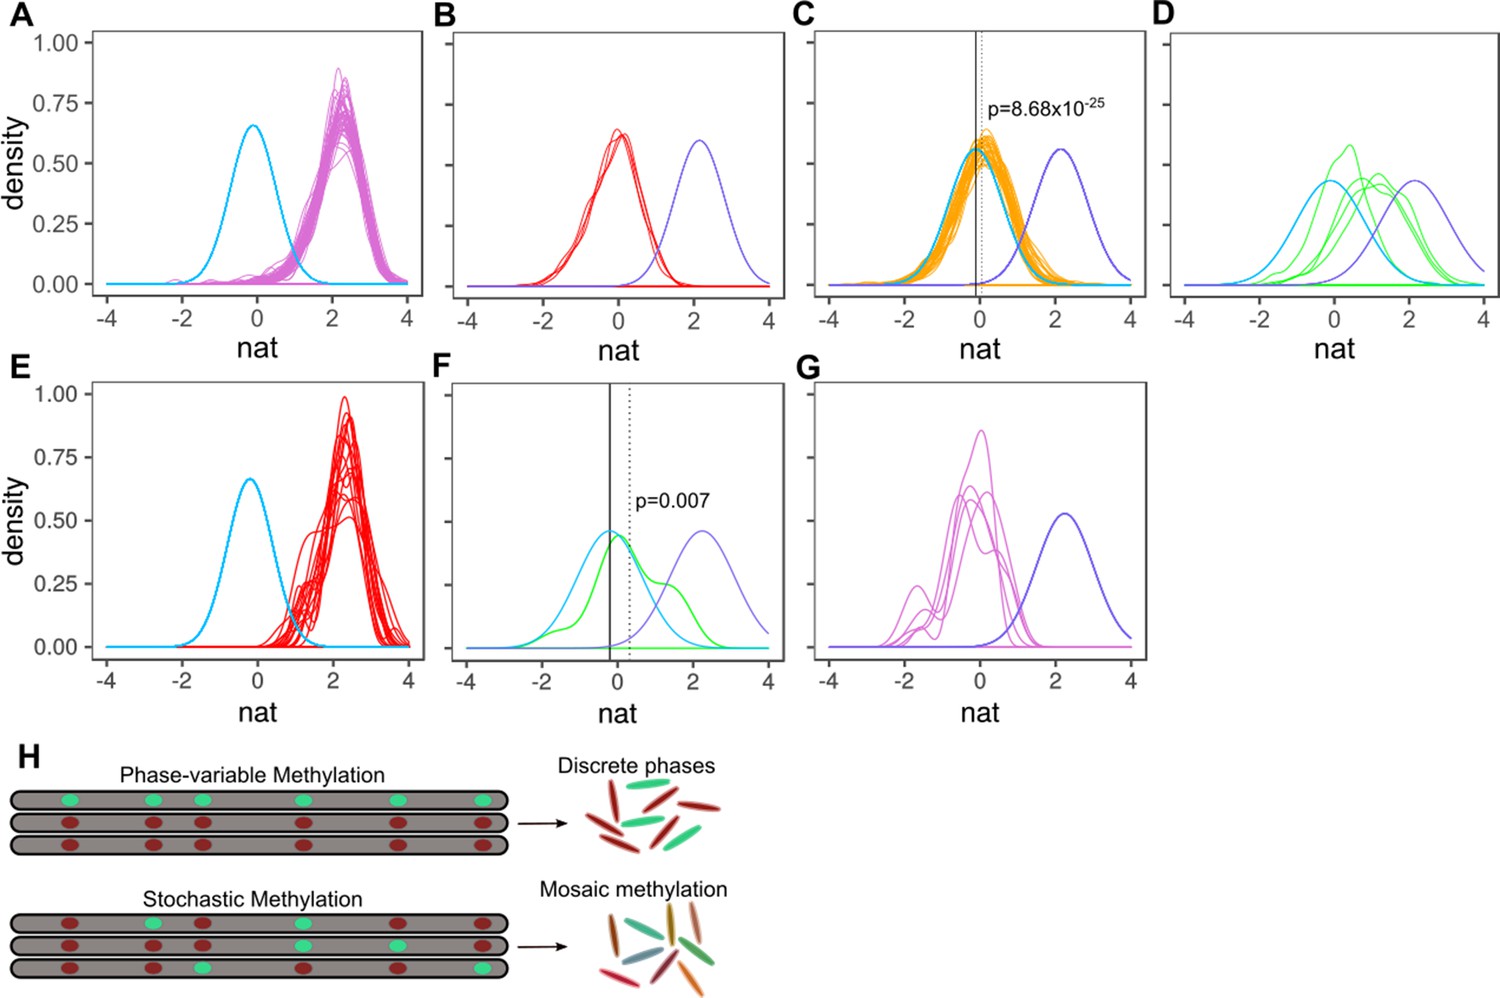
Characterizing methylation heterogeneity in M.tuberculosis clinical isolates.
Native IPD value (nat) is the subread-mean normalized natural log of IPDs (as output from SMALR Beaulaurier et al., 2015) across all motif sites within a subread. (A-G) depict the distribution of mean native IPD values among subreads for each isolate of the specified MamA or MamB allele. Each colored trace corresponds an isolate. Each pane has two reference curves: a mean native IPD value, number of measurements (isolates), and identical standard deviation identical to those of the inactive genotypes (light blue) and a curve with a mean native IPD value, standard deviation, and number of observations (isolates) identical to that of isolates with wild-type MamA (A-D) or MamB (E-G) activity (light violet). (A) mamAWT. (B) mamAW136R. (C) mamAE270A. The dotted vertical line marks the mean native IPD value for all mamAE270A isolates. (D) mamAG152S. (E-G) Putative heterogeneous methylation by mamBK1033T mutant (same as A-D, but for mamB). Only isolates with >19 qualifying subreads are included (at least 6 CACGCAG motifs are required within the subread to qualify). (E) Wild-type MamB (n = 16 passing inclusion criteria). There is no consistent signature of stochastic heterogeneity or phase variation. (F) mamBK1033T (n = 1) appears to exhibit low MTase activity, with mean native IPD dotted line well below that of wild-type MamB and the inactive genotypes (solid black line) and significantly greater than the mean native IPD value of inactive genotypes, suggesting stochastic heterogeneity. This native IPD value resembles the low-level MTase activity in isolates harboring the mamAE270A allele. (G) All qualifying isolates (n = 5) with mamB inactive alleles. Despite harboring different nonsynonymous mamB mutations (n = 4), mamB motifs appear entirely unmethylated, with a native IPD value consistent with inactive MTase genotype (Beaulaurier et al., 2015) and no clear signals of phase variation or intracellular stochastic heterogeneity. (H) Stochastic versus phase-variable methylation. Conceptual illustration depicting the distinction between methylome diversity within colonies exhibiting phase-variable methylation (top) and stochastic methylation (bottom). Each gray segment represents a chromosome from an individual cell within the colony. Each oval within the segment represents a motif site, illustrated as methylated (mint) or unmethylated (red).
-
Figure 3—source data 1
Read-level sequencing kinetics of MamA MTase motif sites in 93 MTBC clinical isolates.
- https://cdn.elifesciences.org/articles/58542/elife-58542-fig3-data1-v1.csv
-
Figure 3—source data 2
Read-level sequencing kinetics of MamB MTase motif sites in 93 MTBC clinical isolates.
- https://cdn.elifesciences.org/articles/58542/elife-58542-fig3-data2-v1.csv
Figure 3—figure supplement 1
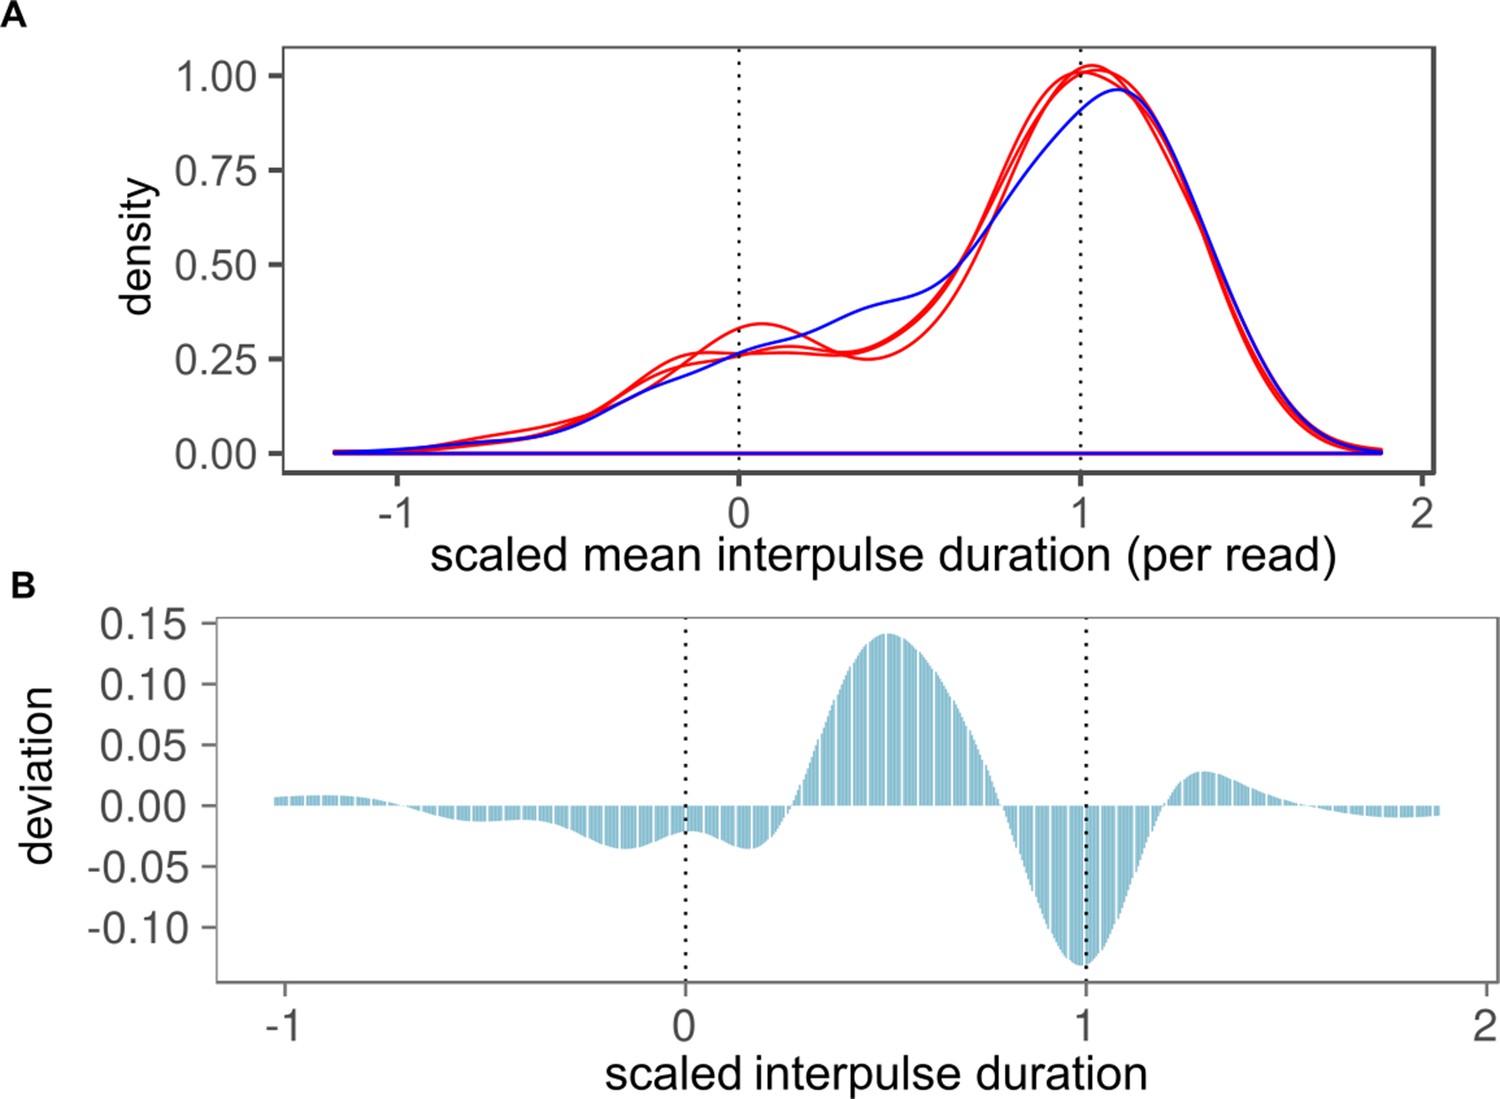
Observed distribution of native IPD values in methionine-starved H37Rv∆metA compared to simulated phase-variant mixture.
(A) Effect of methionine starvation induces heterogeneous methylation within single subreads. Heterogeneity analysis of previously published SMRT-sequencing data from a methionine auxotroph H37Rv mutant (Berney et al., 2015) (H37Rv∆metA, blue trace). Simulated bimodal distributions scores were generated from mamAW136R (inactive MamA) strains and wild-type H37Rv runs (active MamA) to simulate a mixture of wholly methylated and wholly unmethylated reads (red traces). Reads were included according to the ratio of mean native IPD value in H37Rv∆metA to mean native IPD value of wholly methylated runs (dashed vertical lines), scaled between 0 (wholly unmethylated) and 1 (wholly methylated). (B) Kinetics of methionine-starved H37Rv differ from phase-variant-simulated mixture. Peak height on the bar chart depicts the simulated bimodal distribution subtracted from the observed distribution. Dotted lines mark mean native IPD values (post-scaling) of wholly non-methylated and methylated reads.
Figure 4 with 2 supplements
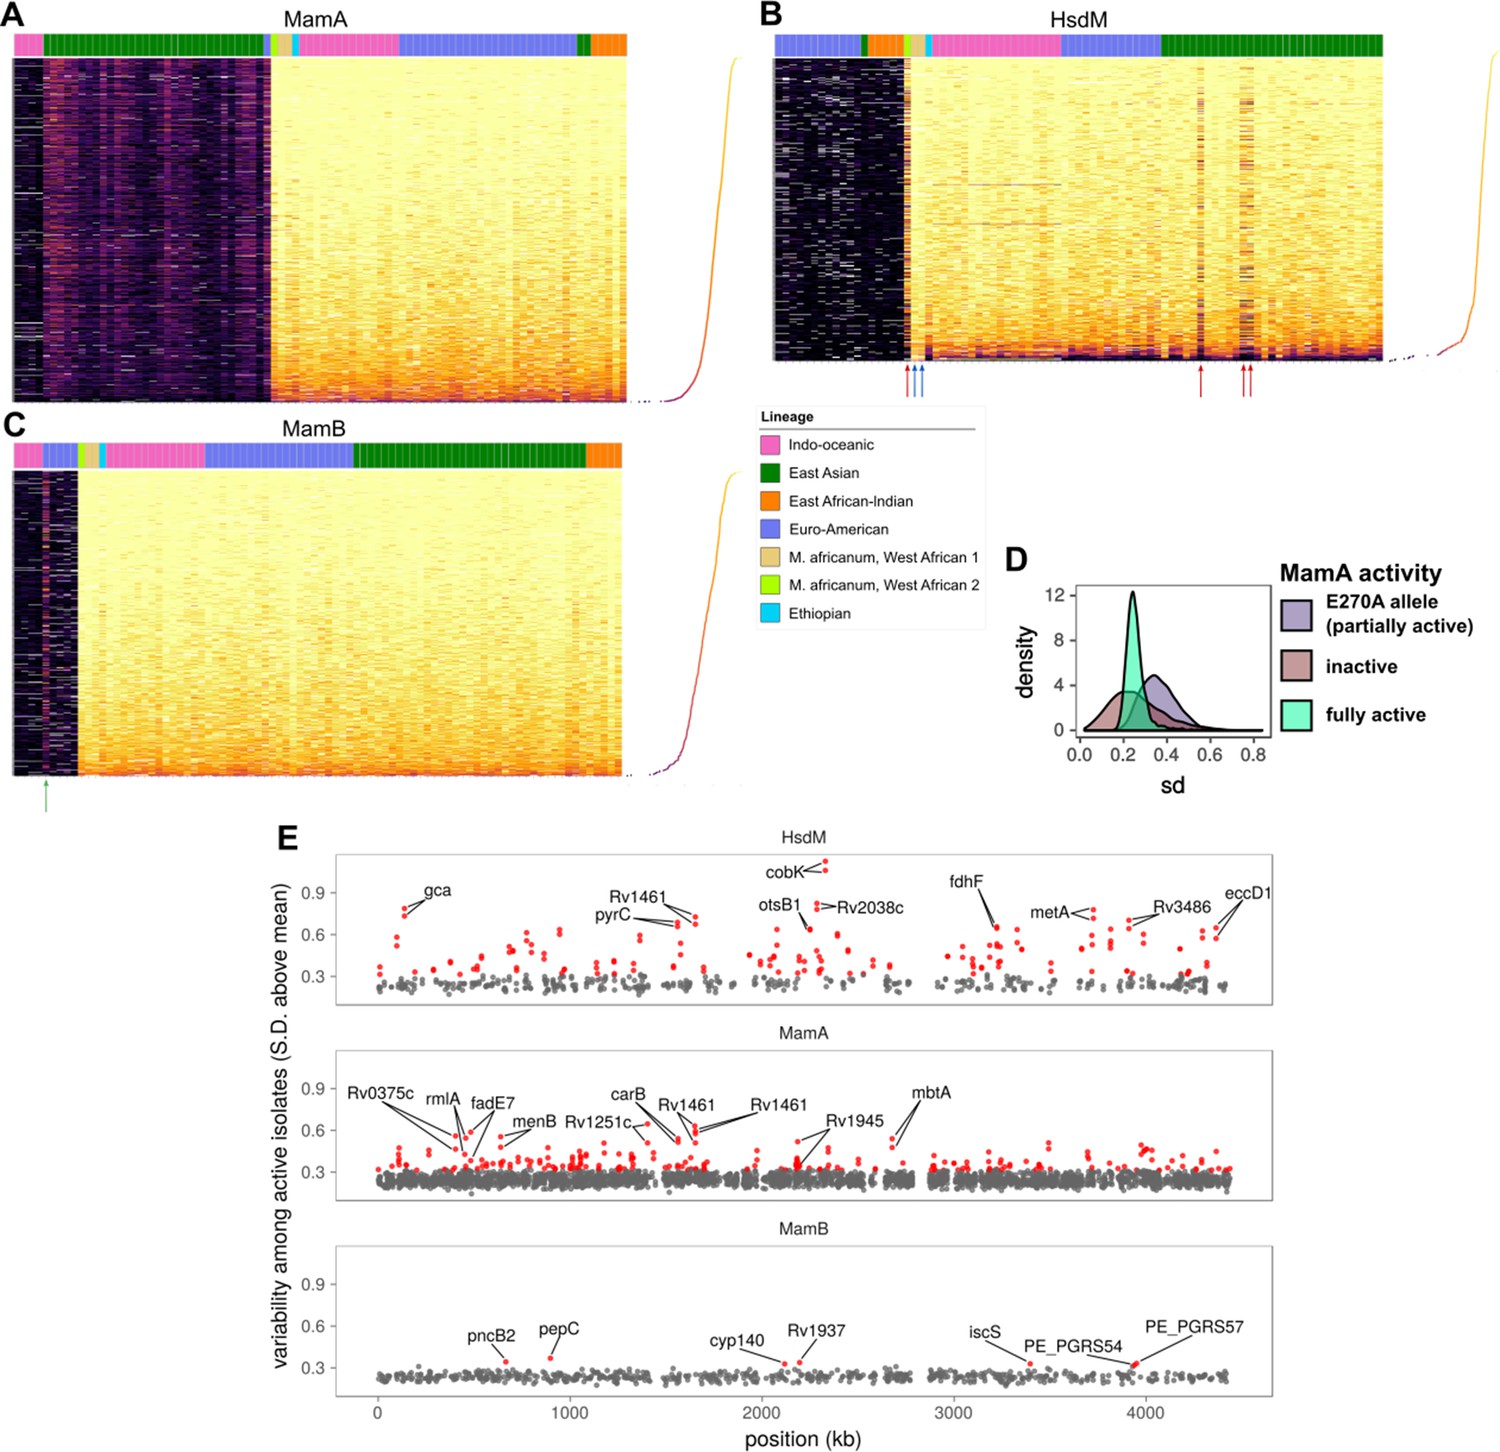
Comparative methylomics identifies DNA methylation anomalies in orphan MTases and motif sites.
Heat maps of sequencing kinetics for (A) MamA, (B) HsdM, and (C) MamB motifs at all common (in ≥75 isolates) motif sites (y-axis), descending according to median sequencing kinetics (log2 (IPD ratio)). Isolates (x-axis) are sorted from left to right by activity level, lineage, and genotype in decreasing priority. Lineages are Indo-Oceanic (IO), East-Asian (EAS), East-African-Indian (EAI), Euro-American (E), Ethiopian (Lineage 7), and the M. africanum lineages 5 and 6. Dots on the rotated plot adjacent to the heatmap express the median log2 (IPD Ratio) for each site across isolates. Darker and lower dots indicate a lower median (log2 (IPD Ratio)). Red arrows mark isolates with wild-type or near wild-type MTase activity that exhibit hypomethylation at more motif sites (dark bands) than other wild-type isolates. Blue arrows mark two isolates with significantly fewer hypomethylated motif sites than other isolates with wild-type HsdM activity, for unknown reasons. The green arrow in the MamB plot marks an isolate with an IPD ratio significantly higher than expected for an inactive isolate, suggesting some MTase activity for the genotype. (D) Distribution of standard deviation (sd) sizes among MamA motif sites across isolates with one of three methylation activity levels: partial MamA activity from the E270A mutation common to EAS isolates, the loss-of-function W136R mutation (‘knockout mutant’), or one of the genotypes encoding MamA with wild-type methylation activity. (E) Position (x-axis) in a representative genome and variability sd of (log2 (IPD Ratio)) in sequencing kinetics across isolates with active MTase (y-axis) at common motif sites (present in 75 or more isolates). Motif sites within three sd of the mean for MamB motifs are gray, and the outliers (>3 sd from mean) are highlighted in red. CDSs within which each of the top 10 most variable sites for each MTase occur are labeled, along with their palindromic partner motif site.
-
Figure 4—source data 1
Sequencing kinetics for all common (in >75 isolates) MamA motifs.
- https://cdn.elifesciences.org/articles/58542/elife-58542-fig4-data1-v1.csv
-
Figure 4—source data 2
Sequencing kinetics for all common (in >75 isolates) HsdM motifs.
- https://cdn.elifesciences.org/articles/58542/elife-58542-fig4-data2-v1.csv
-
Figure 4—source data 3
Sequencing kinetics for all common (in >75 isolates) MamB motifs.
- https://cdn.elifesciences.org/articles/58542/elife-58542-fig4-data3-v1.csv
-
Figure 4—source data 4
Per-site sequencing kinetics variability for all common (in >75 isolates) MamA motifs, with MamA activity.
- https://cdn.elifesciences.org/articles/58542/elife-58542-fig4-data4-v1.csv
-
Figure 4—source data 5
Per-site sequencing kinetics variability for all common (in >75 isolates) motifs, with variability classification.
- https://cdn.elifesciences.org/articles/58542/elife-58542-fig4-data5-v1.csv
Figure 4—figure supplement 1
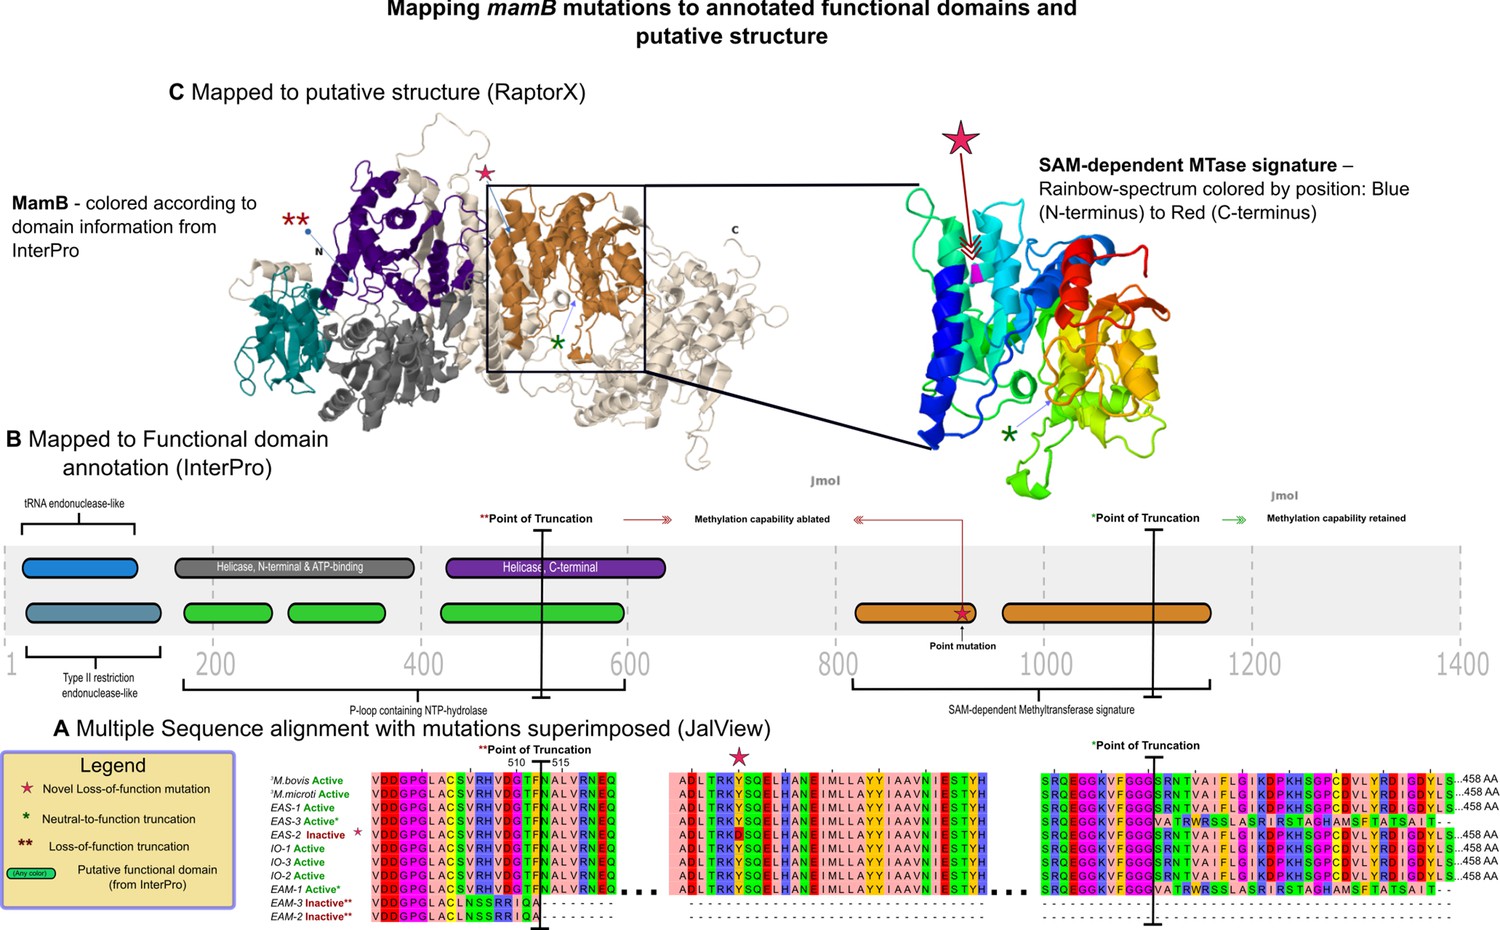
mamB mutations mapped to InterPro functional domains and predicted 3D structure.
Mapping of mutations in mamB and their effect on DNA methyltransferase (MTase) function, at the (A) primary, (B) secondary, and (C) tertiary levels of abstraction. Sequences from the assemblies examined in this study were drawn from the East-Asian (EAS), Indo-Oceanic (IO), and Euro-American (EAM) lineages, while those of the two ancestral mycobacteria, Mycobacterium bovis and Mycobacterium microti were obtained from a recent publication by Zhu and colleagues (Zhu et al., 2016). MamB amino acid sequences from these genomes were aligned with MTase functionality (inferred by methylation status of its motifs via SMRT-sequencing) indicated, and variants with respect to functional wild-type amino acid sequences mapped in the context of annotated domains from InterPro. These domains and mutations were in turn mapped colors are preserved from (B) to the left structure of (C) onto the predicted structure. This figure was adapted from the thesis of SJM (Modlin, 2018).
Figure 4—figure supplement 2
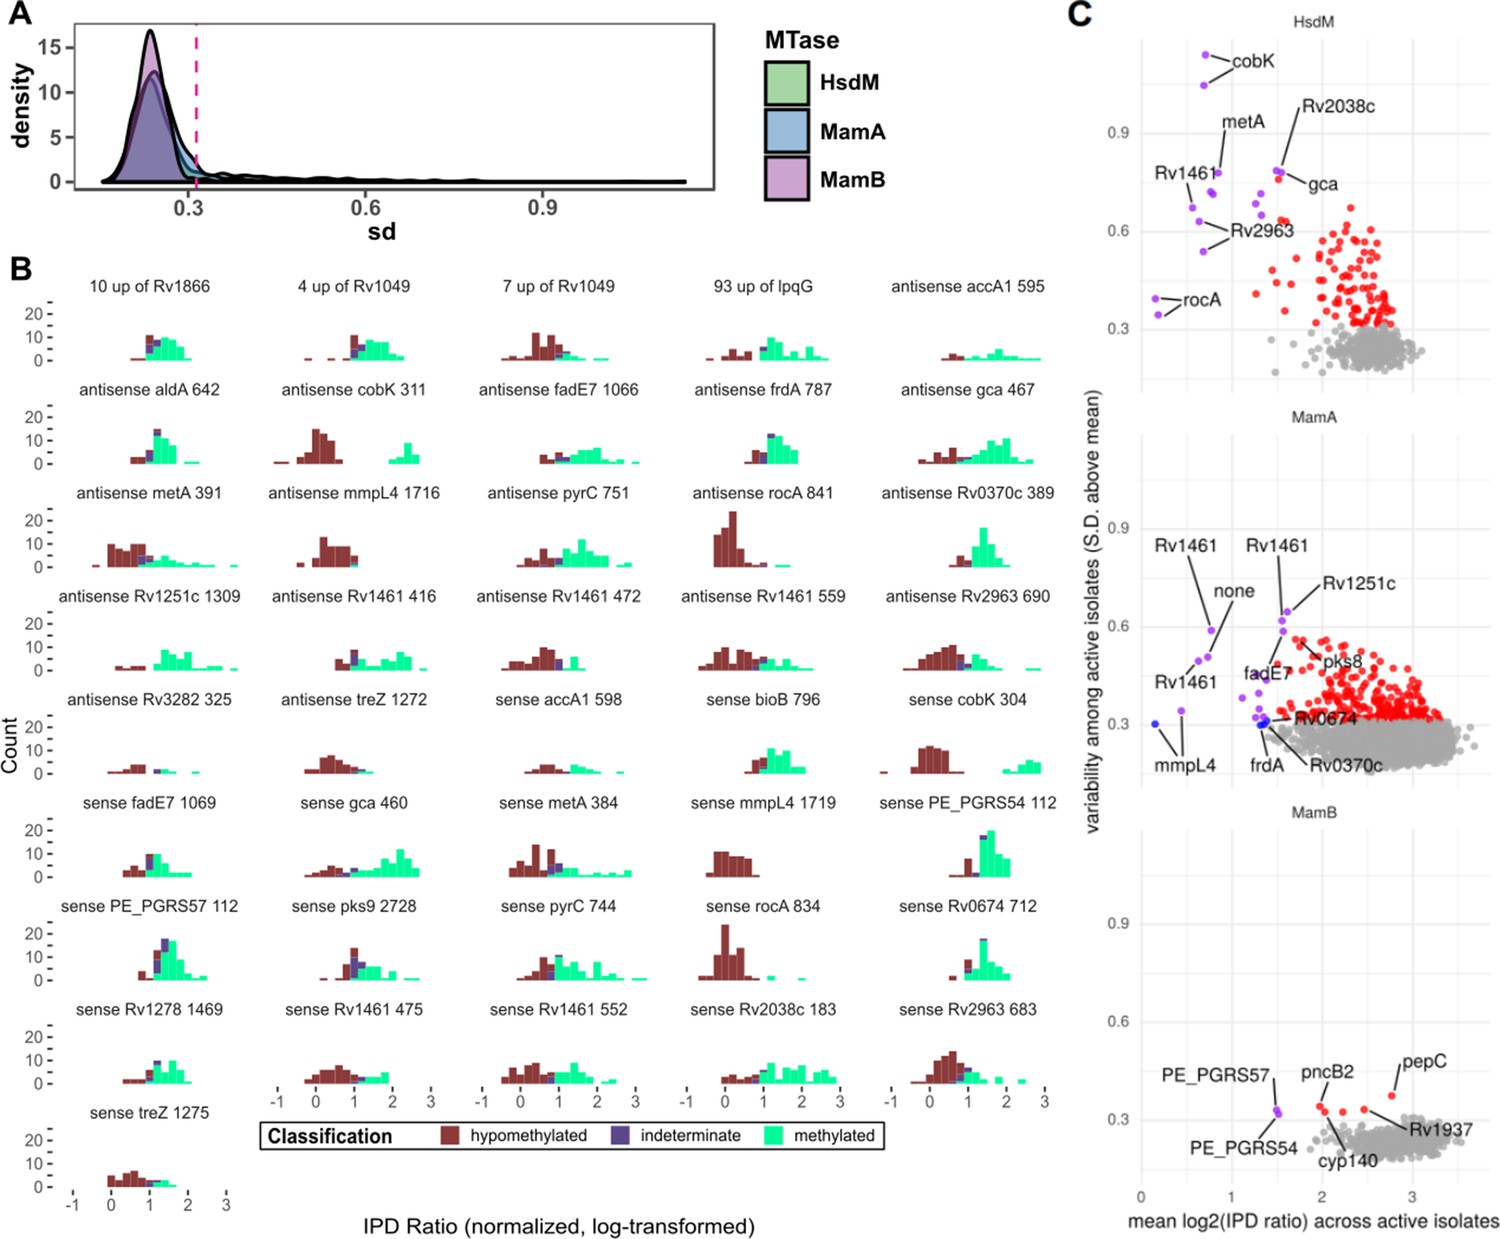
Statistical features of hypomethylated and hypervariable motif sites.
(A) Distribution of standard deviation (SD) size of kinetics (log2 of the IPD Ratio) for each common (n > 50) motif sites across isolates with the relevant DNA methyltransferase (MTase) active. MamB is least frequently hypomethylated and the three distributions appear similar outside of outliers and therefore defined the cutoff SD (of standard deviation size) for ‘hypervariable’ motif sites (SD size > 3 standard deviations above the MamB mean). (B) Distribution of the sequencing kinetics for consistently hypomethylated MTase motif sites (bin width = 0.2), across isolates with active genotype for the implicated MTase. Only sites present in ≥ half of the clinical isolates are shown. (C) Common motif sites plotted by mean and standard deviation of sequencing kinetics across isolates with active MTases, with points color indicating that the site is hypomethylated (blue), hypervariable (red), both hypervariable and hypomethylated (purple), or neither (gray). The top five most variable motif sites and bottom five mean sites for each MTase are labeled, if they classified as hypervariable and/or hypomethylated.
Figure 5 with 3 supplements
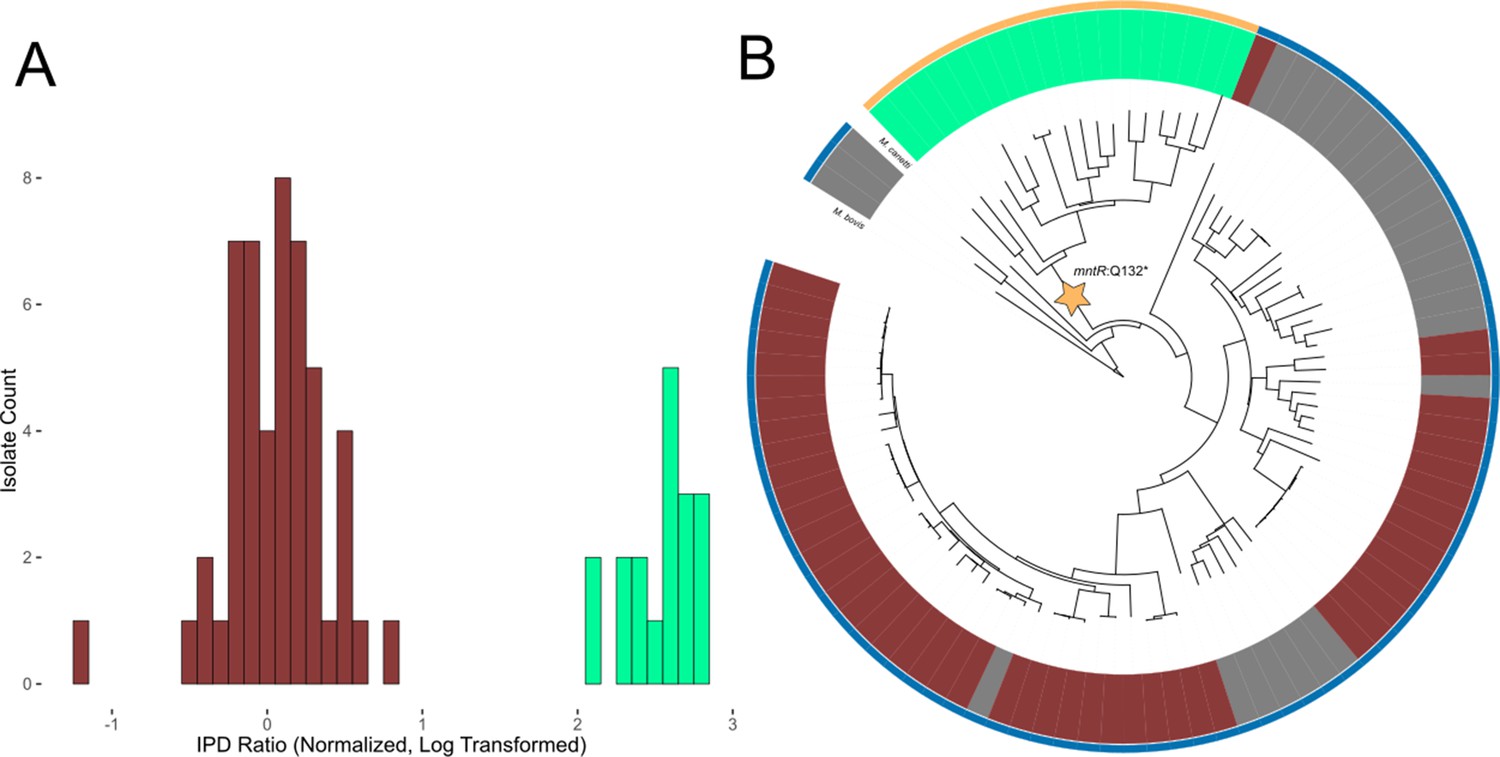
Evidence of transcription factor occlusion at hypomethylated MTase sites.
(A) Histogram showing the distribution of IPD ratios at the HsdM motif locus cobK:304, 304 bp downstream from the start codon of gene cobK. Included isolates have active HsdM and possess the HsdM target motif at the cobK:304 locus. IPD ratios are normalized to the mean IPD ratio of adenine bases in their respective isolates (excluding bases targeted by known MTase motifs) and log2-transformed. The histogram uses a bin width of 0.1. Red bars count isolates classified as ‘hypomethylated’ at the cobK site, while mint bars count isolates classified as methylated at the site. (B) Phylogenetic tree of the 90 clinical and reference M. tuberculosis isolates and 3 M. africanum isolates included in this study, along with outgroups M. bovis and M. canetti. Isolates are colored in the middle ring by their methylation status at the HsdM motif site cobK:304. Red isolates are classified as hypomethylated at the cobK site; green isolates are classified as methylated at the site, and gray isolates either have an inactive HsdM methyltransferase, or are missing the HsdM target motif 304 bp within their cobK gene. Isolates are colored in the outer ring by the genotype of their mntR (Rv2788) gene. mntR encodes for a transcription factor whose binding motif matches the context sequence of the cobK 304 site (p = 2.63×10⁻⁵, converted log-likelihood ratio score). Gold isolates had the variant mntR Q131STOP, a nonsense mutation that introduces an early stop codon that truncated the gene and presumably removed its function. The blue isolates do not have a nonsense mutation, though one isolate had the missense mutation mntR P149L.
Figure 5—figure supplement 1
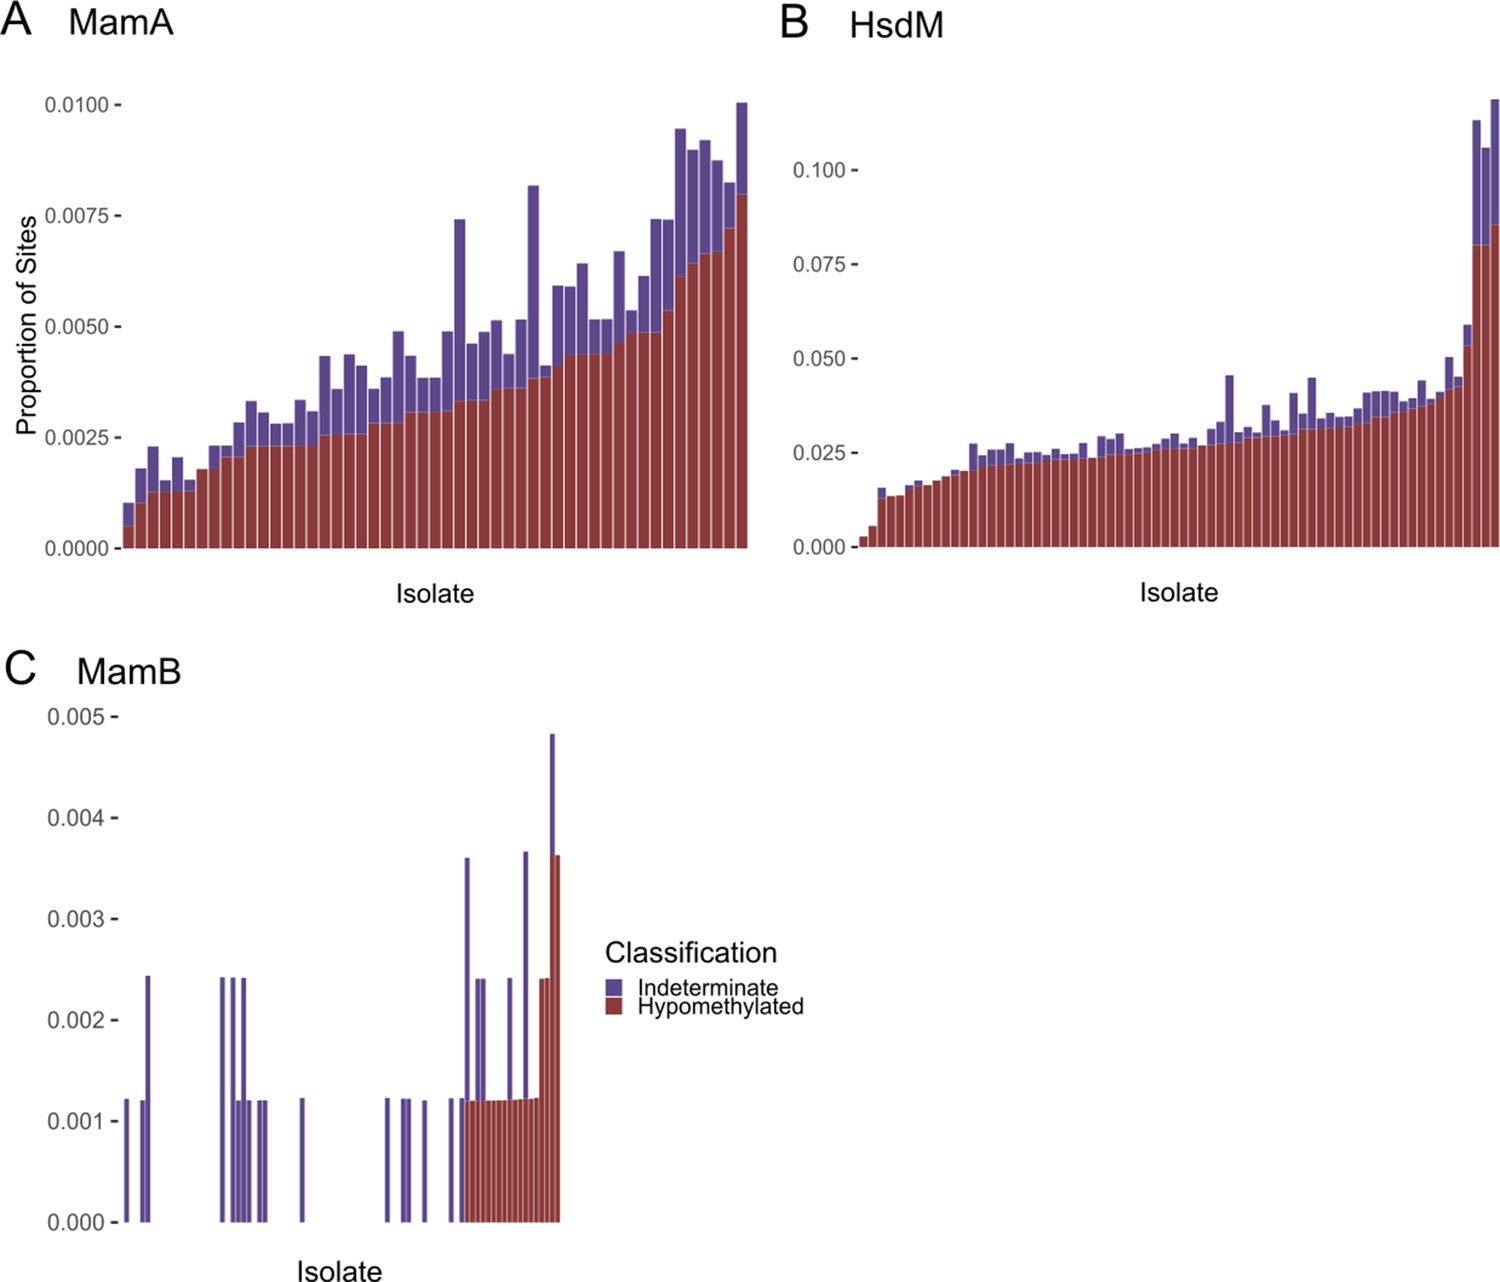
Frequency of hypomethylation calls in each M. tuberculosis clinical isolate.
(A) MamA, (B) HsdM, and (C) MamB. Methyltransferase (MTase) target bases in each of 93 single-molecule real-time (SMRT) sequenced clinical isolates were classified as methylated (not shown), hypomethylated, or indeterminate based on their sequencing kinetics. Stacked histograms depict the proportion of motif sites (y-axis) classified as hypomethylated (red) or indeterminate (purple) in each isolate (each bar represents an isolate, x-axis). Isolates are sorted (right to left) by the proportion of hypomethylated motifs. Only isolates with an active genotype for each MTase are included in the histograms.
Figure 5—figure supplement 2
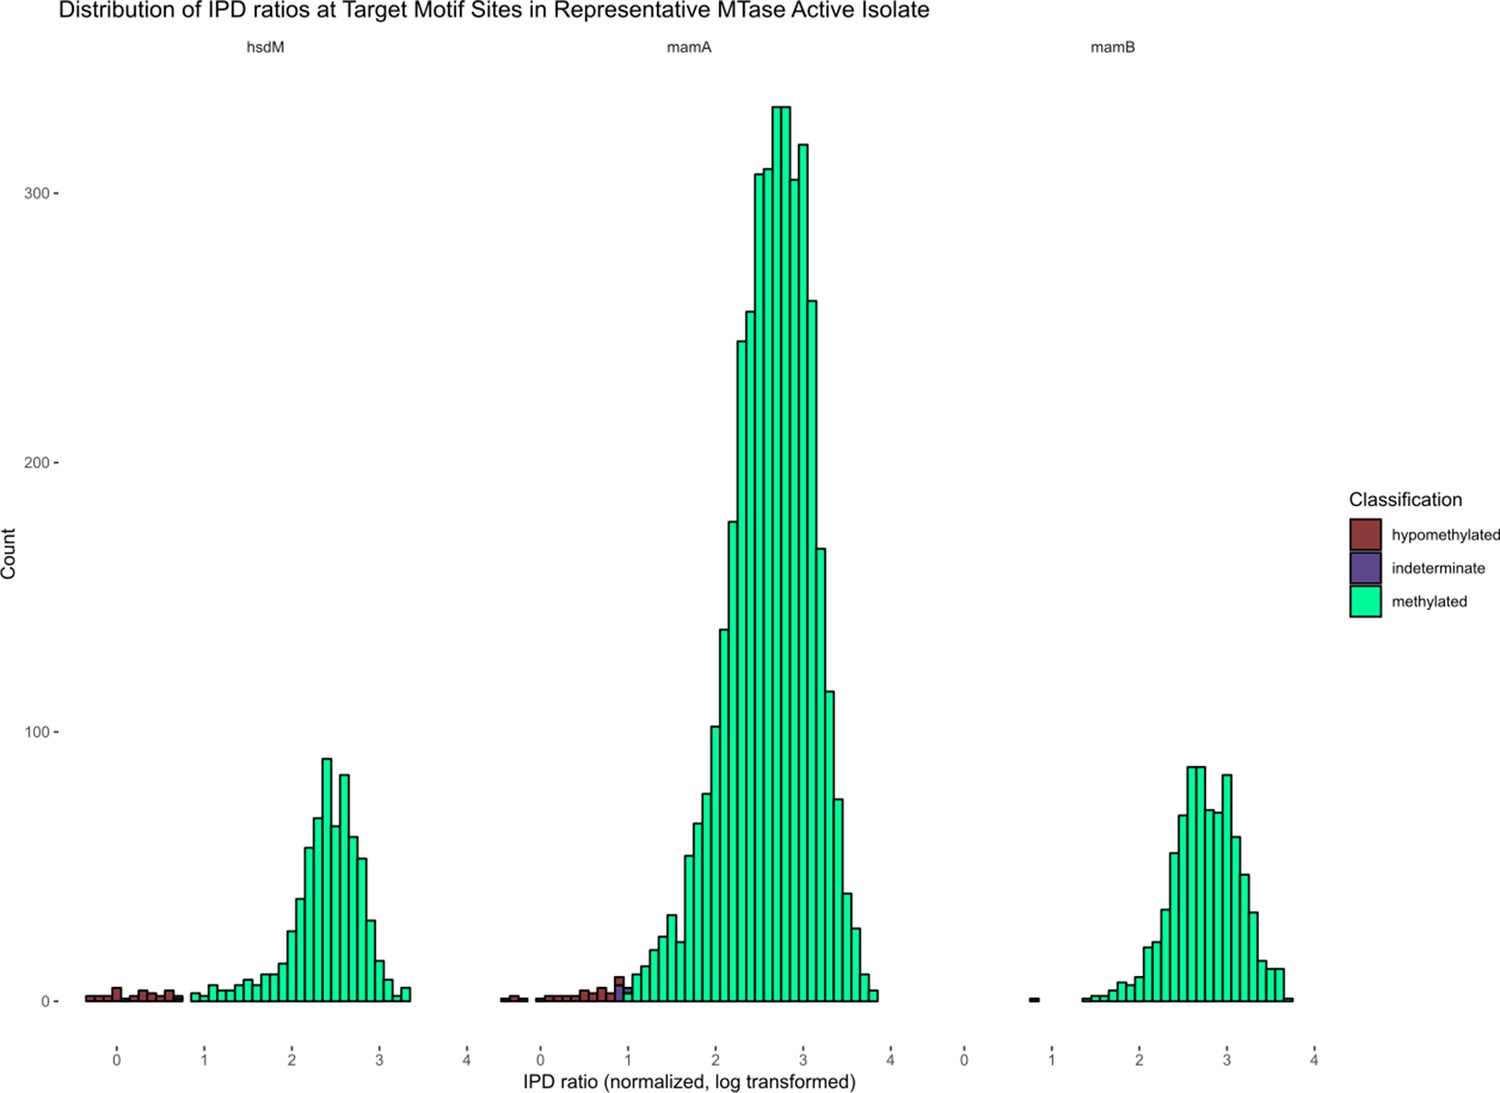
Distribution of IPD ratios in example M. tuberculosis clinical isolates, by Bayesian classification.
Histograms depicting the distribution of IPD ratios among bases within the target motifs of known methyltransferases HsdM, MamA, and MamB, after normalizing the IPD ratios of each base to the mean IPD ratio of all adenines within the isolate, and log-transforming the data. The bin width is 0.1 and the bars are labeled by the Bayesian classification of each base. The isolate shown is a clinical strain of M. tuberculosis with an active genotype of all three methyltransferases.
Figure 5—figure supplement 3
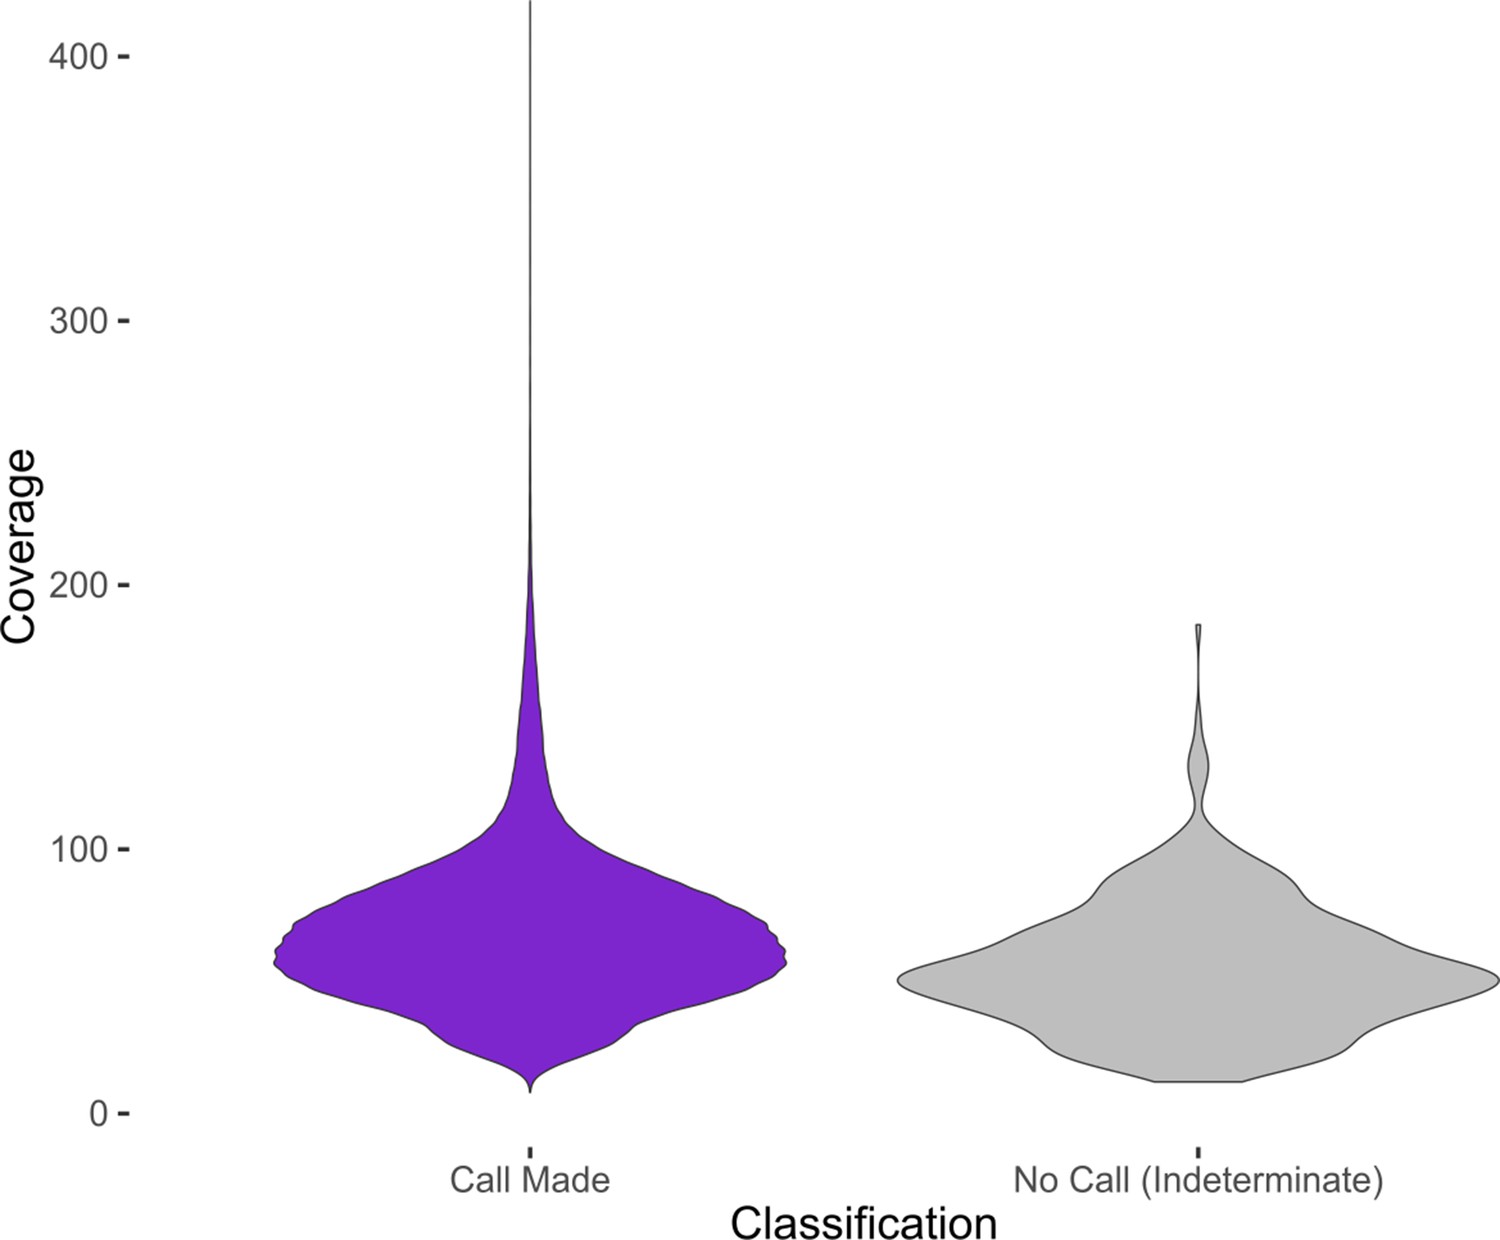
Distribution of coverage values at MTase motif sites for indeterminate and determinate calls.
Violin plots showing the distribution of coverage at MTase motif sites, aggregated from all clinical isolates. Only MTase sites whose respective MTase had an active genotype in their respective isolate were included. MTase sites that were classified as Indeterminate by the Bayesian classifier were grouped separately (purple) from the remaining sites (gray). The MTase sites with a definitive classification call had a higher mean coverage (68.2) than the MTase sites called Indeterminate (54.7), significant at 0.01 confidence level (Welch’s two sample t-test, p<2.2×10⁻¹⁶, one sided).
Figure 6 with 1 supplement
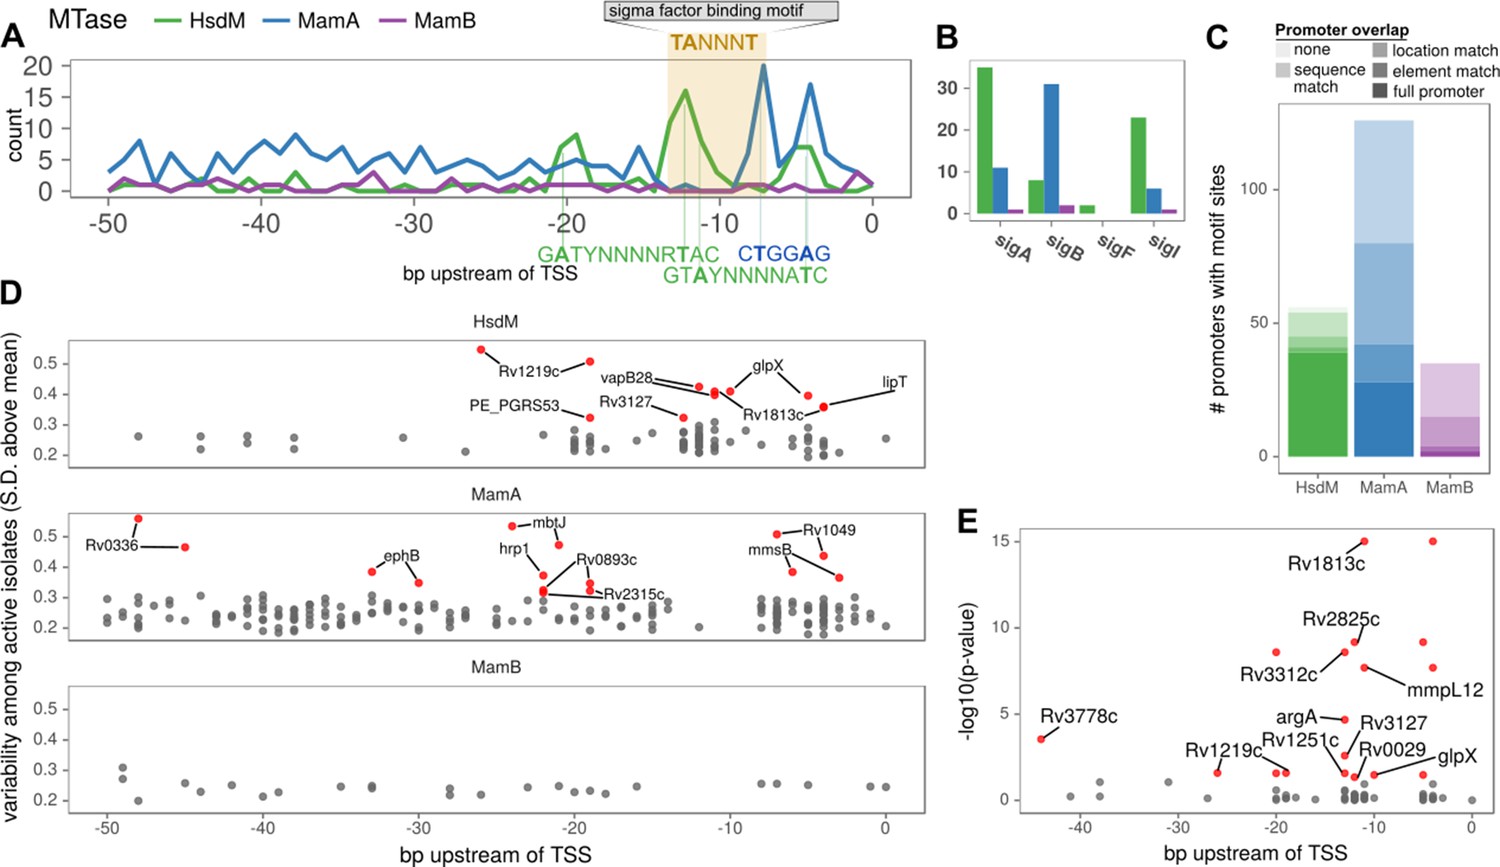
Configuration of orphan MTase motif sites at promoters suggests widespread epigenetic influence on transcription.
(A) Consistent MTase-SFBS-promoter configuration. Number of promoters with MTase motif sites (in ≥ 50 isolates) by distance upstream of TSSs, for each MTase. The canonical SigA −10 element binding motif is superimposed for conceptual clarity, all motif sites within the −7 to −12 bp window upstream of annotated TSSs are included, irrespective of SFBS overlap. MTase Motifs for overrepresented configurations (peaks) are shown in the orientation and positions that explain the observed peaks. (B) The number of promoters with the −10 element overlapping an MTase motif site (≥30 isolates), for each MTase and sigma factor. (C) Stacked histograms of the number of genes harboring promoter motif sites for each MTase. Darker shades indicate overlap with progressively more substantiated overlap with promoter elements. In ‘full promoters’ MTase motifs overlapped a SFBS that is part of a classical promoter architecture (Materials and methods); ‘Element’ matches overlap either the −10 or −35 SFBS the expected distance from the TSS but have neither an extended −10 promoter element nor the complementary element; ‘Location’ matches are the distance upstream of the TSS expected to overlap with −10 or −35 elements but do not overlap known SFBS motifs; ‘Sequence’ matches coincide with SFBSs but not in the expected position with respect to TSS; ‘none’ are ≤ 50 bp upstream of a TSS but meet none of the aforementioned criteria. (D) Variability (SD of log2 (IPD Ratio) across isolates) across isolates with active MTase (y-axis) for common (≥75 isolates) promoter motifs and their distance upstream of the TSS (x-axis). Downstream genes of hypervariable motif sites (≥3 SD above the mean MamB variability, red). (E) Genes with annotated HsdM promoter motifs integrated with a recent ΔHsdM differential expression (DE) study (Chiner-Oms et al., 2019). All HsdM promoter motifs plotted by position within the promoter (x-axis) and Benjamini-Hochberg adjusted -log10 (p-value) for DE (y-axis). Downstream genes of motif sites of significantly DE genes (red, BH-adjusted p≤0.05) genes overlapping the −10 element (7 to 13 bp upstream of TSS) are labeled. The two genes without overlapping sites the −10 element have both their motif sites labeled (if within 50 bp).
-
Figure 6—source data 1
Frequency and downstream CDS of frequent (in ≥ 30 isolates) MTase motif sites ≤ 100 bp upstream of a TSS.
- https://cdn.elifesciences.org/articles/58542/elife-58542-fig6-data1-v1.csv
-
Figure 6—source data 2
MTase motif sites overlapping −10 sigma factor binding motifs 7–13 bp upstream of the TSS.
- https://cdn.elifesciences.org/articles/58542/elife-58542-fig6-data2-v1.csv
-
Figure 6—source data 3
Promoters harboring MTase motifs and the extent of evidence for their overlap with promoter elements.
- https://cdn.elifesciences.org/articles/58542/elife-58542-fig6-data3-v1.csv
-
Figure 6—source data 4
Re-analysis of differential transcription data following HsdM knockout.
- https://cdn.elifesciences.org/articles/58542/elife-58542-fig6-data4-v1.csv
-
Figure 6—source data 5
Overlaps between −10 and −35 sigma factor binding sites and promoter MTase motif sites.
- https://cdn.elifesciences.org/articles/58542/elife-58542-fig6-data5-v1.csv
Figure 6—figure supplement 1
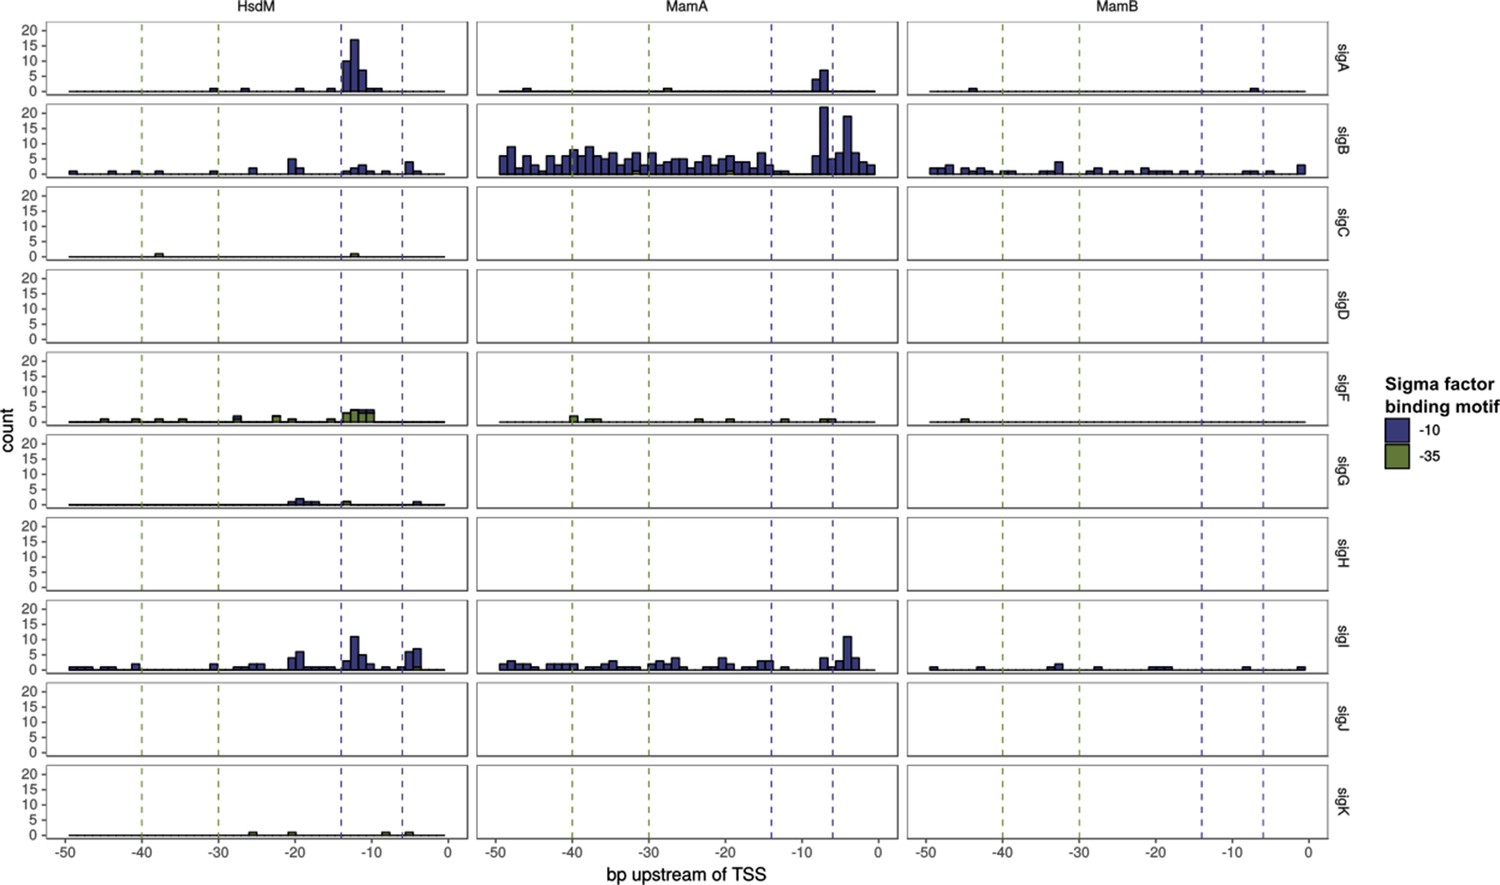
Sigma factor binding site (SFBS) motif and MTase motif overlap.
Histogram bar height corresponds to the number of TSSs harboring an overlap MTase motif-SFBS at that position. Only those appearing in at least 40 isolates are depicted. Bar color represents whether the SFBS motif was for a −35 or −10 element. The −10 and −35 regions are highlighted with dashed vertical lines in each plot.
Figure 7 with 1 supplement
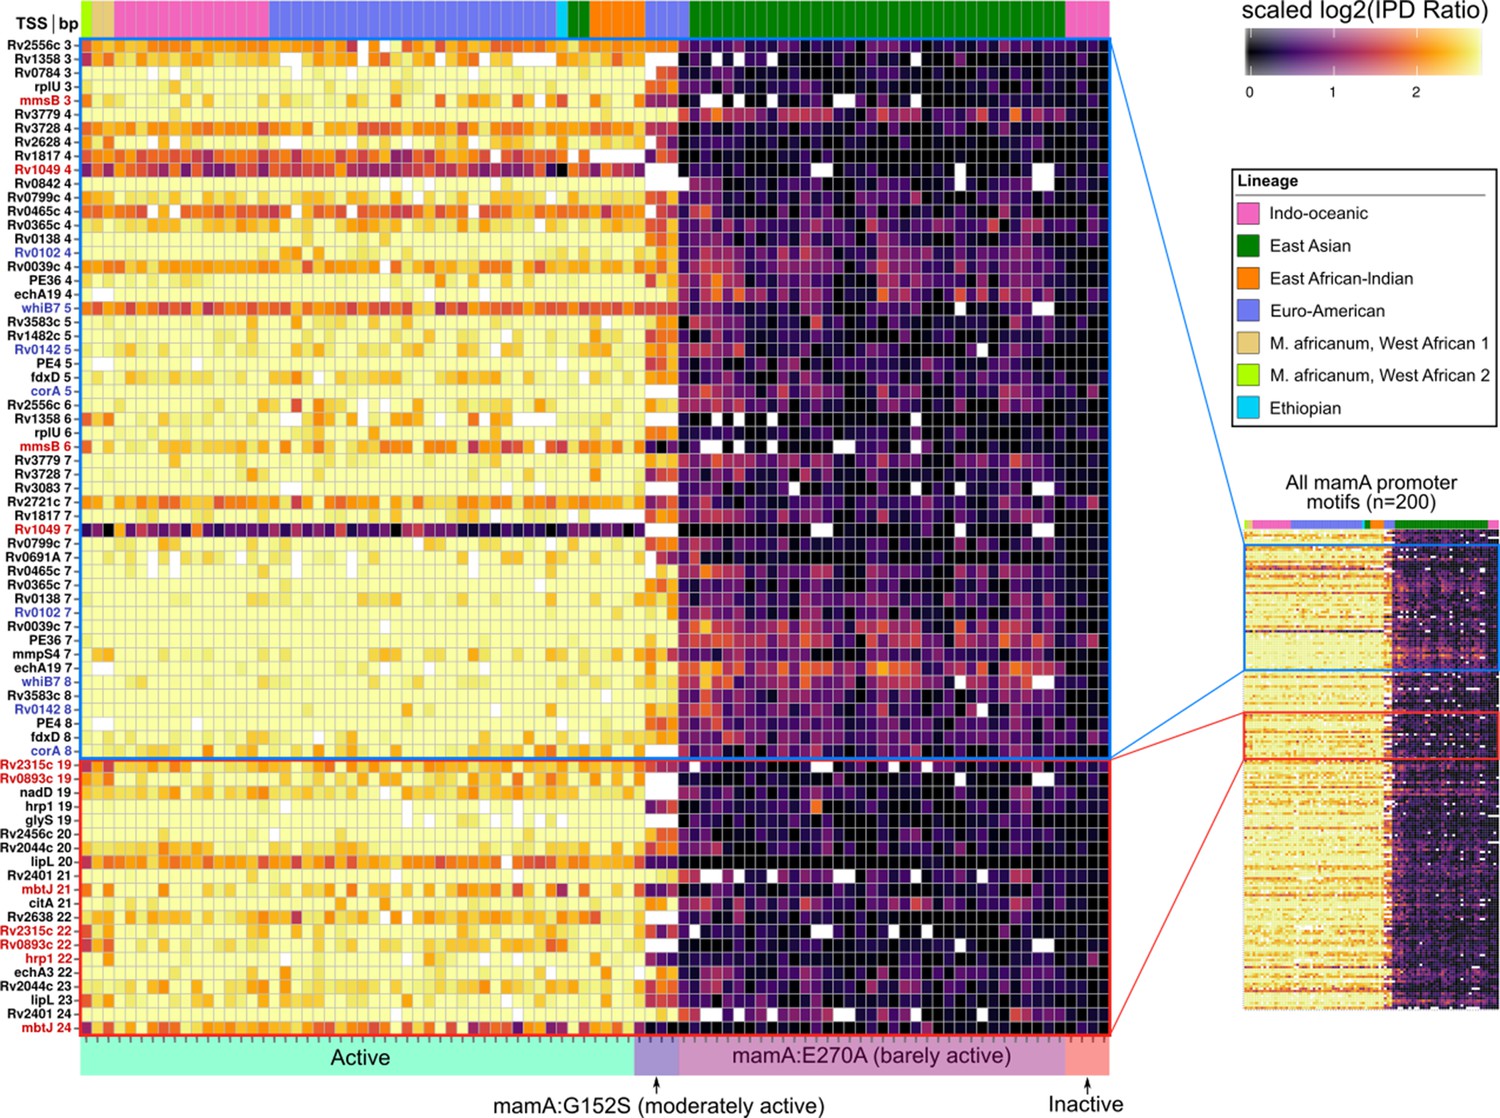
Methylomic variation at promoters harboring orphan MTase motifs: MamA motifs.
Heatmap depicting degree of methylation (scaled log2 of IPD ratio averaged across reads) across all 93 clinical isolates (columns) at all common (present in ≥ 75 isolates) MamA promoter (≤50 bp upstream of a TSS) motif sites (rows). The coloring scale of the heatmap boxes max out at the median scaled IPD across all motif sites across all isolates with active MamA allele and bottom out at 0 (corresponding to no methylation). For each isolate, HsdM activity (bottom) and lineage (top) are indicated. Isolates within each heatmap are sorted first by activity, and then by lineage. MamA motifs in configuration with −10 promoter element akin to that of the promoters shown to exhibit MamA-methylation-dependent transcriptional response under hypoxia (Shell et al., 2013) (blue pop-out) and those within a region with a high density of hypervariable sites (red pop-out) are highlighted. Color of axis labels highlights the specific motif sites shown by Shell and colleagues to affect transcriptional response to hypoxia (Shell et al., 2013) (blue) and motif sites hypervariable across isolates with active MamA (red).
-
Figure 7—source data 1
Sequencing kinetics for all common MamA promoter motifs.
- https://cdn.elifesciences.org/articles/58542/elife-58542-fig7-data1-v1.csv
Figure 7—figure supplement 1
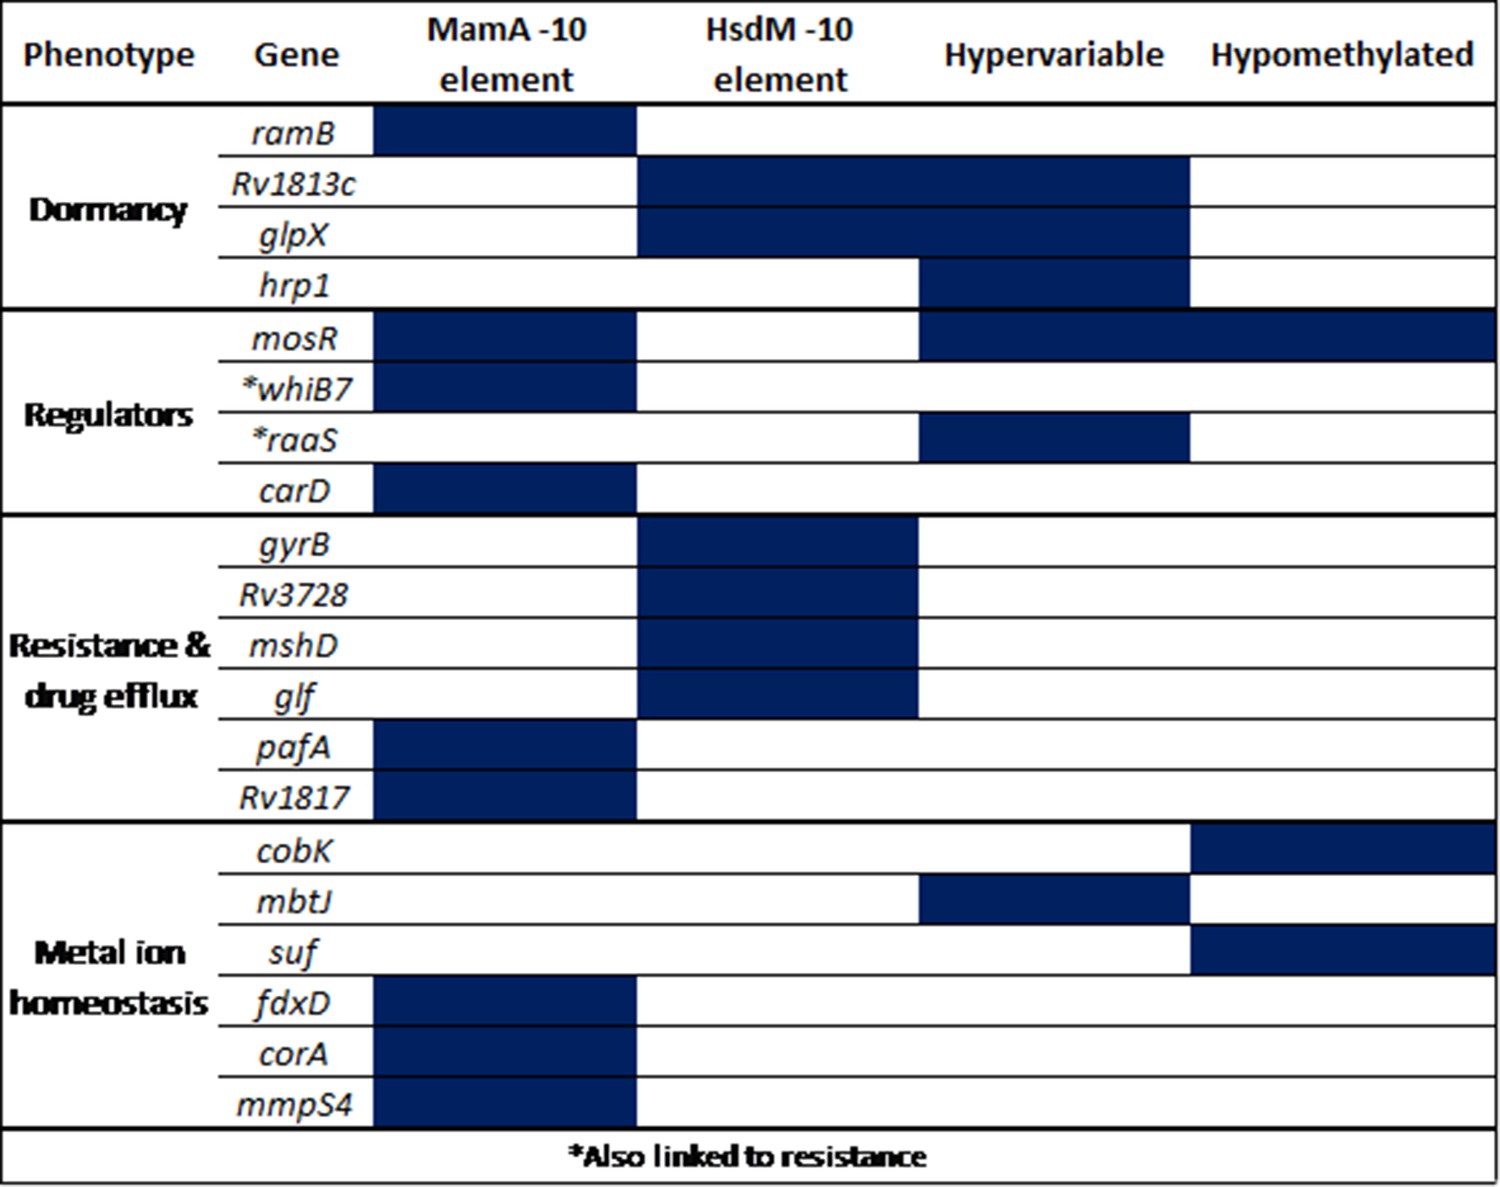
Selected promoters with −10 SFBS-overlapping, hypervariable, or consistently hypomethylated motif sites.
All are either transcriptional regulators or involved in clinically relevant processes. These genes mediate known intrinsic and acquired resistance and mechanisms, induction and maintenance of dormancy, and metal ion homeostasis. ‘MamA −10 element’ refers to the configuration described by Shell and colleagues (Shell et al., 2013) while ‘HsdM −10 element’ refers to the analogous configuration, where targeted adenines within HsdM motifs coincide with the distal end of the −10 promoter element.
Figure 8
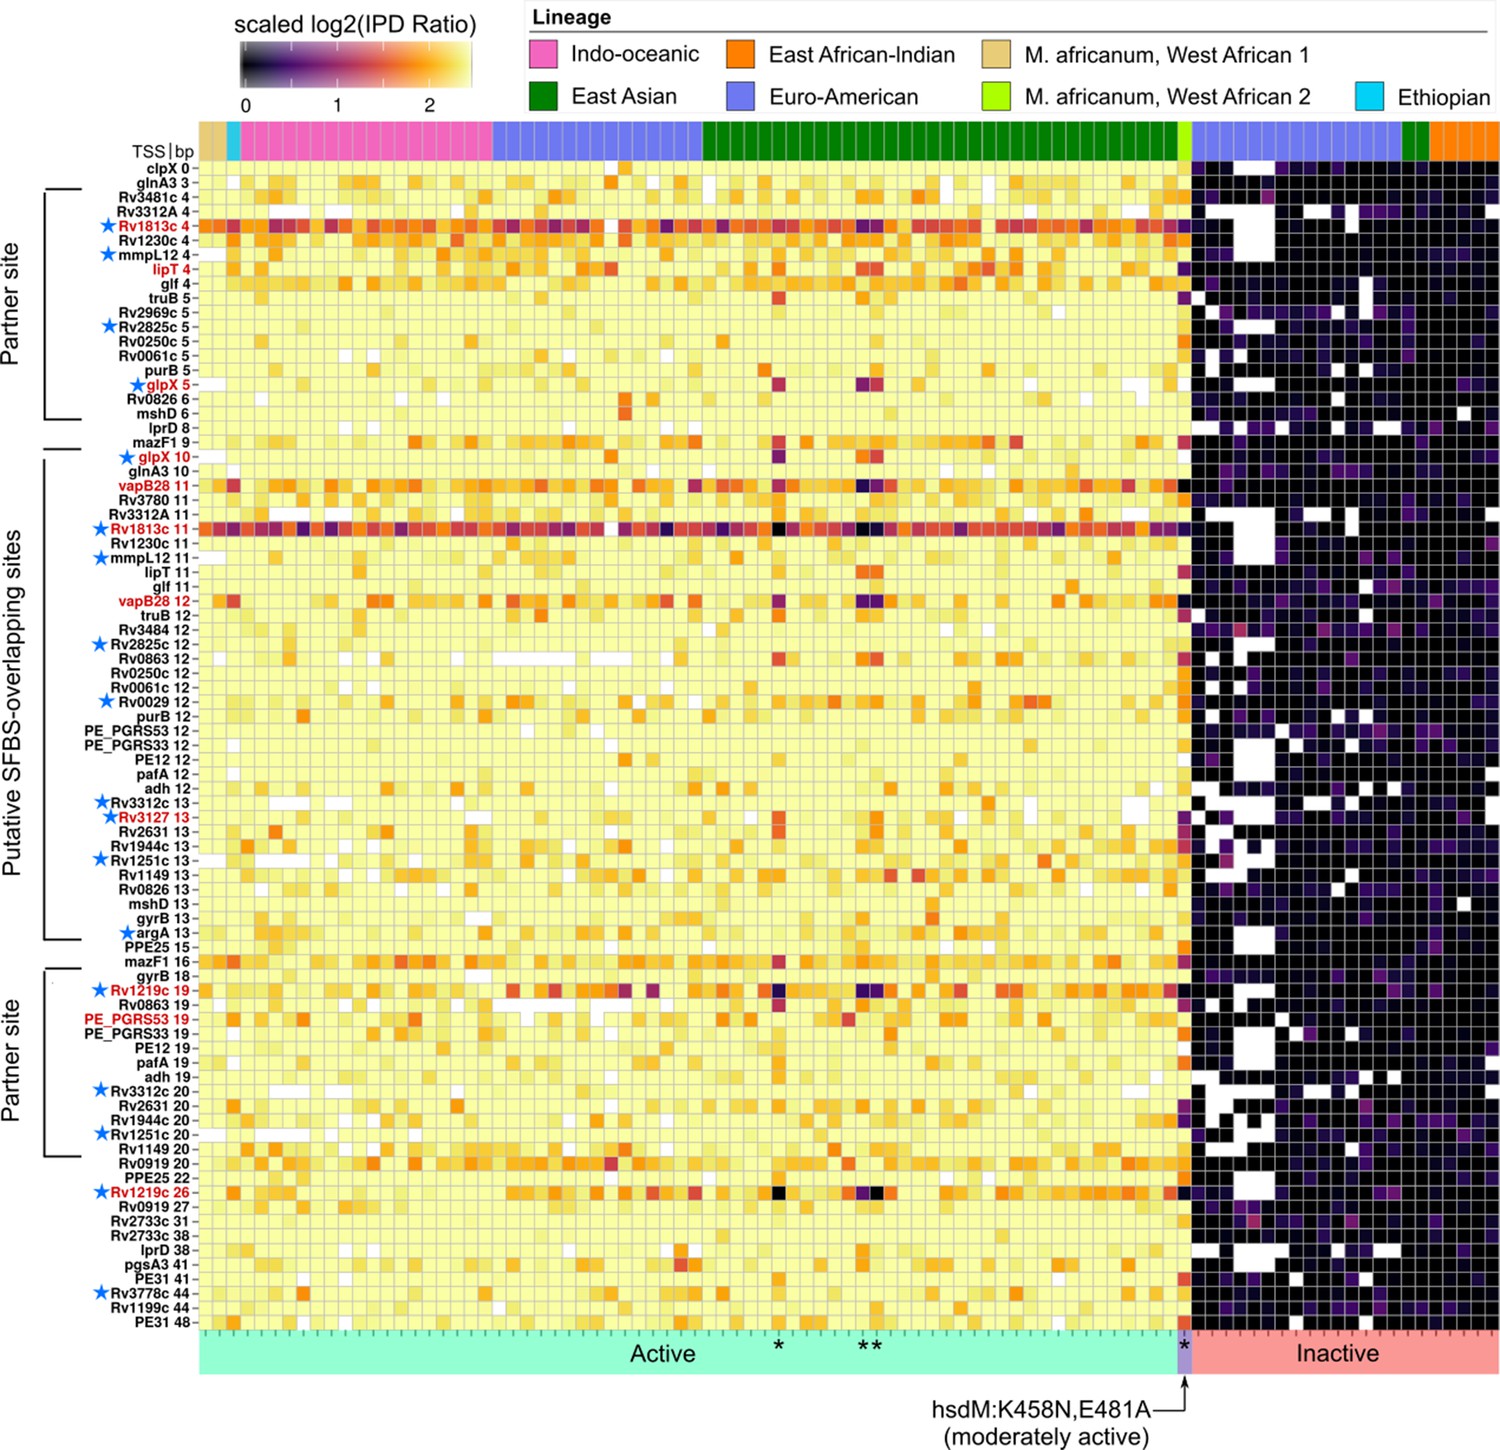
Methylomic variation at promoters harboring orphan MTase motifs: HsdM motifs.
Similar to Figure 7 but for HsdM motif sites. Heatmap depicting degree of methylation (scaled log2 of IPD ratio averaged across reads) across all 93 clinical isolates (columns) at all common (present in ≥ 75 isolates) HsdM promoter (≤50 bp upstream of a TSS) motif sites (rows). The coloring scale of the heatmap boxes max out at the median scaled IPD across all motif sites across all isolates with an active HsdM allele and bottom out at 0 (corresponding to no methylation). For each isolate, HsdM activity (bottom) and lineage (top) are indicated. Isolates are sorted first by activity, and then by lineage. ‘Putative SFBS-overlapping sites’ are those with an analogous configuration with the −10 promoter element shown the MamA motif overlap highlighted in Figure 7, but overlapping the end of the −10 promoter element distal to the TSS, rather than the proximal end. ‘Partner sites’ are loci at the position that includes the palindromic partners of putative SFBS-overlapping sites. Promoter MTase motif sites with hypervariable kinetics across HsdM-active isolates (red text) or upstream of genes differentially expressed in HsdM knockout (blue stars) are indicated. Isolates with convergent methylation levels at a subset of notable loci despite having divergent HsdM genotypes and belonging to different lineages are indicated by asterisks (*).
-
Figure 8—source data 1
Sequencing kinetics for all common HsdM promoter motifs.
- https://cdn.elifesciences.org/articles/58542/elife-58542-fig8-data1-v1.csv
Figure 9
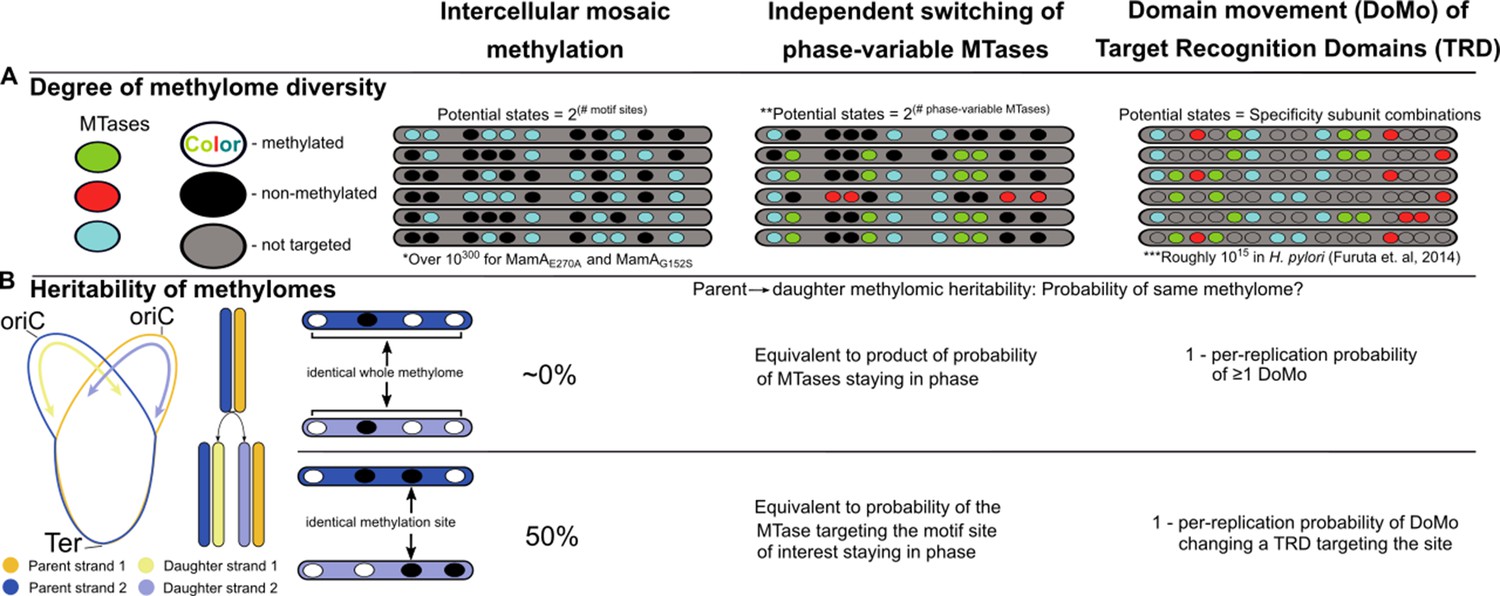
Intercellular mosaic methylation (IMM) is distinct from other forms of mosaic-like DNA methylation.
Conceptual illustration contrasting DNA methylome diversification and epigenetic inheritance between IMM and other mosaic-like mechanisms of heterogeneous DNA adenine methylation. (A) Cartoon illustrating the nature of methylomic diversity depicts individual cells’ chromosomes (gray bars) with methylation motifs (ovals). Oval colors represent distinct DNA methyltransferases (MTases). *Practically infinite, estimated as 21,978 (there are roughly 1,978 MamA motif sites per replisome) under the assumption that methylation propensity on the daughter strand is independent from methylation status of other motif sites on the daughter strand and parent strand. **Assumes there are two phases. Some phase-variable MTases with more than two phases have been described. In these cases, potential states would be equivalent to the product of the sequence of numbers of phases for all independent phase-variable MTases. ***Calculated by Furuta and Kobayashi as the product of 1,000 DNA sequence specificities per MTase across 5 MTases in Helicobacter pylori (Furuta and Kobayashi, 2012). (B) Diagram illustrating the relationship between daughter and parent strains as it relates to conservation of the whole methylome (top) and at a single methylation site (bottom). Under the assumption of genuine stochasticity, IMM would practically never re-pattern the daughter strand identically to its parent. In contrast, the methylation status at any given methylation site would match between parent and daughter cells in 50% of cases.
Tables
Table 1
Consistently Hypomethylated MTase Motif Sites Across Clinical M.tuberculosis isolates.
The top 20 most significant hypomethylated loci from each MTase. For each methyltransferase (‘MTase’) motif target locus (‘Gene’, ‘Sense’, and ‘Position’), we counted the number of isolates in which the isolate was hypomethylated and the total number of isolates that possessed the locus (‘Hypomethylated’). This fraction was used to perform a cumulative binomial probability test (‘p-value’). Loci with p-values below 4.72E-07 were considered significant at 0.01 significance level, after Bonferroni correction for multiple hypothesis testing. Loci were assigned by our methylome annotation pipeline using H37Rv reference annotations transferred from Rapid Annotation Transfer Tool (RATT) (Otto et al., 2011). For each palindromic pair, the locus with the most significant hypomethylated fraction is reported. In case of a tie, the locus on the same strand as the gene is reported. The fraction of active isolates hypomethylated at the partner site is included (‘Palindrome’). The surrounding 20 bases of each loci were scanned for transcription factor binding site motifs previously characterized in M. tuberculosis (Minch et al., 2015). The most significant motif match was included (‘Top TF’). Only transcription factor binding motifs with an E-value below 0.01 were scanned for, and only matches with a p-value (converted log-likelihood ratio score) below 0.0001 were reported. MTase motif loci less than 100 bp from another locus targeted by the same MTase were labeled (‘Yes’ in column ‘Nearby Motif’). Genes that were previously reported (Zhu et al., 2016) to contain frequently hypomethylated sites are marked with an asterisk.
| Gene | Sense | Position | Hypomethylated | p-value | Palin-drome | Top TF | Annotated Function | Nearby Motif |
|---|---|---|---|---|---|---|---|---|
| HsdM | ||||||||
| rocA* | sense | 834 | 67/70 | 2.49E-99 | 67/70 | Rv3488 | Probable pyrroline-5-carboxylate dehydrogenase | |
| cobK* | sense | 304 | 50/68 | 6.15E-62 | 50/68 | Rv2788 | Precorrin-6X reductase | Yes |
| Rv1461* | antisense | 559 | 47/70 | 3.17E-55 | 37/70 | Rv1956 | Iron-sulfur cluster assembly protein | |
| Rv2963* | sense | 683 | 46/70 | 2.10E-53 | 46/70 | Rv2788 | putative ion transporter | |
| PPE24* | antisense | 2275 | 33/33 | 1.31E-51 | 32/33 | Rv3133c | PPE family protein PPE24 | |
| metA* | antisense | 391 | 42/70 | 2.20E-46 | 40/70 | Rv2324 | homoserine O-acetyltransferase | |
| pks6* | sense | 423 | 26/34 | 1.18E-33 | 9/34 | Rv1719 | Probable membrane bound polyketide synthase | |
| PPE24* | antisense | 1807 | 17/17 | 6.14E-27 | 16/17 | Rv3133c | PPE family protein PPE24 | |
| pks6* | sense | 424 | 21/32 | 3.97E-25 | 14/32 | Rv1719 | Probable membrane bound polyketide synthase | |
| pyrC | sense | 744 | 20/70 | 5.90E-15 | 19/70 | Rv1049 | Probable dihydroorotase PyrC | |
| Rv3179 | upstream | 36 | 9/9 | 1.33E-14 | 9/9 | Rv1816 | Conserved protein | Yes |
| Rv3179 | upstream | 49 | 9/9 | 1.33E-14 | 9/9 | Rv1816 | Conserved protein | Yes |
| gcA* | antisense | 467 | 19/69 | 5.89E-14 | 14/69 | Rv1473A | Possible GDP-mannose 4,6-dehydratase | |
| Rv2279 | antisense | 693 | 10/21 | 1.01E-10 | 9/21 | Rv1776c | Probable transposase | |
| lpqG | upstream | 93 | 14/54 | 2.85E-10 | 8/54 | Rv1219c | Probable conserved lipoprotein LpqG | |
| Rv2038c | sense | 183 | 14/69 | 9.05E-09 | 9/69 | Rv2989 | Probable sugar-transport ATP-binding protein ABC transporter | |
| PPE24* | sense | 1584 | 5/5 | 1.95E-08 | 5/5 | Rv0818 | PPE family protein PPE24 | |
| MamA | ||||||||
| mmpL4* | sense | 1719 | 51/51 | 2.18E-126 | 49/51 | Rv0678 | transmembrane transport protein | |
| Rv1049 | upstream | 7 | 39/51 | 1.23E-85 | 9/51 | Oxidation-sensing regulator MosR | ||
| Rv1461* | antisense | 472 | 38/50 | 2.73E-83 | 35/50 | Iron-sulfur cluster assembly protein Suf | Yes | |
| treZ* | antisense | 1272 | 31/35 | 2.14E-72 | 26/35 | Maltooligosyltrehalose trehalohydrolase | ||
| accE5 | downstream | 447 | 20/33 | 2.89E-41 | 3/33 | acetyl-/propionyl-coenzyme A carboxylase | ||
| PPE34* | sense | 1664 | 13/20 | 7.05E-28 | 7/20 | PPE family protein PPE34 | ||
| mptA* | sense | 23 | 14/31 | 8.02E-27 | 3/31 | Alpha(1 ->6) mannosyltransferase | ||
| accA1* | sense | 598 | 13/25 | 4.65E-26 | 6/25 | Rv0339c | Probable acetyl-/propionyl-coenzyme A carboxylase alpha chain | Yes |
| Rv3282* | antisense | 325 | 12/18 | 4.93E-26 | 0/18 | putative nucleoside-triphosphate diphosphatase | ||
| fadE7* | sense | 1069 | 13/43 | 3.09E-22 | 8/43 | Rv3488 | Acyl-CoA dehydrogenase FadE7 | Yes |
| pks9* | sense | 2728 | 13/50 | 2.93E-21 | 3/50 | Rv0023 | polyketide synthase Pks9 | |
| bioB | sense | 796 | 11/49 | 2.04E-17 | 0/49 | Rv1049 | biotin synthetase | |
| treZ* | upstream | 880 | 8/13 | 2.46E-17 | 5/13 | Maltooligosyltrehalose trehalohydrolase | ||
| Rv1461* | antisense | 416 | 10/50 | 2.08E-15 | 2/50 | Iron-sulfur cluster assembly protein | Yes | |
| Rv1278 | sense | 1469 | 9/44 | 4.25E-14 | 1/44 | Putative transport protein | ||
| aldA | antisense | 642 | 8/48 | 6.49E-12 | 0/48 | Rv3830c | Probable NAD-dependent aldehyde dehydrogenase AldA | |
| Rv0370c | antisense | 389 | 8/50 | 9.17E-12 | 0/50 | Possible oxidoreductase | Yes | |
| frdA* | antisense | 787 | 8/51 | 1.08E-11 | 0/51 | Probable fumarate reductase FrdA | ||
| PPE34* | sense | 3454 | 4/4 | 1.39E-10 | 2/4 | PPE family protein PPE34 | ||
| Rv1251c | antisense | 1309 | 7/46 | 2.69E-10 | 1/46 | Putative ester hydrolase | ||
| MamB | ||||||||
| PE_PGRS54 | sense | 112 | 10/68 | 8.16E-24 | N/A | Rv0767c | PE-PGRS family protein PE_PGRS54 | |
| PE_PGRS57 | sense | 112 | 9/68 | 3.94E-21 | N/A | Rv0767c | PE-PGRS family protein PE_PGRS57 | |
-
Table 1—source data 1
Multisequence fasta file with context sequence of each consistently hypomethylated MTase Motif Locus.
- https://cdn.elifesciences.org/articles/58542/elife-58542-table1-data1-v1.txt
-
Table 1—source data 2
Output file from FIMO, run with the fasta file Table 1—source data 1, and the probability weight matrices of TFBS motifs characterized in H37Rv (Minch et al., 2015).
- https://cdn.elifesciences.org/articles/58542/elife-58542-table1-data2-v1.txt
Additional files
-
Supplementary file 1
Activity of observed methyltransferase genotypes.
For each distinct methyltransferase (MTase) variant found in our MTBC isolates, we measured the resulting sequencing kinetics signals of bases targeted by the MTase motif in that isolate, and from them inferred the activity of the variant MTase, reported here. Variants that were not present in our dataset could potentially be with respect to H37Rv instead of a wild-type MTase. *R47W and G154D were only found in H37Rv and H37Ra. **Inferred to be deleterious, since only found in conjunction with D59G and V616A, which result in wild-type methylation patterns in the absence of this insertion. ***Also inferred to be deleterious, since only found in conjunction with V616A. ****K458N only found in tandem with E481A. *****Consensus activity should be taken as tentative, since this genotype was not observed in our study, and some previously reported as loss-of-function were revealed to be partially active with our method of examining all motif instances. ‘unknown’ means that the effect of the specified mutation cannot be inferred because it does not occur in isolation. †For hsdM variant E481A, our study sequenced the same isolate as Chiner-Oms and colleagues, but our genotyping showed both E481A and K458N in hsdM, while they only reported E481A. Both studies showed a mild reduction in HsdM activity for this isolate, but it is unclear which mutation causes the reduction, or whether the effect is epistatic.
- https://cdn.elifesciences.org/articles/58542/elife-58542-supp1-v1.xlsx
-
Supplementary file 2
MTBC isolates by MTase genotype and activity.
Methylation activity for the three MTBC m6A DNA methyltransferases and the genotypes of the genes encoding the proteins that comprise them. Each row corresponds to an isolate.
- https://cdn.elifesciences.org/articles/58542/elife-58542-supp2-v1.xlsx
-
Supplementary file 3
Shared MTase motif loci Common MTase motif loci present in > 74 isolates.
MTase motif site loci were assigned by our methylome annotation pipeline, using characterized MTase target motifs, and nearby genes transferred from H37Rv references by Rapid Annotation Transfer Tool (RATT).
- https://cdn.elifesciences.org/articles/58542/elife-58542-supp3-v1.xlsx
-
Supplementary file 4
Methylation anomalies Microsoft Excel file containing hypervariable and differentially variable motif sites present in > 74 isolates.
Sheet one contains all hypervariable motif sites, defined as any site more than 3 SDs above the mean SD size across isolates, calculated using the distribution of log2 (IPD Ratios) at mamB motif sites. It specifies the coordinates with respect to proximal TSSs and CDS, as well as the standard deviation and median across motif sites of the specified genotype. Sheets 2 and 3 hold the CDSs and TSSs implicated in these analyses and the particular set (s) of variable motif sites they belong to.
- https://cdn.elifesciences.org/articles/58542/elife-58542-supp4-v1.xlsx
-
Supplementary file 5
Hypomethylation analysis Consistently hypomethylated MTase motif site loci across 93 clinical isolates.
MTase motif site loci were assigned by our methylome annotation pipeline, using proximal H37Rv gene references transferred by Rapid Annotation Transfer Tool (RATT). Consistently hypomethylated loci were classified as unmodified by our Bayesian analysis in a significant number of isolates in which the relevant MTase was mostly active. Significance was calculated using cumulative binomial test, setting the number of MTase-active isolates where a locus was present as the number of trials, and the number of said isolates where the locus was hypomethylated as the number of successes. At a 0.01 significance level, the threshold p-value for significance was 4.72E-07, after a Bonferroni correction for the number of loci tested. Sheet one contains hypomethylated MamA motif site loci. Sheet two contains the hypomethylated MamB loci, and sheet three contains hypomethylated HsdM loci.
- https://cdn.elifesciences.org/articles/58542/elife-58542-supp5-v1.xlsx
-
Supplementary file 6
Promoter methylation patterns Frequencies of MTase motif sites relative locations upstream of TSSs in putative promoters and motif sites present across most isolates.
Sheets 1 and 3 are organized locus-wise, with frequencies of common loci and their overlap with Sigma-factor consensus motifs are each locus for –10 and –35 consensus sigma factor binding sites. Sheets 2 and 4 use the same underlying data as 1 and 3 but report the frequencies of relative distances upstream of TSS that MTase motifs and SFBSs overlap. Sheet five is similar to sheets 1 and 3, but instead reports all MTase motif sites within 100 bp of TSSs, rather than only the subset that overlap SFBSs. Sheet six lists all loci found across 30 or more isolates that fall within 50 base pairs upstream of a TSS, and for each Sigma Factor lists whether it overlaps with the –10 or –35 motifs, and whether it overlaps with a sigma factor in an arrangement indicative of a true promoter. Sheet seven is similar to six but each row represents a promoter containing at least one MTase motif.
- https://cdn.elifesciences.org/articles/58542/elife-58542-supp6-v1.xlsx
-
Supplementary file 7
HsdM knockout RNAseq re-analysis.
- https://cdn.elifesciences.org/articles/58542/elife-58542-supp7-v1.xlsx
-
Supplementary file 8
Fasta file containing the nucleotide sequence for insertion sequence IS6110.
- https://cdn.elifesciences.org/articles/58542/elife-58542-supp8-v1.txt
-
Transparent reporting form
- https://cdn.elifesciences.org/articles/58542/elife-58542-transrepform-v1.docx
Download links
A two-part list of links to download the article, or parts of the article, in various formats.
Downloads (link to download the article as PDF)
Open citations (links to open the citations from this article in various online reference manager services)
Cite this article (links to download the citations from this article in formats compatible with various reference manager tools)
Drivers and sites of diversity in the DNA adenine methylomes of 93 Mycobacterium tuberculosis complex clinical isolates
eLife 9:e58542.
https://doi.org/10.7554/eLife.58542


