Investigating pleiotropic effects of statins on ischemic heart disease in the UK Biobank using Mendelian randomisation
- School of Public Health, Li Ka Shing Faculty of Medicine, The University of Hong Kong, China
- City University of New York, Graduate School of Public Health and Health Policy, United States
Figures
Figure 1

Directed acyclic graph showing the well-established protective effects of lipid modifiers and anti-inflammatories on IHD (solid lines) and possible additional pathways (dashed lines) investigated here.
Green indicates a lowering effect, red indicates an increasing effect.
Figure 2
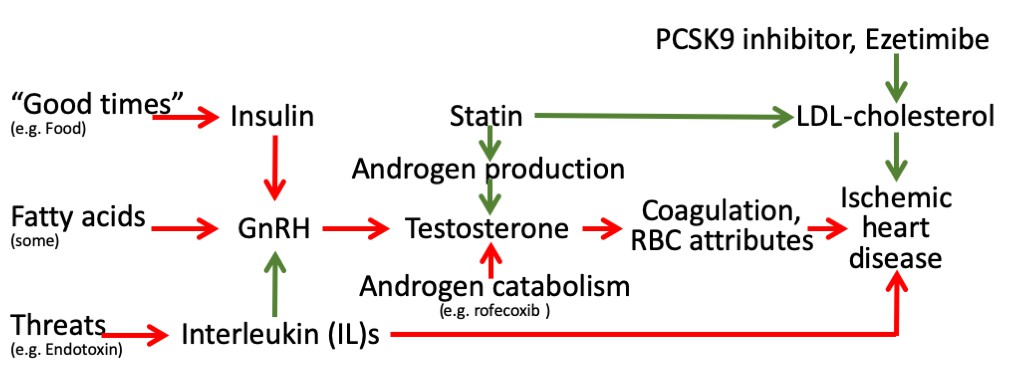
Schematic diagram showing the well-established protective effects of lipid modifiers on IHD (solid green lines) in the context of additional relevant pathways (green protective, red harmful) from an evolutionary biology perspective.
(Key: GnRH: gonadotropin releasing hormone, RBC: red blood cell, LDL: low density lipoprotein).
Tables
Table 1
Sex-specific Mendelian randomization estimates (where possible) for effects of genetically mimicked statins, PCSK9 inhibitor and ezetimibe (in effect sizes of LDL-cholesterol) on testosterone (effect size) in men and women using the UK Biobank .
| Mendelian Randomization estimates | |||||||
|---|---|---|---|---|---|---|---|
| Therapy | # SNPs | Method | Beta | 95% CI | P value | MR-Egger intercept p-value | |
| Men | Statin | 1 | Inverse variance weighted | −0.15 | −0.23 to −0.06 | 0.001 | |
| Statin | 6 | Inverse variance weighted | −0.15 | −0.23 to −0.07 | 0.0005 | ||
| PCSK9 inhibitor | 3 | Inverse variance weighted | 0.04 | −0.11 to 0.18 | 0.63 | ||
| PCSK9 inhibitor | 3 | Weighted median | 0.07 | −0.13 to 0.27 | 0.29 | ||
| PCSK9 inhibitor | 3 | MR-Egger | 0.34 | 0.09 to 0.60 | 0.01 | −0.01 (0.01) | |
| PCSK9 inhibitor | 7 | Inverse variance weighted | 0.05 | −0.05 to 0.15 | 0.29 | ||
| ezetimibe | 1 | Inverse variance weighted | 0.04 | −0.15 to 0.23 | 0.68 | ||
| ezetimibe | 3 | Inverse variance weighted | 0.05 | −0.12 to 0.22 | 0.55 | ||
| ezetimibe | 3 | Weighted median | 0.03 | −0.13 to 0.18 | 0.72 | ||
| ezetimibe | 3 | MR-Egger | 0.24 | −0.52 to 1.0 | 0.54 | −0.01 (0.52) | |
| Women | Statin | 1 | Inverse variance weighted | 0.04 | −0.06 to 0.14 | 0.45 | |
| Statin | 6 | Inverse variance weighted | 0.03 | −0.07 to 0.13 | 0.52 | ||
| PCSK9 inhibitor | 3 | Inverse variance weighted | 0.01 | −0.11 to 0.14 | 0.85 | ||
| PCSK9 inhibitor | 3 | Weighted median | 0.01 | −0.13 to 0.15 | 0.91 | ||
| PCSK9 inhibitor | 3 | MR-Egger | 0.09 | −0.38 to 0.56 | 0.71 | −0.003 (0.74) | |
| PCSK9 inhibitor | 7 | Inverse variance weighted | −0.004 | −0.14 to 0.13 | 0.95 | ||
| ezetimibe | 1 | Inverse variance weighted | 0.18 | −0.05 to 0.40 | 0.12 | ||
| ezetimibe | 3 | Inverse variance weighted | 0.12 | −0.08 to 0.31 | 0.24 | ||
-
One statin SNP is rs12916, and six statin SNPs additionally included rs5909, rs10066707, rs17238484, rs2006760 and rs2303152 taking into account their correlations.
Three PCSK9 inhibitor SNPs are rs11206510, rs2149041 and rs7552841, and 7 PCSK9 inhibitor SNPs additionally included rs10888897, rs2479394, rs2479409 and, rs562556 taking into account all their correlations.
-
One ezetimibe SNP is rs2073547 (proxied by rs10260606), and three ezetimibe SNPs additionally included rs7791240 and rs217386 taking into account all their correlations.
The unit of LDL-cholesterol is approximately 0.83 mm/L. An effect size of testosterone is approximately, 0.23 nmol/L in women (Haring et al., 2012) and 3.1 nmol/L in men (Mohr et al., 2005).
Table 2
Mendelian randomization estimates for effects of genetically mimicked statins (effect sizes of LDL-cholesterol) and of genetically predicted testosterone (effect size) on IHD in men and women using the UK Biobank.
| Mendelian randomization estimates | |||||||
|---|---|---|---|---|---|---|---|
| Exposure | # SNPs | Method | OR | 95% CI | P value | MR-Egger intercept p-value | |
| Men | Statin mimic | 1 | Inverse variance weighted | 0.55 | 0.38 to 0.79 | 0.001 | |
| Statin mimic | 6 | Inverse variance weighted | 0.54 | 0.33 to 0.89 | 0.02 | ||
| Testosterone | 125 | Inverse variance weighted | 1.11 | 1.04 to 1.19 | 0.003 | ||
| Testosterone | 125 | Weighted median | 1.18 | 1.06 to 1.31 | 0.002 | ||
| Testosterone | 125 | MR-Egger | 1.10 | 0.98 to 1.23 | 0.09 | 0.01 (0.84) | |
| Women | Statin mimic | 1 | Inverse variance weighted | 0.87 | 0.59 to 1.27 | 0.46 | |
| Statin mimic | 6 | Inverse variance weighted | 0.79 | 0.54 to 1.13 | 0.20 | ||
| Testosterone | 254 | Inverse variance weighted | 0.96 | 0.89 to 1.03 | 0.29 | ||
| Testosterone | 254 | Weighted median | 1.03 | 0.92 to 1.14 | 0.63 | ||
| Testosterone | 254 | MR-Egger | 1.08 | 0.94 to 1.23 | 0.27 | −0.004 (0.05) | |
-
One statin SNP is rs12916, and six statin SNPs additionally included rs5909, rs10066707, rs17238484, rs2006760 and rs2303152 taking into account all their correlations. The unit of LDL-cholesterol is approximately 0.83 mm/L. An effect size of testosterone is approximately, 0.23 nmol/L in women (Haring et al., 2012) and 3.1 nmol/L in men (Mohr et al., 2005).
-
Table 2—source data 1
Genetic associations for men.
- https://cdn.elifesciences.org/articles/58567/elife-58567-table2-data1-v2.csv
-
Table 2—source data 2
genetic associations for women.
- https://cdn.elifesciences.org/articles/58567/elife-58567-table2-data2-v2.csv
Table 3
Multivariable Mendelian randomization estimates for effects of genetically mimicked statins (effect sizes of LDL-cholesterol) and of testosterone (effect size) together on IHD in men and women using the UK Biobank.
| Mendelian randomization estimates | ||||||||
|---|---|---|---|---|---|---|---|---|
| Sex | Exposures | Instrumented by | Adjusted for | Method | OR | 95% CI | P value | MR-Egger intercept p-value |
| Men | Statin mimic | 1 Statin SNP on LDL-cholesterol | Testosterone | Inverse variance weighted | 1.05 | 0.74 to 1.47 | 0.79 | |
| Testosterone | 125 SNPs on testosterone | statin | Inverse variance weighted | 1.11 | 1.04 to 1.20 | 0.003 | ||
| Statin mimic | 1 Statin SNP on LDL-cholesterol | Testosterone | MR-Egger | 0.73 | 0.48 to 1.11 | 0.14 | ||
| Testosterone | 125 SNPs on testosterone | statin | MR-Egger | 1.09 | 1.02 to 1.17 | 0.02 | 0.005 | |
| Statin mimic | 6 Statin SNPs on LDL-cholesterol | Testosterone | Inverse variance weighted | 1.02 | 0.72 to 1.43 | 0.91 | ||
| Testosterone | 125 SNPs on testosterone | statin | Inverse variance weighted | 1.11 | 1.04 to 1.20 | 0.003 | ||
| Women | Statin mimic | 1 Statin SNP on LDL-cholesterol | Testosterone | Inverse variance weighted | 0.98 | 0.75 to 1.16 | 0.53 | |
| Testosterone | 254 SNPs on testosterone | statin | Inverse variance weighted | 0.96 | 0.90 to 1.04 | 0.33 | ||
| Statin mimic | 1 Statin SNP on LDL-cholesterol | Testosterone | MR-Egger | 0.72 | 0.55 to 0.94 | 0.02 | ||
| Testosterone | 254 SNPs on testosterone | statin | MR-Egger | 0.96 | 0.89 to 1.03 | 0.27 | 0.001 | |
| Statin mimic | 6 Statin SNPs on LDL-cholesterol | Testosterone | Inverse variance weighted | 0.92 | 0.74 to 1.16 | 0.49 | ||
| Testosterone | 254 SNPs on testosterone | statin | Inverse variance weighted | 0.97 | 0.90 to 1.04 | 0.36 | ||
-
One statin SNP is rs12916, and six statin SNPs additionally included rs5909, rs10066707, rs17238484, rs2006760 and rs2303152 taking into account all their correlations. The unit of LDL-cholesterol is approximately 0.83 mm/L. An effect size of testosterone is approximately, 0.23 nmol/L in women (Haring et al., 2012) and 3.1 nmol/L in men (Mohr et al., 2005).
Table 4
Mendelian randomization inverse variance weighted estimates for genetically mimicked effects of the anti-inflammatory anakinra raising IL-1Ra (effect size) (Swerdlow et al., 2012) on testosterone (effect size) and ischemic heart disease and for genetically mimicked effects of tocilizumab raising serum IL-6r (ng/ml) (Rafiq et al., 2007) on testosterone in men and women using the UK Biobank .
| Therapy | Target | Outcome | # SNPs | Measure | Estimate | 95% CI | p-value | |
|---|---|---|---|---|---|---|---|---|
| Men | Anakinra | IL-1Ra | testosterone | 2 | beta | 0.022 | 0.01 to 0.04 | 0.002 |
| IHD | 2 | OR | 1.08 | 1.01 to 1.15 | 0.017 | |||
| Tocilizumab | IL-6r | testosterone | 1 | beta | 0.003 | −0.06 to 0.13 | 0.96 | |
| Women | Anakinra | IL-1Ra | testosterone | 2 | beta | −0.01 | −0.04 to 0.01 | 0.24 |
| IHD | 2 | OR | 0.99 | 0.91 to 1.08 | 0.86 | |||
| Tocilizumab | IL-6r | testosterone | 1 | beta | 0.002 | −0.02 to 0.02 | 0.84 |
-
SNPs mimicking anakinra are rs6743376 and rs1542176.
The SNP mimicking tocilizumab is rs7529229.
-
An effect size of testosterone is approximately, 0.23 nmol/L in women (Haring et al., 2012) and 3.1 nmol/L in men (Mohr et al., 2005).
Additional files
-
Supplementary file 1
Associations of SNPs mimicking effects of lipid modifiers with LDL-cholesterol.
(a) SNP-specific estimates for SNPs mimicking effects of statins, PCSK9 inhibitor and ezetimibe on LDL-cholesterol (effect size) in women and men from the UK Biobank, and for comparison estimates for both sexes together from the Global Lipids Genetics Consortium (GLGC) (Willer et al., 2013). (b) SNP-specific estimates for anakinra and tocilizumab SNPs on IL1-Ra (Interleukin 1 Genetics Consortium, 2015) and IL-6 (Swerdlow et al., 2012) respectively.
- https://cdn.elifesciences.org/articles/58567/elife-58567-supp1-v2.docx
-
Transparent reporting form
- https://cdn.elifesciences.org/articles/58567/elife-58567-transrepform-v2.pdf
Download links
A two-part list of links to download the article, or parts of the article, in various formats.
Downloads (link to download the article as PDF)
Open citations (links to open the citations from this article in various online reference manager services)
Cite this article (links to download the citations from this article in formats compatible with various reference manager tools)
Investigating pleiotropic effects of statins on ischemic heart disease in the UK Biobank using Mendelian randomisation
eLife 9:e58567.
https://doi.org/10.7554/eLife.58567


