ALKBH7 mediates necrosis via rewiring of glyoxal metabolism
- Department of Anesthesiology & Perioperative Medicine, University of Rochester Medical Center, United States
- NHLBI Intramural Research Program, National Institutes of Health, United States
- Department of Biology, University of Rochester, United States
- Department of Chemistry, University of Rochester, United States
Figures
Figure 1 with 2 supplements

Proteomic analysis of prolyl-hydroxylation in WT vs.Alkbh7-/-.
Hearts from young male WT or Alkbh7-/- mice were analyzed by tandem mass tag LC-MS/MS as per the methods. Abundance of each P-OH peptide was normalized to the abundance of its parent protein. (A) Volcano plot showing relative levels of 451 P-OH containing peptides. X-axis shows Log10 of fold change (Alkbh7-/- / WT) and Y-axis shows Log10 of significance (paired t-test, N = 5). Proteins crossing thresholds (gray lines) in upper left or right quadrants are labeled. (B) Table showing the top 5 P-OH containing peptides exhibiting increased or decreased relative abundance in Alkbh7-/- vs. WT. Table shows raw abundance of each P-OH peptide, abundance of the parent protein, and normalized abundance of the P-OH peptide. Annotated sequences highlight the hydroxylated proline residues in red. (C) Western blot showing abundance of HADH-SC (Hadh) in WT or Alkbh7-/- heart mitochondria with quantitation below, normalized to protein loading determined by Ponceau S stained membrane. (D) Spectrophotometric activity assays of short-chain and long-chain HADH in WT or Alkbh7-/- heart mitochondria. Bar graphs in panels C/D show means ± SE, N = 3–5, with p-values (paired t-test) shown above error bars. In bar graphs, N for each group is shown in parentheses.
Figure 1—figure supplement 1
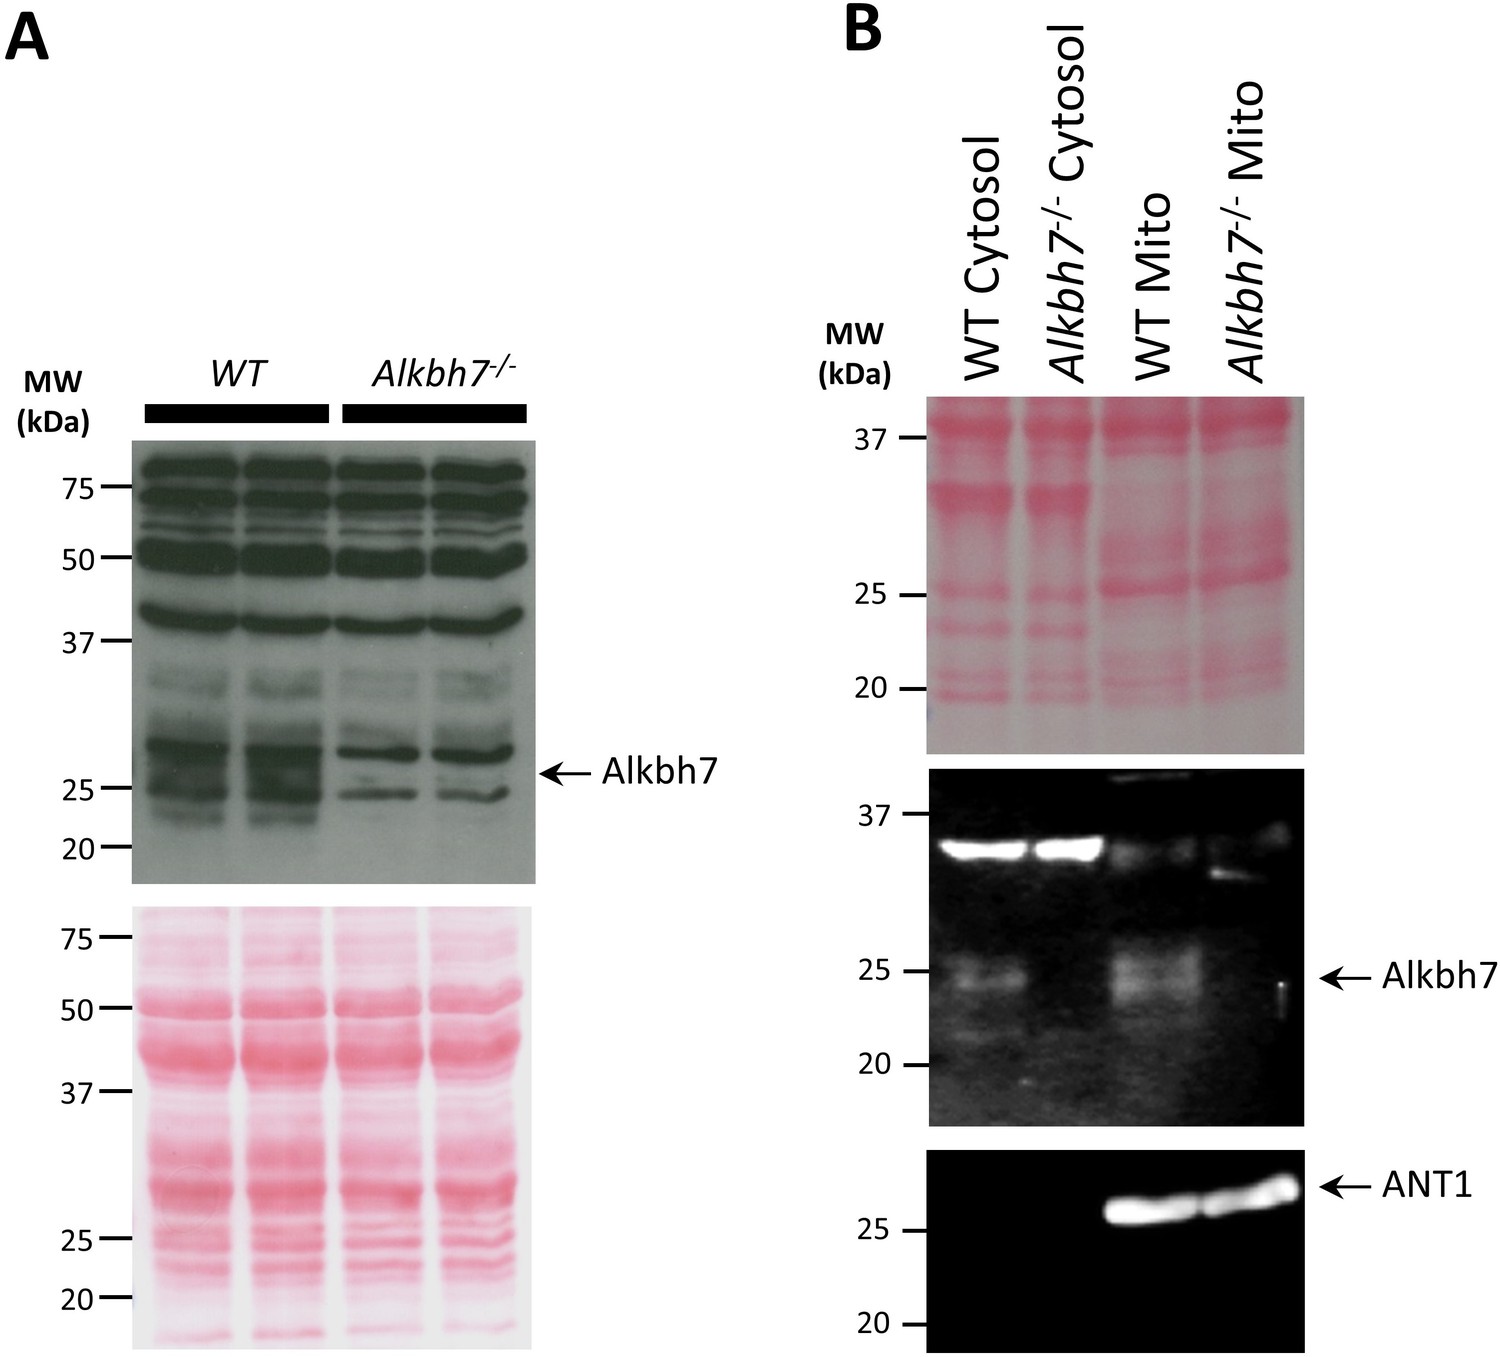
Western blot showing absence of ALKBH7 protein in Alkbh7-/-mouse heart.
Hearts were fractionated into mitochondrial and cytosolic fractions by western blot. (A) Blot showing ALKBH7 in WT mitochondria is lost in Alkbh7-/- mitochondria. Protein loading is shown in the Ponceau S stained membrane below. Each lane represents a single animal. (B) Blot showing mild ALKBH7 immunoreactivity in cytosolic fraction as well as mitochondria in WT, which is lost from both fractions in the knockout. Protein loading is shown in the Ponceau S stained membrane below. Also shown is a blot for adenine nucleotide translocase 1 (ANT1), indicating no contamination of the cytosolic fraction with mitochondria. N = 1 mouse per genotype. Blots are representative of at least three independent experiments.
Figure 1—figure supplement 2
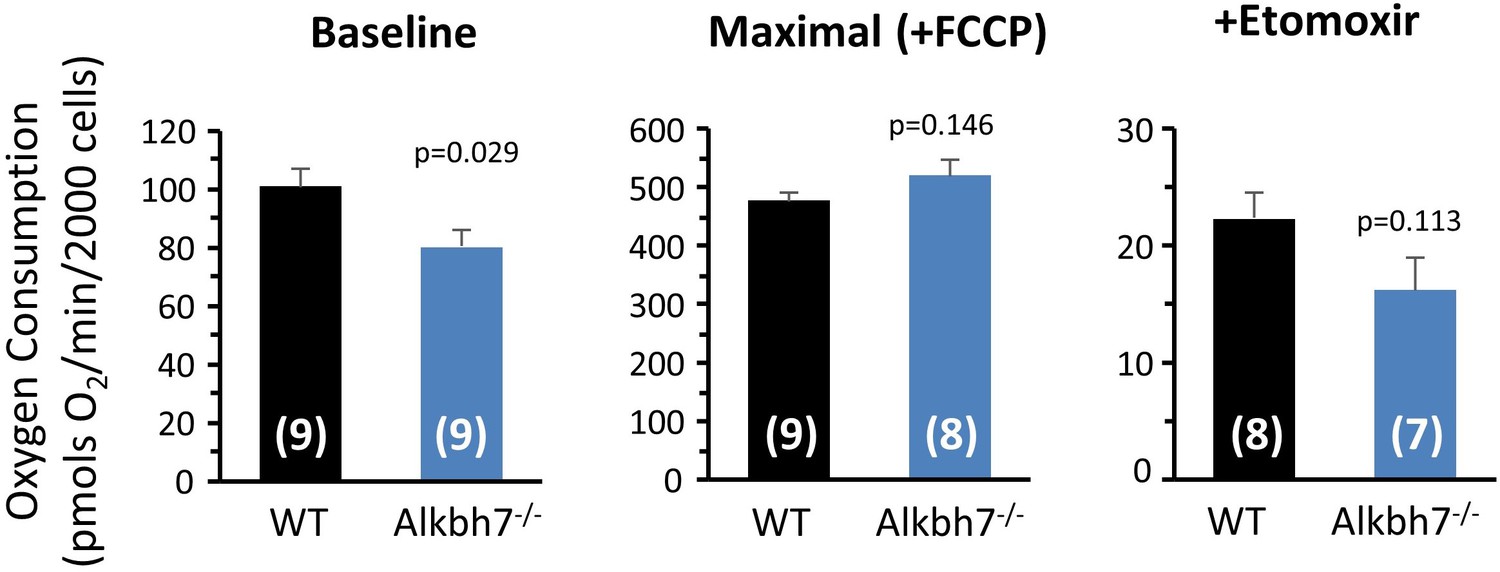
Seahorse XF measurement of long chain fatty acid oxidation in WT vs.Alkbh7-/-cardiomyocytes.
Cardiomyocytes were isolated and XF measurements made as described in the methods. Graphs show oxygen consumption rate in media containing BSA-conjugated oleate as metabolic substrate. Data are shown for baseline, maximal respiration (stimulated by uncoupler FCCP in the presence of oligomycin), and in the presence of the CPT-1 inhibitor etomoxir. Note different Y-axis scales between graphs. Data are means ± SEM, N = 7–9, p-values (unpaired t-test) shown above error bars. N for each experiment shown in parentheses.
Figure 2 with 2 supplements
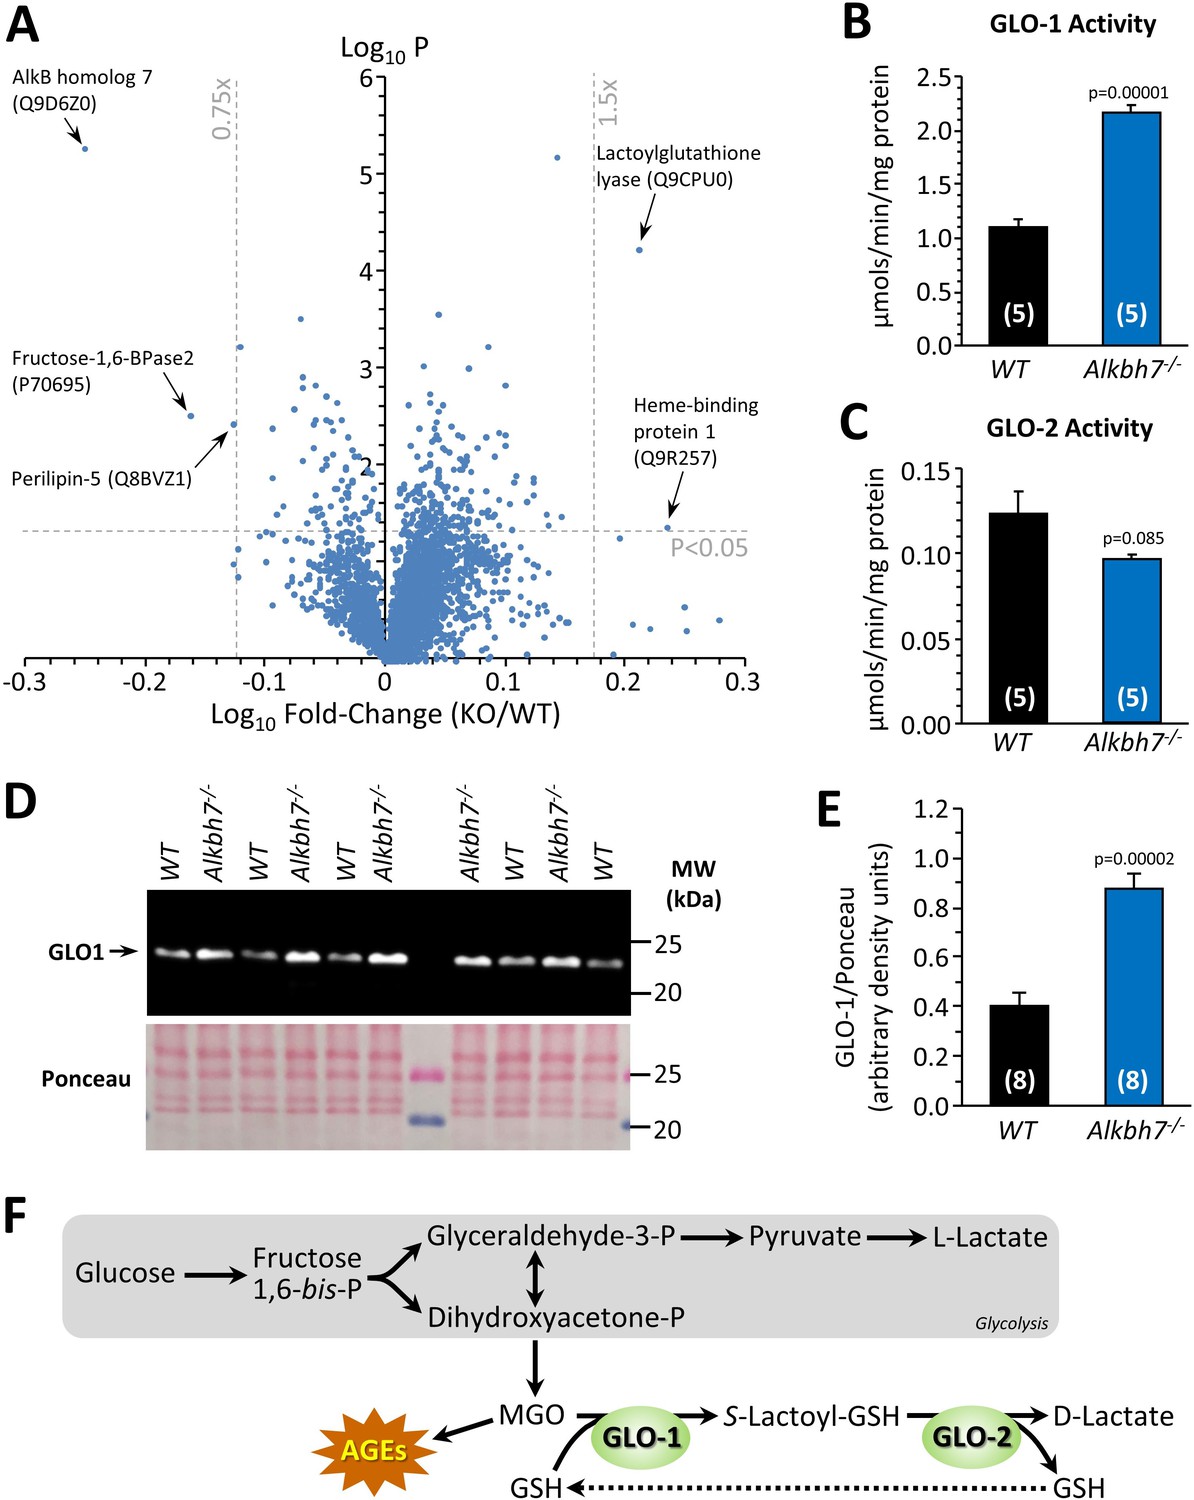
Proteomic analysis of protein abundance in WT vs.Alkbh7-/-.
Hearts from young male WT or Alkbh7-/- mice were analyzed by tandem mass tag LC-MS/MS as per the methods. (A) Volcano plot showing relative levels of 3737 proteins. X-axis shows Log10 of fold change (Alkbh7-/- / WT) and Y-axis shows Log10 of significance (paired t-test, N = 5). Proteins crossing thresholds (gray lines) in upper left or right quadrants are labeled. (B) Activity of GLO-1 in WT or Alkbh7-/- heart cytosol. (C) Activity of GLO-2 in WT or Alkbh7-/- heart cytosol. (D) Western blot showing abundance of GLO-1 in WT or Alkbh7-/- heart cytosol, with Ponceau stained membrane below. (E) Quantitation of GLO-1 blot, normalized to protein loading. Bar graphs in panels B/C/E show means ± SE, N = 4–5, with p-values (paired t-test) shown above error bars. (F) Schematic showing the methylglyoxal detoxification system and its relationship to glycolysis. Abbreviations: AGEs: Advanced glycation end products, GSH: glutathione. MGO: methylglyoxal. In bar graphs, N for each group is shown in parentheses.
Figure 2—figure supplement 1
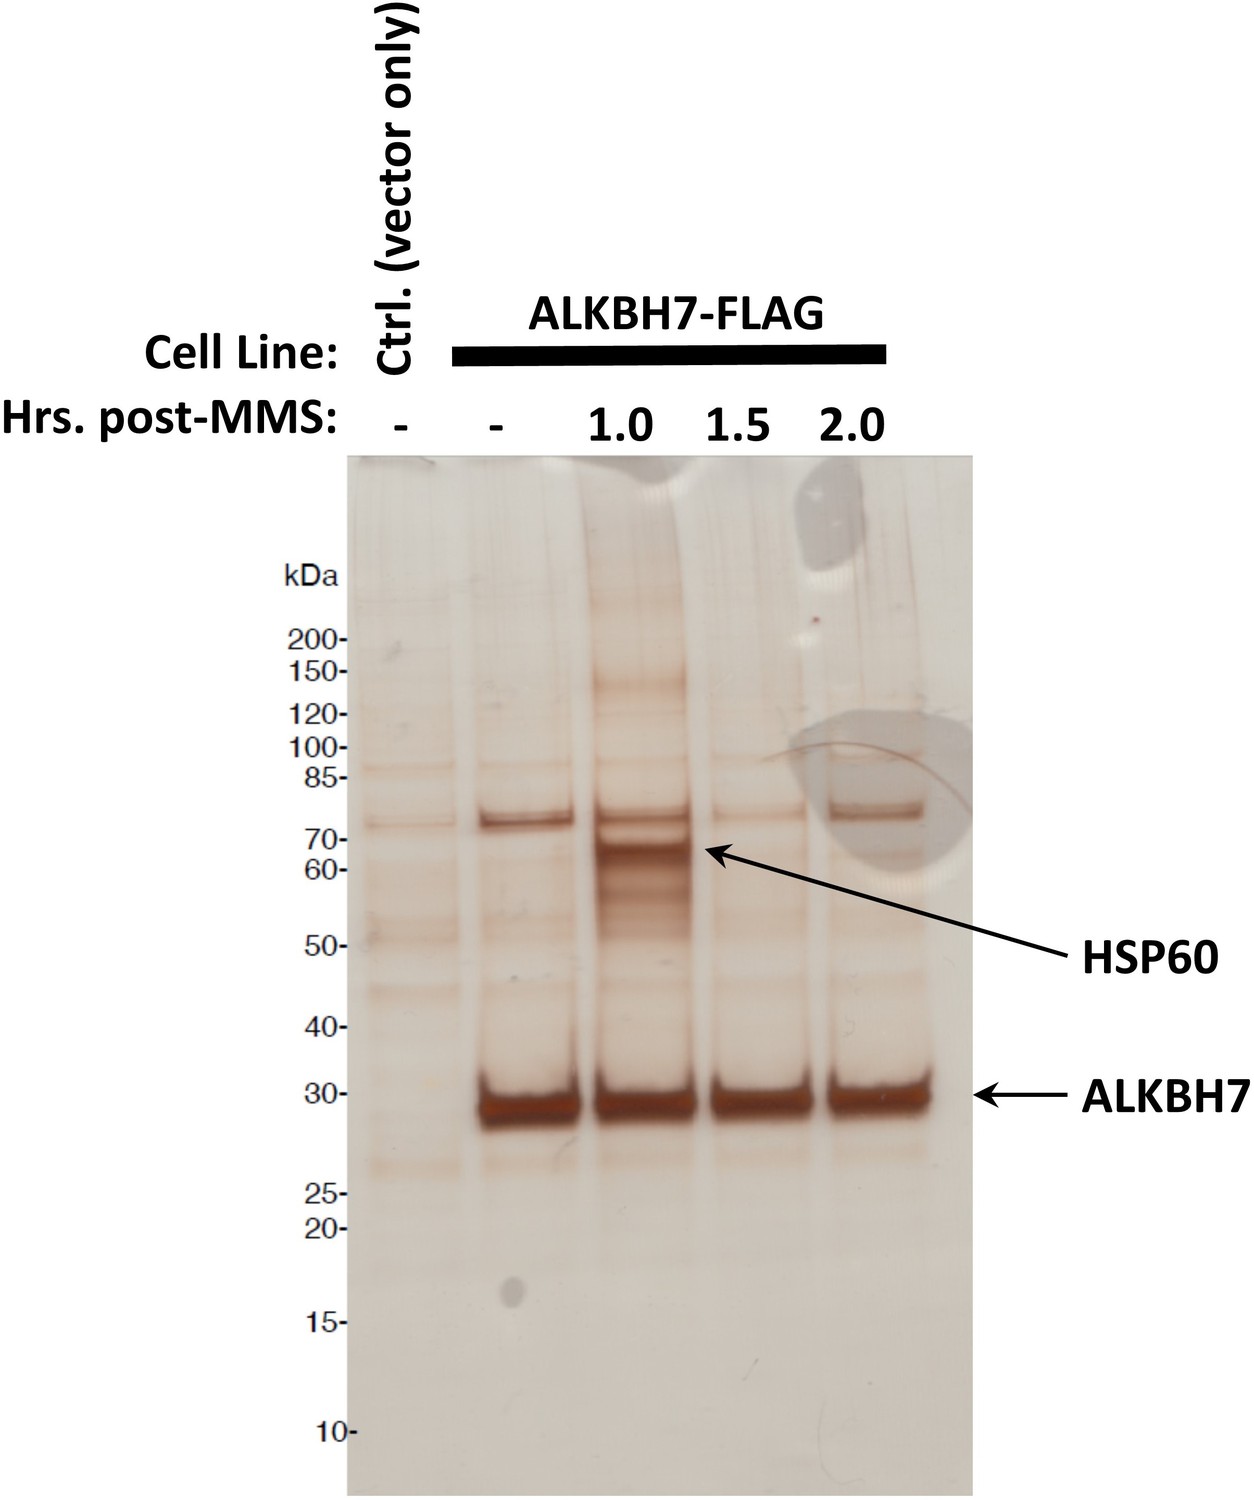
Representative gel from FLAG-tagged ALKBH7 pull-down experiment.
Lane one shows control (empty vector) cells. Remaining four lanes are ALKBH7-FLAG cells treated with MMS for indicated times. Proteins were cut from lane 3 (1 hr. post-MMS) for identification (see Supplementary file 1 Table S1).
Figure 2—figure supplement 2
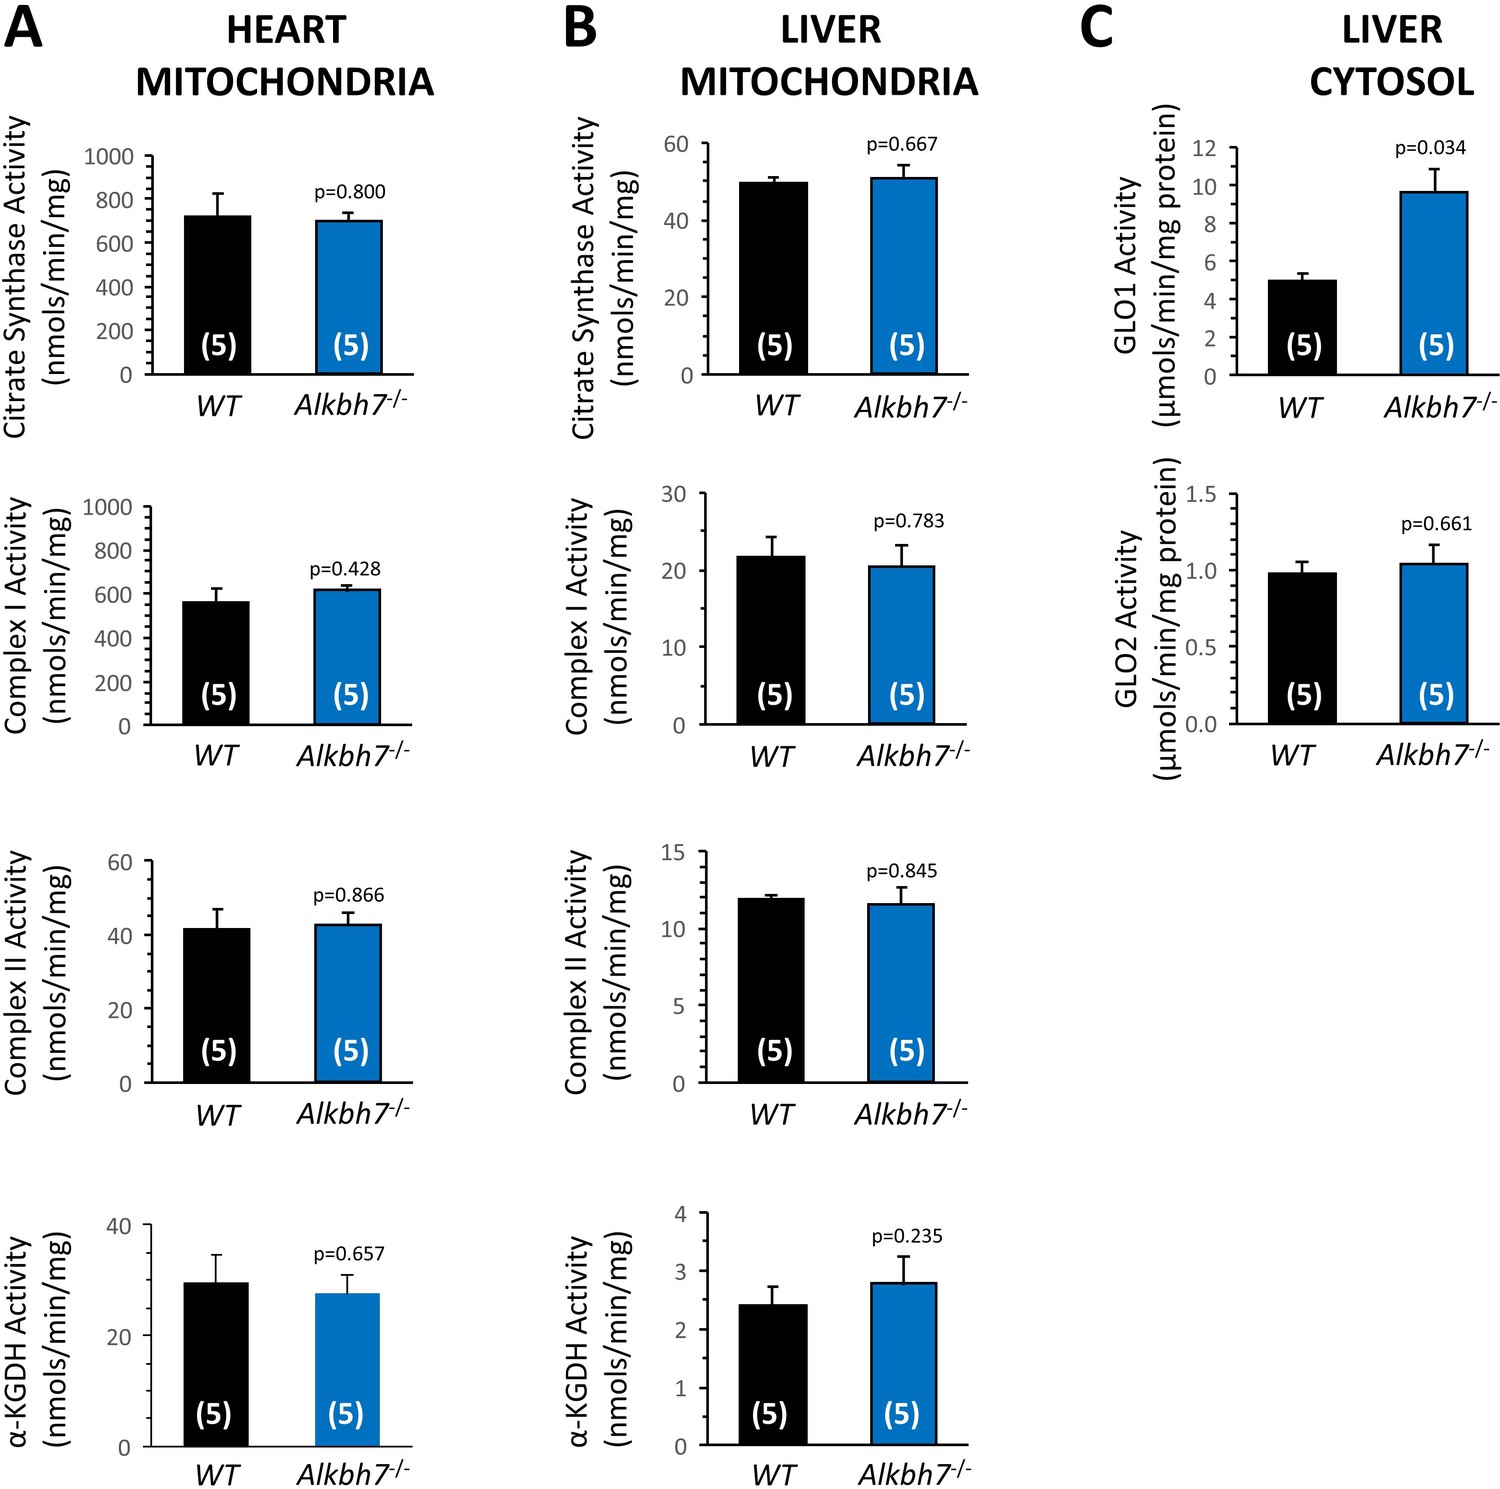
Enzyme activities in WT and Alkbh7-/-tissues.
Activities of (top to bottom) citrate synthase, respiratory complex I, respiratory complex II, and α-ketoglutarate dehydrogenase, were measured spectrophotometrically as per the methods, in (A) Heart mitochondria, (B) Liver mitochondria. Panel (C) shows GLO-1 and GLO-2 activity in liver cytosol, complementing the heart data in Figure 2B/C. All data are means ± SEM, N = 4–5, p values (paired t-tests) are shown above the error bars. N for each experiment shown in parentheses.
Figure 3 with 1 supplement
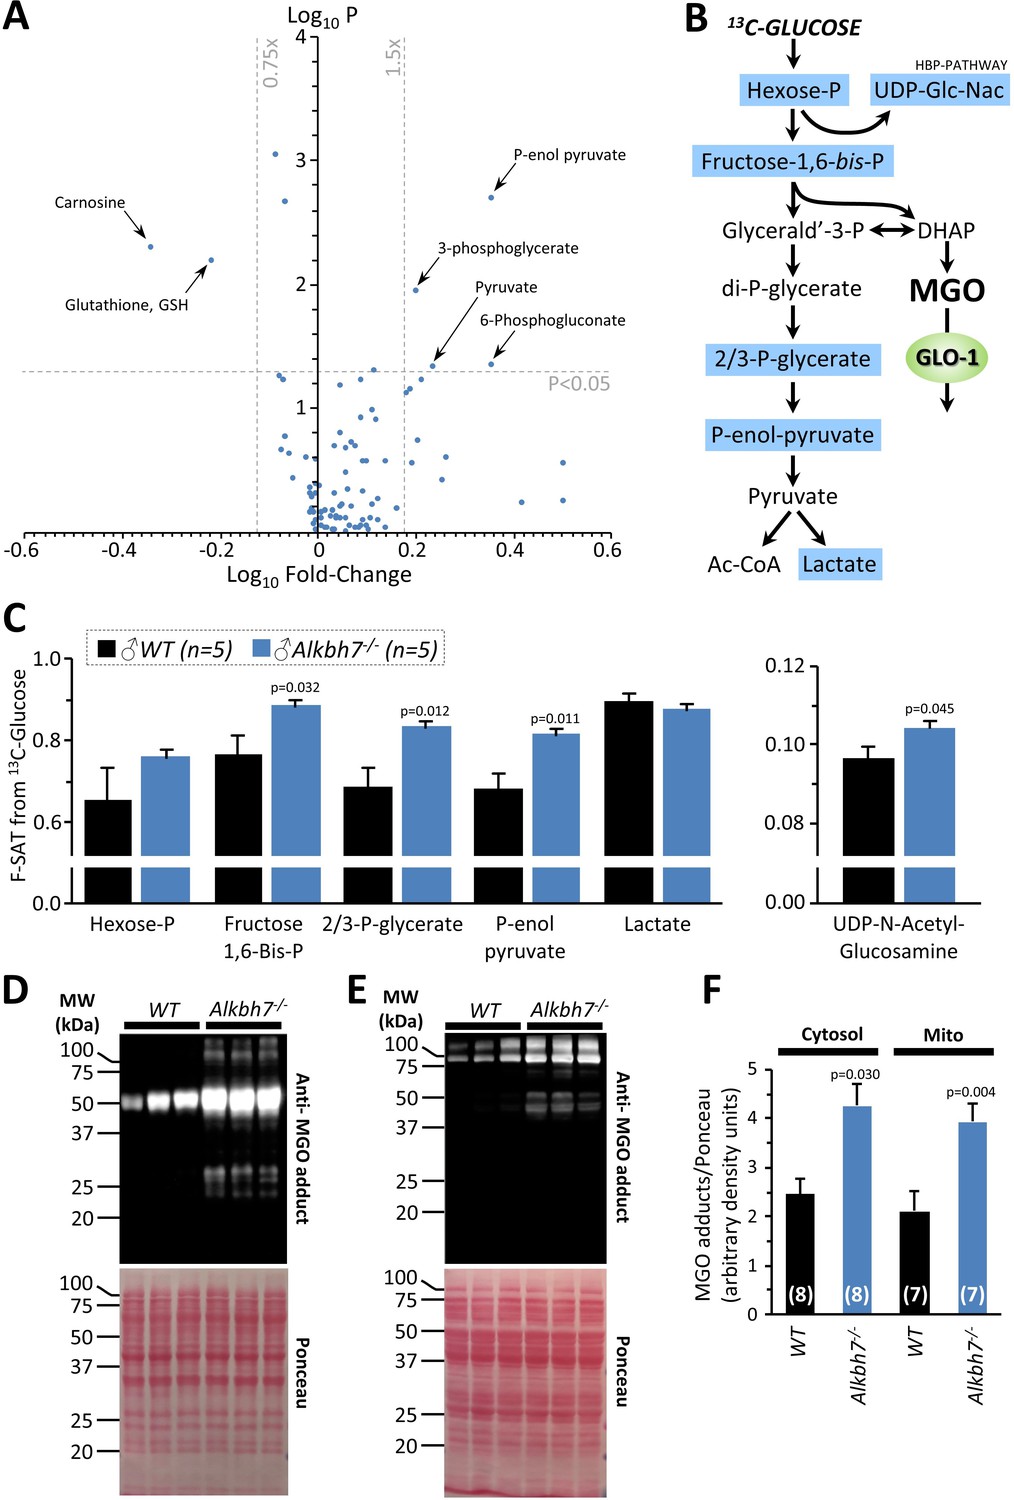
Metabolomics analysis in WT vs.Alkbh7-/-.
Hearts from young male WT or Alkbh7-/- mice were analyzed by LC-MS/MS-based metabolomics as per the methods. (A) Volcano plot showing relative levels of 90 metabolites in the steady state. X-axis shows Log10 of fold change (Alkbh7-/- / WT) and Y-axis shows Log10 of significance (paired t-test, N = 8–17 depending on metabolite). Metabolites crossing thresholds (gray lines) in upper left or right quadrants are labeled. A pathway impact analysis is shown in Figure 3—figure supplement 1. (B) Schematic showing glycolysis and its relationship to methylglyoxal (MGO). Metabolites quantified in 13C-flux measurements (panel C) are highlighted blue. (C) 13C-glucose flux measurements of glycolytic activity in Alkbh7-/- vs. WT hearts. Y-axis shows fractional saturation (F-SAT) of each metabolite within 5 min. from exogenously delivered [U-13C] glucose. Note: UDP-Glc-Nac is shown on separate axes for clarity. (D, E) Western blot showing abundance of MGO-adducts in Alkbh7-/- and WT heart cytosol (D) or mitochondria (E). Ponceau stained membranes are shown below. (F) Quantitation of MGO adduct content from blots, normalized to protein loading. Bar graphs in panels C/F show means ± SE, N = 4–5, with p-values (paired t-test) shown above error bars. In bar graphs, N for each group is shown in parentheses.
Figure 3—figure supplement 1

Representation of metabolic pathways based on detected metabolites.
Pathway analysis was performed using open source MetaboAnalyst 3.0 software (www.metaboanalyst.ca), using all detected metabolites from the steady state analysis (Figure 3A). Greater warm coloring of a metabolic pathway indicates greater coverage, permitting conclusions to be drawn about that pathway.
Figure 4 with 2 supplements
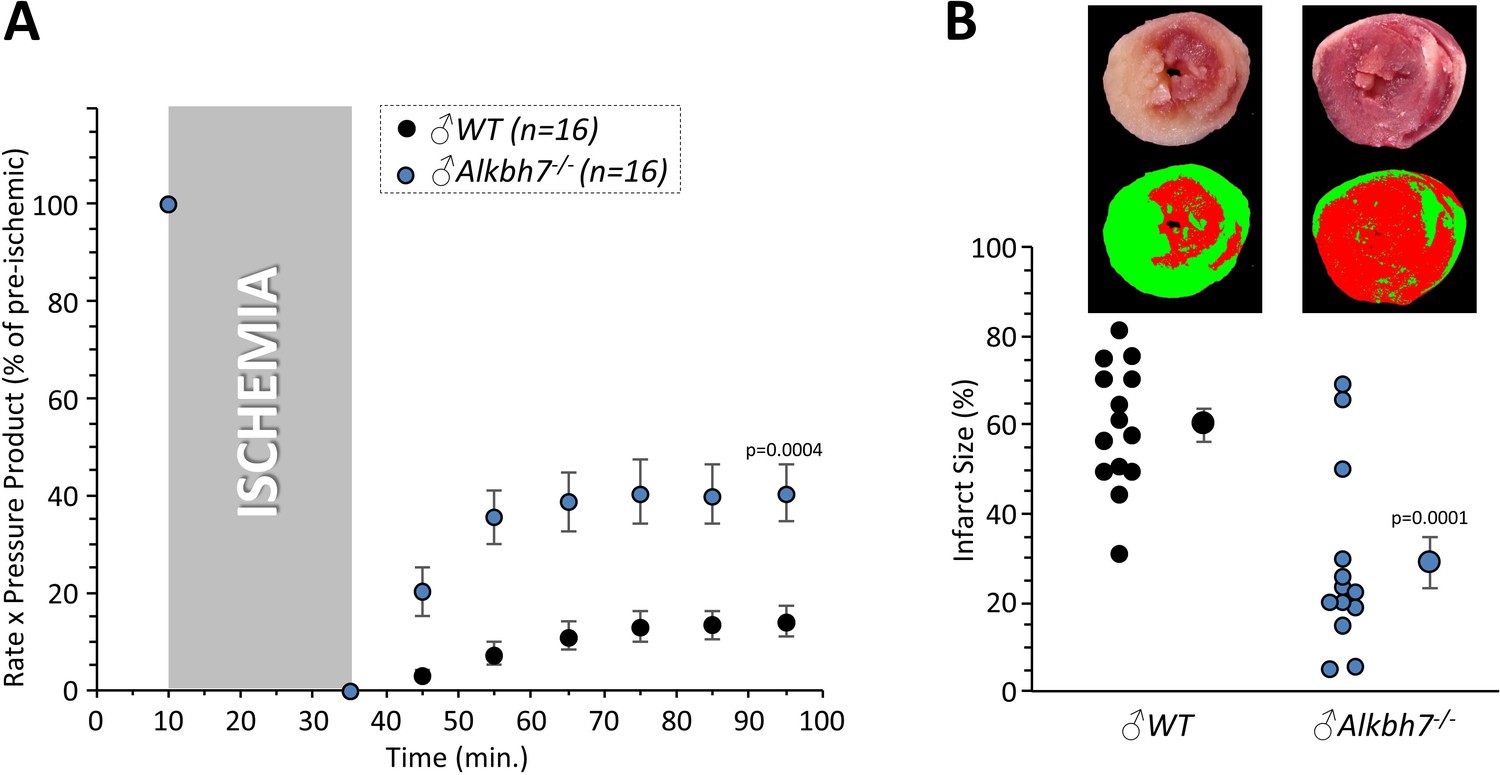
Response to ex-vivo cardiac ischemia-reperfusion (IR) injury in WT vs.Alkbh7-/-.
Hearts from young male WT and Alkbh7-/- mice were Langendorff perfused and subjected to 25 min ischemia plus 60 min reperfusion. (A) Cardiac function assessed by left ventricular balloon pressure transducer. Graph shows the product of heart rate multiplied by left ventricular developed pressure, as a percentage of the initial (pre-ischemic) value. (B) Post IR staining with TTC for quantitation of myocardial infarct size. Representative TTC-stained heart slices are shown, with pseudo-colored mask images used for quantitation by planimetry (red = live tissue, green = infarct). Data are quantified below, with individual data points to shown N, and means ± SE. p-values (paired t-test) are shown above error bars.
Figure 4—figure supplement 1
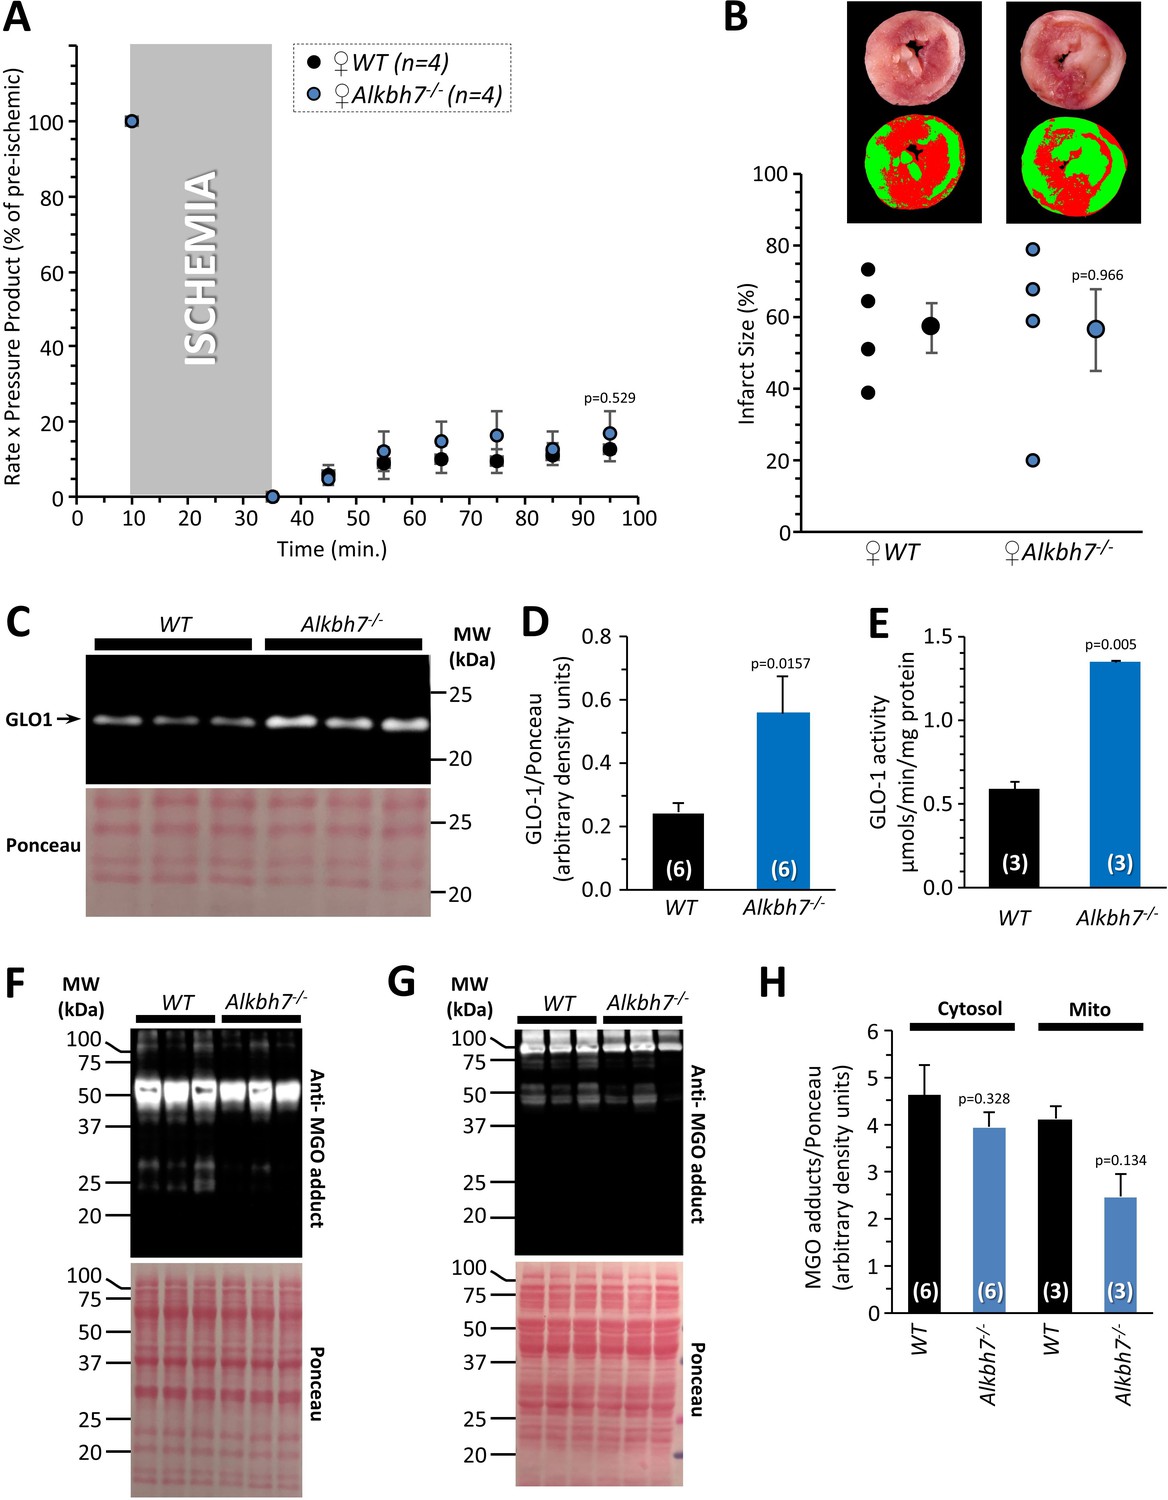
Cardiac ischemia-reperfusion (IR) injury and glycative stress response in FEMALE WT vs.Alkbh7-/-.
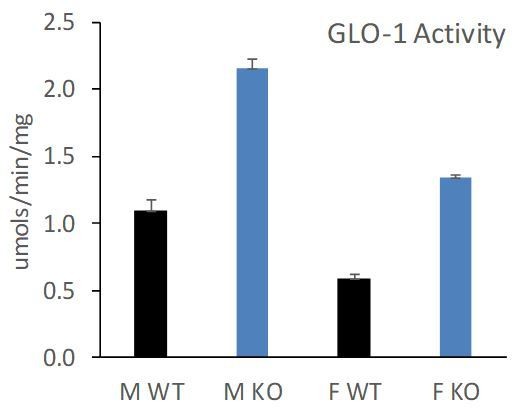
(A) Experiments were as per Figure 4, except young female mice were used instead of male. Hearts from WT and Alkbh7-/- were Langendorff perfused and subjected to 25 min ischemia plus 60 min reperfusion. Cardiac function assessed by left ventricular balloon pressure transducer. Graph shows the product of heart rate multiplied by left ventricular developed pressure, as a percentage of the initial (pre-ischemic) value. (B) Post IR staining with TTC for quantitation of myocardial infarct size. Representative TTC-stained heart slices are shown, with pseudo-colored mask images used for quantitation by planimetry (red = live tissue, green = infarct). Data are quantified below, with individual data points to shown N, and means ± SEM. (C) Western blot for GLO-1 in female WT and Alkbh7-/- heart cytosol. Ponceau stained membrane for normalization is shown below, with quantitation in panel (D). (E) GLO-1 activity assay in female WT and Alkbh7-/- heart cytosol. (F/G) Western blot for anti-MGO protein adducts in female WT and Alkbh7-/- heart cytosol (F) and mitochondria (G). Ponceau stained membranes for normalization are shown below, with densitometric quantitation in panel (H). For bar graphs, N for each experiment is shown in parentheses. p-values (paired t-test) are shown above error bars.
Figure 4—figure supplement 2
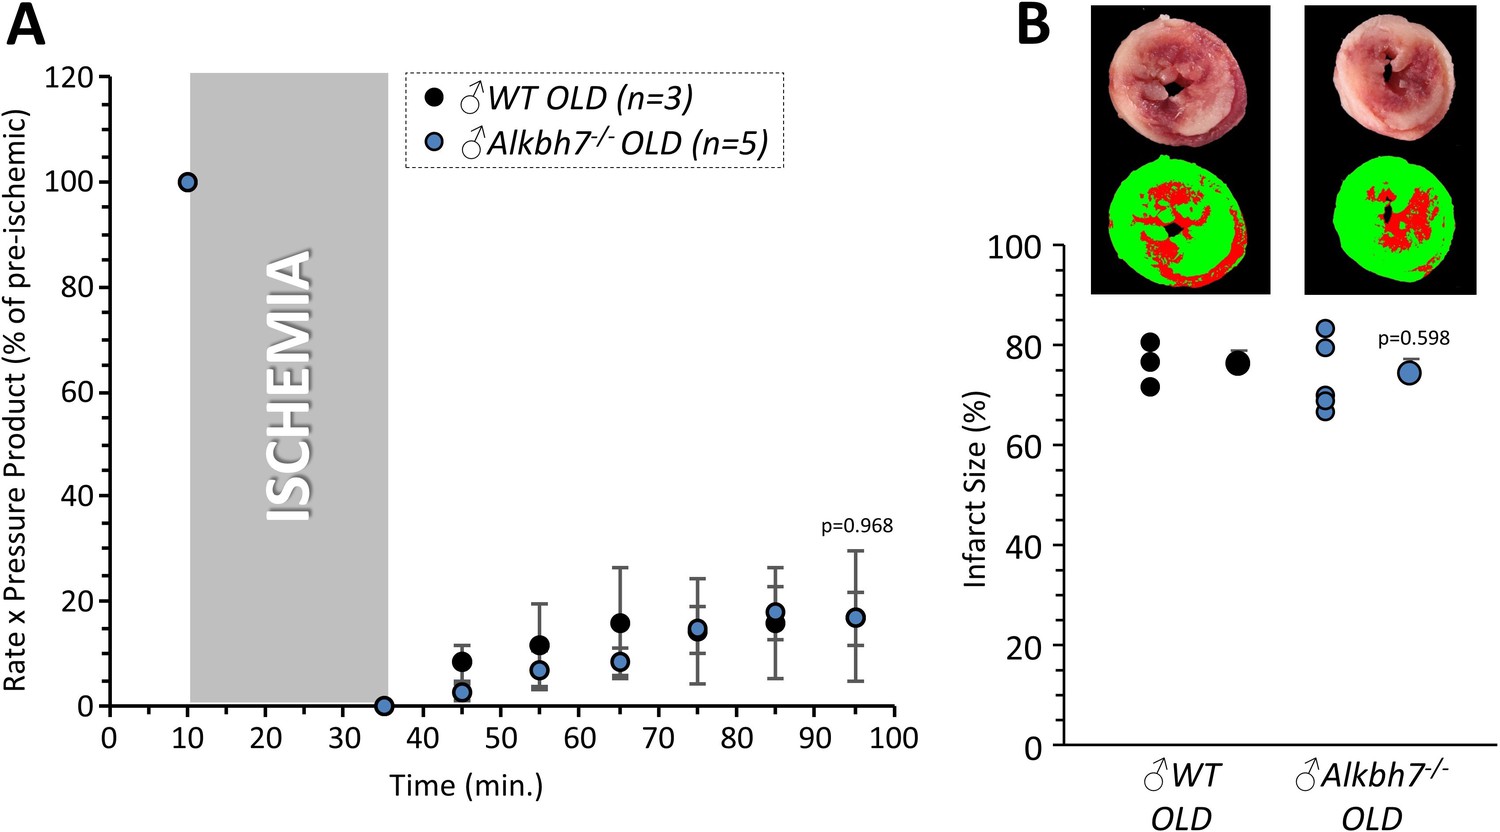
Response to ex-vivo cardiac ischemia-reperfusion (IR) injury in OLD MALE WT vs.Alkbh7-/-.
Experiments were as per Figure 4, except old male mice (1.5 years) were used instead of young males (8–12 weeks). Hearts from WT and Alkbh7-/- were Langendorff perfused and subjected to 25 min ischemia plus 60 min reperfusion. (A) Cardiac function assessed by left ventricular balloon pressure transducer. Graph shows the product of heart rate multiplied by left ventricular developed pressure, as a percentage of the initial (pre-ischemic) value. (B) Post IR staining with TTC for quantitation of myocardial infarct size. Representative TTC-stained heart slices are shown, with pseudo-colored mask images used for quantitation by planimetry (red = live tissue, green = infarct). Data are quantified below, with individual data points to shown N, and means ± SEM. p-values (paired t-test) are shown above error bars. N for each experiment shown in parentheses.
Figure 5 with 3 supplements
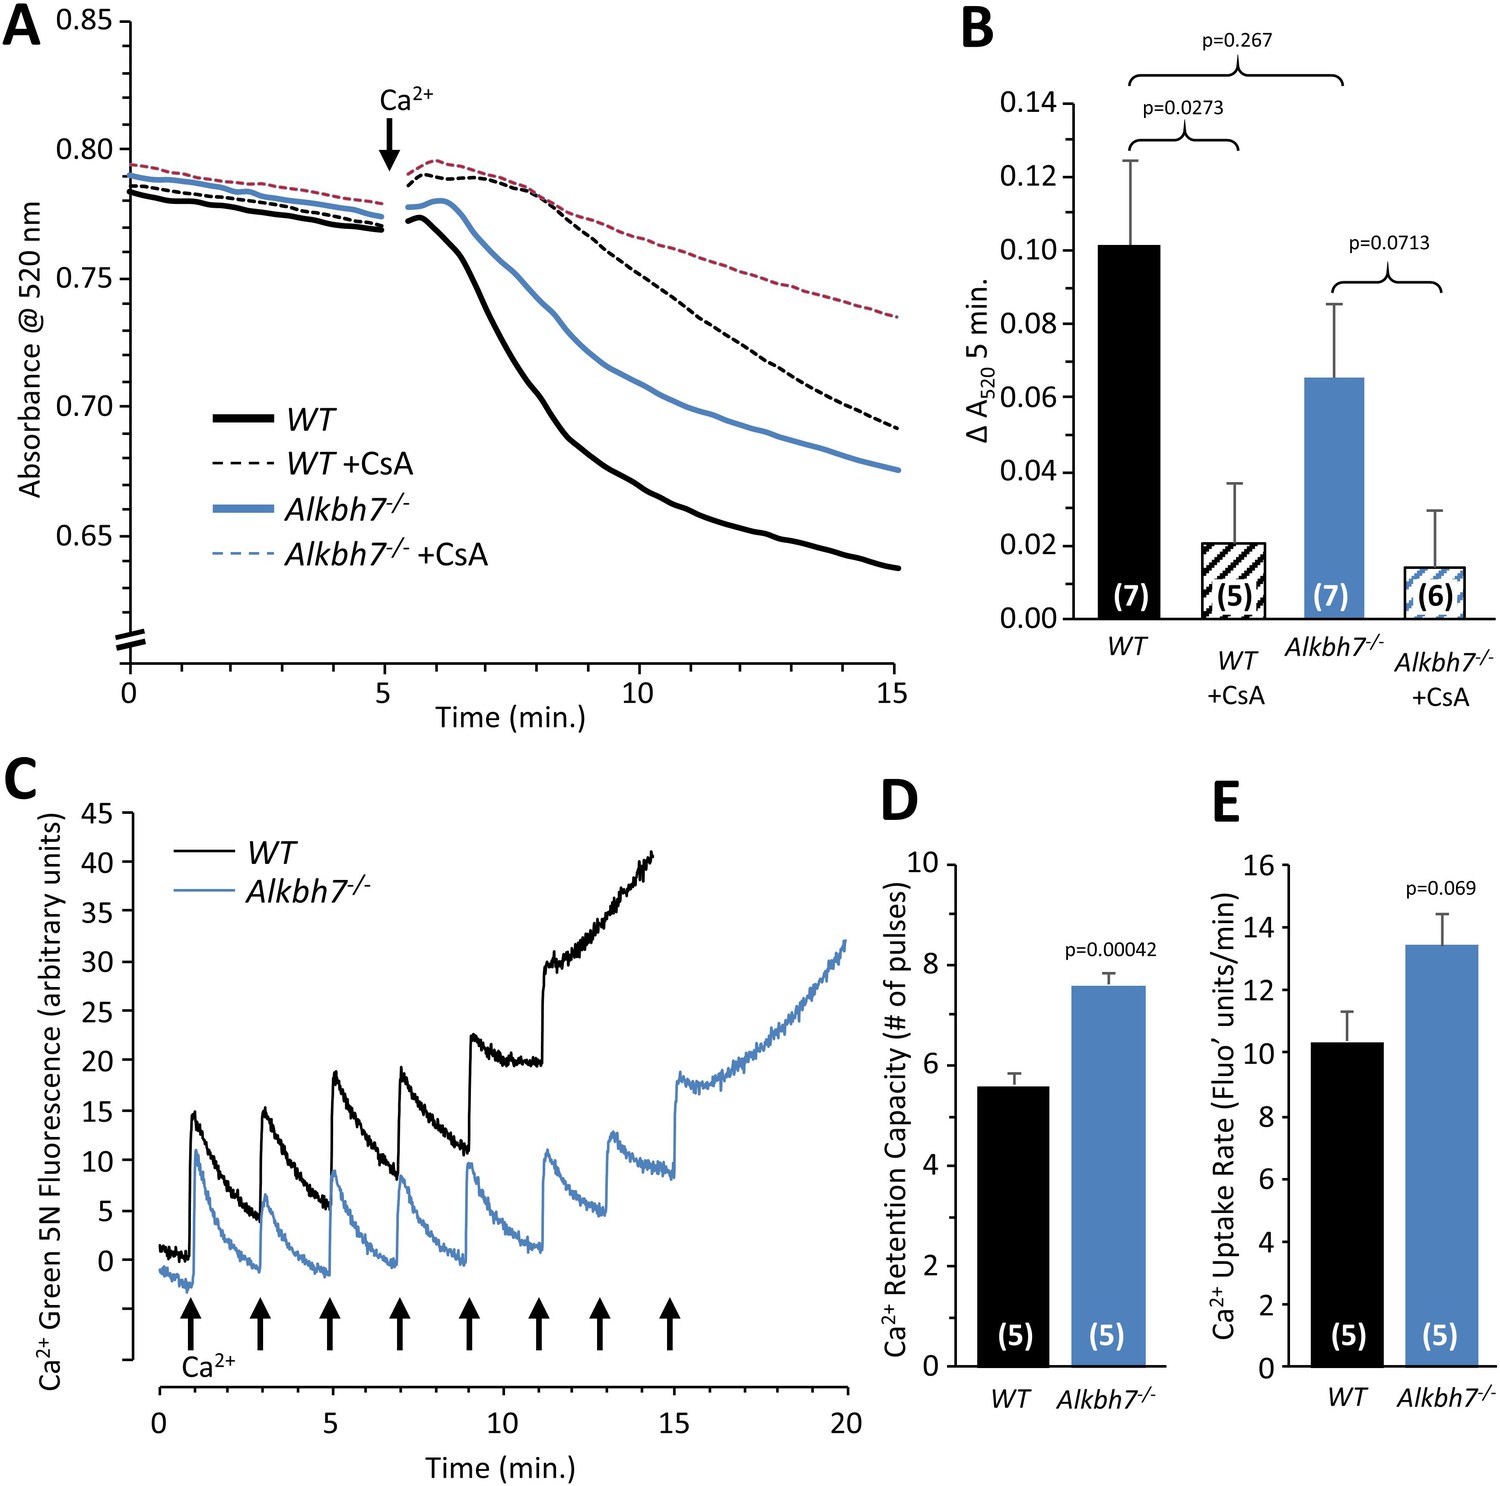
Mitochondrial PT pore and Ca2+ handling in WT vs.Alkbh7-/-.
(A) Opening of the mitochondrial PT pore was assayed spectrophotometrically in isolated cardiac mitochondria from young male WT and Alkbh7-/- mice. Average traces are shown, with addition of 100 µM Ca2+ to initiate PT pore opening and swelling indicated by the arrow. Dotted lines indicate the presence of the PT pore inhibitor cyclosporin A (CsA). Error bars are omitted for clarity. (B) Quantitation of pore opening, as the change in swelling (absorbance at 520 nm) in 5 min. Data are means ± SE, N = 7, with significance between groups (unpaired t-test) shown above error bars. (C) Mitochondrial Ca2+ handling assayed by Ca2+ green-5N fluorescence. Isolated cardiac mitochondria from young male WT and Alkbh7-/- mice were incubated with Ca2+ green-5N to indicate extra-mitochondrial [Ca2+]. Pulses of 10 µM Ca2+ were added at ~2 min intervals as indicated by arrows. Representative traces are shown. (D) Quantitation of the number of Ca2+ pulses tolerated by mitochondria before PT pore opening occurred (as indicated by a sharp upward deflection in the Ca2+ green-5N trace). (E) Quantitation of the initial rate of mitochondrial Ca2+ uptake, calculated from the downward slope in Ca2+ green-5N fluorescence on the first 3 Ca2+ pulses. Bar graphs in panels B/D/E show means ± SE, N = 5–7, with p-values (unpaired t-test) shown above error bars. In bar graphs, N for each group is shown in parentheses.
Figure 5—figure supplement 1
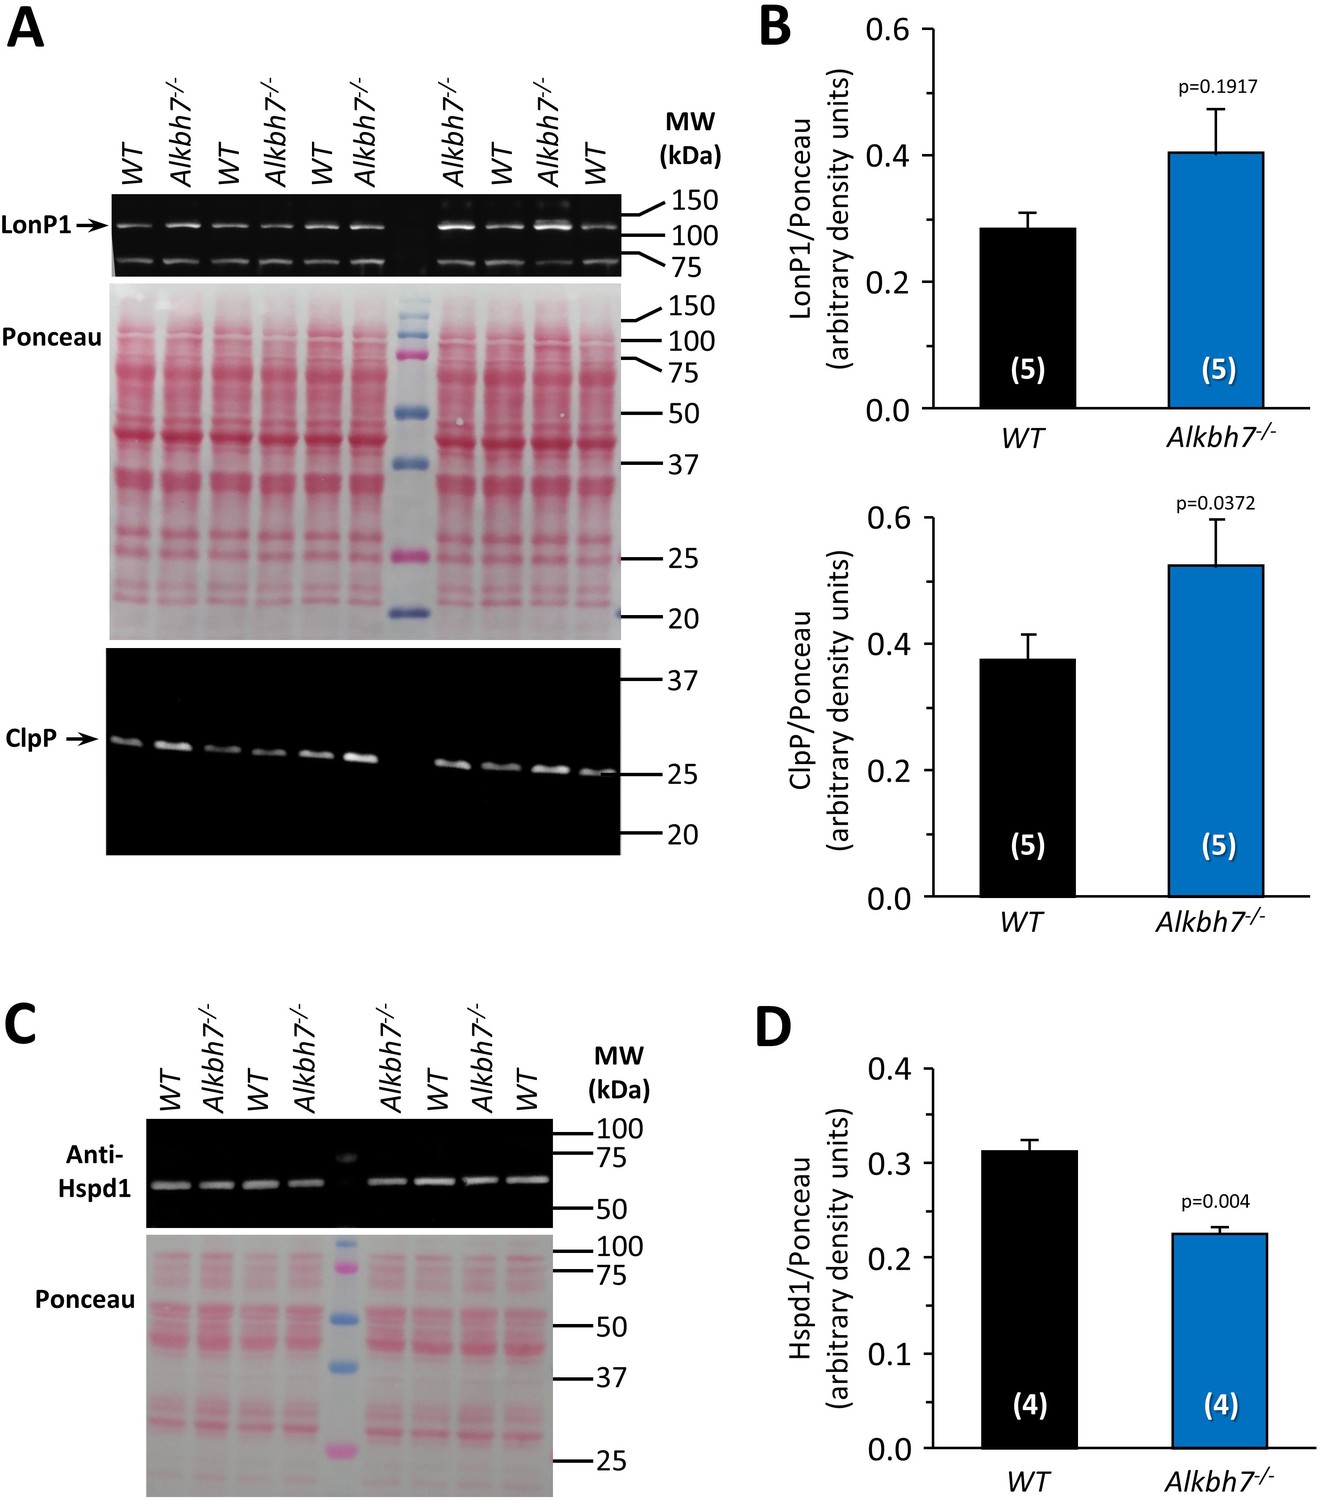
Western blot detection of UPRmt mediators in WT vs.Alkbh7-/-hearts.
To determine whether loss of ALKBH7 resulted in activation of the mitochondrial unfolded protein response (UPRmt), the levels of key effectors were determined by western blot. (A) Blots show levels of LonP1 and Clpp in cardiac homogenate of WT and Alkbh7-/- hearts. Protein loading is shown in the central Ponceau S stained membrane. (B) Quantitation of data from blots of LonP1 and Clpp. Graphs show means ± SEM, N = 4, with p values (unpaired t-test) above the error bars. (C) Blot shows level of Hspd1 (HSP60) in mitochondria from WT and Alkbh7-/- hearts. Protein loading is shown in the Ponceau S stained membrane below. (D) Quantitation of data from blot of Hspd1. Graphs show means ± SEM, N = 4–5, with p values (unpaired t-test) above the error bars. N for each experiment shown in parentheses.
Figure 5—figure supplement 2

Cardioprotection against IR injury by dimethyl-L-2-hydroxyglutarate.
Hearts from WT mice were Langendorff perfused and subjected to 25 min. ischemia plus 60 min reperfusion, with optional administration of 10 µM dimethyl-L-2-hydroxyglutarate (DM2HG) for 20 min prior to the onset of ischemia. (A) Cardiac function assessed by left ventricular balloon pressure transducer. Graph shows the product of heart rate multiplied by left ventricular developed pressure, as a percentage of the initial (pre-ischemic) value. (B) Post IR staining with TTC for quantitation of myocardial infarct size. Representative TTC-stained heart slices are shown, with pseudo-colored mask images used for quantitation by planimetry (red = live tissue, green = infarct). Data are quantified below, with individual data points to shown N, and means ± SEM. p-values (paired t-test) are shown above error bars. N for each experiment shown in parentheses.
Figure 5—figure supplement 3

Blue-native analysis of mitochondrial respiratory supercomplexes.
Heart mitochondria from WT or Alkbh7-/- mice were separated by blue-native PAGE as per the methods. (A) Original gel showing positions of respiratory complexes I, V and III, and supercomplexes (SCs) at the top. Note, gel was not stained post-hoc with Coomassie blue, but gel conditions contain the dye, such that gels appear with blue bands immediately upon electrophoresis. (B) Complex V in-gel assay. White bands show lead precipitate resulting from ATPase activity of complex V. Monomeric, dimeric, and multimeric forms of complex V are indicated. Gels are representative of at least three independent experiments.
Figure 6 with 1 supplement
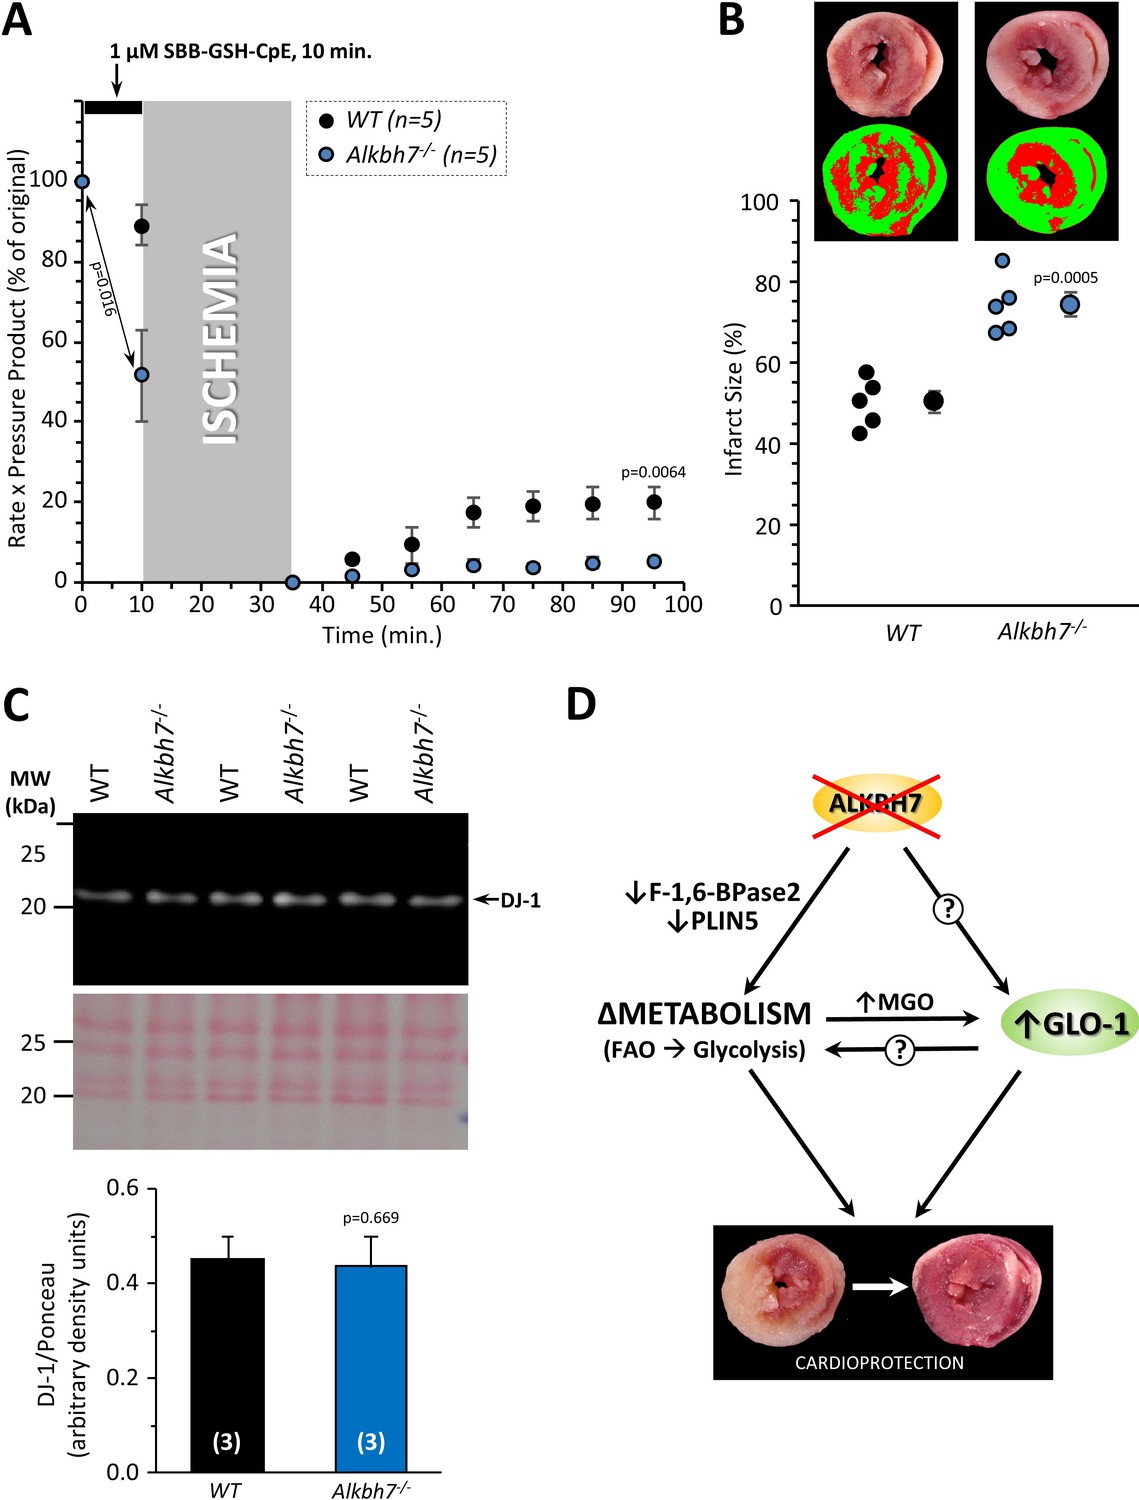
Blockade of cardioprotection in Alkbh7-/- by GLO-1 inhibition.
Hearts from young male WT and Alkbh7-/- mice were Langendorff perfused and subjected to IR injury as in Figure 4, with delivery of 1 µM SBB-GSH-CpE for 10 min. prior to ischemia. (A) Cardiac function assessed by left ventricular balloon pressure transducer. Graph shows the product of heart rate multiplied by left ventricular developed pressure, as a percentage of the initial value. A significant drop in cardiac function was observed upon drug infusion in Alkbh7-/- only (see arrow and p-value). (B) Post IR staining with TTC for quantitation of myocardial infarct size. Representative TTC-stained heart slices are shown, with pseudo-colored mask images used for quantitation by planimetry (red = live tissue, green = infarct). Data are quantified below, with individual data points to shown N, and means ± SE. p-values (paired t-test) are shown above error bars. (C) Western blot showing abundance of DJ-1 in Alkbh7-/- and WT heart mitochondria. Ponceau stained membrane and quantitation are shown below. Bar graph shows means ± SE, N = 4, with p-values (paired t-test) shown above error bars. (D) Schematic showing proposed events that connect loss of ALKBH7 to cardioprotection. Via mechanisms that may include downregulation of Perilipin five and F-1,6-BPase 2, loss of ALKBH7 causes a shift in metabolism away from fatty acid oxidation (FAO) toward elevated glycolysis. GLO-1 is also upregulated, possibly in response to MGO elevation. Both elevated glycolysis and GLO-1 then protect against IR injury. The potential role of GLO-1 as a regulator of the metabolic shift toward glycolysis is also shown.
Figure 6—figure supplement 1
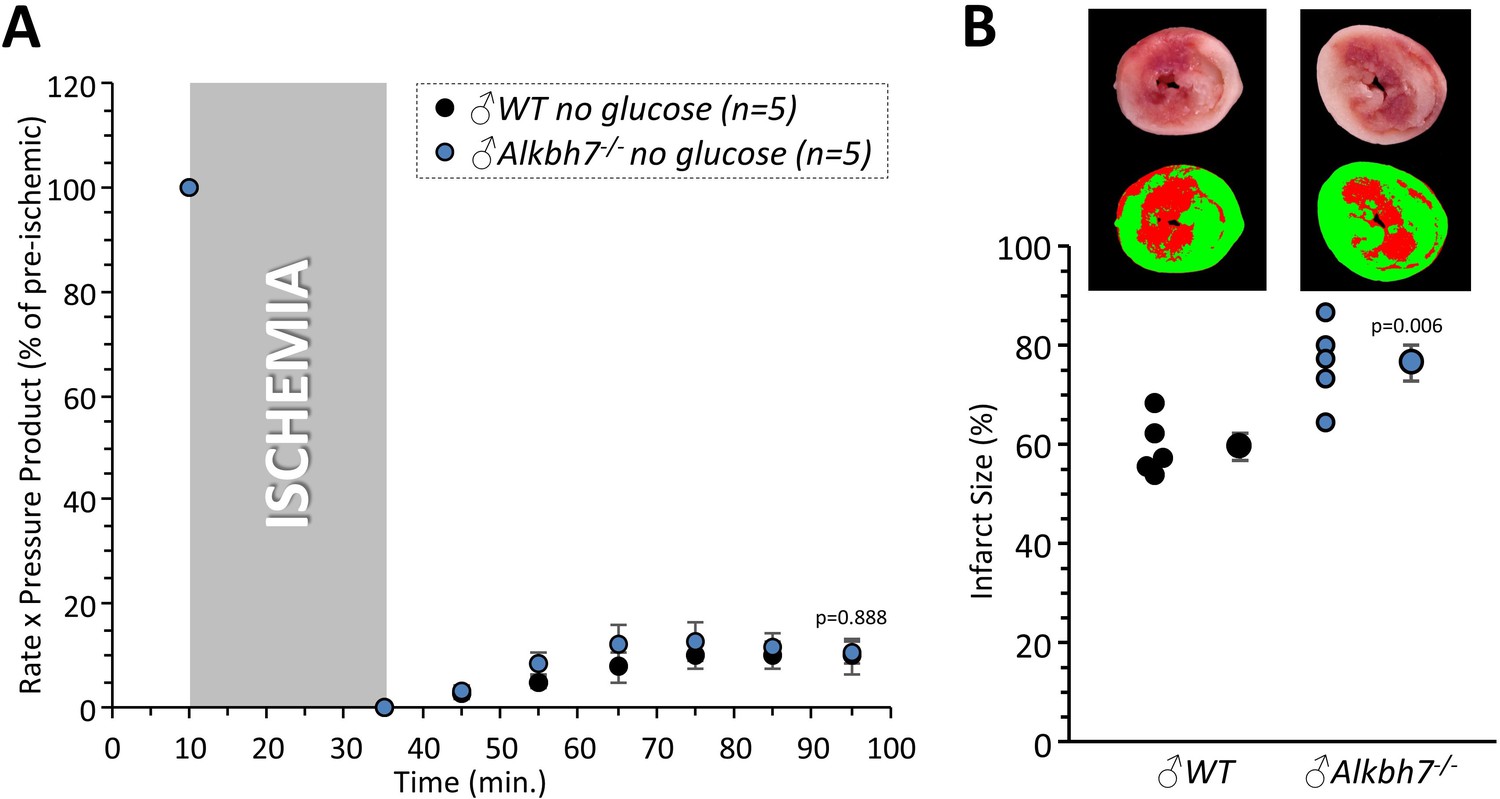
Response to ex-vivo cardiac ischemia-reperfusion (IR) injury in WT vs.Alkbh7-/-, in the absence of glucose.
Experiments were as per Figure 4, except that hearts were perfused with a Krebs-Henseleit buffer lacking glucose (other respiratory substrates including palmitate conjugated to BSA were still present). Hearts from WT and Alkbh7-/- were Langendorff perfused and subjected to 25 min ischemia plus 60 min reperfusion. (A) Cardiac function assessed by left ventricular balloon pressure transducer. Graph shows the product of heart rate multiplied by left ventricular developed pressure, as a percentage of the initial (pre-ischemic) value. (B) Post IR staining with TTC for quantitation of myocardial infarct size. Representative TTC-stained heart slices are shown, with pseudo-colored mask images used for quantitation by planimetry (red = live tissue, green = infarct). Data are quantified below, with individual data points to shown N, and means ± SEM. p-values (paired t-test) are shown above error bars. N for each experiment shown in parentheses.
Author response image 1
Additional files
-
Source data 1
Source data for Figure 1 and Supplements.
- https://cdn.elifesciences.org/articles/58573/elife-58573-data1-v2.xlsx
-
Source data 2
Source data for Figure 2 and Supplements.
- https://cdn.elifesciences.org/articles/58573/elife-58573-data2-v2.xlsx
-
Source data 3
Source data for Figure 3 and Supplements.
- https://cdn.elifesciences.org/articles/58573/elife-58573-data3-v2.xlsx
-
Source data 4
Source data for Figure 4 and Supplements.
- https://cdn.elifesciences.org/articles/58573/elife-58573-data4-v2.xlsx
-
Source data 5
Source data for Figure 5 and Supplements.
- https://cdn.elifesciences.org/articles/58573/elife-58573-data5-v2.xlsx
-
Source data 6
Source data for Figure 6 and Supplements.
- https://cdn.elifesciences.org/articles/58573/elife-58573-data6-v2.xlsx
-
Supplementary file 1
Proteins identified as interacting with ALKBH7 by immunoprecipitation under control or MMS-treated conditions.
Cells transfected with FLAG-tagged ALKBH7 were treated with MMS as per the methods, the anti-FLAG beads used to immunoprecipitate ALKBH7-interacting proteins. Following SDS-PAGE separation (see Figure 2—figure supplement 1), excised bands were identified by mass spectrometry of trypsin digests. Proteins are listed by name and accession, with the number of unique peptides identified under each condition indicated in the appropriate columns.
- https://cdn.elifesciences.org/articles/58573/elife-58573-supp1-v2.docx
-
Transparent reporting form
- https://cdn.elifesciences.org/articles/58573/elife-58573-transrepform-v2.pdf
Download links
A two-part list of links to download the article, or parts of the article, in various formats.
Downloads (link to download the article as PDF)
Open citations (links to open the citations from this article in various online reference manager services)
Cite this article (links to download the citations from this article in formats compatible with various reference manager tools)
ALKBH7 mediates necrosis via rewiring of glyoxal metabolism
eLife 9:e58573.
https://doi.org/10.7554/eLife.58573


