SARS-CoV-2 strategically mimics proteolytic activation of human ENaC
- nference Labs, India
- nference, Inc, United States
Figures
Figure 1
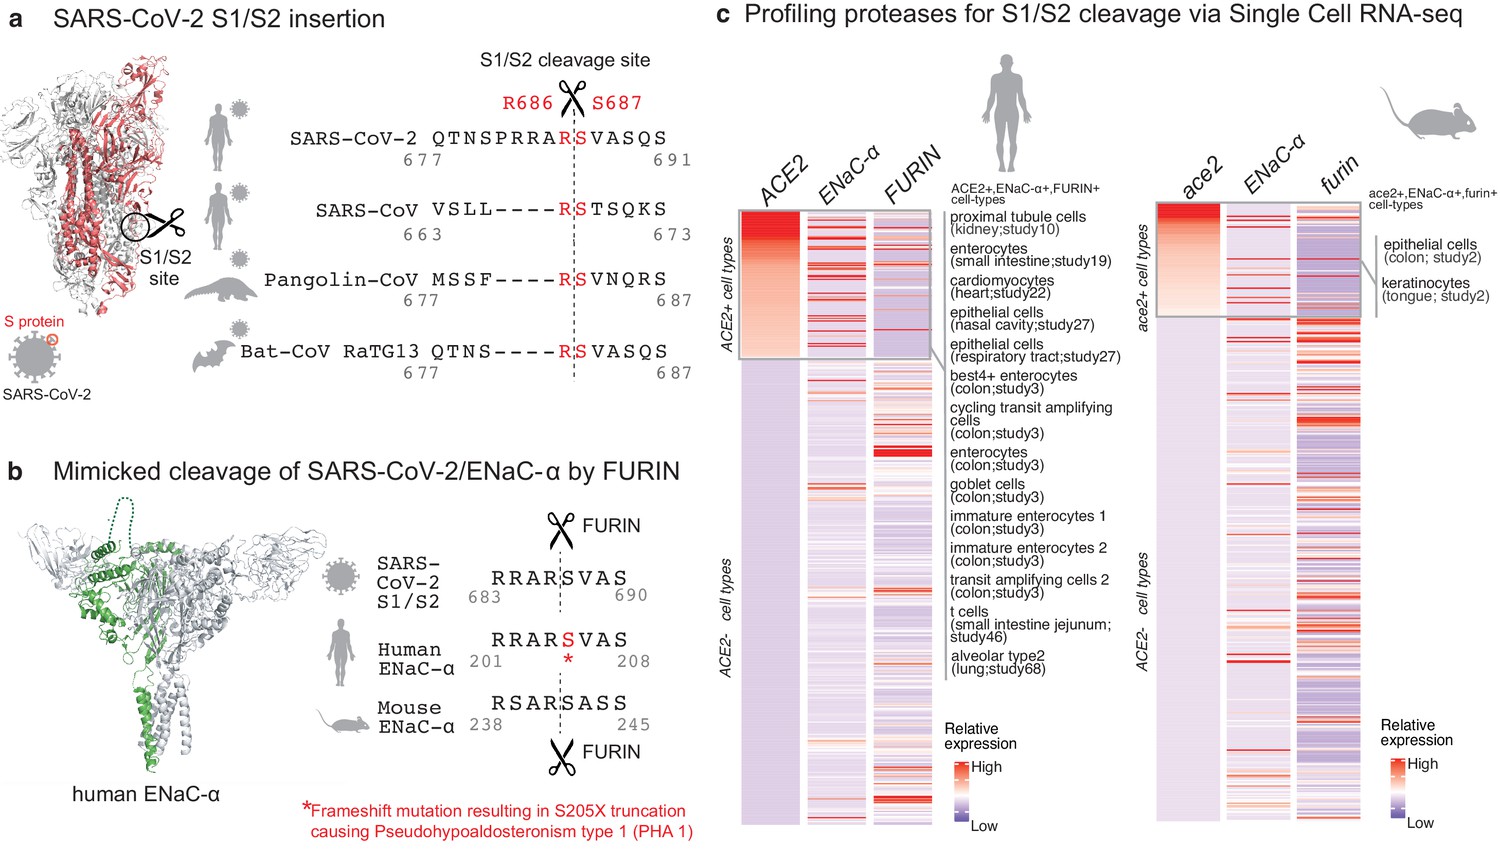
Targeted molecular mimicry by SARS-CoV-2 of human ENaC-ɑ and profiling ACE2-FURIN-ENaC-ɑ co-expression.
(a) The cartoon representation of the S-protein homotrimer from SARS-CoV-2 is shown (PDB ID: 6VSB). One of the monomers is highlighted in red. The alignment of the S1/S2 cleavage site required for the activation of SARS-CoV-2, SARS-CoV, Pangolin-CoV, and Bat-CoV RaTG13 are shown. The four amino acid insertion evolved by SARS-CoV-2, along with the abutting cleavage site is shown in a box. (b) The cartoon representation of human ENaC protein is depicted (PDB ID: 6BQN; chain in green), highlighting the ENaC-ɑ chain in green. The alignment on the right captures FURIN cleavage at the S1/S2 site of SARS-CoV-2, along with its striking molecular mimicry of the identical peptide from human ENaC-ɑ protein (dotted loop in the cartoon rendering of human ENaC). The alignment further shows the equivalent 8-mer peptide of mouse ENaC-ɑ that is also known to be cleaved by FURIN. One of the known genetic alterations on human ENaC-ɑ is highlighted as well (Welzel et al., 2013). (c) The single cell transcriptomic co-expression of ACE2, ENaC-ɑ, and FURIN is summarized. The heatmap depicts the mean relative expression of each gene across the identified cell populations. The human and mouse single cell RNA-seq are visualized independently. The cell types are ranked based on decreasing expression of ACE2. The box highlights the ACE2 positive cell types in human and mouse samples.
Figure 2 with 6 supplements
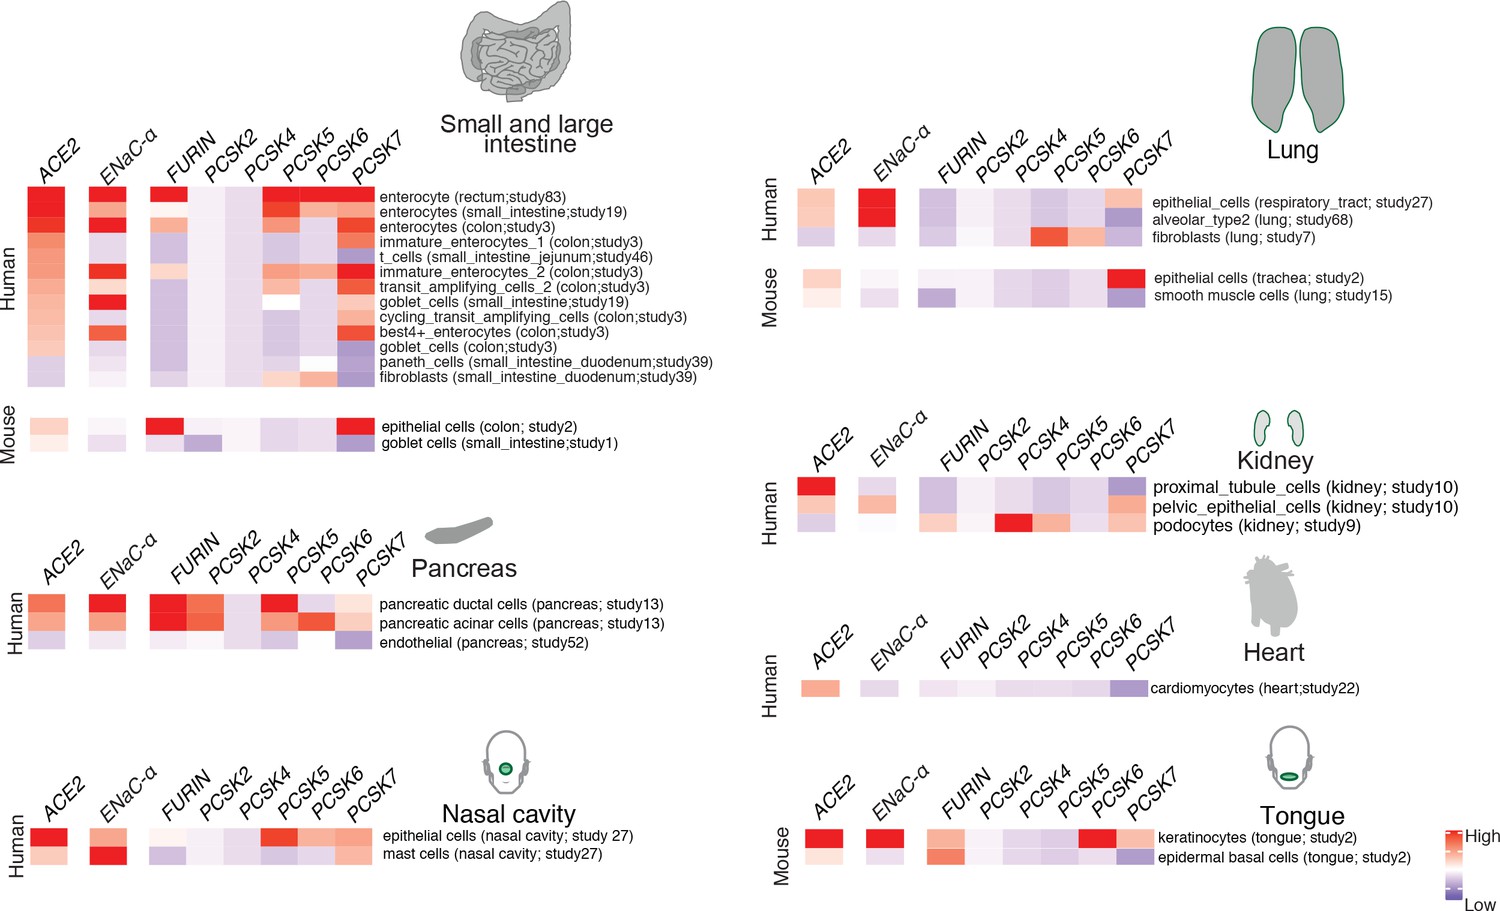
Expression profiling of identified proteases.
The heatmap depicts the relative expression of ACE2 and ENaC-ɑ along with a list of proteases that can potentially cleave the S1/S2 site. The relative expression levels are denoted on a scale of blue (low) to red (high). The rows denote proteases and columns denote cell-types.
Figure 2—figure supplement 1
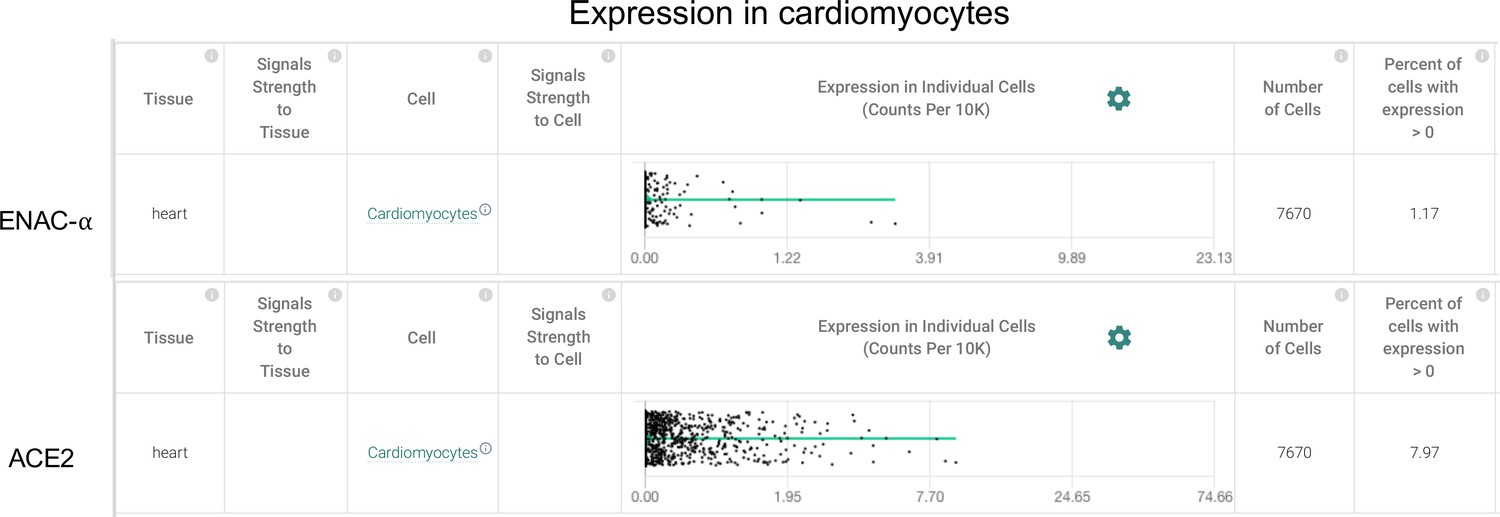
Cardiomyocytes express ENaC-ɑ (SCNN1A) and ACE2 (Primary data processed from Pubmed ID:31915373 and hosted on https://academia.nferx.com/).
Figure 2—figure supplement 2
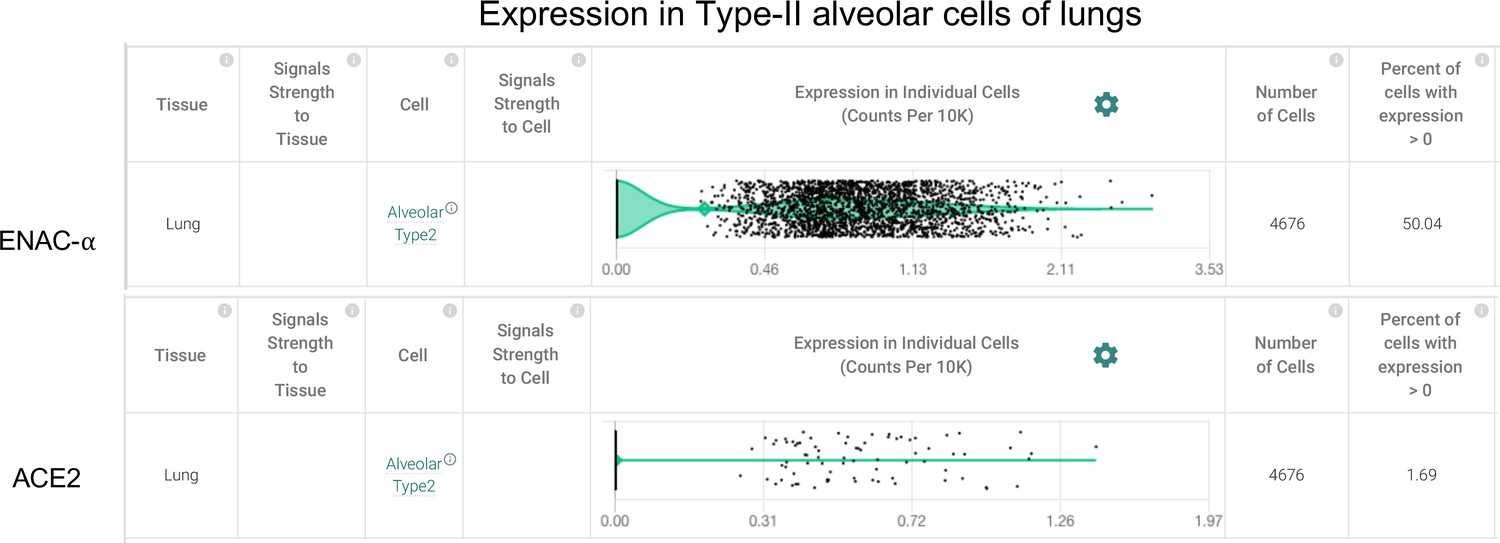
Type-II Alveolar cells of the lungs express ENaC-ɑ (SCNN1A) and ACE2 (Primary data processed from Pubmed ID: 31892341 and hosted on https://academia.nferx.com/).
Figure 2—figure supplement 3
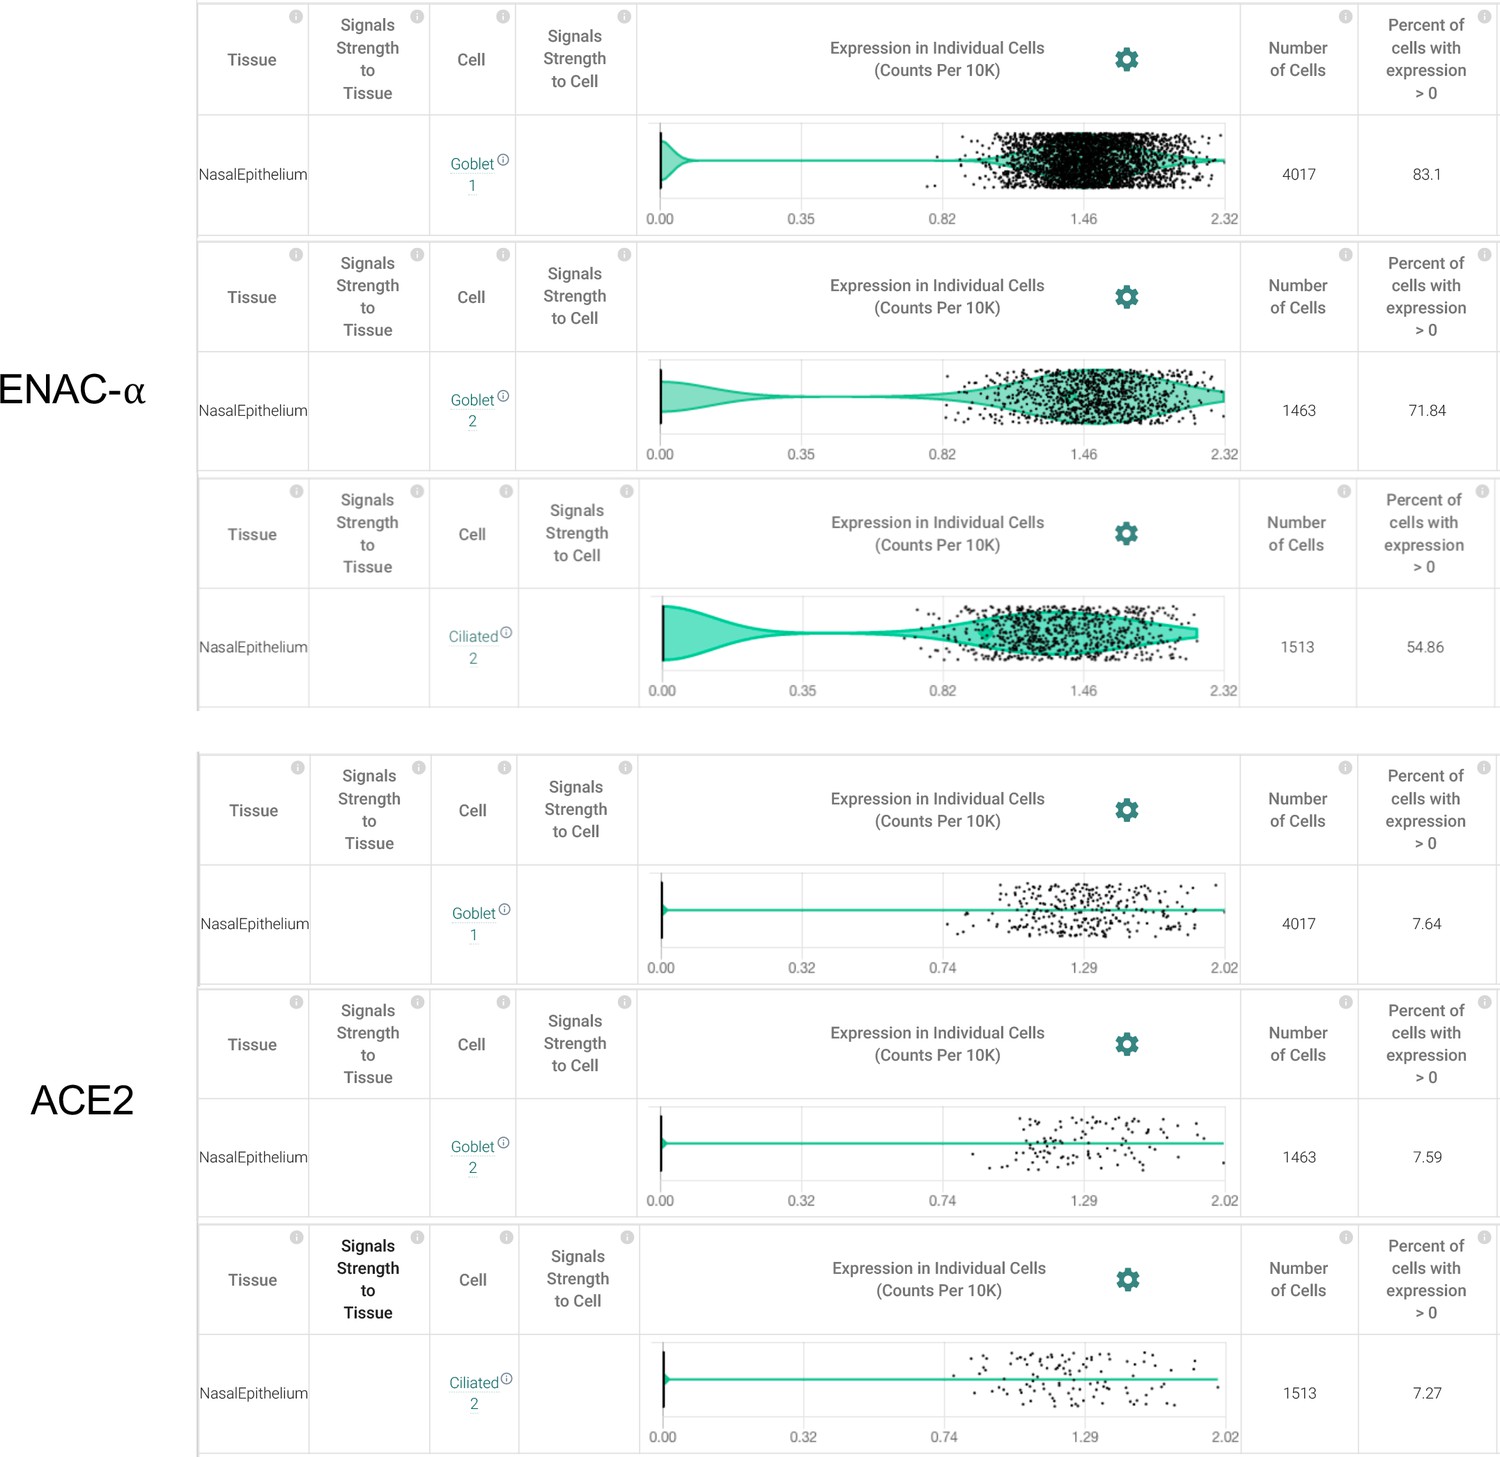
Goblet cells and Ciliated cells of the nasal epithelial layer express SCNN1A (ENaC-ɑ) and ACE2 (Primary data processed from Pubmed ID: 32327758 and hosted on https://academia.nferx.com/).
Figure 2—figure supplement 4
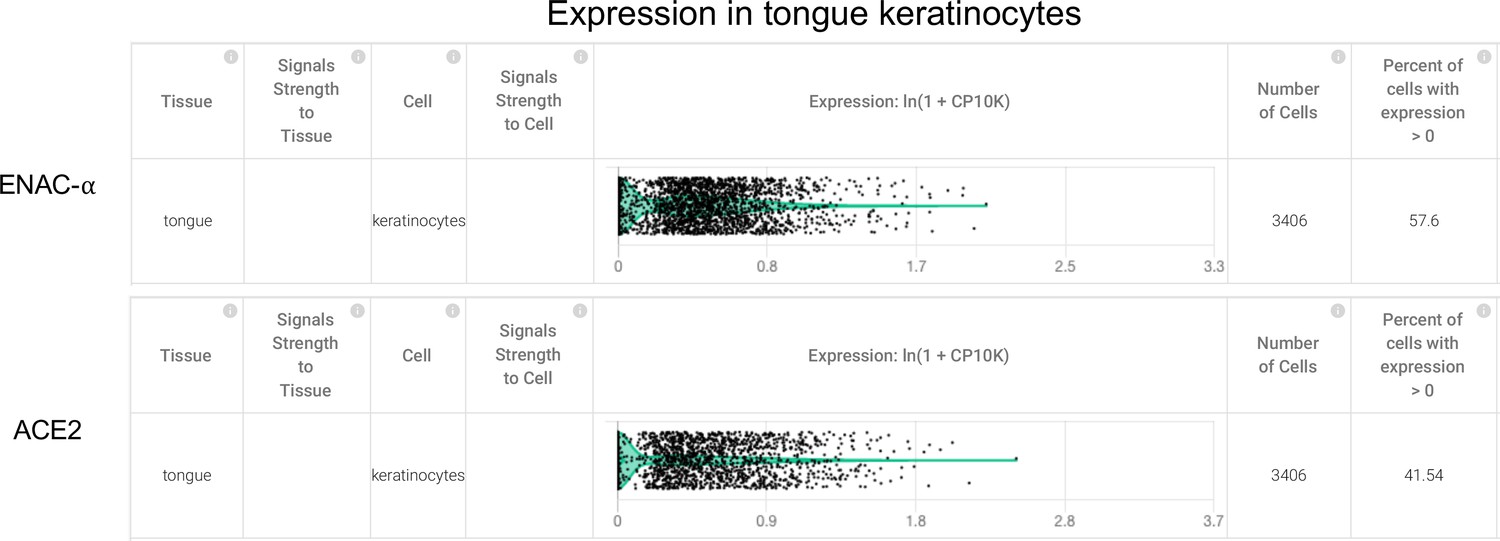
Tongue keratinocytes express SCNN1A (ENaC-ɑ) and ACE2 (Primary data processed from Pubmed ID:30283141 and hosted on https://academia.nferx.com/).
Figure 2—figure supplement 5
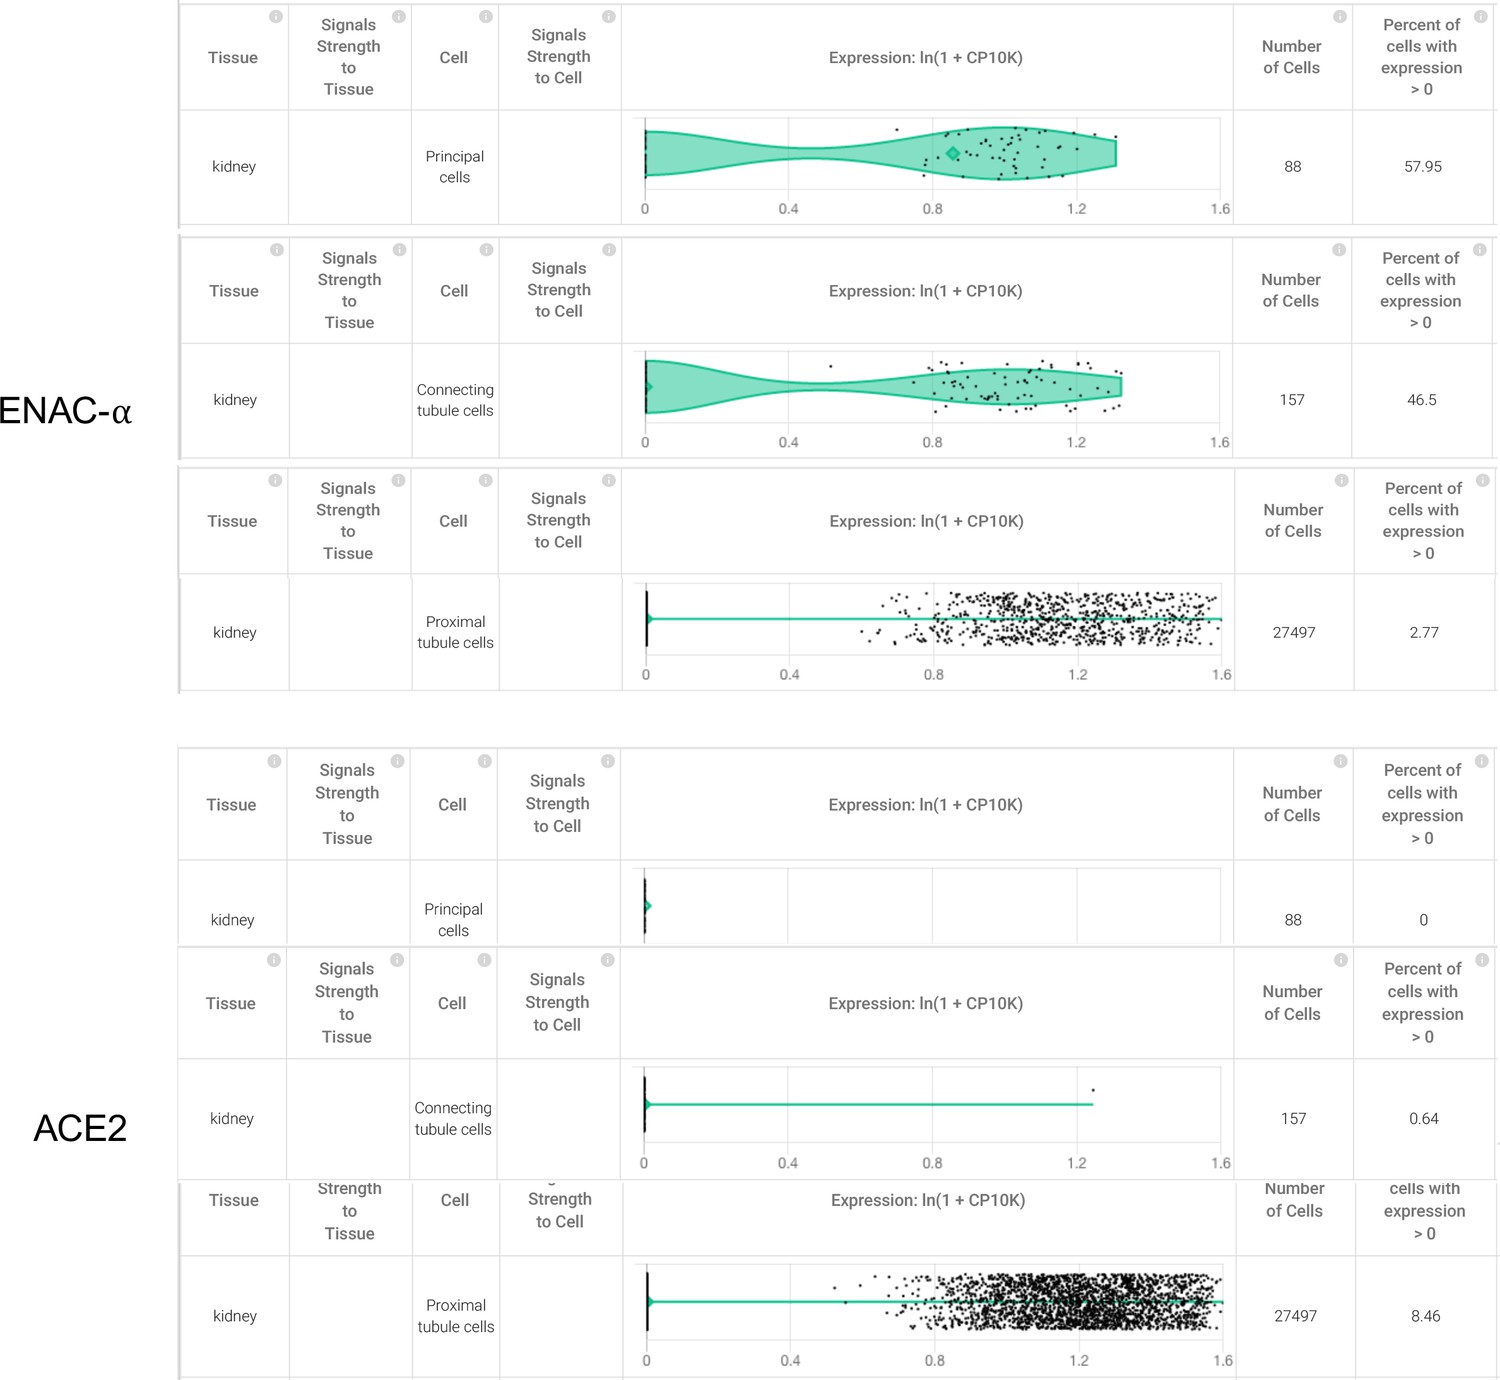
Higher expression of SCNN1A was detected in 58% of the principal cells in the collecting duct 47% of the connecting tubule cells from the kidney, but ACE2 expression was not detected in these cell types.
Although only 2.77% of the proximal tubule cells had detectable expression of SCNN1A, a higher percentage (8.46%) of these cells were also observed to express ACE2 (Primary data processed from Pubmed ID: 31604275 and hosted on https://academia.nferx.com/).
Figure 2—figure supplement 6
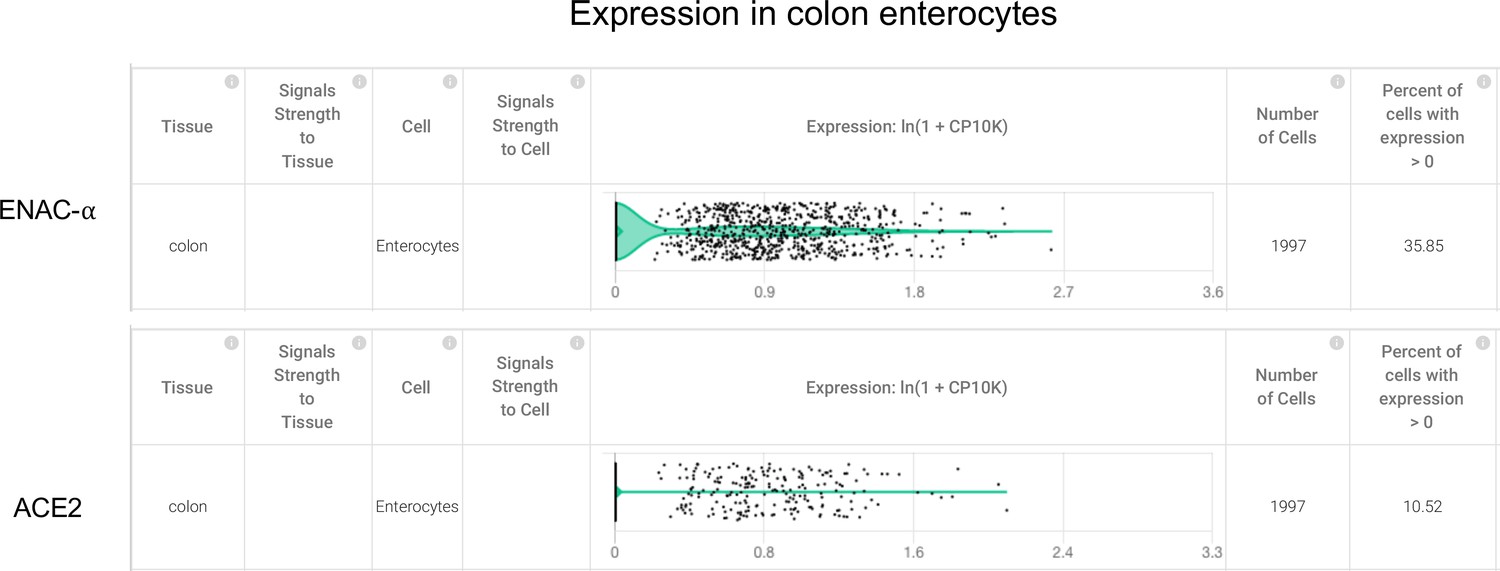
Colon enterocytes express SCNN1A (ENaC-ɑ) and ACE2 (Primary data processed from Pubmed ID:31348891 and hosted on https://academia.nferx.com/).
Additional files
-
Supplementary file 1
Conservation of S1/S2 site and proteases predicted to cleave it.
(a) SARS-CoV-2 variants in the RRARSVAS 8-mer peptide from 10,987 spike (S) protein sequences of the GISAID database. The specific variations are highlighted in Red. (b) Protease cleavage propensities for FURIN and the other proteases identified as similar from the vector space analysis conducted. Similarity (FURIN) ranges from 0 to 1. Highlighted green are amino acids occurring in greater than 10% of the cleaved substrates at that position (compiled from MEROPS). (c) List of single-cell studies analyzed and incorporated into the nferX resource (https://academia.nferx.com/).
- https://cdn.elifesciences.org/articles/58603/elife-58603-supp1-v2.docx
-
Transparent reporting form
- https://cdn.elifesciences.org/articles/58603/elife-58603-transrepform-v2.pdf
Download links
A two-part list of links to download the article, or parts of the article, in various formats.
Downloads (link to download the article as PDF)
Open citations (links to open the citations from this article in various online reference manager services)
Cite this article (links to download the citations from this article in formats compatible with various reference manager tools)
SARS-CoV-2 strategically mimics proteolytic activation of human ENaC
eLife 9:e58603.
https://doi.org/10.7554/eLife.58603


