Reshaping of bacterial molecular hydrogen metabolism contributes to the outgrowth of commensal E. coli during gut inflammation
- Department of Microbiology, UT Southwestern, United States
- Departamento de Clinica e Cirurgia Veterinarias, Escola de Veterinaria, Universidade Federal de Minas Gerais, Brazil
- Department of Immunology, UT Southwestern, United States
Figures
Figure 1 with 1 supplement
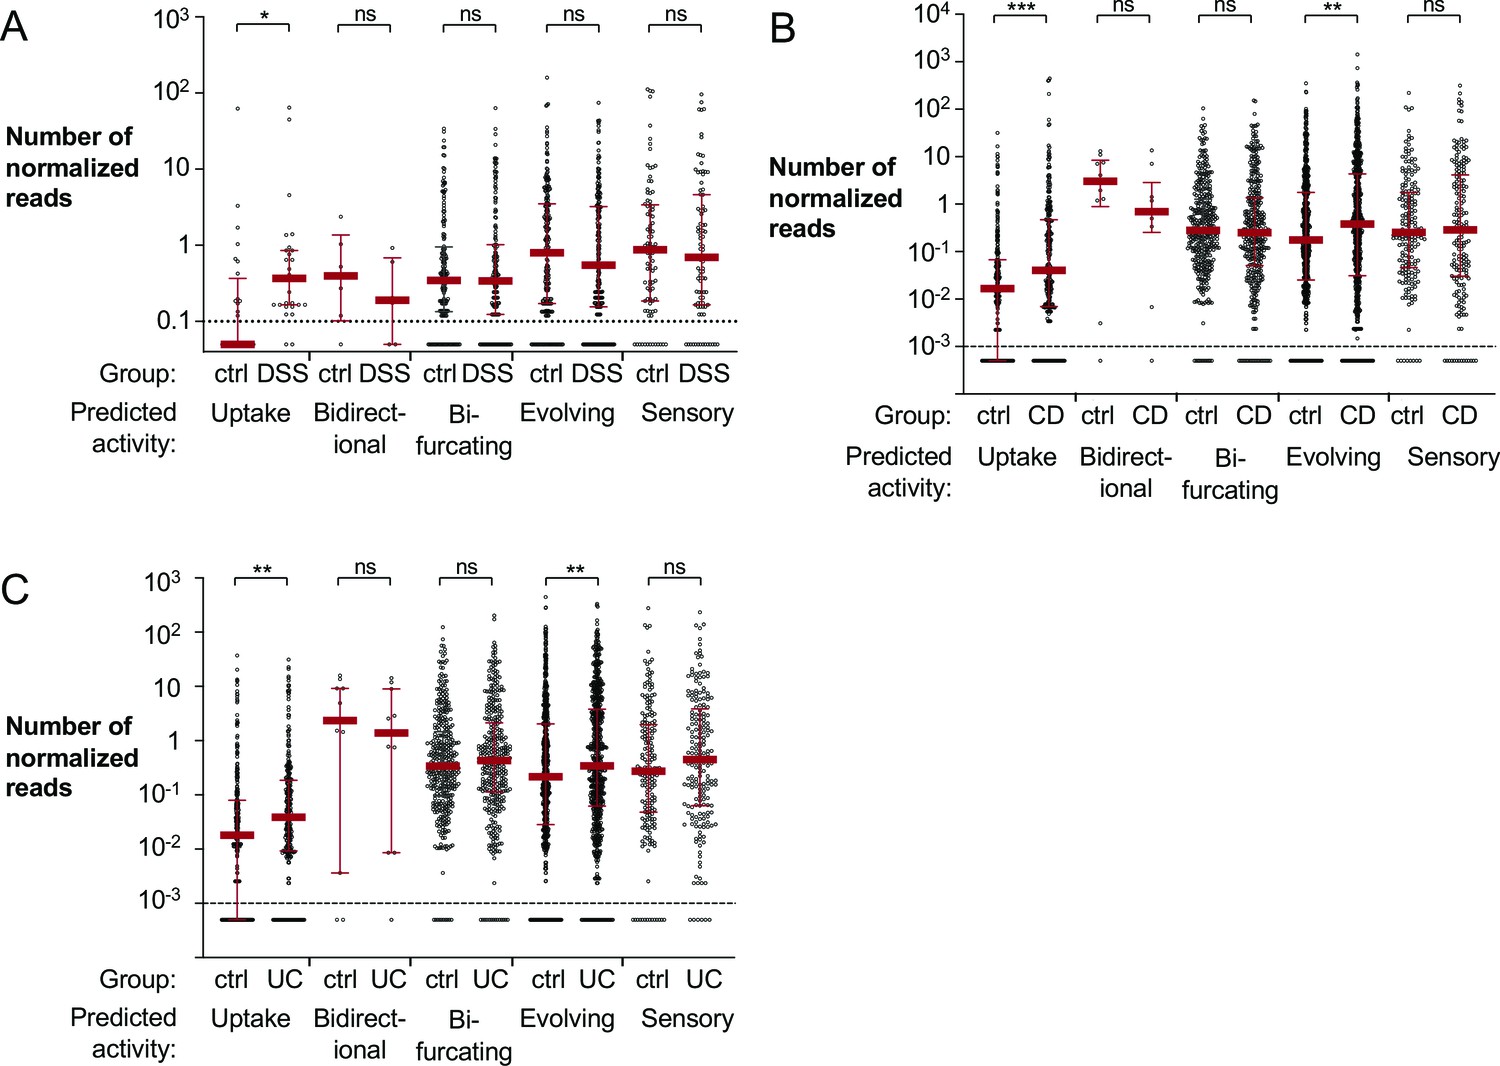
Mapping of metagenomic sequencing data from murine cecal samples and human stool to bacterial hydrogenases.
(A) Shotgun metagenomic sequencing of mock or dextran sulfate sodium (DSS)-treated mice with endogenous Enterobacteriaceae (obtained from Charles River) was previously performed to generate the analyzed dataset (ENA accession number PRJEB15095; Hughes, 2017). Reads were aligned to the HydDB hydrogenase database (Søndergaard et al., 2016) and segregated based on predicted hydrogenase activity. Each symbol corresponds to the average number of normalized reads that map to a specific sequence in the mock or DSS-treated animals (six mice per group). Averages equal to zero were assigned a value of 0.05. (B, C) Analysis of a previously published metagenomic sequencing dataset from stool samples collected from non-inflammatory bowel disease (IBD) controls and patients with Crohn’s disease or ulcerative colitis (SRA BioProject number PRJNA400072; Franzosa, 2019). Reads from non-IBD controls (55 samples) and patients with Crohn’s disease (87 samples) (B) or ulcerative colitis (76 samples) (C) were aligned to the HydDB hydrogenase database of predicted hydrogenase activities (Søndergaard et al., 2016). Each symbol corresponds to the average number of normalized reads that map to a specific hydrogenase sequence. Averages equal to zero were assigned a value of 0.0005. Medians are labeled with a red solid line, and error bars correspond to interquartile ranges. Statistical significance was determined by Bonferroni-corrected Mann–Whitney U-test (*p<0.05; **p<0.01, ***p<0.001; ns: not statistically significant). See also Figure 1—figure supplement 1, a Figure 1—source data 1, Figure 1—source data 2, and Figure 1—source data 3.
-
Figure 1—source data 1
Mapping of metagenomic sequencing of murine cecal content to hydrogenases.
- https://cdn.elifesciences.org/articles/58609/elife-58609-fig1-data1-v1.xlsx
-
Figure 1—source data 2
Mapping of metagenomic sequencing of non-inflammatory bowel disease controls and patients with Crohn’s disease to hydrogenases.
- https://cdn.elifesciences.org/articles/58609/elife-58609-fig1-data2-v1.xlsx
-
Figure 1—source data 3
Mapping of metagenomic sequencing of non-inflammatory bowel disease controls and patients with ulcerative colitis to hydrogenases.
- https://cdn.elifesciences.org/articles/58609/elife-58609-fig1-data3-v1.xlsx
Figure 1—figure supplement 1
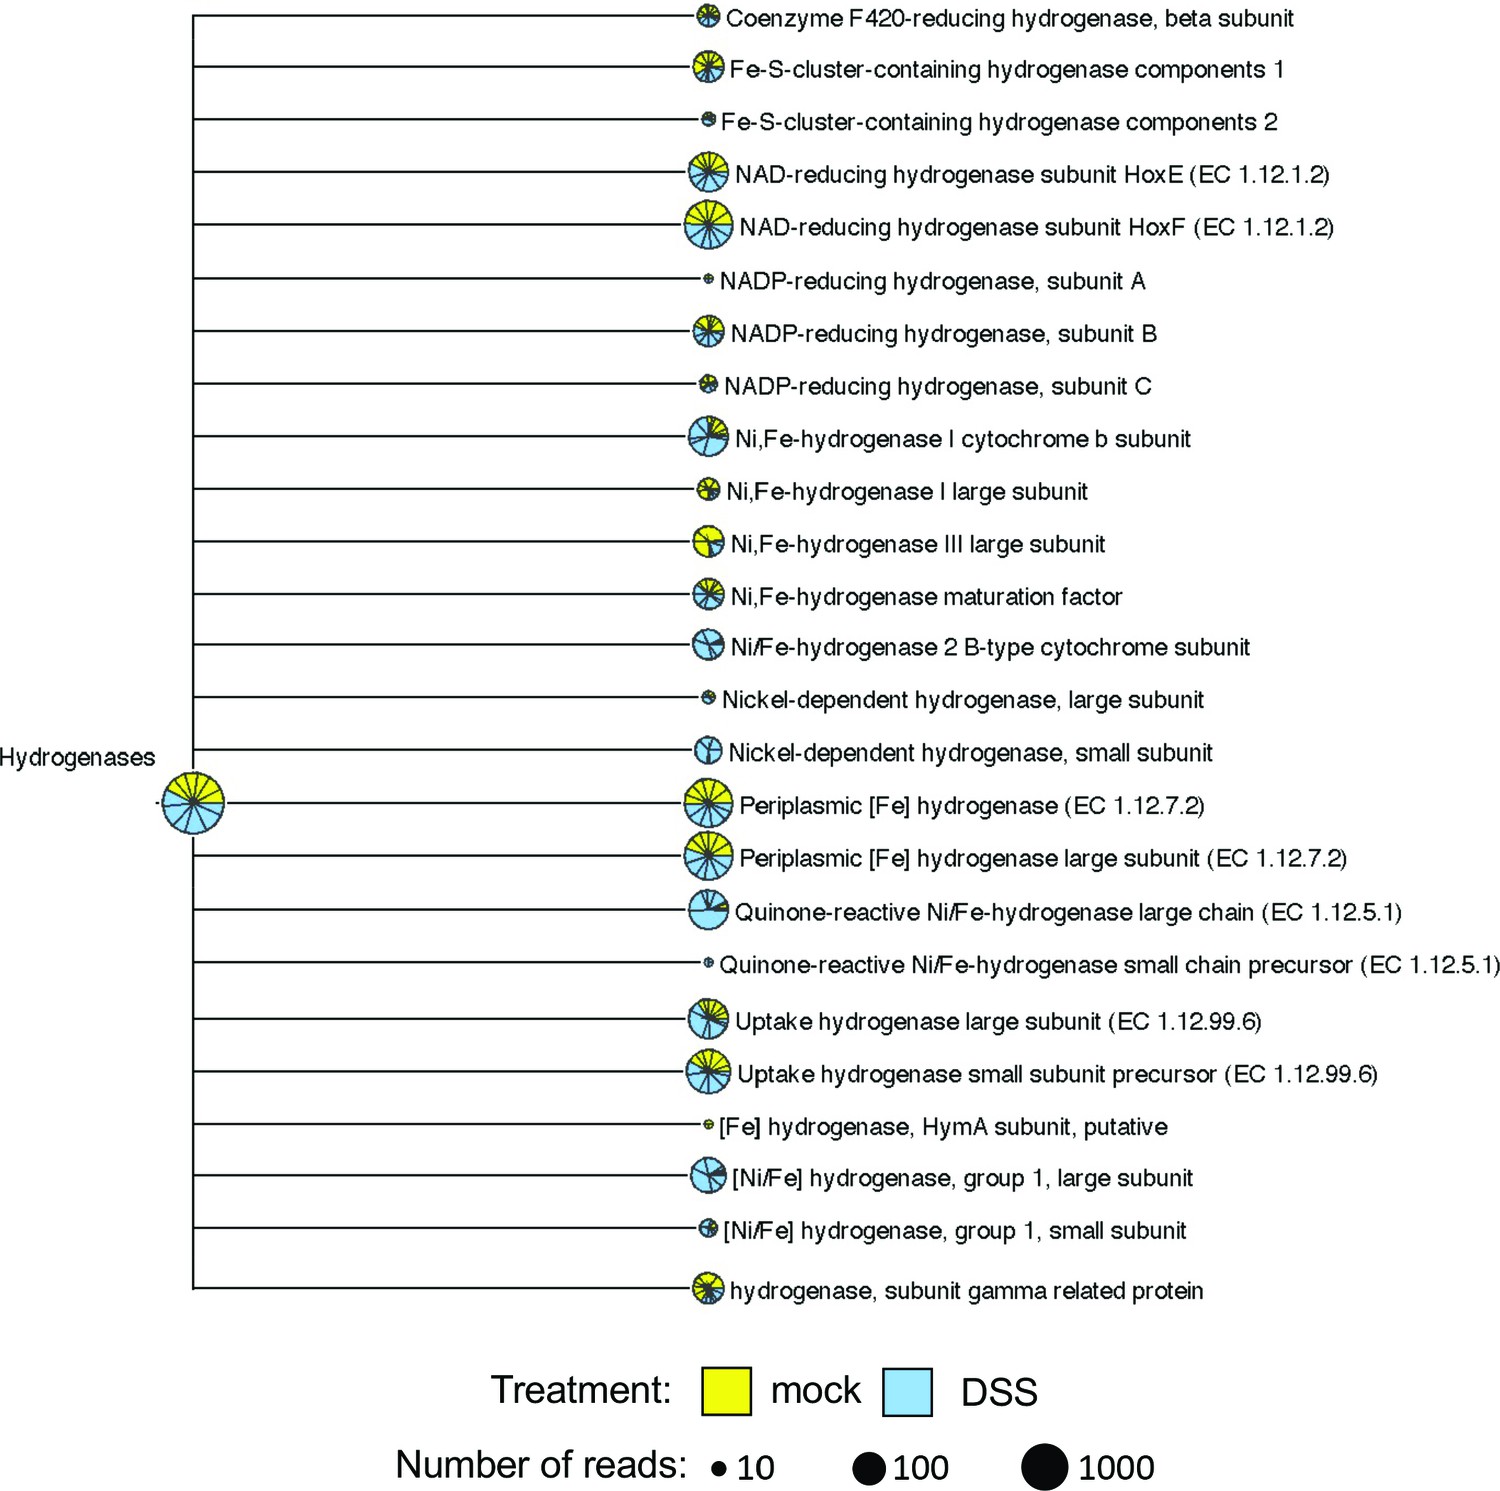
Shotgun metagenomic sequence analysis of the cecal microbiota in the dextran sulfate sodium (DSS) colitis model.
Shotgun metagenomic sequencing of mock or DSS-treated mice with endogenous Enterobacteriaceae (from Charles River) was previously performed to generate the dataset used for analysis in this figure (ENA accession number PRJEB15095; Hughes, 2017). Reads were assigned to functional categories based on the SEED algorithm (MEGAN5). Spuriously assigned reads (one read only present in one sample) were removed from this representation. The size of the circle charts is proportional to the number of reads. Each slice of the circle charts represents one animal, with mock-treated animals in yellow and DSS-treated animals in blue.
Figure 2 with 2 supplements
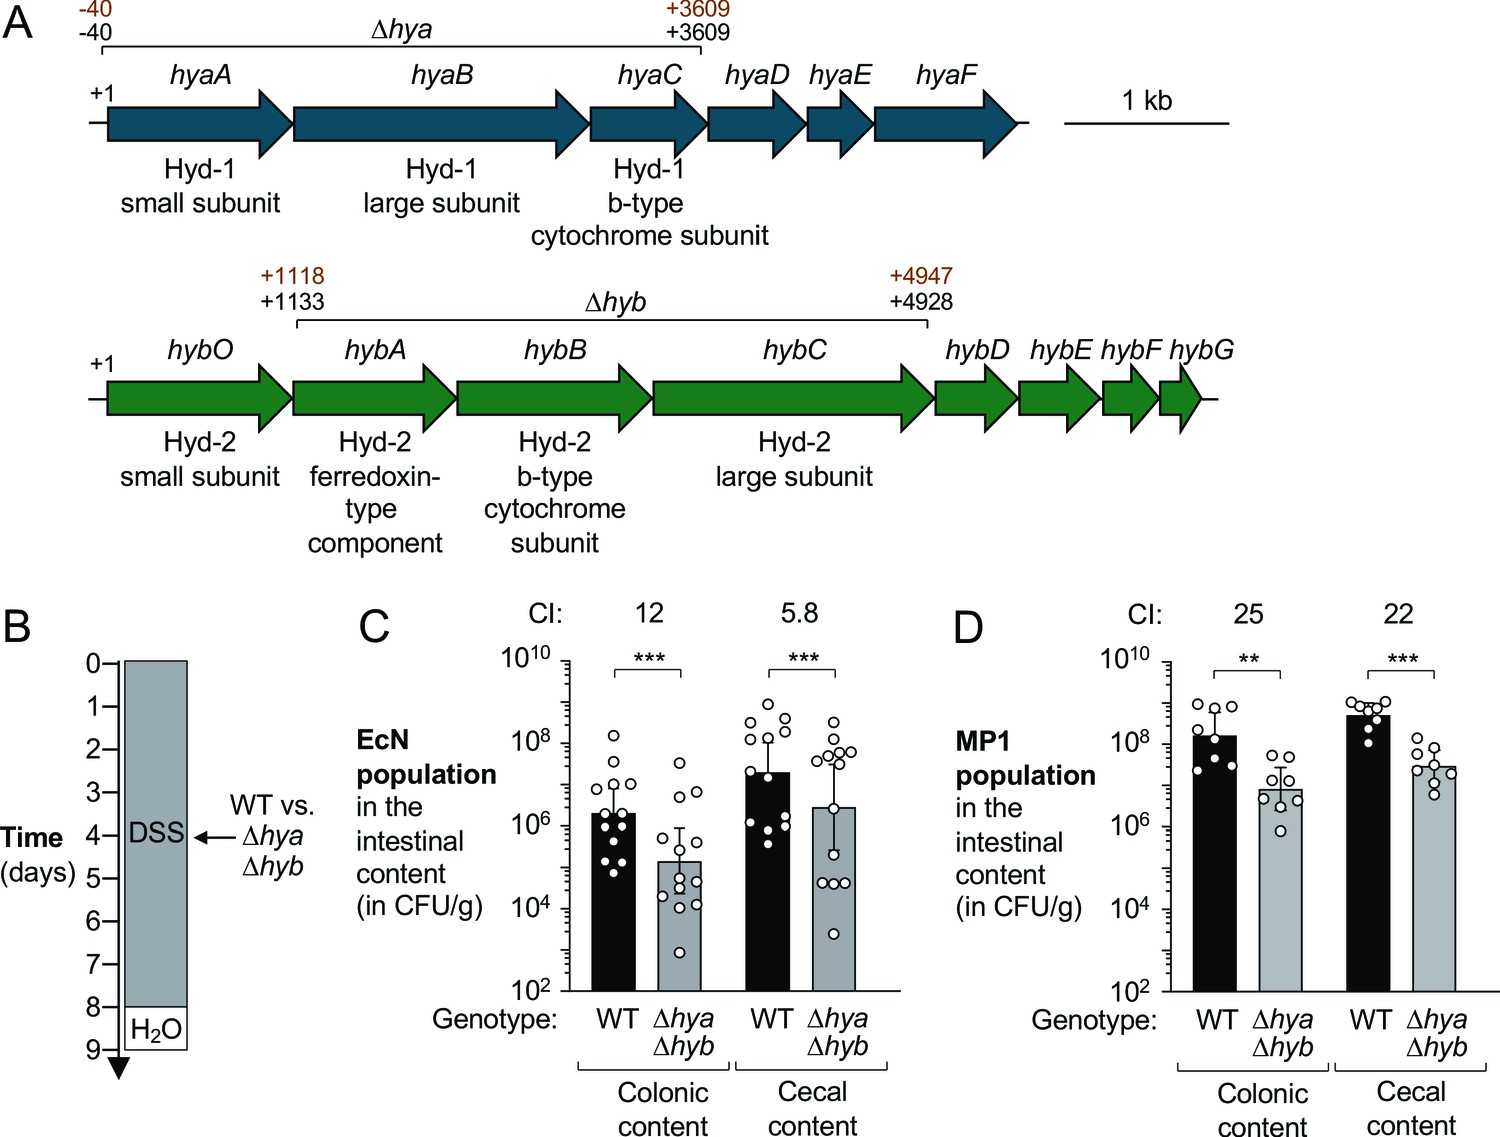
Hydrogenases provide a competitive fitness advantage for E. coli during acute colitis.
(A) Schematic representation of the hydrogenase-1 and hydrogenase-2 encoding gene loci in E. coli Nissle 1917 (EcN) and MP1. The DNA regions that were removed from the Δhya and Δhyb mutants in EcN and MP1 are indicated in black (EcN) and brown (MP1), respectively. (B–D) Groups of wild-type (WT) male (C, D) and female (D) C57BL/6 mice devoid of native Enterobacteriaceae were treated with 3% dextran sulfate sodium (DSS) in the drinking water. Mice were orally inoculated with a 1:1 ratio of the WT strain and an isogenic Δhya Δhyb mutant on day 4 of DSS treatment. (B) Schematic representation of the colitis model. (C, D) Intestinal content was collected on day 9 to determine the abundance of the EcN (C) or MP1 (D) WT strain (black bars) or isogenic Δhya Δhyb mutant (gray bars). The competitive index (CI) is indicated above each set of bars. Each symbol corresponds to one mouse. Bars represent geometric means ± 95% confidence intervals. Statistical significance was determined by paired Student’s t-test of the log-transformed data (**p<0.01; ***p<0.001). See also Figure 2—figure supplement 1 and 2.
Figure 2—figure supplement 1
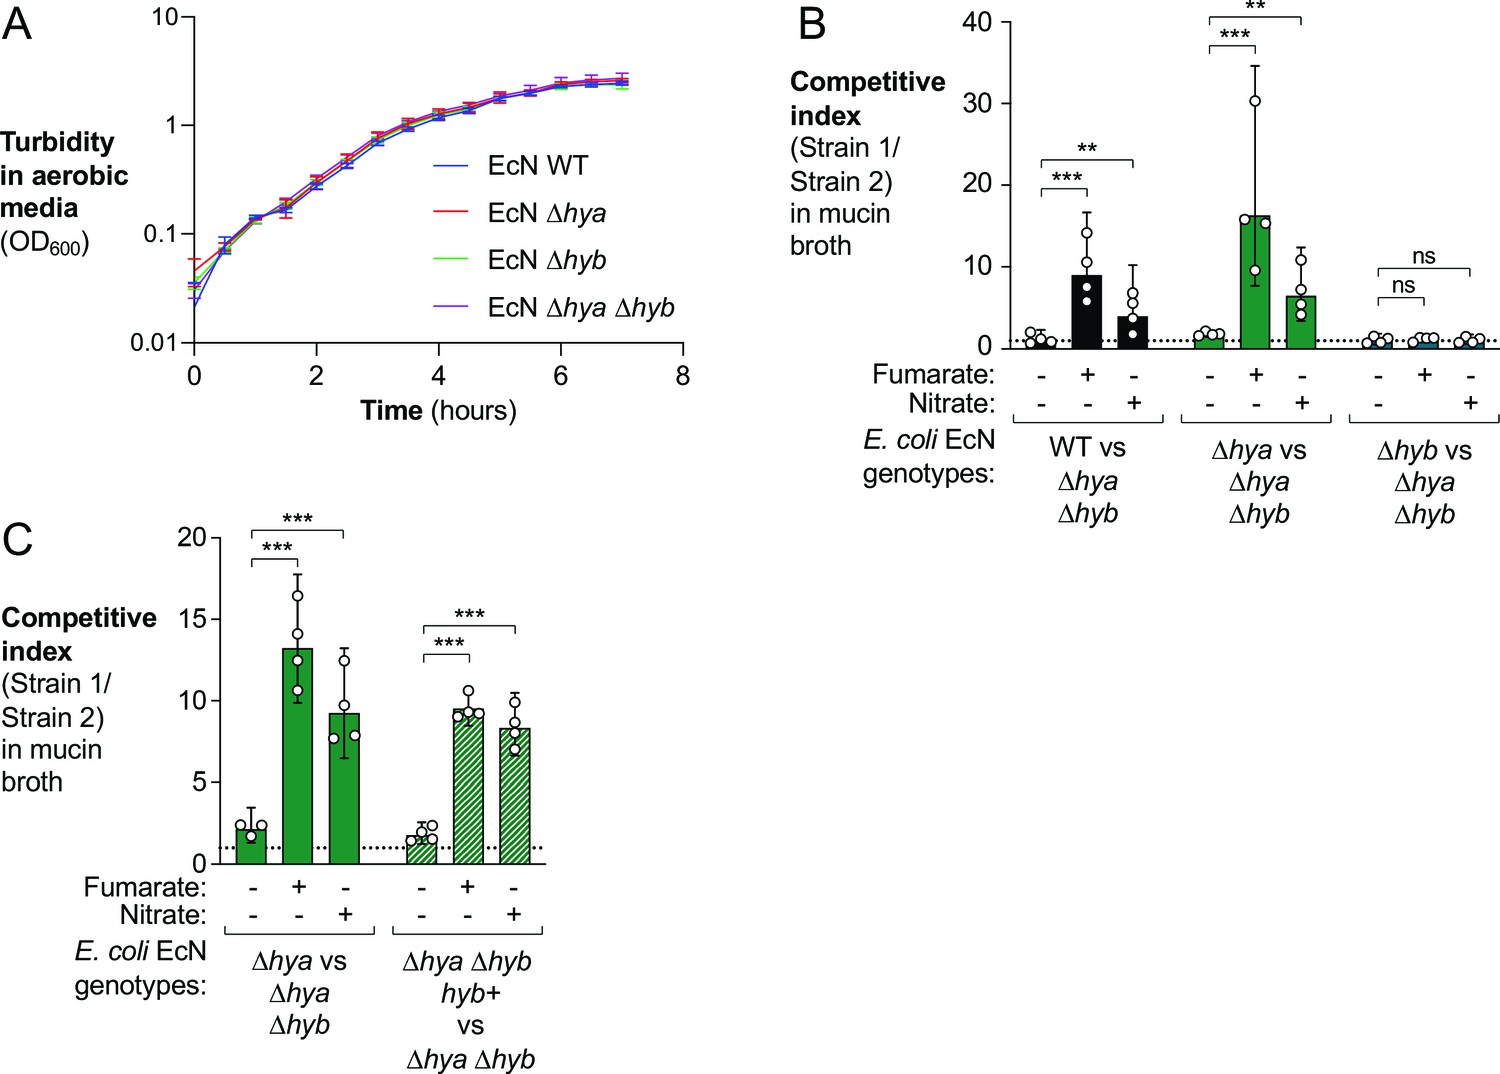
In vitro analysis of E. coli wild-type (WT) and hydrogenase-deficient mutant strains.
(A) Aerobic growth of the indicated E. coli Nissle 1917 (EcN) strains in M9 minimal media supplemented with glucose. Data points correspond to averages ± standard deviation of three biological replicates. (B, C) Mucin broth alone or supplemented with the electron acceptors fumarate (25 mM) or nitrate (40 mM) was inoculated with an equal mixture of the indicated EcN strains. Cultures were incubated anaerobically, in the presence of 5% H2, for 18 hr, and the competitive index was determined. Each symbol corresponds to a biological replicate. Bars represent geometric means ± 95% confidence intervals. Statistical significance was determined for each set of competition experiments using ANOVA with Dunnett’s multiple comparisons test of the log-transformed data (**p<0.01, ***p<0.001; ns: not statistically significant).
Figure 2—figure supplement 2
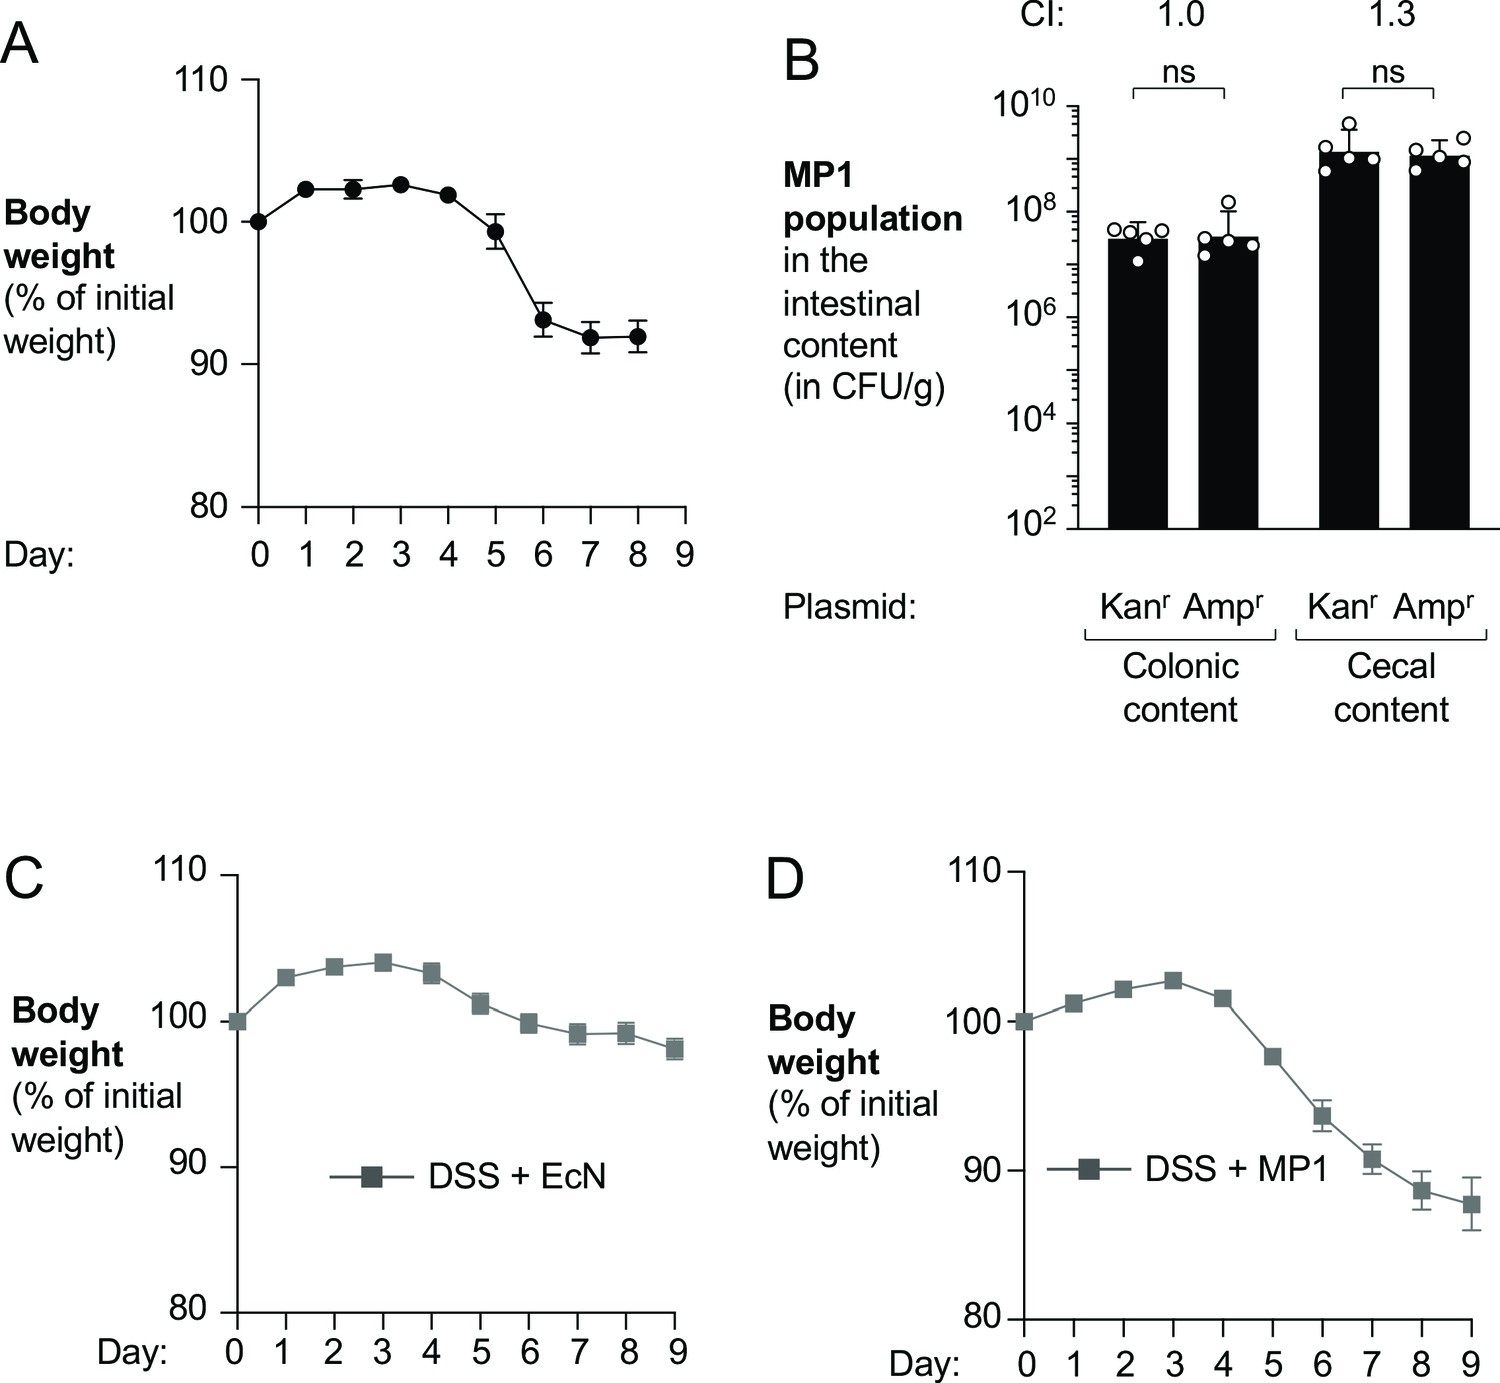
Assessment of bacterial fitness in the murine intestinal lumen.
(A, B) Wild-type (WT) male C57BL/6 mice received 3% dextran sulfate sodium (DSS) in the drinking water to induce colitis. On day 4 of DSS treatment, mice were orally inoculated with a 1:1 ratio of WT E. coli MP1 carrying the pWSK129 plasmid (Kanr) or the pWSK29 (Ampr/Carbr) plasmid. After 5 days of colonization, mice were euthanized. (A) Mouse body weights. Data points represent geometric means ± standard error. (B) At the end of the experiment, the abundance of the two E. coli strains was determined by plating intestinal content on LB agar containing Kan or Carb. The competitive index (CI) is displayed above each set of bars. Each symbol corresponds to one mouse. Bars represent geometric means ± 95% confidence intervals. Statistical significance was determined by paired Student’s t-test of the log-transformed data (ns: not statistically significant). (C, D) Mouse body weights were measured for the experiments described in Figure 2C and D. Briefly, groups of WT C57BL/6 mice were treated with 3% DSS in the drinking water and orally inoculated with a 1:1 ratio of the WT strain and an isogenic Δhya Δhyb mutant. Mice were colonized with E. coli Nissle 1917 (EcN) strains (C) or with MP1 strains (D). Data points represent geometric means ± standard error.
Figure 3
Hydrogenases enhance growth of E. coli in a colitis model.
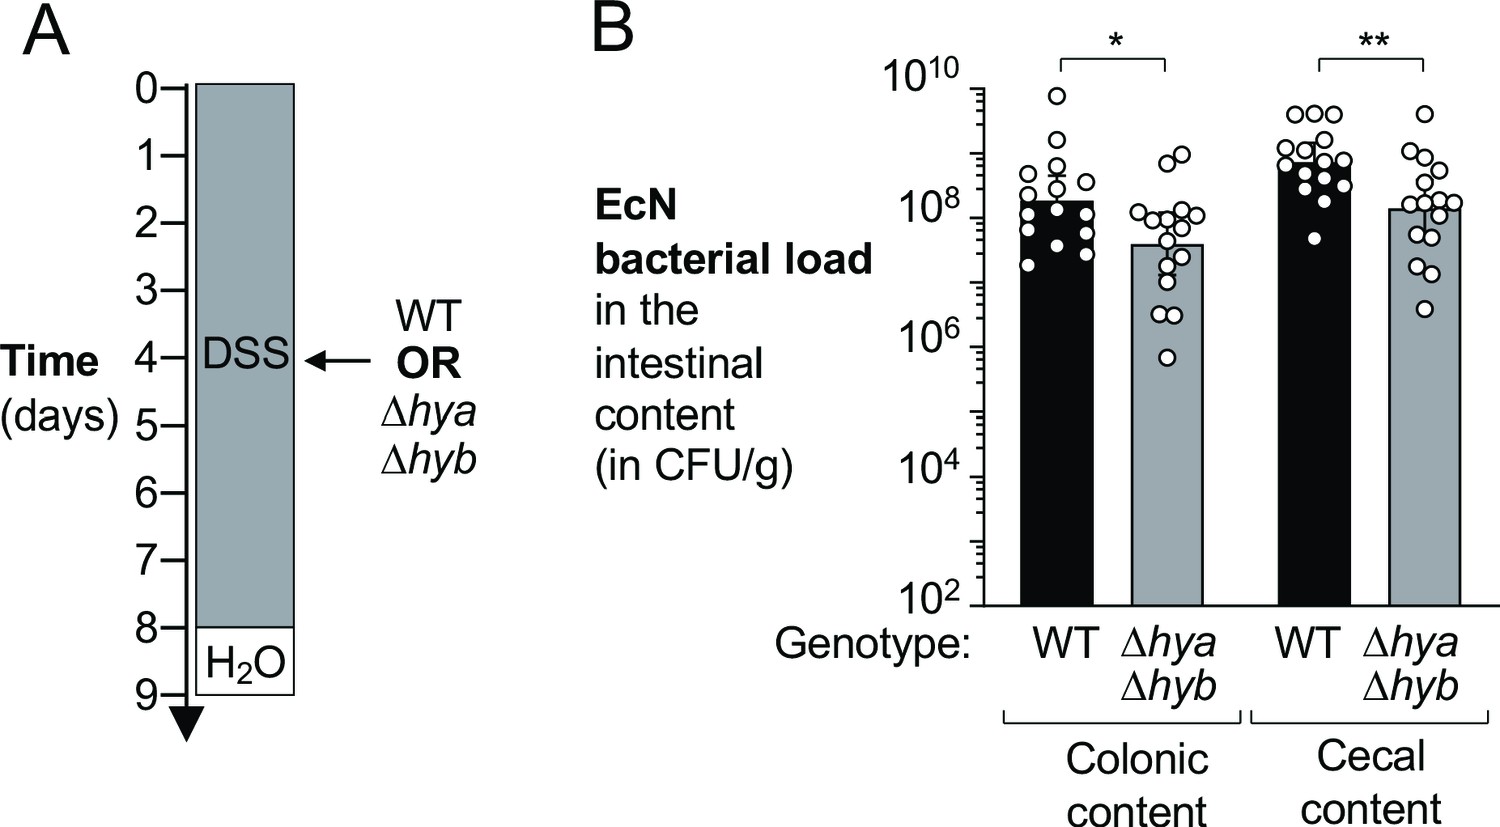
Wild-type (WT) female C57BL/6 mice were treated with 3% dextran sulfate sodium (DSS) in the drinking water to induce colitis. On day 4 of DSS treatment, mice were orally inoculated with either the WT E. coli Nissle 1917 (EcN) strain or the isogenic Δhya Δhyb mutant strain. (A) Schematic representation of the experiment. (B) Intestinal content was collected 9 days later to determine the abundance of E. coli in the colon and cecum. Each symbol corresponds to the E. coli bacterial abundance in one mouse. Bars represent geometric means ± 95% confidence intervals. Black bars, WT. Gray bars, Δhya Δhyb mutant. Statistical significance was determined by unpaired Student’s t-test of the log-transformed data (*p<0.05; **p<0.01).
Figure 4

Hydrogenases contribute to expansion of E. coli in the inflamed gut.
Groups of wild-type (WT) male C57BL/6 mice were orally inoculated with a 1:1 ratio of the E. coli MP1 WT strain and the isogenic Δhya Δhyb mutant. On the same day as the oral inoculation, mice received water or 3% dextran sulfate sodium (DSS) in the drinking water. (A) Schematic representation of experiment. (B) Mouse body weights. Data points represent geometric means ± standard error (mock-treated, black circles; DSS-treated, gray squares). (C) Hematoxylin and eosin-stained colonic and cecal sections were scored by a veterinary pathologist for submucosal edema (light gray bars), immune infiltration by polymorphonuclear cells (PMN) (dark gray bars), epithelial damage (medium gray bars), and exudate (black bars). Bars for each histopathology category correspond to the average per group. (D, E) The abundance of each strain was determined in the colonic (D) and cecal (E) content (WT strain, black bars; Δhya Δhyb mutant, gray bars). The competitive index (CI) is indicated above the sets of DSS-treated bars. Each symbol corresponds to one mouse. Dashed line corresponds to the limit of detection. Samples with values below the limit of detection were assigned a value of 10 CFU/g. Bars represent geometric means ± 95% confidence intervals. Statistical significance was determined by paired Student’s t-test of the log-transformed data (***p<0.001).
Figure 5 with 4 supplements
Hydrogenase-dependent fitness of E. coli correlates with intestinal inflammation.
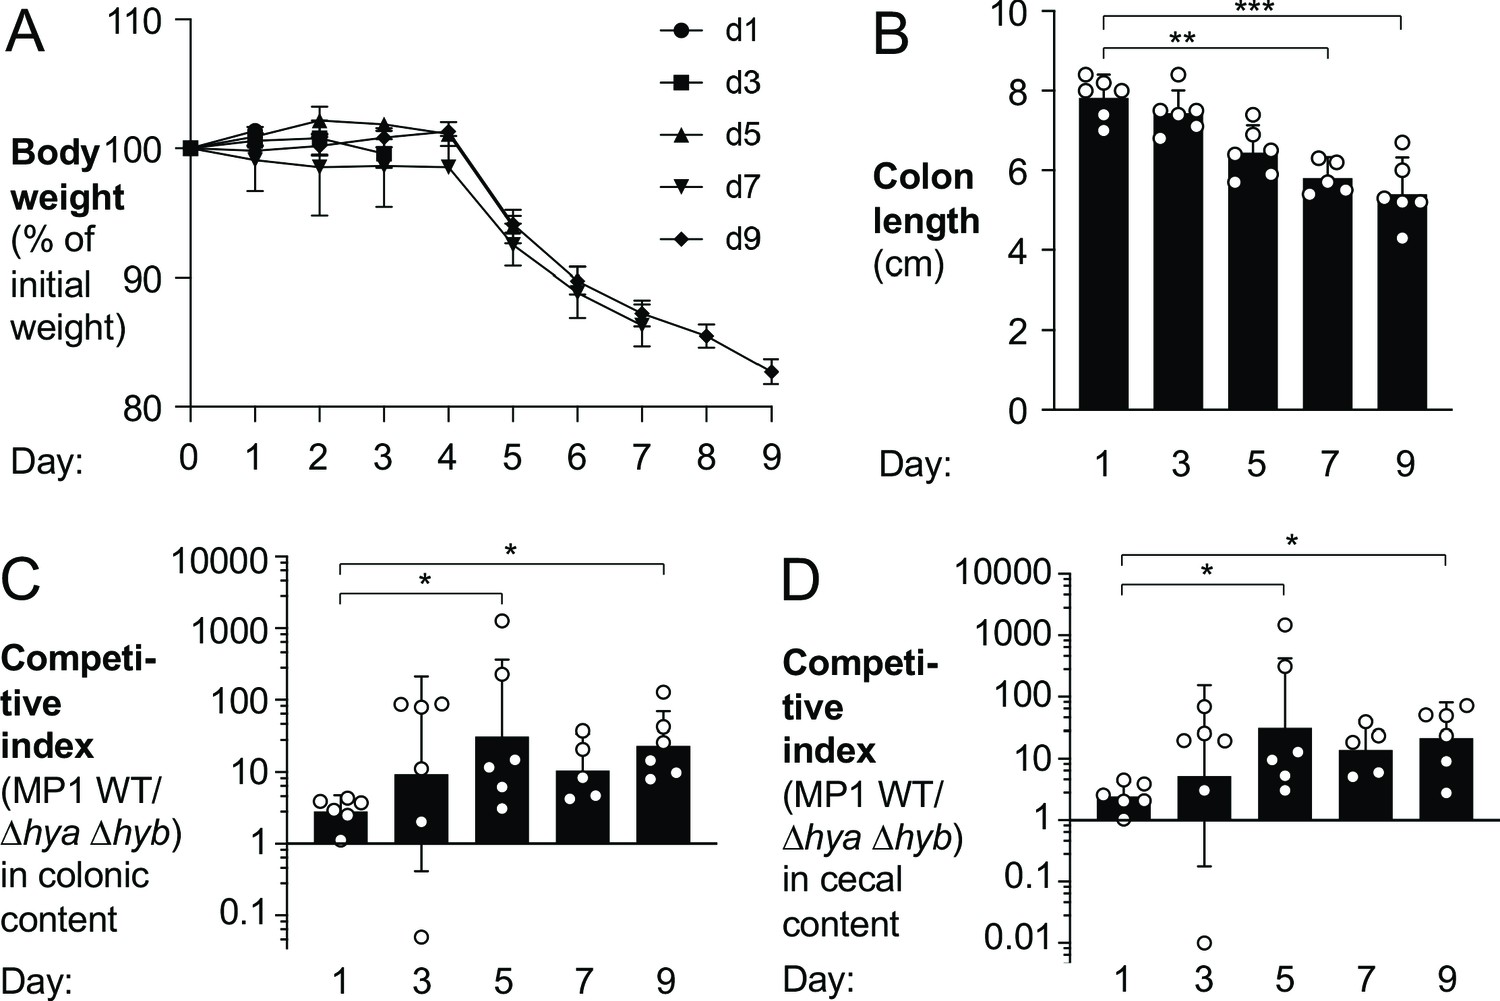
Groups of wild-type (WT) male (2–3 per group) and female (3–4 per group) C57BL/6 mice were orally inoculated with a 1:1 ratio of the E. coli MP1 WT strain and the isogenic Δhya Δhyb mutant. On the same day as the oral inoculation, mice received 3% dextran sulfate sodium in the drinking water. Groups of mice were euthanized on days 1, 3, 5, 7, and 9 after inoculation. (A) Mouse body weights. Data points represent geometric means ± standard error. (B) Colon lengths. Each symbol corresponds to data from one mouse. Bars represent geometric means ± 95% confidence intervals. (C, D) The competitive indices of the WT strain and the Δhya Δhyb mutant in the colonic (C) and cecal (D) contents were determined. Each symbol corresponds to one mouse. Bars represent geometric means ± 95% confidence intervals. Statistical significance was determined by the Kruskal–Wallis test with Dunn’s post hoc multiple analyses test (*p<0.05; **p<0.01; ***p<0.001). See also Figure 5—figure supplements 1–4.
Figure 5—figure supplement 1
Expression of pro-inflammatory markers in time-course experiment.
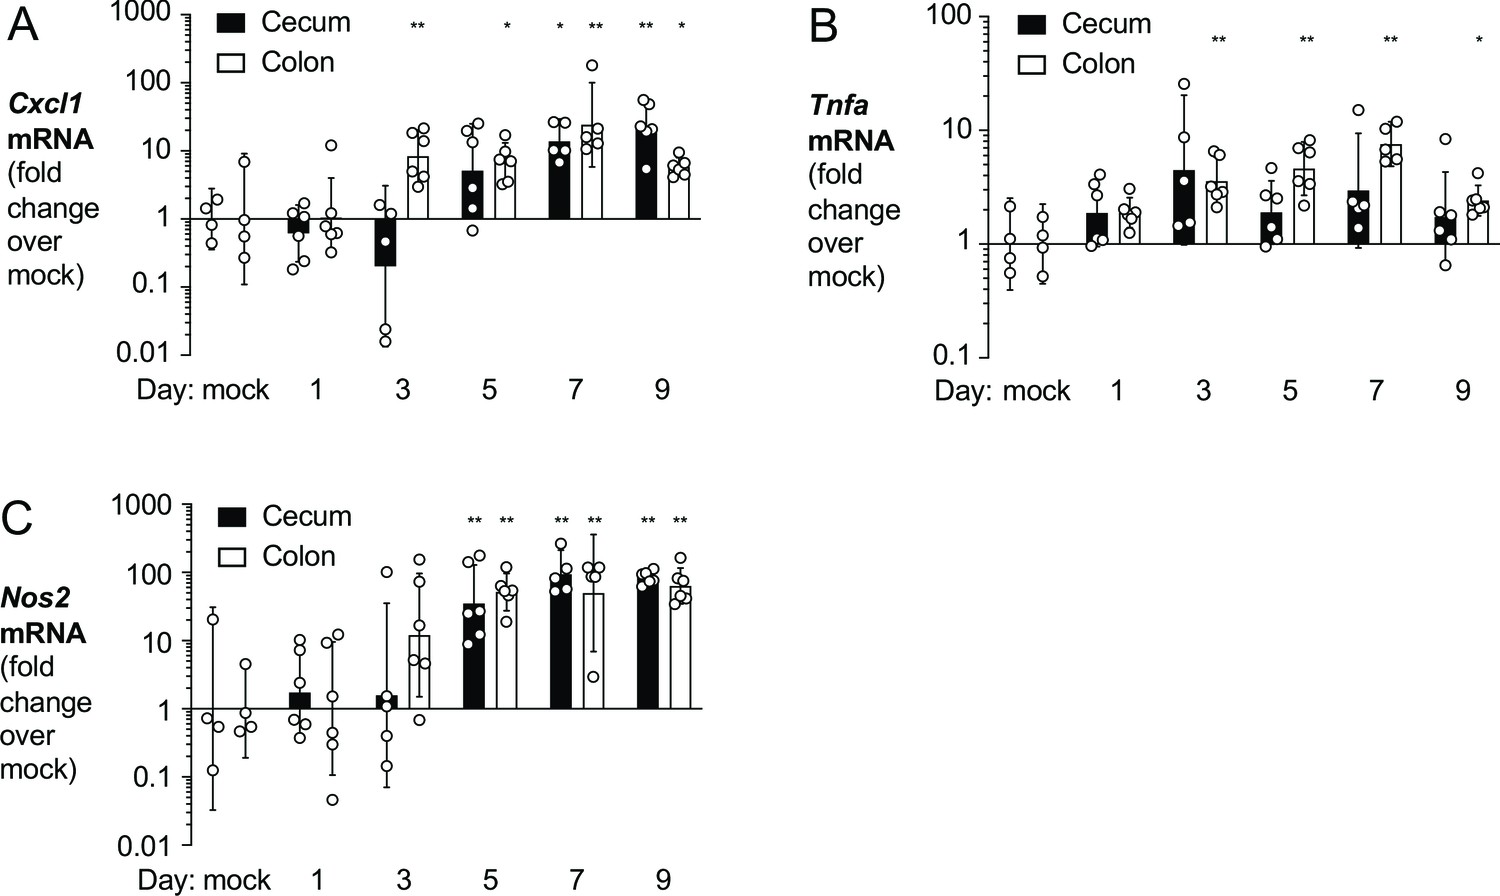
For the experiment described in Figure 5, mRNA levels of pro-inflammatory markers in cecal and colonic tissue were determined by RT-qPCR. Levels of Cxcl1 (KC), TNF-α, and iNOS, encoded by Cxcl1 (A), Tnfa (B), and Nos2 (C), respectively, were determined. Briefly, groups of wild-type (WT) C57BL/6 mice were orally inoculated with a 1:1 ratio of the E. coli MP1 WT strain and the isogenic Δhya Δhyb mutant and treated with 3% dextran sulfate sodium in the drinking water. Tissue samples were collected from euthanized mice 1, 3, 5, 7, and 9 days post inoculation. Tissue samples from untreated healthy WT male (N = 2) and female (N = 2) C57BL/6 mice were also collected and analyzed (mock). Samples lacking detectable transcripts were excluded from analysis. Each symbol corresponds to one mouse. Bars represent geometric means ± 95% confidence intervals. Statistical significance was determined by a one-way ANOVA with Dunnett’s multiple comparisons (*p<0.05; **p<0.01; ***p<0.001).
Figure 5—figure supplement 2
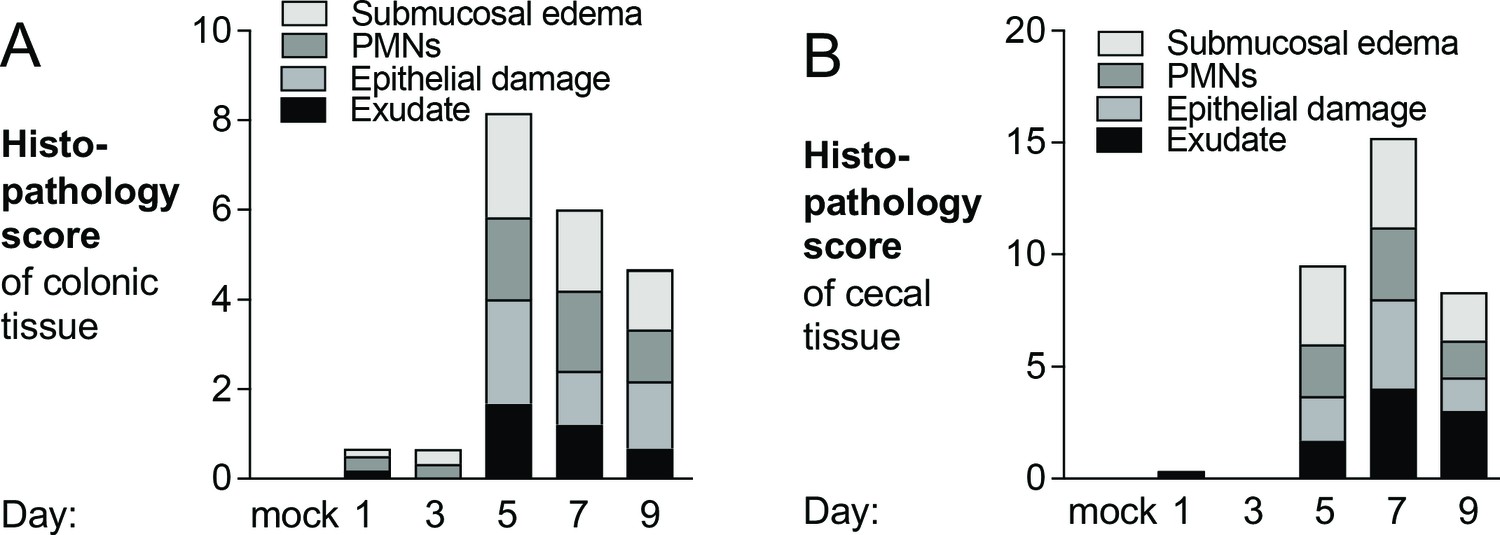
Development of pathological lesions during dextran sulfate sodium treatment.
(A, B) Hematoxylin and eosin-stained colonic (A) and cecal (B) tissue, obtained from the experiment shown in Figure 5, were scored by a veterinary pathologist for submucosal edema (light gray bars), immune infiltration by polymorphonuclear cells (PMNs) (dark gray bars), epithelial damage (medium gray bars), and exudate (black bars). Tissue samples from the healthy C57BL/6 mice shown in Figure 5—figure supplement 1 were also collected and analyzed (mock). Bars for each histopathology category correspond to the average per group.
Figure 5—figure supplement 3
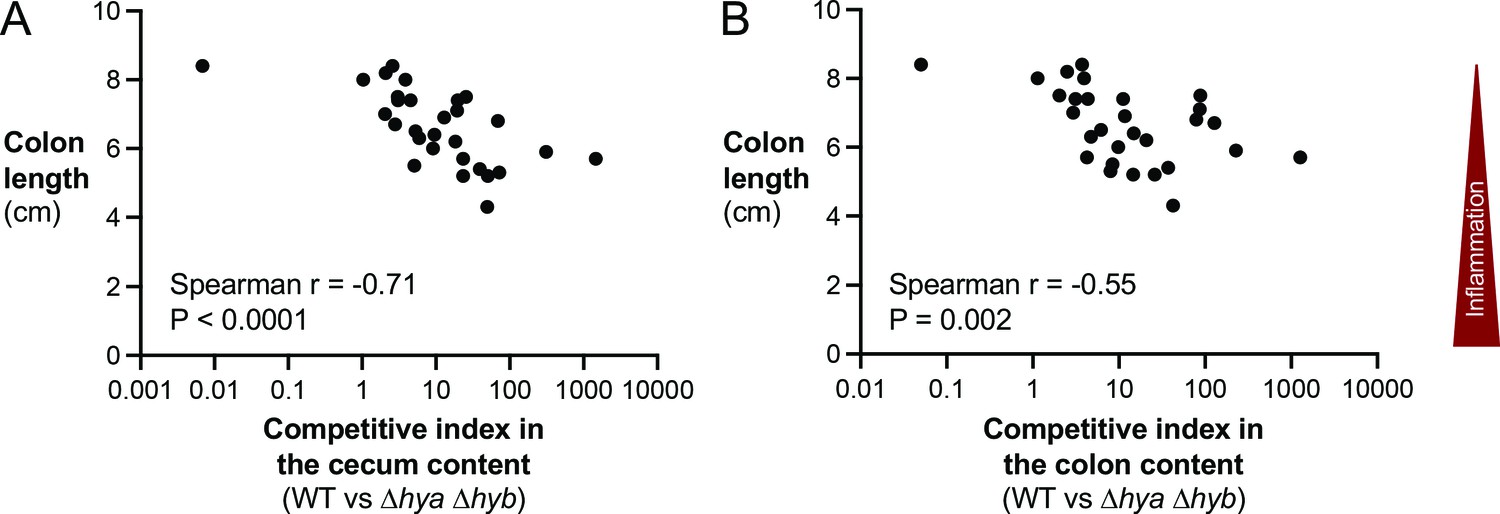
Hydrogenase-dependent competitive fitness of E. coli correlates with colon length.
(A, B) The competitive indices in the cecal (A) and colonic (B) content of the mice shown in Figure 5 were compared to the respective colon lengths of each mouse. Each symbol corresponds to one mouse. Statistical correlation was determined via Spearman correlation.
Figure 5—figure supplement 4
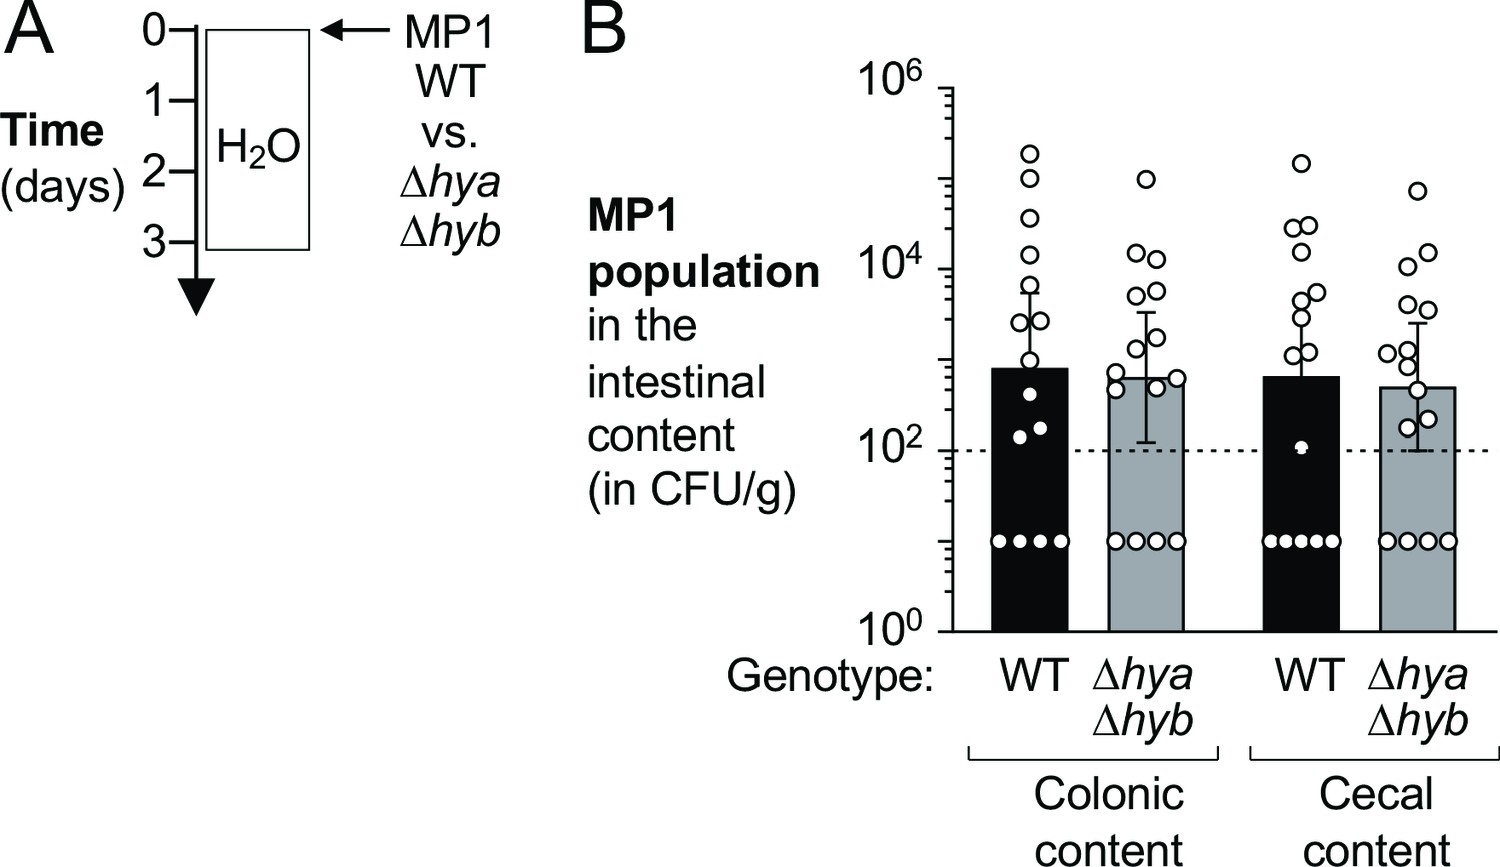
Hydrogenases do not provide a competitive fitness advantage to E. coli in healthy mice colonized for 3 days.
Wild-type (WT) male and female C57BL/6 mice were orally inoculated with a 1:1 ratio of the E. coli MP1 WT strain and the isogenic Δhya Δhyb mutant. (A) Schematic representation of experiment. (B) The abundance of each strain was determined in the colonic and cecal content (WT strain, WT, black bars; Δhya Δhyb strain, gray bars) 3 days after inoculation. Each symbol corresponds to one mouse. Dashed line corresponds to the limit of detection. Samples with values below the limit of detection were assigned a value of 10 CFU/g. Bars represent geometric means ± 95% confidence intervals.
Figure 6
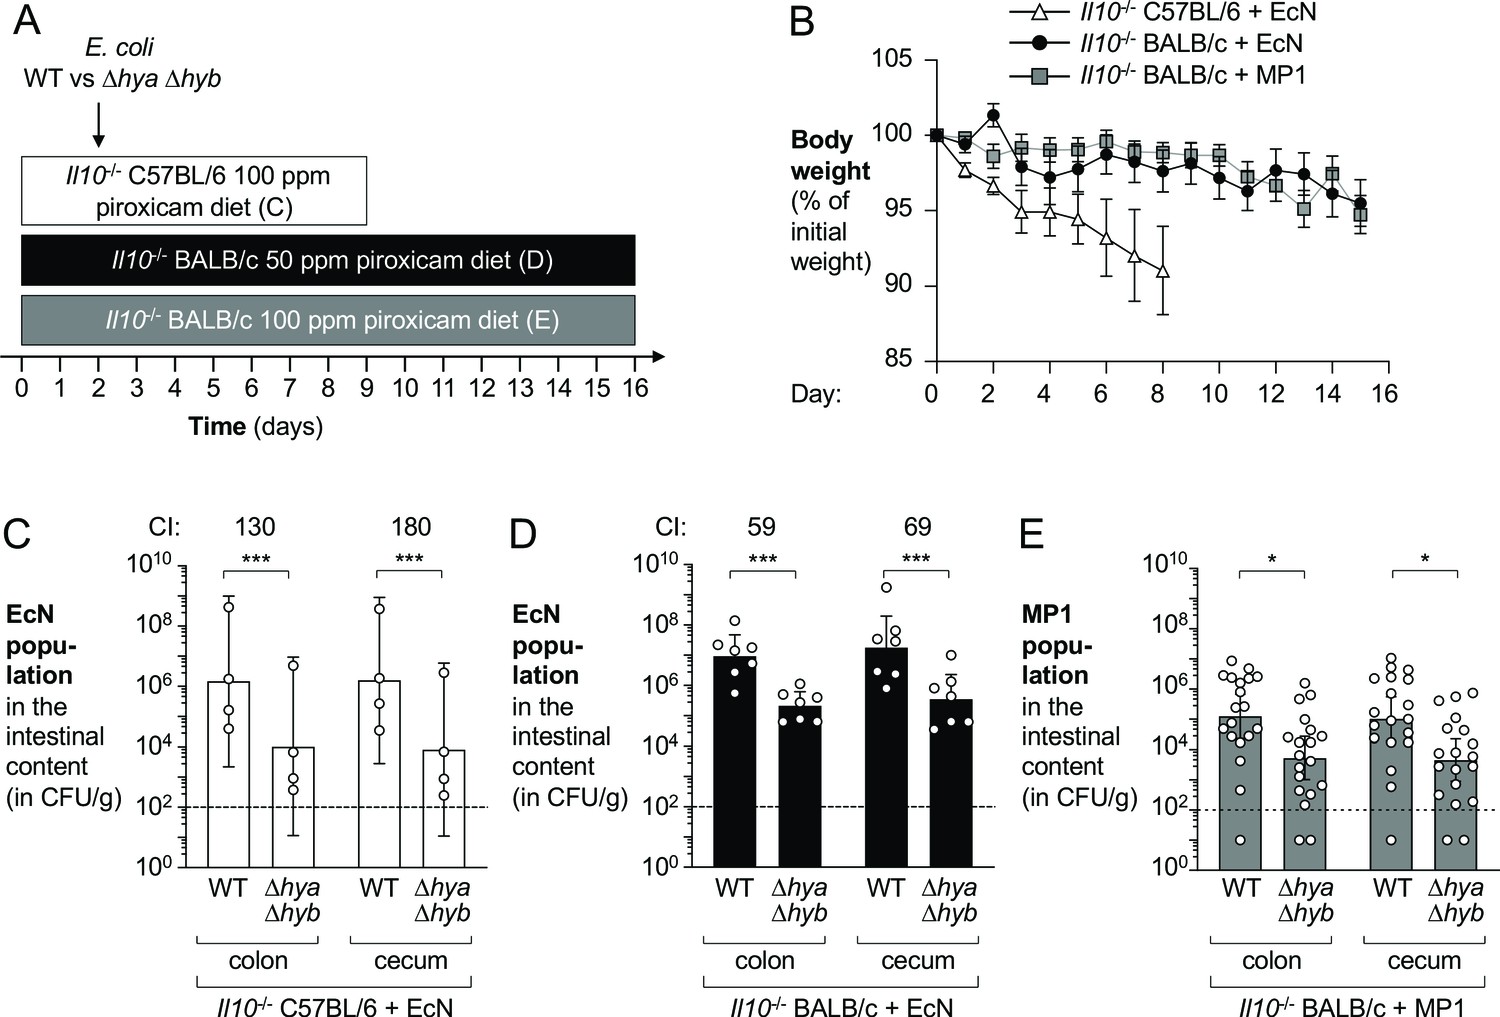
Hydrogenases promote fitness of E. coli in piroxicam-accelerated Il10-/- colitis models.
Groups of Il10-/- C57BL/6 and Il10-/- BALB/c mice received piroxicam-fortified diet. Mice were orally inoculated with a 1:1 ratio of the E. coli wild-type (WT) strain and the isogenic Δhya Δhyb mutant on day 2 of piroxicam treatment. Nissle 1917 (EcN) and MP1 strains of E. coli were used. (A) Schematic representations of colitis models. (B) Body weights. Data points represent geometric means ± standard error (EcN-colonized Il10-/- C57BL/6, white triangles; EcN-colonized Il10-/- BALB/c, black circles; MP1-colonized Il10-/- BALB/c, gray squares). Four mice were excluded from analysis of the MP1-colonized Il10-/- BALB/c mice on days 11–12 as the body weights of those mice were not available. (C) Abundance of the EcN WT strain and the Δhya Δhyb strain in the intestinal content of piroxicam-treated Il10-/- male C57BL/6. (D) Abundance of the EcN WT strain and the Δhya Δhyb strain in the intestinal content of piroxicam-treated Il10-/- male BALB/c mice. (E) Abundance of the MP1 WT strain and the Δhya Δhyb mutant in the intestinal content of piroxicam-treated Il10-/- male and female BALB/c. (C–E) CI: competitive index. Each symbol corresponds to one mouse. Dashed line corresponds to the limit of detection. Samples with values below the limit of detection were assigned a value of 10 CFU/g. Bars represent geometric means ± 95% confidence intervals. Statistical significance was determined by paired Student’s t-test of the log-transformed data (*p<0.05; ***p<0.001).
Figure 7 with 1 supplement
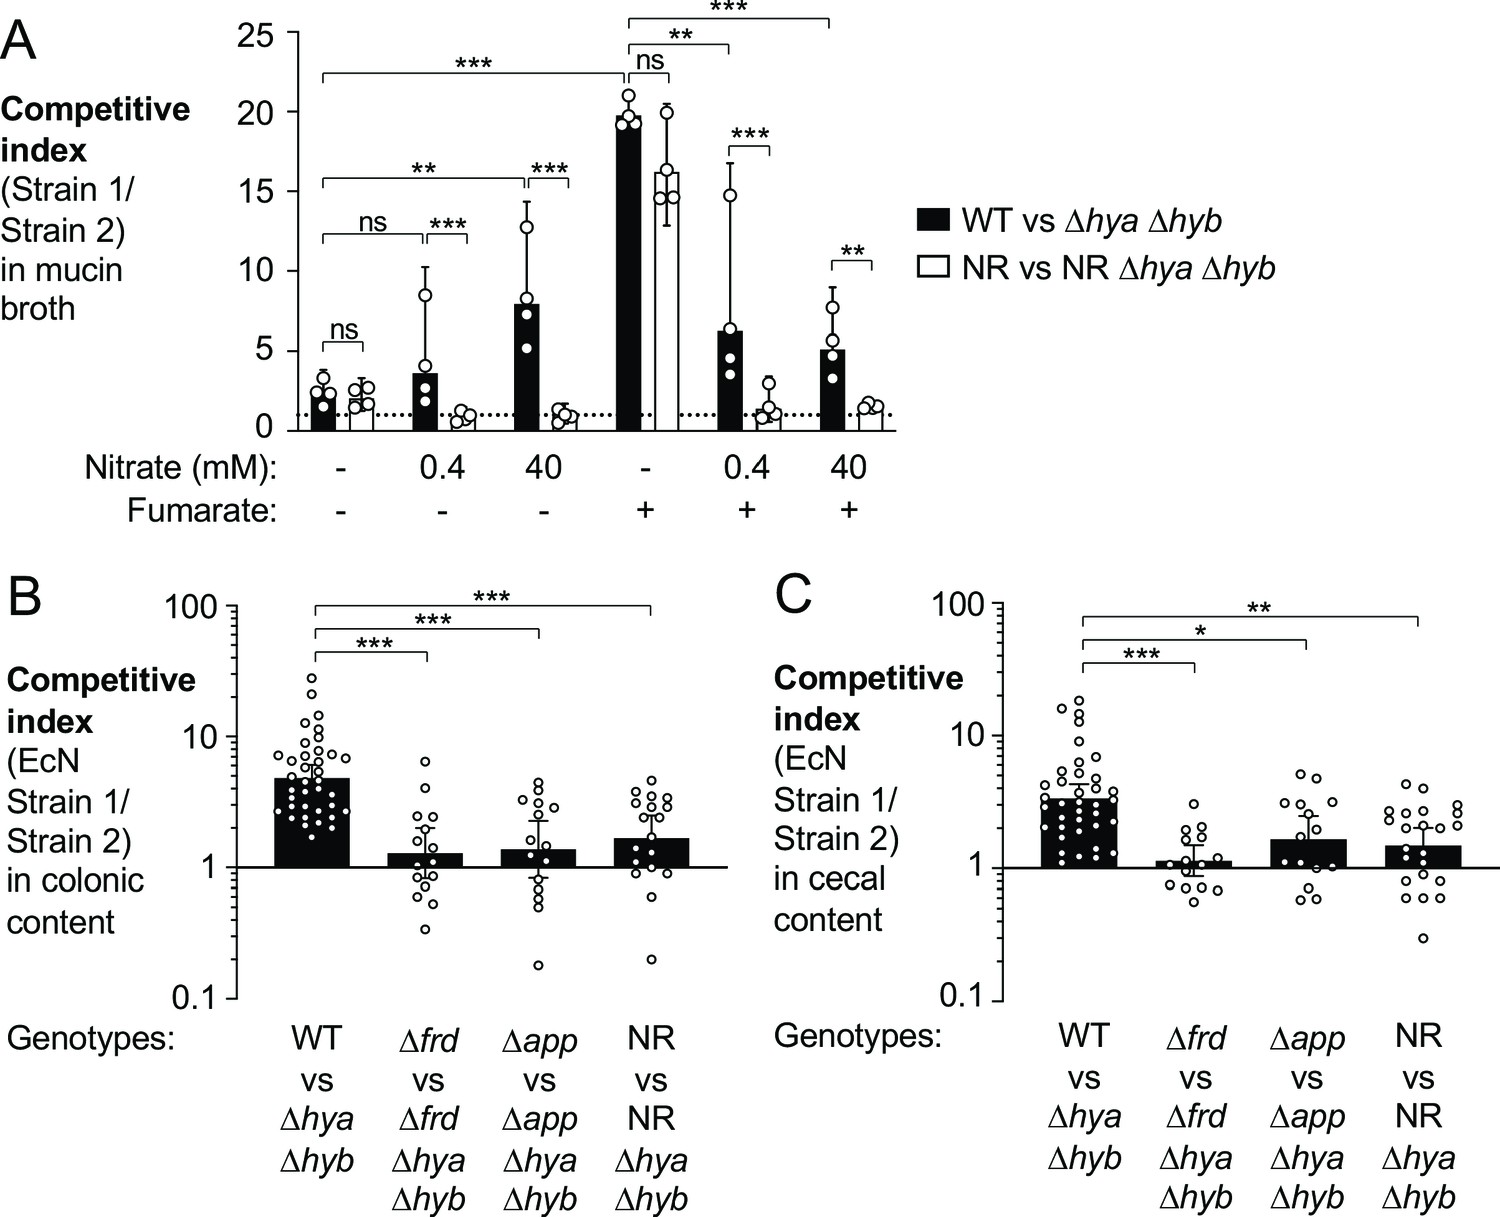
Utilization of various electron acceptors facilitates hydrogenase-dependent competitive outgrowth of E. coli.
(A) Mucin broth supplemented with or without the electron acceptors fumarate (25 mM) and nitrate (0.4 mM or 40 mM) was inoculated with an equal mixture of the indicated EcN strains. Cultures were incubated anaerobically, in the presence of 5% H2, for 18 hr and the competitive index was determined. Each symbol corresponds to a biological replicate. Bars represent geometric means ± 95% confidence intervals. WT: wild-type strain; NR: narG narZ napA mutant. Statistical significance was determined for the indicated comparisons using ANOVA with Sidak’s multiple comparisons test of the log-transformed data (**p<0.01, ***p<0.001; ns: not statistically significant). (B, C) Groups of WT male and female C57BL/6 mice were treated with 3% dextran sulfate sodium (DSS) in the drinking water. Mice were orally inoculated with a 1:1 ratio of the indicated E. coli Nissle 1917 (EcN) strains on day 4 of DSS treatment. Colonic (B) and cecal (C) content was collected after 9 days of DSS treatment to determine the competitive indices. Each symbol corresponds to one mouse. Bars represent geometric means ± 95% confidence intervals. Statistical significance was determined by the Kruskal–Wallis test with Dunn’s post hoc multiple analyses test (*p<0.05; **p<0.01; ***p<0.001). See also Figure 7—figure supplement 1.
Figure 7—figure supplement 1
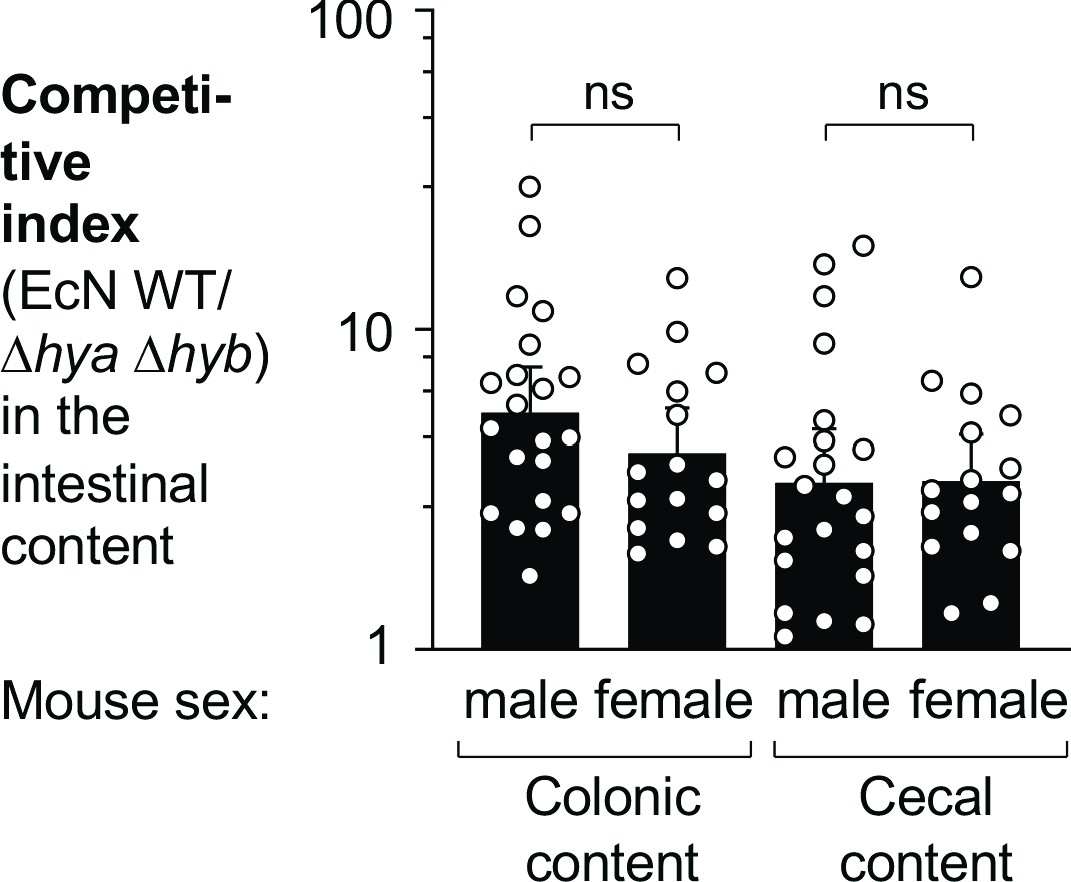
Hydrogenases confer a competitive fitness advantage to E. coli during colitis, independent of mouse sex.
The same data as shown in Figure 7B–C (wild-type [WT] vs. Δhya Δhyb) is shown here, stratified based on mouse sex. Briefly, WT C57BL/6 mice were treated with 3% dextran sulfate sodium (DSS) in the drinking water and orally inoculated with a 1:1 ratio of the E. coli Nissle 1917 (EcN) WT strain and the Δhya Δhyb mutant on day 4 of DSS treatment. Colonic and cecal content was collected after 9 days of DSS treatment to determine the competitive indices. Each symbol corresponds to one mouse. Bars represent geometric means ± 95% confidence intervals. Statistical significance was determined by unpaired Student’s t-test of the log-transformed data (ns: not statistically significant).
Figure 8
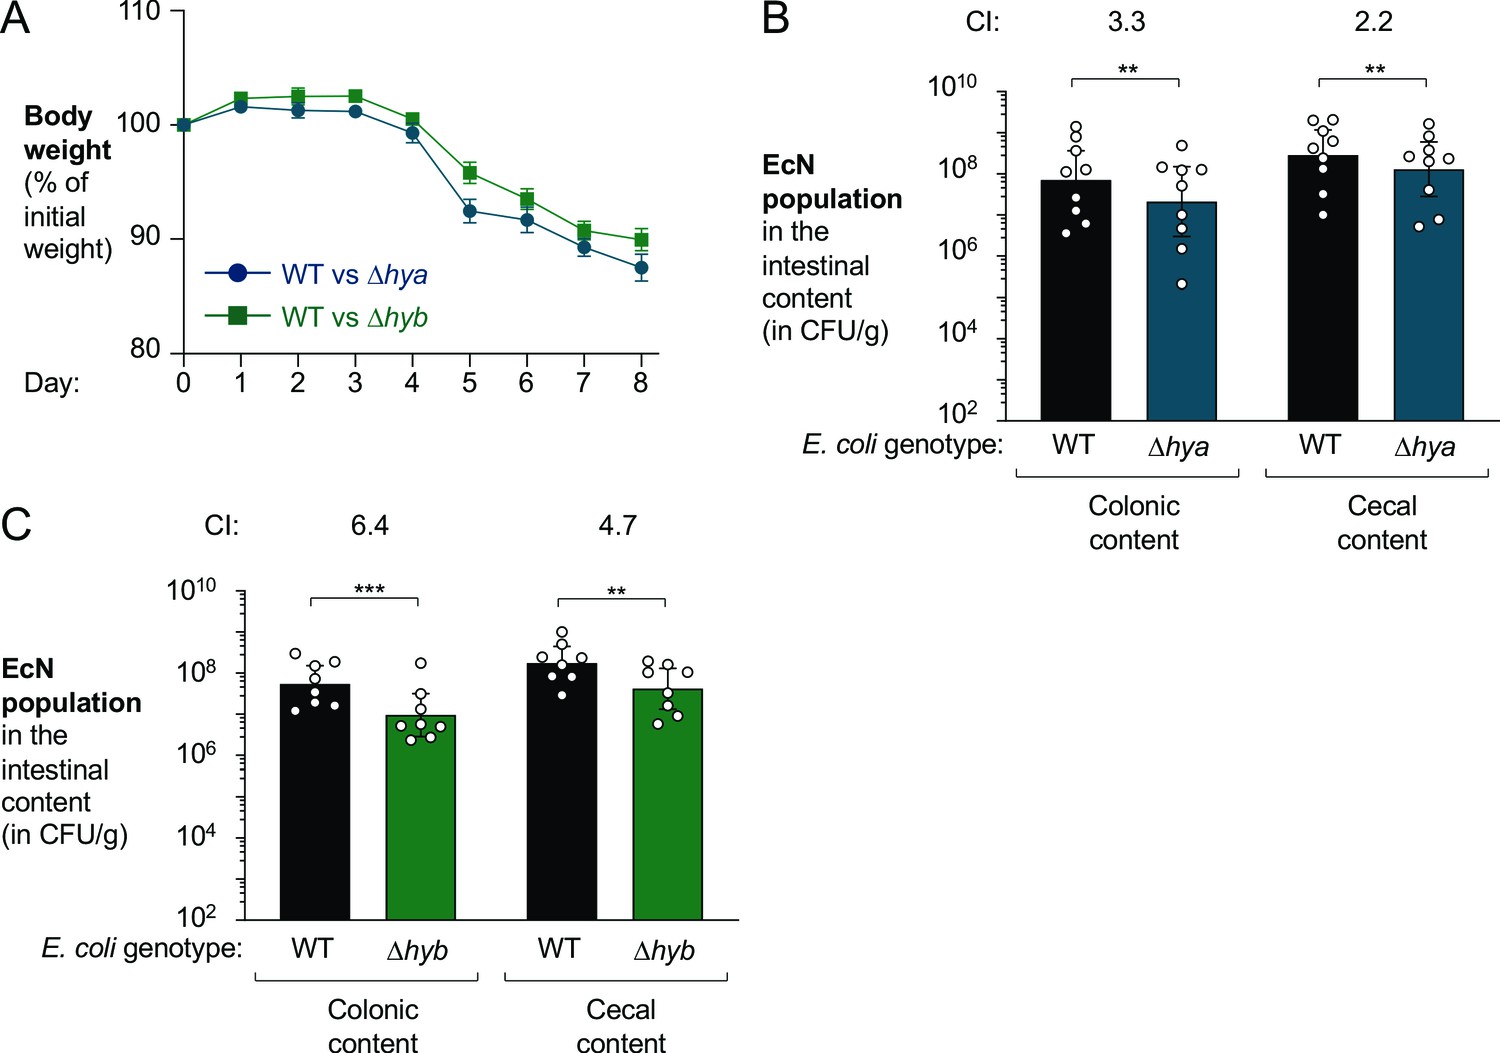
Both hya and hyb enhance fitness of E. coli Nissle 1917 in the inflamed gut.
Groups of male (3–4 per group) and female (5 per group) wild-type (WT) C57BL/6 mice received 3% dextran sulfate sodium (DSS) in the drinking water. After 4 days of DSS treatment, the mice were orally inoculated with a 1:1 ratio of the WT E. coli Nissle 1917 strain and the indicated isogenic mutants. (A) Mouse body weights. Data points represent geometric means ± standard error. (B) Abundance of the WT strain (black bars) and the isogenic Hyd-1 mutant (Δhya mutant; blue bars) in the intestinal content. (C) Abundance of the WT strain (black bars) and the isogenic Hyd-2 mutant (Δhyb mutant; green bars) in the intestinal content. (B, C) The competitive index (CI) is indicated above each set of bars. Each symbol corresponds to one mouse. Bars represent geometric means ± 95% confidence intervals. Statistical significance was determined by paired Student’s t-test of the log-transformed data (**p<0.01; ***p<0.001).
Figure 9

Graphical representation of findings.
During inflammation, E. coli couples oxidation of molecular hydrogen via hydrogenase-1 (Hyd-1) and hydrogenase-2 (Hyd-2) to the reduction of oxygen, nitrate, and fumarate. Inflammatory reactive oxygen species (ROS) and reactive nitrogen species (RNS) leaking into the gut lumen allow for AppBCX (App)-mediated oxygen respiration and nitrate respiration (NR). Frd: fumarate reductase.
Tables
<bold>Appendix 1—key resources table</bold>
| Reagent type (species) or resource | Designation | Source or reference | Identifiers | Additional information |
|---|---|---|---|---|
| Strain, strain background (Mus musculus) | C57BL/6 | Jackson Laboratory or bred at UT Southwestern (originally from Jackson Laboratory) | Jackson Laboratory Cat# 000664 | Wild-type |
| Genetic reagent (M. musculus) | Il10-/- C57BL/6 | Bred at UT Southwestern (originally from Jackson Laboratory) | Jackson Laboratory Cat# 002251 | B6.129P2-Il10tm1Cgn/J |
| Genetic reagent (M. musculus) | Il10-/- BALB/c | Bred at UT Southwestern (originally from Jackson Laboratory) | Jackson Laboratory Cat# 004333 | C.129P2(B6)-Il10tm1Cgn/J |
| Strain, strain background (Escherichia coli) | Nissle 1917 (EcN) | Grozdanov, 2004 | Wild-type strain (O6:K5:H1) | |
| Strain, strain background (E. coli) | S17-1 λpir | Simon et al., 1983 | zxx::RP4 2-(Tetr::Mu) (Kanr::Tn7) λpir | |
| Genetic reagent (E. coli) | EL5 | This study; Winter lab, UT Southwestern | EcN ΔhyaABC | |
| Genetic reagent (E. coli) | EL11 | This study; Winter lab, UT Southwestern | EcN ΔhybABC | |
| Genetic reagent (E. coli) | EL15 | This study; Winter lab, UT Southwestern | EcN ΔhyaABC ΔhybABC | |
| Genetic reagent (E. coli) | EL252 | This study; Winter lab, UT Southwestern | MP1 ΔhyaABC | |
| Genetic reagent (E. coli) | EL276 | This study; Winter lab, UT Southwestern | MP1 ΔhyaABC ΔhybABC | |
| Genetic reagent (E. coli) | EL284 | This study; Winter lab, UT Southwestern | EcNΔnarGΔnapAΔnarZΔhyaABC ΔhybABC | |
| Genetic reagent (E. coli) | EL347 | This study; Winter lab, UT Southwestern | EcNΔfrdABCD | |
| Genetic reagent (E. coli) | EL350 | This study; Winter lab, UT Southwestern | EcNΔfrdABCDΔhyaABC ΔhybABC | |
| Genetic reagent (E. coli) | EL363 | This study; Winter lab, UT Southwestern | EcNΔappCΔhyaABC ΔhybABC | |
| Genetic reagent (E. coli) | MW139 | Chanin, 2020 | EcNΔappC | |
| Genetic reagent (E. coli) | SW930 | Winter, 2013 | EcNΔnarGΔnapAΔnarZ | |
| Recombinant DNA reagent | pEL1 | This study; Winter lab, UT Southwestern | Upstream and downstream regions of EcN hyaABC in pRDH10 | |
| Recombinant DNA reagent | pEL2 | This study; Winter lab, UT Southwestern | Upstream and downstream regions of EcN hybABC in pRDH10 | |
| Recombinant DNA reagent | pEL29 | This study; Winter lab, UT Southwestern | Upstream and downstream regions of MP1 hyaABC in pGP706 | |
| Recombinant DNA reagent | pEL30 | This study; Winter lab, UT Southwestern | Upstream and downstream regions of MP1 hybABC in pGP706 | |
| Recombinant DNA reagent | pEL32 | This study; Winter lab, UT Southwestern | Promoter and coding sequence of EcN hybABC in pWSK129 | |
| Recombinant DNA reagent | pEL35 | This study; Winter lab, UT Southwestern | Upstream and downstream regions of EcN frdABCD in pGP706 | |
| Recombinant DNA reagent | pGP706 | Hughes, 2017 | ori(R6K) mobRP4 sacRB Kanr | |
| Recombinant DNA reagent | pRDH10 | Kingsley, 1999 | ori(R6K) mobRP4 sacRB Tetr Cmr | |
| Recombinant DNA reagent | pSW172 | Winter, 2013 | ori(R101) repA101ts Carbr | |
| Recombinant DNA reagent | pSW296 | Chanin, 2020 | Upstream and downstream regions of EcN appC in pRDH10 | |
| Recombinant DNA reagent | pWSK129 | Wang and Kushner, 1991 | ori(pSC101) Kanr | |
| Recombinant DNA reagent | pWSK29 | Wang and Kushner, 1991 | ori(pSC101) Carbr | |
| Sequence-based reagent | Primers used for mutagenesis | This study; Winter lab, UT Southwestern | PCR primers | Primers used for mutagenesis in this study are listed in Supplementary file 1 |
| Sequence-based reagent | mouse GapDH RT-qPCR Forward Primer | Spandidos, 2008; Spandidos et al., 2010; Wang and Seed, 2003 | Primer Bank ID 6679937a1 | AGGTCGGTGTGAACGGATTTG |
| Sequence-based reagent | Mouse GapDH RT-qPCR Reverse Primer | Spandidos, 2008; Spandidos et al., 2010; Wang and Seed, 2003 | Primer Bank ID 6679937a1 | TGTAGACCATGTAGTTGAGGTCA |
| Sequence-based reagent | Mouse Cxcl1 RT-qPCR Primer | Godinez, 2008 | TGCACCCAAACCGAAGTCAT | |
| Sequence-based reagent | Mouse Cxcl1 RT-qPCR Primer | Godinez, 2008 | TTGTCAGAAGCCAGCGTTCAC | |
| Sequence-based reagent | Mouse Nos2 RT-qPCR Primer | Godinez, 2008 | TTGGGTCTTGTTCACTCCACGG | |
| Sequence-based reagent | Mouse Nos2 RT-qPCR Primer | Godinez, 2008 | CCTCTTTCAGGTCACTTTGGTAGG | |
| Sequence-based reagent | Mouse Tnfa RT-qPCR Forward Primer | Wilson, 2008 | AGCCAGGAGGGAGAACAGAAAC | |
| Sequence-based reagent | mouse Tnfa RT-qPCR Primer | Wilson, 2008 | CCAGTGAGTGAAAGGGACAGAACC | |
| Commercial assay or kit | Gibson Assembly Master Mix | New England Biolabs | Cat# E2611 | |
| Commercial assay or kit | Q5 Hot Start 2 x Master Mix | New England Biolabs | Cat# M0494 | |
| Commercial assay or kit | QIAfilter Plasmid Midi Kit | QIAGEN | Cat# 12245 | |
| Commercial assay or kit | QIAEX II Gel Extraction Kit | QIAGEN | Cat# 20021 | |
| Commercial assay or kit | TRI Reagent | Molecular Research Center | Cat# TR118 | |
| Commercial assay or kit | NEBNext Poly(A) mRNA Magnetic Isolation Module | New England Biolabs | Cat# E7490 | |
| Commercial assay or kit | TaqMan Reverse Transcription Reagents | Applied Biosystems | Cat# N8080234 | |
| Commercial assay or kit | SYBR Green qPCR Master Mix | Applied Biosystems | Cat# 4309155 | |
| Chemical compound, drug | Mucin from porcine stomach, Type II | Sigma | Cat# M2378 | Lot#SLCD8300 |
| Chemical compound, drug | Sodium nitrate | Sigma | Cat# S5506 | Lot# MKCC4317 |
| Chemical compound, drug | Sodium fumurate dibasic | Sigma | Cat# F1506 | Lot#BCCC8774 |
| Chemical compound, drug | Dextran sulfate sodium salt, MW ca 40,000 | Alfa Aesar | Cat# J63606 | Lots# T17A050, U03C023, S13C040, U01F027 |
| Chemical compound, drug | Piroxicam diet(50 ppm, 100 ppm) | Envigo | Custom diet | |
| Chemical compound, drug | LB Broth, Miller (Luria Bertani) | Becton Dickinson | Cat# 244620 | |
| Chemical compound, drug | Kanamycin sulfate | Thermo Fisher | Cat# BP906 | |
| Chemical compound, drug | Chloramphenicol | Thermo Fisher | Cat# BP904 | |
| Chemical compound, drug | Carbenicillin, disodium salt | VWR | Cat# J358 | |
| Software, algorithm | Excel | Microsoft Office | https://www.microsoft.com/en-us/microsoft-365/excel | |
| Software, algorithm | Prism v9.0 | GraphPad | https://www.graphpad.com/scientific-software/prism/ | |
| Software, algorithm | MacVector | MacVector | https://macvector.com/ | |
| Software, algorithm | QuantStudio 6 | Thermo Fisher | https://www.thermofisher.com/us/en/home/life-science/pcr/real-time-pcr/real-time-pcr-instruments/quantstudio-systems/models/quantstudio-6-7-flex.html | |
| Software, algorithm | BioRender | https://www.BioRender.com | ||
| Software, algorithm | PowerPoint | Microsoft Office | https://www.microsoft.com/en-us/microsoft-365/powerpoint | |
| Software, algorithm | BBMap software suite | Joint Genome Institute | https://jgi.doe.gov/data-and-tools/bbtools/ | |
| Software, algorithm | Bowtie 2 | Langmead and Salzberg, 2012 | http://bowtie-bio.sourceforge.net/bowtie2/index.shtml | |
| Software, algorithm | DIAMOND | Buchfink, 2015 | https://github.com/bbuchfink/diamond | |
| Software, algorithm | MEGAN5 | Huson, 2007; Huson et al., 2016 | https://software-ab.informatik.uni-tuebingen.de/download/megan5/welcome.html | |
| Software, algorithm | FMAP | Kim, 2016 | https://github.com/jiwoongbio/FMAP | |
| Software, algorithm | DESeq2 | Love, 2014 | https://bioconductor.org/packages/release/bioc/html/DESeq2.html | |
| Software, algorithm | ART | Huang, 2012 | https://www.niehs.nih.gov/research/resources/software/biostatistics/art/index.cfm | |
| Other | Anaerobic Chamber | Sheldon Manufacturing | Bactron300 | |
| Other | European Nucleotide Archive, accession number PRJEB15095 | Hughes, 2017 | Metagenomic sequencing of cecal microbiota from DSS colitis mouse model | |
| Other | SRA, BioProject number PRJNA400072 | Franzosa, 2019 | Human gut metagenome | |
| Other | HydDB Hydrogenase Database | Søndergaard et al., 2016 |
Additional files
-
Supplementary file 1
Primers for mutagenesis generated for this study.
- https://cdn.elifesciences.org/articles/58609/elife-58609-supp1-v1.docx
-
Transparent reporting form
- https://cdn.elifesciences.org/articles/58609/elife-58609-transrepform1-v1.docx
Download links
A two-part list of links to download the article, or parts of the article, in various formats.
Downloads (link to download the article as PDF)
Open citations (links to open the citations from this article in various online reference manager services)
Cite this article (links to download the citations from this article in formats compatible with various reference manager tools)
Reshaping of bacterial molecular hydrogen metabolism contributes to the outgrowth of commensal E. coli during gut inflammation
eLife 10:e58609.
https://doi.org/10.7554/eLife.58609


