A human ESC-based screen identifies a role for the translated lncRNA LINC00261 in pancreatic endocrine differentiation
- Departments of Pediatrics and Cellular & Molecular Medicine, Pediatric Diabetes Research Center, University of California, San Diego, United States
- Cardiovascular and Metabolic Sciences, Max Delbrück Center for Molecular Medicine in the Helmholtz Association (MDC), Germany
- DZHK (German Centre for Cardiovascular Research), Partner Site Berlin, Germany
- Berlin Institute of Health (BIH), Germany
- Charité -Universitätsmedizin, Germany
Figures
Figure 1 with 1 supplement
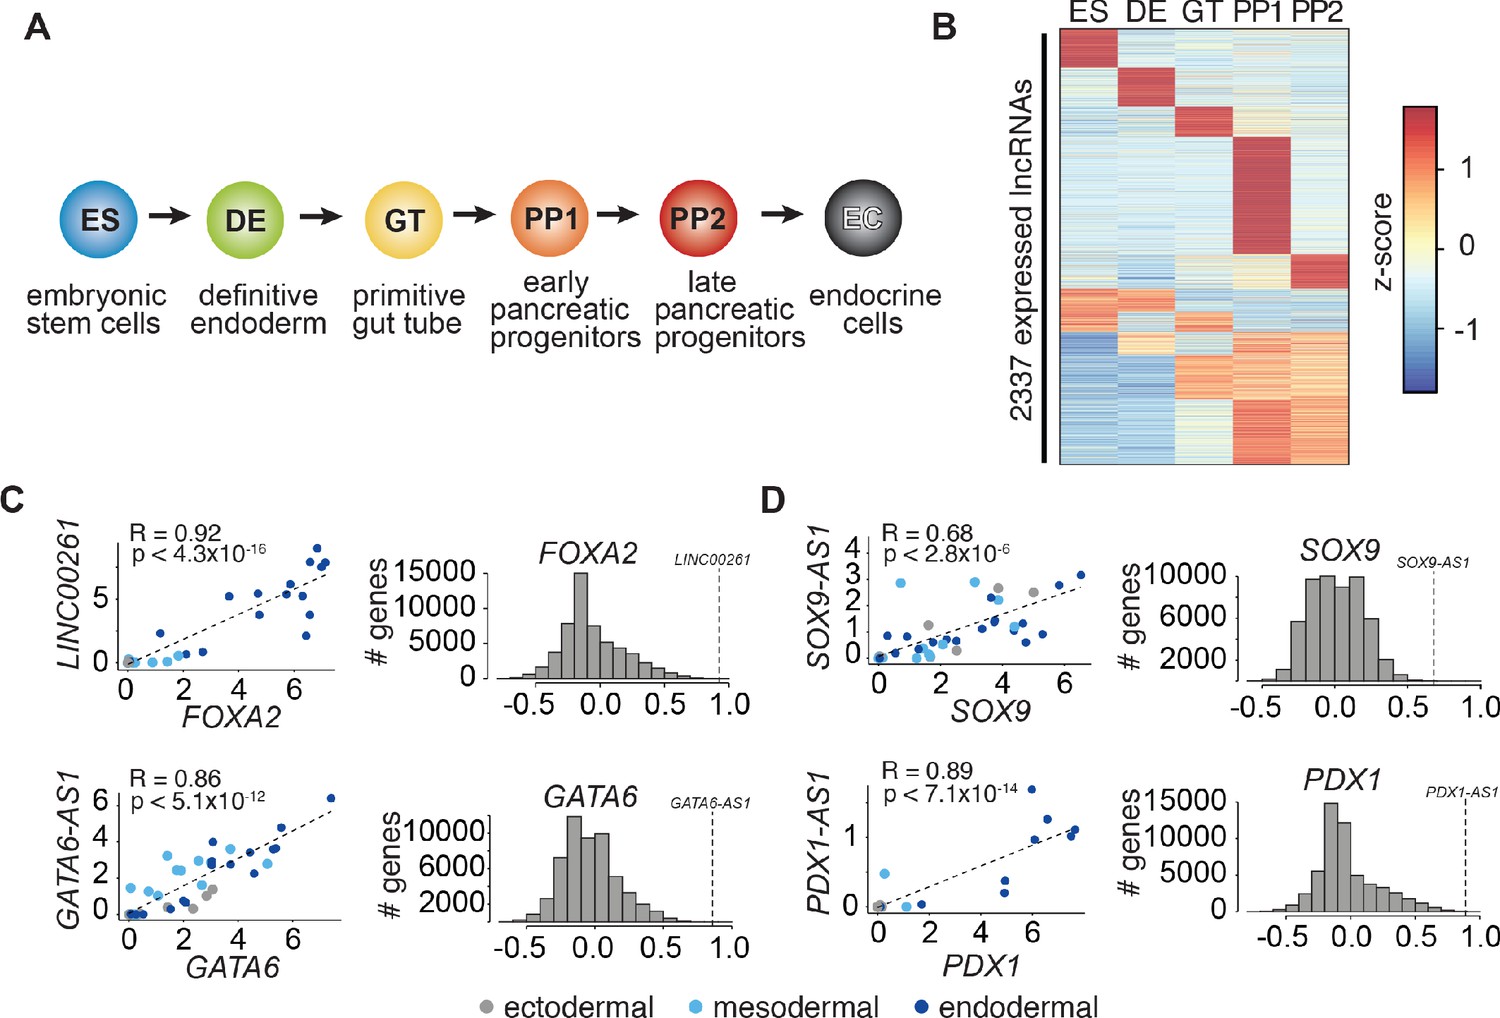
LncRNA expression and regulation during pancreatic differentiation.
(A) Stages of directed differentiation from human embryonic stem cell (hESCs) to hormone-producing endocrine cells. The color scheme for each stage is used across all figures. (B) K-means clustering of all lncRNAs expressed (RPKM ≥ 1) during pancreatic differentiation based on their expression z-score (mean of n = 2 independent differentiations per stage; from CyT49 hESCs). (C,D) Left: Scatterplots comparing the expression of early (C) and late (D) expressed endodermal transcription factors (TFs) with the expression of their neighboring lncRNAs across 38 tissues. The dot color indicates the germ layer of origin of these tissues. Pearson correlation coefficients and p-values (t-test) are displayed. Right: Distribution of the Pearson correlation coefficients for each TF with all Ensembl 87 genes across the same 38 tissues. Dashed lines denote the correlation for the neighboring lncRNA, which for all lncRNAs shown is higher than expected by chance. See also Figure 1—figure supplement 1 and Figure 1—source data 1.
-
Figure 1—source data 1
Identification, regulation, and characterization of lncRNAs during pancreatic differentiation.
(A) Gene expression during pancreatic differentiation (RPKM). (B) lncRNA-proximal TFs, by cluster in correlation heatmap (Figure 1—figure supplement 1C). (C) GO enrichment and KEGG pathway analysis for each cluster in the correlation heatmap (Figure 1—figure supplement 1D).
- https://cdn.elifesciences.org/articles/58659/elife-58659-fig1-data1-v2.xlsx
Figure 1—figure supplement 1
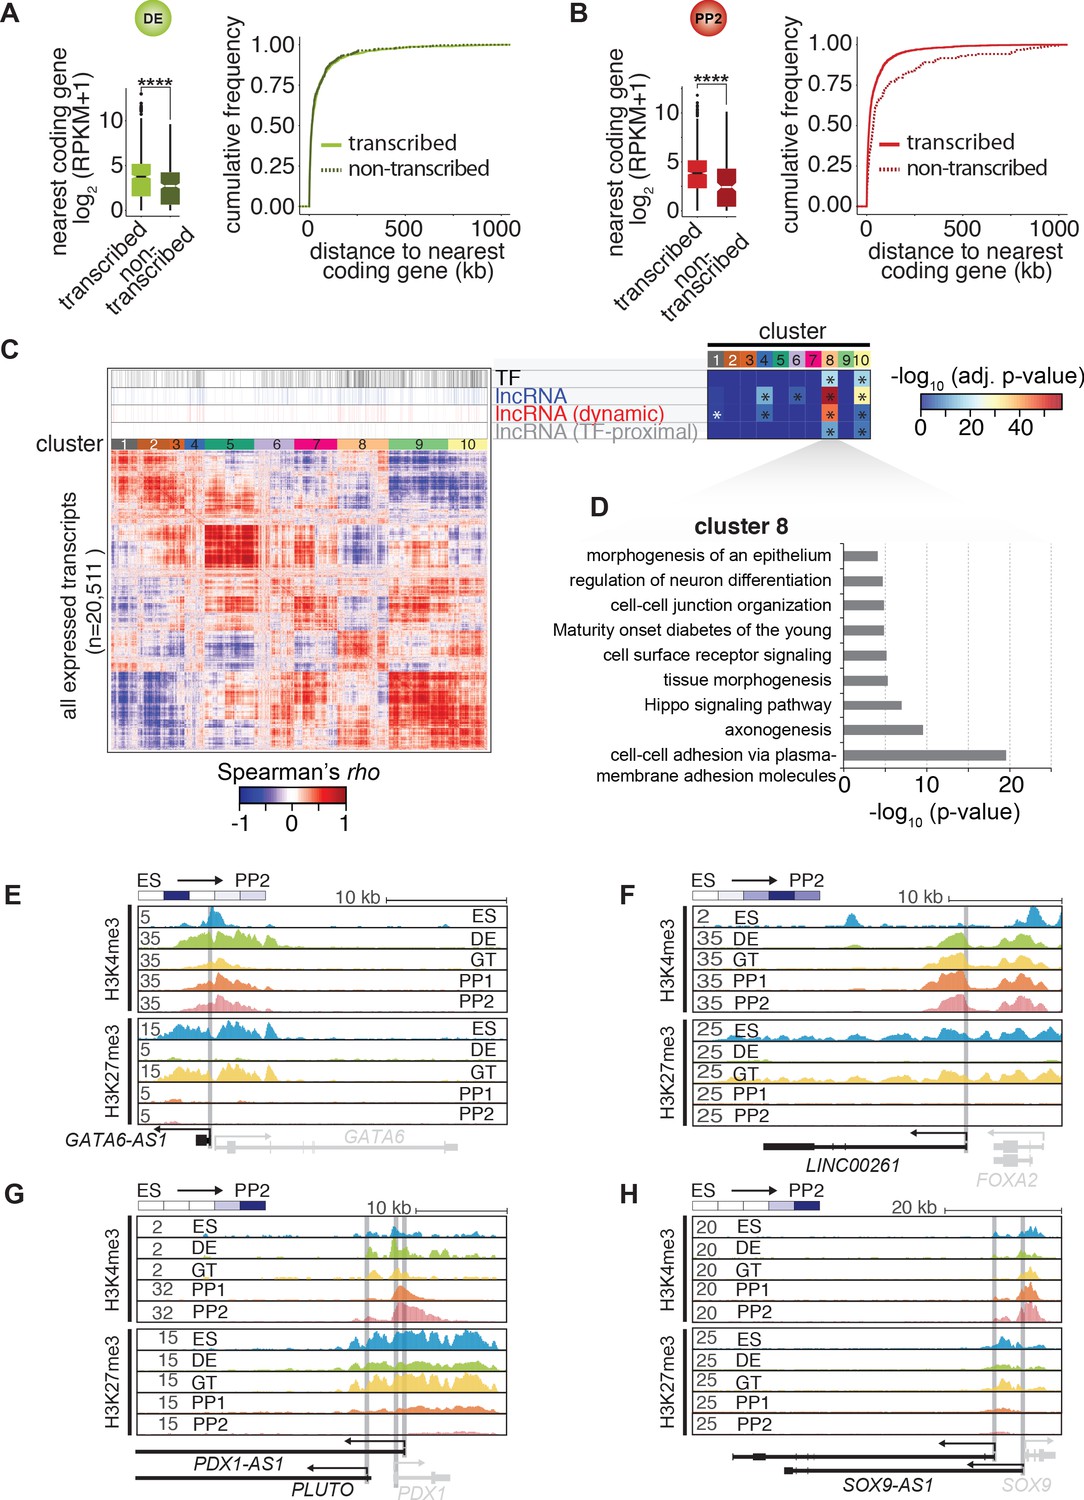
Characterization of lncRNAs expressed during pancreatic differentiation.
(A,B) Left: Expression of the single nearest coding genes (±1000 kb) in cis to transcribed and non-transcribed lncRNAs at the DE stage (A) or PP2 stage (B). Log2 transformed mean expression values (RPKM + pseudocount) from two biological replicates were used to generate the box plots (****, p-value<0.0001, Wilcoxon rank sum test). Right: Corresponding cumulative distance distribution functions. (C) Heatmap of the hierarchically clustered expression correlations (Spearman’s rho) of all RNAs transcribed during pancreatic differentiation (with RPKM ≥ 1 in at least ten out of 38 tissues). Transcription factor (TF)-encoding mRNAs, lncRNAs (all), dynamically expressed lncRNAs (RPKM ≤ 1 in at least one stage (ESC to PP2)), and TF-proximal lncRNAs are highlighted above the heatmap. Clusters 8 and 10 are significantly enriched for all of these RNAs (*, p-value<0.03, Fisher test). (D) Gene ontology and KEGG pathway analysis for all coding genes in cluster 8 (p-value<0.05, Fisher test). The full list of significantly enriched terms is shown in Figure 1—source data 1C. (E–H) H3K4me3 and H3K27me3 ChIP-seq tracks of loci containing lncRNAs GATA6-AS1 (A), LINC00261 (B), PDX1-AS1/PLUTO (C), or SOX9-AS1 (D) during pancreatic differentiation of CyT49 hESCs.
Figure 2 with 1 supplement
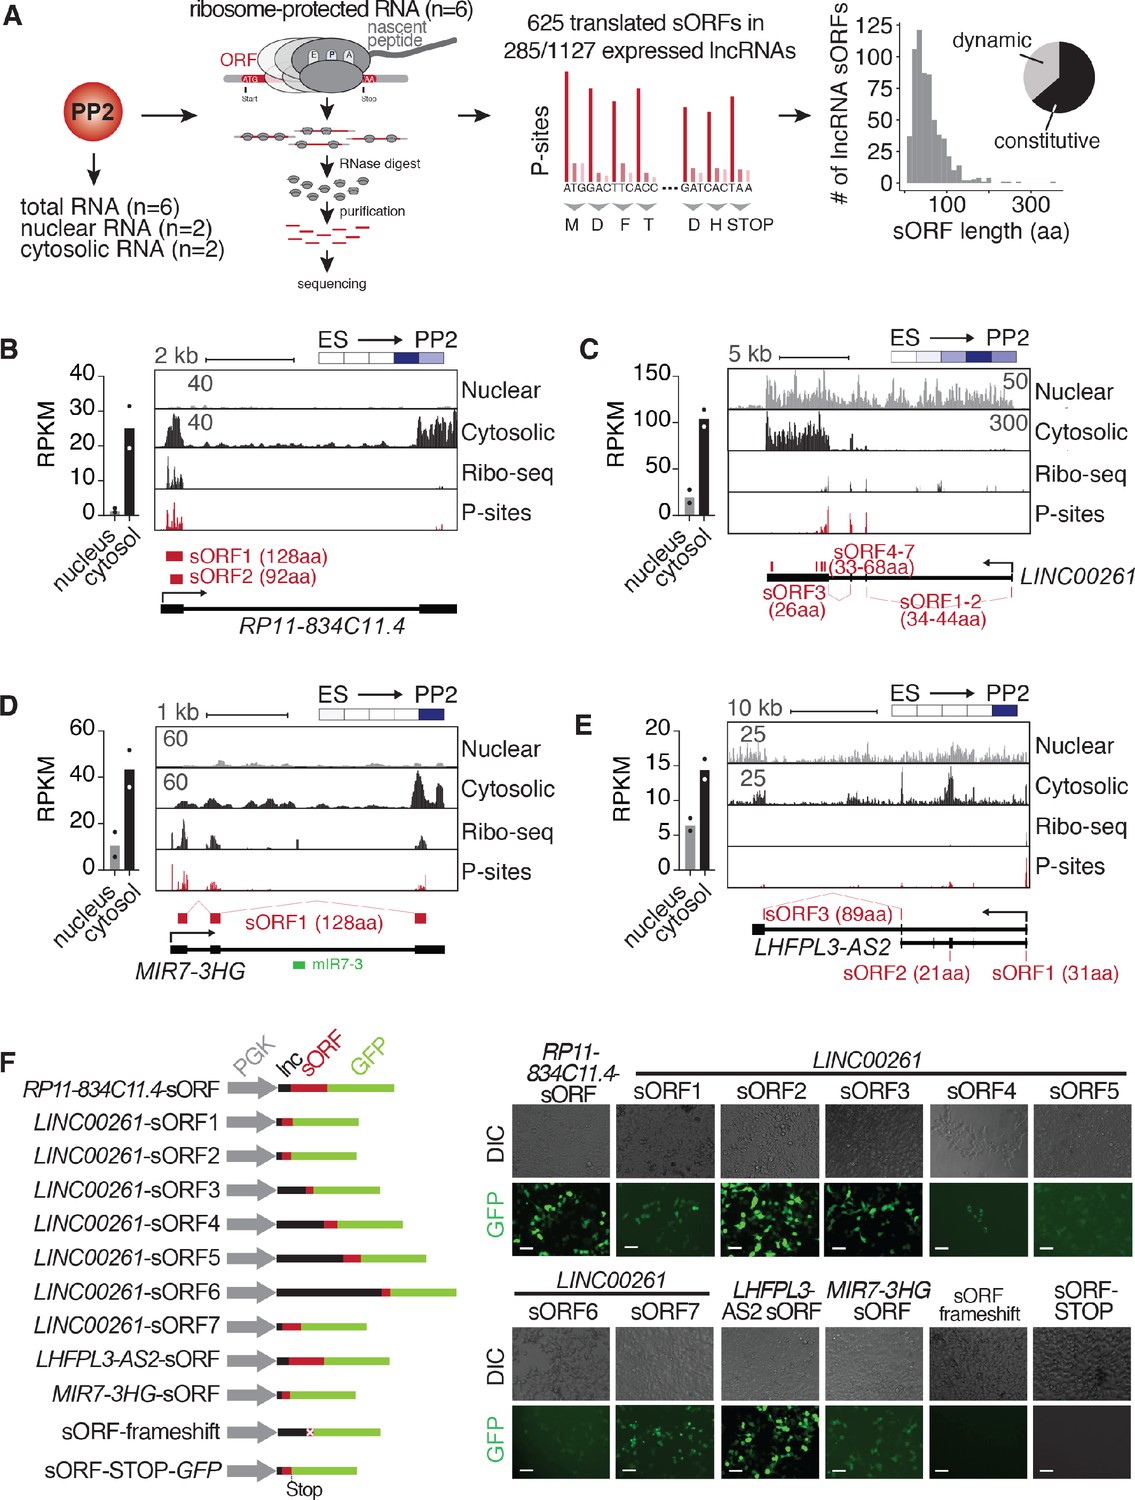
Cytosolic lncRNAs contain translated small open reading frames.
(A) Overview of experimental strategy for subcellular fractionation and Ribo-seq-based identification of translated small open reading frames (sORFs) from lncRNAs expressed in PP2 cells. Replicates from six independent differentiations to PP2 stage each for total (polyA) RNA-seq and Ribo-seq experiments, and two biological replicates for the subcellular fractionation were analyzed. The histogram on the far right depicts the size distribution of the sORF-encoded small peptides as number of amino acids (aa). The pie chart summarizes the percentages of constitutively and dynamically expressed sORF-encoding lncRNAs during pancreatic differentiation of CyT49 hESCs. (B–E) Left: Bar graphs showing nuclear and cytosolic expression (in RPKM) of lncRNAs RP11-834C11.4 (B), LINC00261 (C), MIR7-3HG (D), and LHFPL3-AS2 (E). Data are shown as mean, with individual data points represented by dots (n = 2 biological replicates). Right: Subcellular fractionation RNA-seq, Ribo-seq, and P-site tracks (ribosomal P-sites inferred from ribosome footprints on ribosome-protected RNA) for loci of the depicted lncRNAs. Identified highest stringency sORFs (ORF in 6/6 replicates) are shown in red. For LINC00261, visually identified sORFs 1 and 2 are also shown. Heatmaps in the top right visualize the relative expression of the shown lncRNAs during pancreatic differentiation (means of two biological replicates per stage), on a minimum (white)/maximum (dark blue) scale. (F) In vivo translation reporter assays testing whether sORFs computationally defined in (A) give rise to translation products in HEK293T cells when fused in-frame to a GFP reporter. Left: Schematic of the constructs (gray: PGK promoter, black: lncRNA sequence 5’ to sORF to be tested, red: sORF, green: GFP ORF). Right: Representative DIC and GFP images of HEK293T cells transiently transfected with the indicated reporter constructs. Scale bars = 50 µm. See also Figure 2—figure supplement 1 and Figure 2—source data 1.
-
Figure 2—source data 1
RNA-seq after subcellular fractionation and Ribo-seq in PP2 cells.
(A) Subcellular fractionation of PP2 stage cells (RPKM). (B) Ribo-seq/mRNA-seq contaminant filtering statistics, read size distribution, and Pearson correlation coefficients of all sequenced Ribo-seq and polyA RNA-seq libraries. (C) All ORFs detected by RiboTaper, including lncRNA sORFs. (D) lncRNA sORFs detected by RiboTaper and conservation statistics (PhyloCSF scores). (E) Translational efficiency calculations.
- https://cdn.elifesciences.org/articles/58659/elife-58659-fig2-data1-v2.xlsx
Figure 2—figure supplement 1
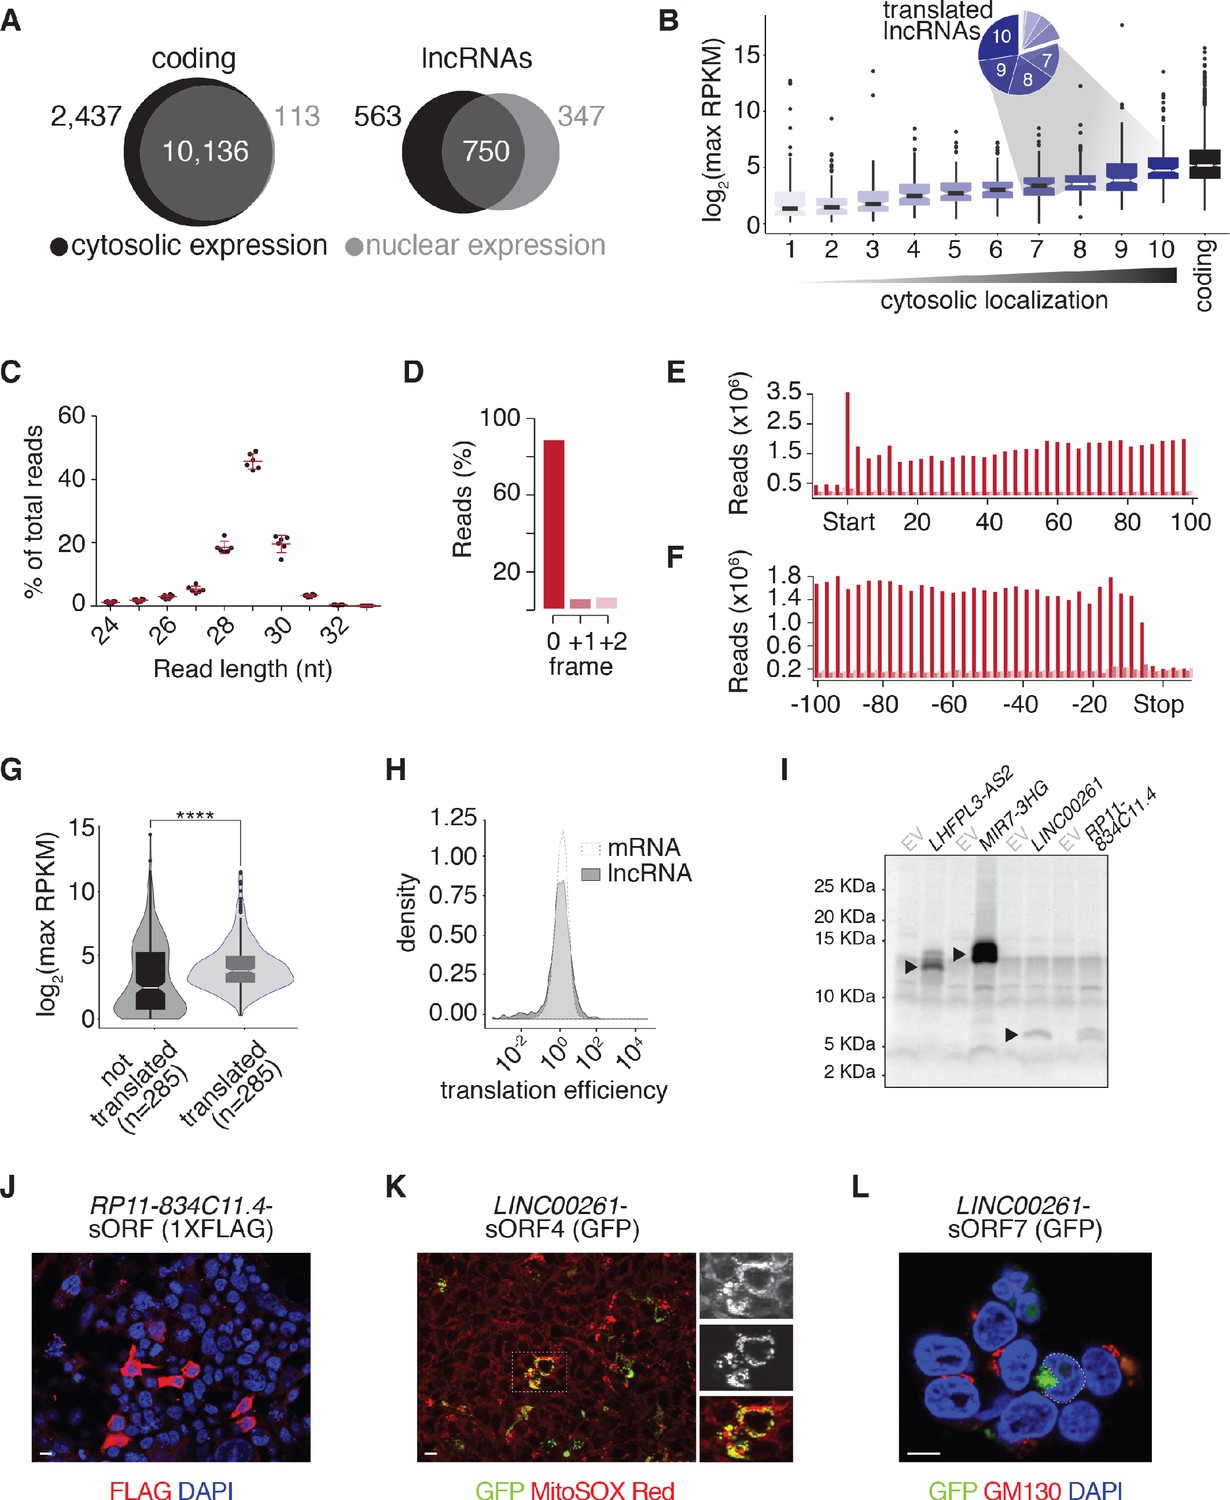
Cytosolic lncRNAs engage with ribosomes.
(A) Venn diagrams showing the number of coding RNAs (left) and lncRNAs (right) with RPKM ≥ 1 across two biological replicates in cytosolic and nuclear fractions. (B) Box plots of maximum lncRNA expression (RPKM + pseudocount) across 38 tissues binned by their degree of cytosolic localization (measured as nuclear/cytosolic lncRNA expression ratio deciles in PP2); the expression of all PP2-transcribed coding RNAs with dynamic expression during differentiation is included for reference. The pie chart summarizes the proportions of translated lncRNAs within each cytoplasmic localization decile. (C) Read length distribution (nt) of Ribo-seq fragments across replicate Ribo-seq experiments (n = 6 biological replicates). (D) Position of the inferred P-sites of the ribosome footprints relative to the reading frame of PP2-transcribed coding genes. (E–F) Coverage of 29 nt footprint P-sites around the start codons (E) or stop codons (F) of PP2-transcribed coding genes. (G) Box plots comparing maximum expression of translated and untranslated lncRNAs (RPKM + pseudocount) across 38 tissues (****, p-value=2.122×10⁻⁸, Wilcoxon rank sum test). For the untranslated set, 285 untranslated PP2-expressed lncRNAs were selected randomly. (H) Density plots comparing the translation efficiencies of PP2-expressed mRNAs and lncRNAs. (I) Autoradiograph of radiolabeled in vitro translation products derived from full-length LHFPL3-AS2, MIR7-3HG, LINC00261, and RP11-834C11.4. EV, empty vector. (J) Anti-FLAG immunofluorescence staining of HEK293T cells transiently transfected with a PGK-RP11-834C11.4-sORF-1xFLAG construct. (K) Microphotograph of HEK293T cells transiently transfected with a PGK-LINC00261-sORF4-GFP construct with mitochondria labeled by MitoSOX Red. (L) Golgi immunofluorescence staining (anti-GM130) of HEK293T cells transiently transfected with a PGK-LINC00261-sORF7-GFP construct. Scale bars = 10 µm.
Figure 3 with 1 supplement
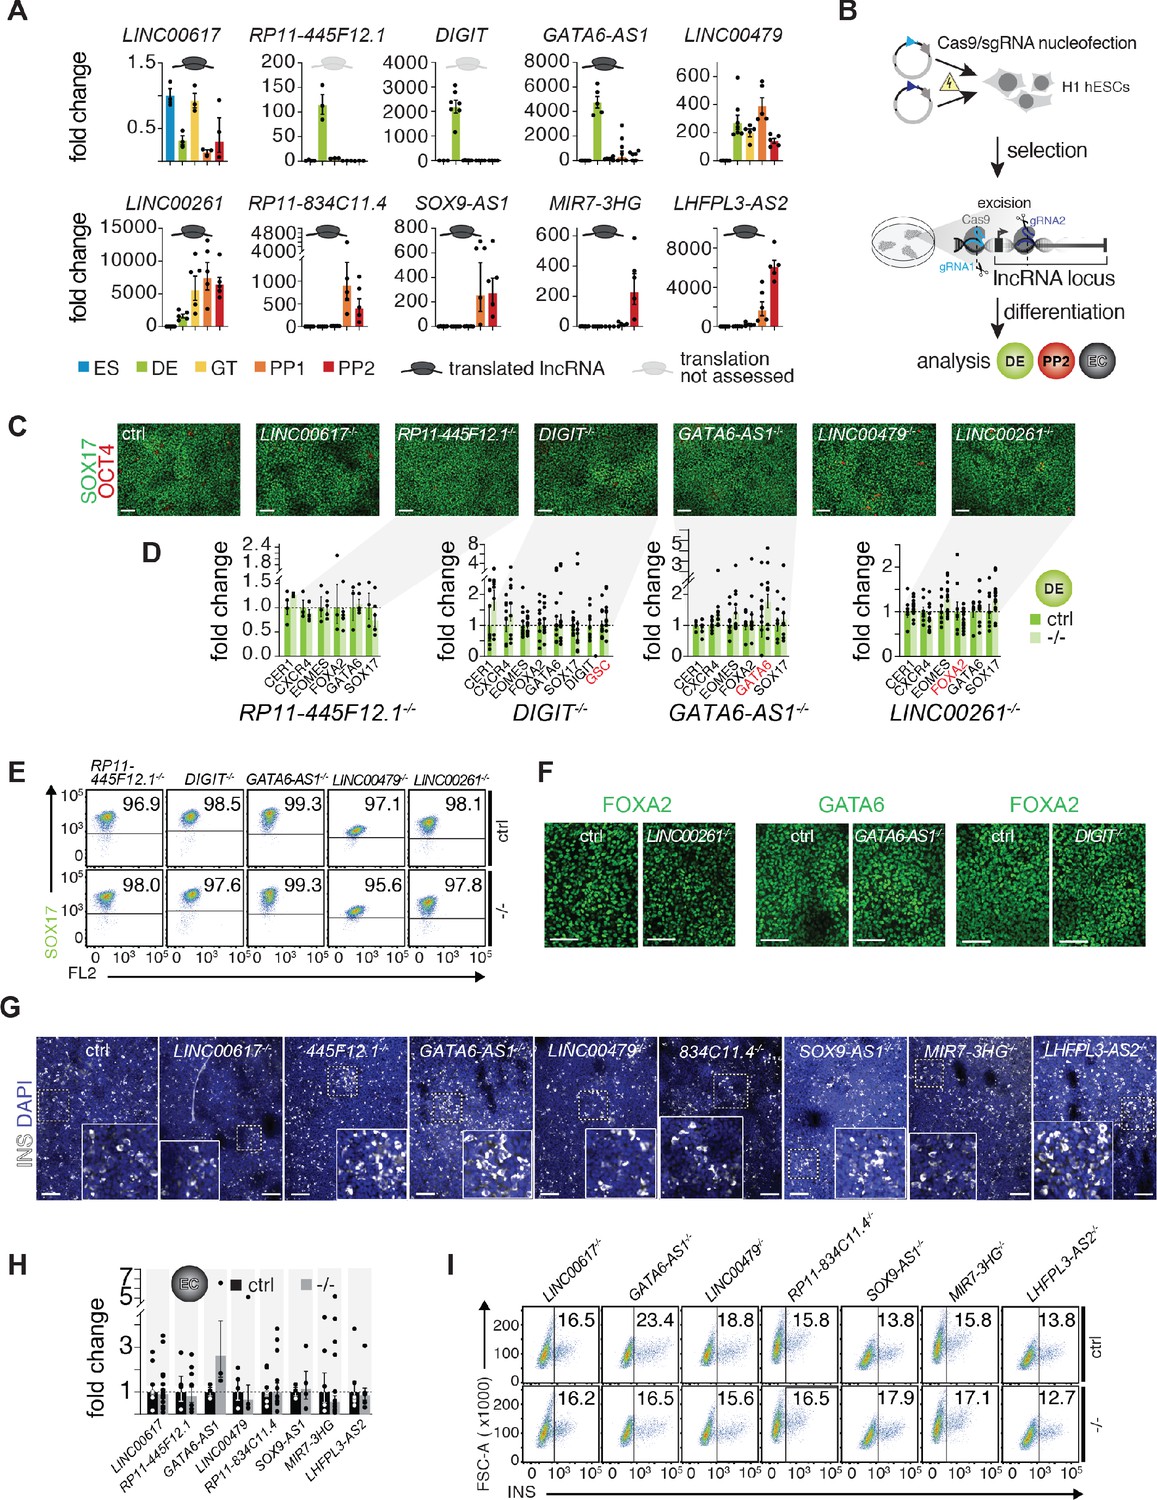
A small-scale CRISPR loss-of-function screen for dynamically expressed and translated lncRNAs during pancreatic differentiation.
(A) qRT-PCR analysis of candidate lncRNAs during pancreatic differentiation of H1 hESCs relative to the ES stage. Data are shown as mean ± S.E.M. (mean of n = 2–6 independent differentiations per stage; from H1 hESCs). Individual data points are represented by dots. See also Figure 3—source data 2. (B) CRISPR-based lncRNA knockout (KO) strategy in H1 hESCs and subsequent phenotypic characterization. (C) Immunofluorescence staining for OCT4 and SOX17 in DE from control (ctrl) and KO cells for the indicated lncRNAs (representative images, n ≥ 3 independent differentiations; at least two KO clones were analyzed). (D) qRT-PCR analysis of DE lineage markers in DE from control and lncRNA KO (-/-) cells. TF genes in cis to the lncRNA locus are highlighted in red. Data are shown as mean ± S.E.M. (n = 3–16 replicates from independent differentiations and different KO clones). Individual data points are represented by dots. NS, p-value>0.05; t-test. See also Figure 3—source data 3. (E) Flow cytometry analysis at DE stage for SOX17 in control and KO (-/-) cells for indicated lncRNAs. The line demarks isotype control. Percentage of cells expressing SOX17 is indicated (representative experiment, n ≥ 3 independent differentiations from at least two KO clones). (F) Immunofluorescence staining for FOXA2 or GATA6 in DE from control and LINC00261, GATA6-AS1, and DIGIT KO cells. (G) Immunofluorescence staining for insulin (INS) in endocrine cell stage (EC) from control and KO hESCs for the indicated lncRNAs (representative images, n ≥ 3 independent differentiations from at least two KO clones). Boxed areas (dashed boxes) are shown in higher magnification. (H) qRT-PCR analysis of INS in EC stage cultures from control and lncRNA KO (-/-) hESCs. Data are shown as mean ± S.E.M. (n ≥ 4 replicates from independent differentiations of at least two KO clones). Individual data points are represented by dots. NS, p-value>0.05; t-test. See also Figure 3—source data 4 (I) Flow cytometry analysis at EC stage for INS in control and KO (-/-) cells for indicated lncRNAs. The line demarks isotype control. Percentage of cells expressing insulin is indicated (representative experiment, n ≥ 3 independent differentiations each from at least two KO clones). Scale bars = 100 µm. See also Figure 3—figure supplement 1 and Figure 3—source data 1–4.
-
Figure 3—source data 1
Differentially expressed genes after lncRNA deletion.
(A) Coordinates of CRISPR deletions. (B) Differentially expressed genes in RP11-445F12.1 knockout at definitive endoderm stage. (C) Differentially expressed genes in GATA6-AS1 knockout at definitive endoderm stage. (D) Differentially expressed genes in LINC00261 knockout at definitive endoderm stage. (E) Differentially expressed genes in LINC00617 knockout at PP2 stage. (F) Differentially expressed genes in GATA6-AS1 knockout at PP2 stage. (G) Differentially expressed genes in LINC00479 knockout at PP2 stage. (H) Differentially expressed genes in RP11-834C11.4 knockout at PP2 stage. (I) Differentially expressed genes in SOX9-AS1 knockout at PP2 stage. (J) Differentially expressed genes in MIR7-3HG knockout at PP2 stage. (K) Differentially expressed genes in LHFPL3-AS2 knockout at PP2 stage.
- https://cdn.elifesciences.org/articles/58659/elife-58659-fig3-data1-v2.xlsx
-
Figure 3—source data 2
Source data used for the qRT-PCR quantification of gene expression presented in Figure 3A.
- https://cdn.elifesciences.org/articles/58659/elife-58659-fig3-data2-v2.xlsx
-
Figure 3—source data 3
Source data used for the qRT-PCR quantification of gene expression presented in Figure 3D.
- https://cdn.elifesciences.org/articles/58659/elife-58659-fig3-data3-v2.xlsx
-
Figure 3—source data 4
Source data used for the qRT-PCR quantification of INS expression presented in Figure 3H.
- https://cdn.elifesciences.org/articles/58659/elife-58659-fig3-data4-v2.xlsx
Figure 3—figure supplement 1
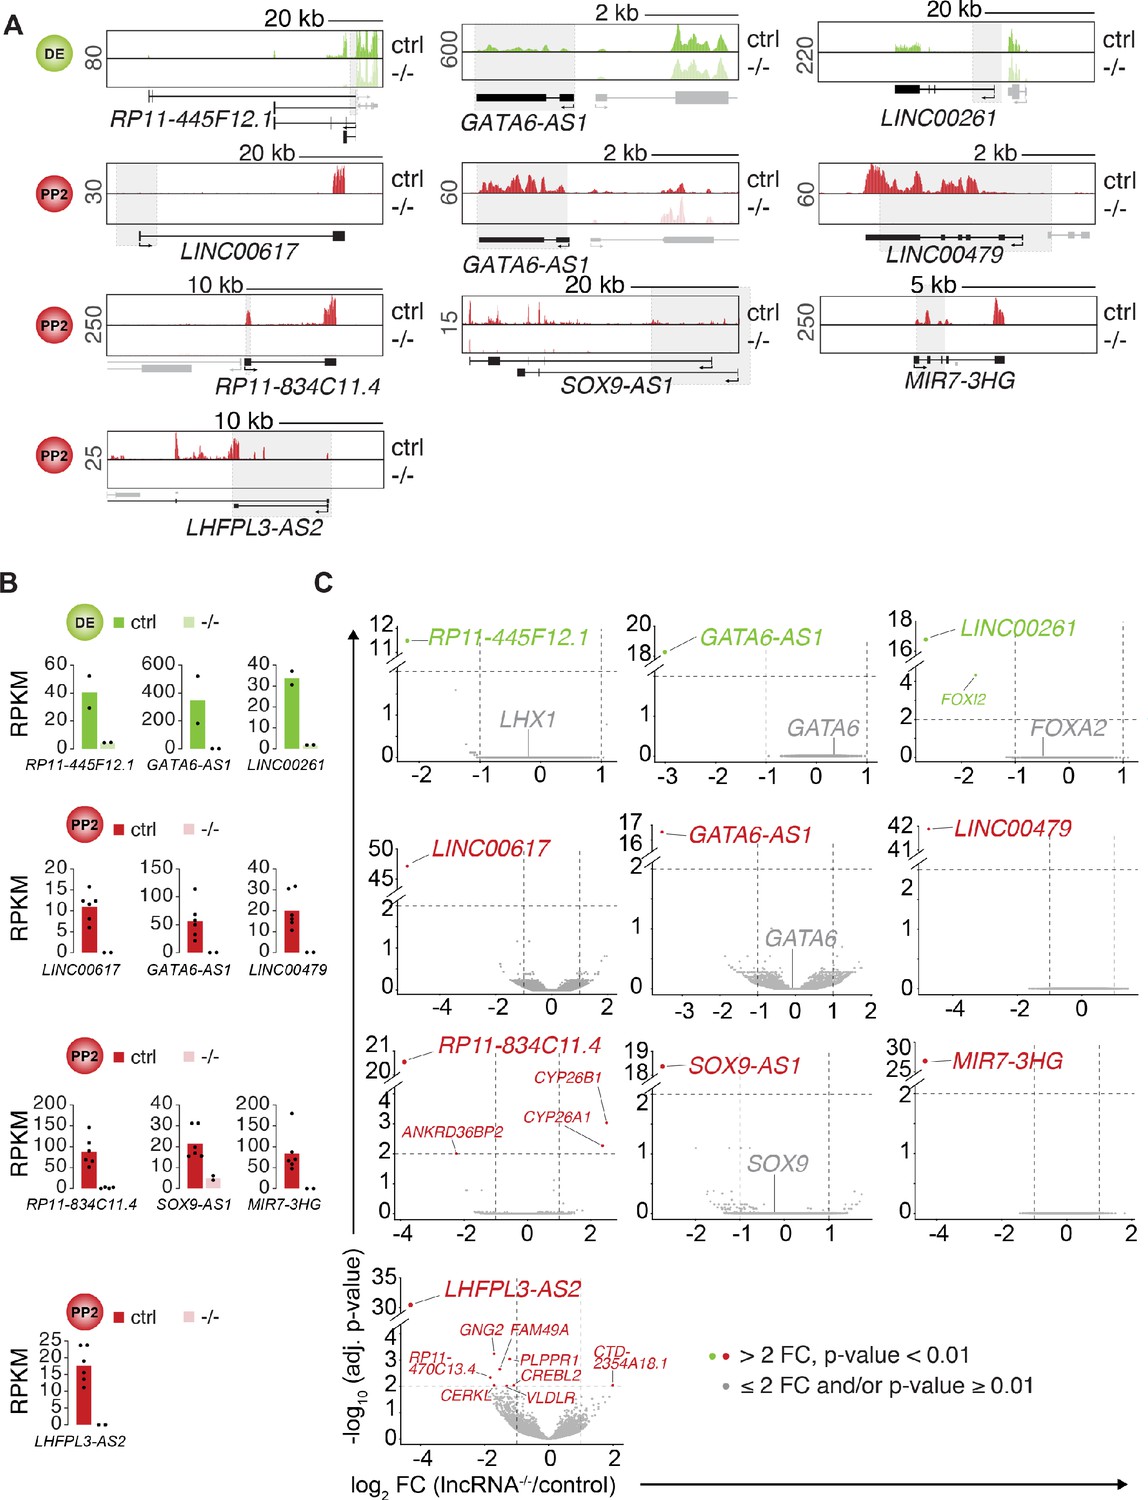
Minor gene expression changes in definitive endoderm or pancreatic progenitor cells after lncRNA deletion.
(A) Genome Browser snap shots of RNA-seq signal at the indicated lncRNA loci in control (ctrl) and lncRNA knockout (KO; -/-) DE (green tracks) and PP2 (red tracks) stage cells. Genomic deletions are indicated by gray boxes. (B) Bar graphs showing expression of indicated lncRNAs in control and lncRNA KO DE (green) and PP2 (red) cells quantified by RNA-seq. Data are shown as mean RPKM (n = 2–6 independent differentiations of two independent KO clones, except for SOX9-AS1 for which one clone was differentiated twice). Individual data points are represented by dots. (C) Volcano plots displaying gene expression changes in control versus lncRNA KO DE (green) or PP2 (red) cells. Differentially expressed genes (DESeq2; >2 fold change (FC), adjusted p-value<0.01; vertical and horizontal dashed lines indicate the thresholds; n = 2 independent differentiations of two independent KO clones, except for SOX9-AS1 for which one clone was differentiated twice) are shown in green (DE) and red (PP2). TF genes in cis to deleted lncRNAs are shown in gray (gray dots represent genes with ≤ 2 fold change and/or adjusted p-value≥0.01).
Figure 4 with 1 supplement
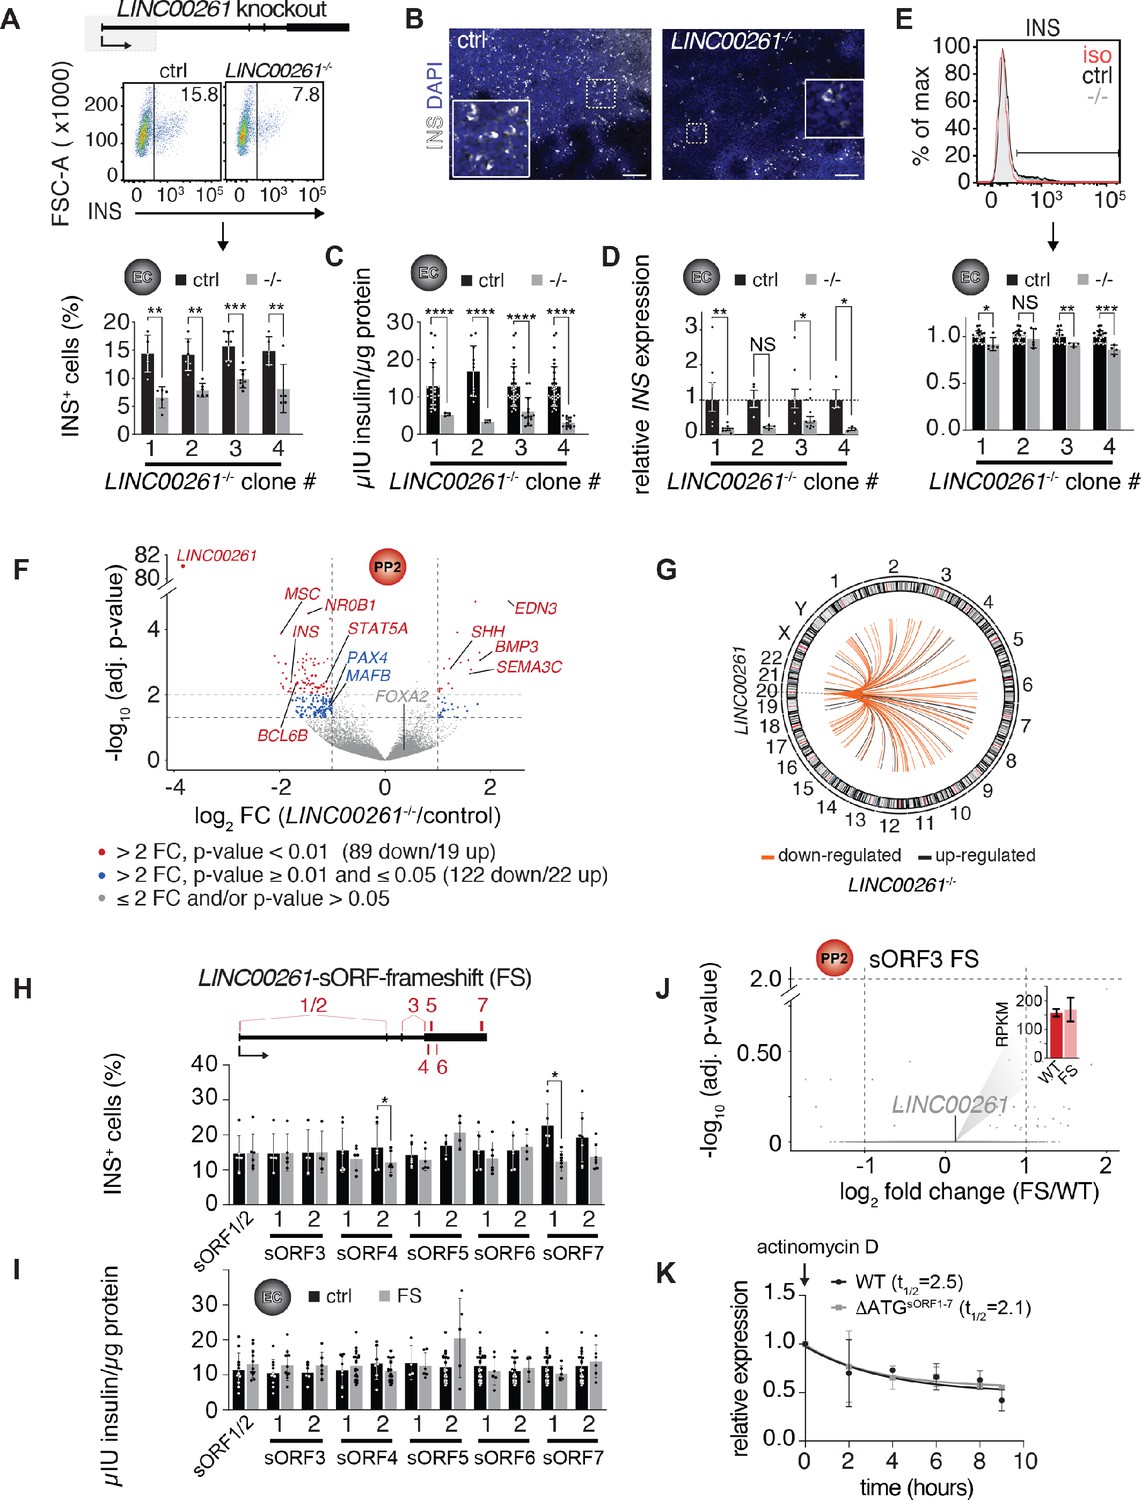
LINC00261 deletion impedes pancreatic endocrine cell differentiation.
(A) Flow cytometry analysis at endocrine cell stage (EC) for insulin (INS) in control (ctrl) and LINC000261-/- H1 hESCs. Top panel: Schematic of the LINC00261 locus. The dashed box represents the genomic deletion. Middle panel: The line demarks isotype control. Percentage of cells expressing INS is indicated (representative experiment, n = 4 deletion clones generated with independent sgRNAs). Bottom panel: Bar graph showing percentages of INS-positive cells. Data are shown as mean ± S.D. (n = 5 (clone 1), n = 6 (clone 2), n = 8 (clone 3), n = 5 (clone 4) independent differentiations). Individual data points are represented by dots. (B) Immunofluorescence staining for INS in EC stage cultures from control and LINC000261-/- hESCs (representative images, number of differentiations see A). Boxed areas (dashed boxes) are shown in higher magnification. (C) ELISA for INS in EC stage cultures from control and LINC00261-/- hESCs. Data are shown as mean ± S.D. (n = 3 (clone 1), n = 2 (clone 2), n = 14 (clone 3), n = 13 (clone 4) independent differentiations). Individual data points are represented by dots. (D) qRT-PCR analysis of INS in EC stage cultures from control and LINC00261-/- hESCs. Data are shown as mean ± S.E.M. (n = 8 (clone 1), n = 4 (clone 2), n = 10 (clone 3), n = 3 (clone 4) independent differentiations). Individual data points are represented by dots. (E) Quantification of median fluorescence intensity after INS staining of control and LINC00261-/- EC stage cultures. Data are shown as mean ± S.D. (n = 5 (clone 1), n = 5 (clone 2), n = 4 (clone 3), n = 4 (clone 4) independent differentiations). iso, isotype control. Individual data points are represented by dots. (F) Volcano plot displaying gene expression changes in control versus LINC00261-/- PP2 cells (n = 6 independent differentiations from all four deletion clones). Differentially expressed genes are shown in red (DESeq2;>2 fold change (FC), adjusted p-value<0.01) and blue (>2 fold change, adjusted p-value≥0.01 and≤0.05). Thresholds are represented by vertical and horizontal dashed lines. FOXA2 in cis to LINC00261 is shown in gray (gray dots represent genes with ≤ 2 fold change and/or adjusted p-value>0.05). (G) Circos plot visualizing the chromosomal locations of the 108 genes differentially expressed (DESeq2;>2 fold change (FC), adjusted p-value<0.01) in LINC00261-/- compared to control PP2 cells, relative to LINC00261 on chromosome 20. No chromosome was over- or underrepresented (Fisher test, p-value>0.05 for all chromosomes). (H) Top panel: Schematic of the LINC00261 locus, with the location of its sORFs (1 to 7) marked by vertical red bars. Bottom panel: Flow cytometric quantification of INS-positive cells in control and LINC00261-sORF-frameshift (FS) at the EC stage. Data are shown as mean ± S.D. (n = 4–7 independent differentiations per clone). (I) ELISA for INS in EC stage cultures from control and LINC00261-sORF-FS hESCs. Data are shown as mean ± S.D. (n = 3–7 independent differentiations per clone). (J) Volcano plot displaying gene expression changes in control versus LINC00261-sORF3-FS PP2 cells. No gene was differentially expressed (DESeq2;>2 fold change, adjusted p-value<0.01; indicated by dashed horizontal and vertical lines; n = 2 independent differentiations). LINC00261 is shown in gray, the bar graph insert displays LINC00261 RPKM values in control and LINC00261-sORF3-FS PP2 cells. (K) LINC00261 half-life measurements in HEK293T cells transduced with lentivirus expressing either wild type (WT) LINC00261 or ΔATGsORF1-7 LINC00261 (mutant in which the ATG start codons of sORFs 1–7 were changed to non-start codons). HEK293T were treated with the transcription inhibitor actinomycin D and RNA isolated at 0, 2, 4, 6, 8, and 9 hr post actinomycin D addition. LINC00261 expression was analyzed by qRT-PCR relative to the TBP gene. Data are shown as mean ± S.E.M. (n = 3 biological replicates for each assay time point). *, p-value<0.05; **, p-value<0.01; ***, p-value<0.001; ****, p-value<0.0001; NS, p-value>0.05; t-test. Scale bars = 100 µm. See also Figure 4—figure supplement 1 and Figure 4—source data 1–3.
-
Figure 4—source data 1
Characterization of LINC00261 knockout and LINC00261-sORF3-frameshift PP2 cells.
(A) Differentially expressed genes in LINC00261 knockout PP2 stage cells. (B) Sequences of LINC00261 wild type and frameshift mutants. (C) Differentially expressed genes in LINC00261-sORF3-frameshift PP2 stage cells.
- https://cdn.elifesciences.org/articles/58659/elife-58659-fig4-data1-v2.xlsx
-
Figure 4—source data 2
List of oligonucleotides and synthetic gene fragments used in this study.
(A) sgRNA oligonucleotides used for cloning into PX458/Px459. (B) Genotyping and sequencing primers for KO validation. (C) qRT-PCR primers. (D) Cloning primers (translation reporter constructs and lentiviral LINC00261 overexpression plasmids). (E) Synthetic gene fragments. (F) Custom LINC00261 Stellaris RNA FISH probe set.
- https://cdn.elifesciences.org/articles/58659/elife-58659-fig4-data2-v2.xlsx
-
Figure 4—source data 3
Source data used for the insulin measurements presented in Figure 4.
- https://cdn.elifesciences.org/articles/58659/elife-58659-fig4-data3-v2.xlsx
Figure 4—figure supplement 1
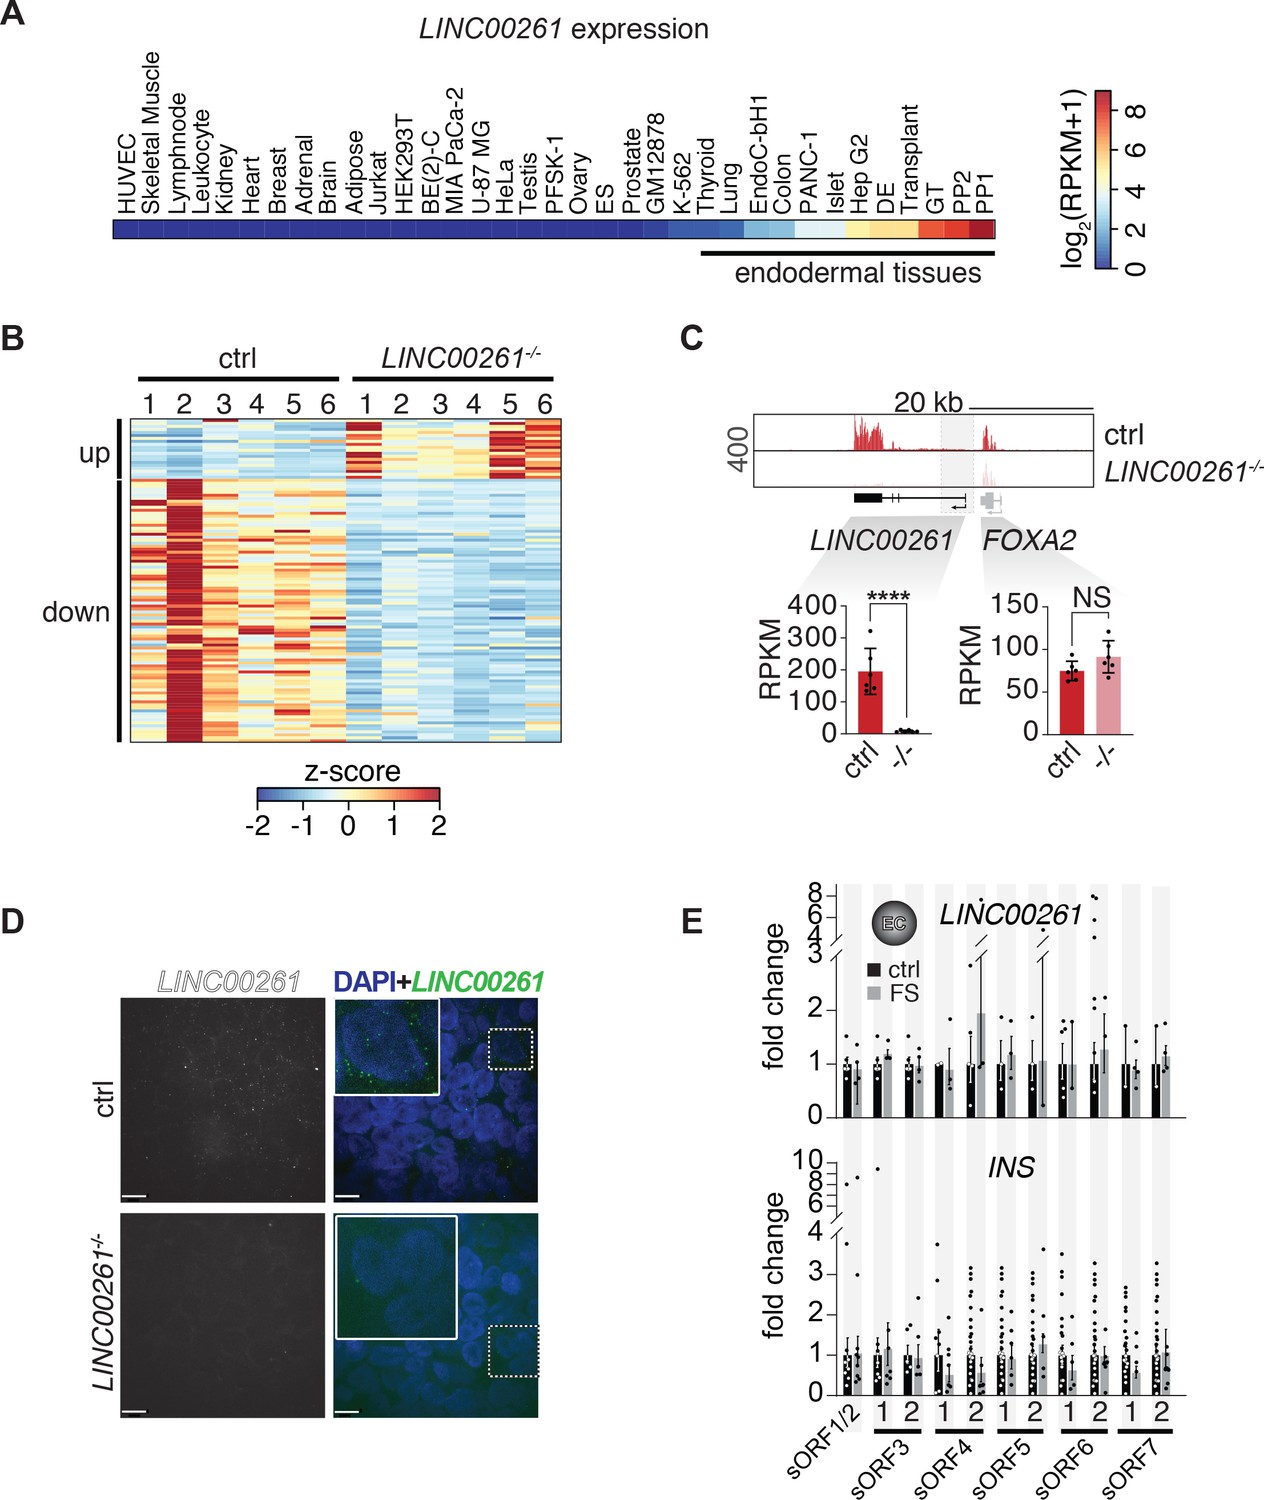
Characterization of LINC00261-deleted pancreatic progenitor cells.
(A) RNA-seq expression heatmap of LINC00261 across 35 cell types/tissues originating from all three germ layers (shown as RPKM + pseudocount). (B) Heatmap showing K-means clustering of 108 differentially expressed genes (DESeq2;>2 fold change (FC), adjusted p-value<0.01) between PP2 cells from control and LINC00261-/- H1 hESCs (based on expression z-score; n = 6 independent differentiations). (C) Top: Genome Browser snap shot of RNA-seq signal at the LINC00261/FOXA2 locus in control and LINC00261-/- PP2 stage cells. Genomic deletions are indicated by gray boxes. Bottom: Bar graphs showing LINC00261 and FOXA2 expression in control and LINC00261-/- PP2 cells quantified by RNA-seq. Data are shown as mean RPKM ± S.D. (n = 6 independent differentiations of four independent KO clones). ****, p-value<0.0001; NS, p-value>0.05; t-test. (D) LINC00261 smRNA FISH in control and LINC00261-/- PP2 cells. Scale bars = 8 µm. Boxed areas (dashed boxes) are shown in higher magnification. (E) qRT-PCR analysis of LINC00261 (top) and INS (bottom) expression in control and LINC00261-sORF-FS H1 hESC clones at the endocrine cell (EC) stage. Data are shown as mean ± S.E.M. (n ≥ 3 independent differentiations for each clone). Individual data points are represented by dots.
Tables
Key resources table
| Reagent type (species) or resource | Designation | Source or reference | Identifiers | Additional information |
|---|---|---|---|---|
| Gene (Homo sapiens) | LINC00617; TUNAR | Ensembl 87 | ENSG00000250366 | |
| Gene (Homo sapiens) | RP11-445F12.1; LHX-DT | Ensembl 87 | ENSG00000250366 | |
| Gene (Homo sapiens) | DIGIT; GSC-DT | HGNC and NCBI RefSeq | HGNC:53074; NCBI RefSeq 108868751 | |
| Gene (Homo sapiens) | GATA6-AS1; GATA6-AS | Ensembl 87 | ENSG00000277268 | |
| Gene (Homo sapiens) | LINC00479 | Ensembl 87 | ENSG00000236384 | |
| Gene (Homo sapiens) | LINC00261; DEANR1; ALIEN; onco-lncRNA-17; lnc-FOXA2-2 | Ensembl 87 | ENSG00000236384 | |
| Gene (Homo sapiens) | RP11-834C11.4 | Ensembl 87 | ENSG00000250742 | |
| Gene (Homo sapiens) | SOX9-AS1 | Ensembl 87 | ENSG00000234899 | |
| Gene (Homo sapiens) | MIR7-3HG | Ensembl 87 | ENSG00000176840 | |
| Gene (Homo sapiens) | LHFPL3-AS2 | Ensembl 87 | ENSG00000225329 | |
| Strain, strain background (Escherichia coli) | Stbl3 | ThermoFisher Scientific | Cat# C737303 | Chemically competent cells |
| Strain, strain background (Escherichia coli) | DH5α | New England Biolabs | Cat# C2987I | Chemically competent cells |
| Cell line (Homo sapiens) | H1 (embryonic stem cells) | WiCell Research Institute | NIHhESC-10–0043, RRID:CVCL_9771 | |
| Cell line (Homo sapiens) | HEK293T (embryonic kidney) | ATCC | Cat# CRL-3216, RRID:CVCL_0063 | |
| Antibody | anti-human OCT-4A (Rabbit monoclonal) | Cell Signaling Technology | Cat# 2890, RRID:AB_2167725 | IF (1:1000) |
| Antibody | anti-human SOX17 (Goat polyclonal) | R and D Systems | Cat# AF1924, RRID:AB_355060 | IF (1:250) |
| Antibody | anti-human FOXA2 (Goat polyclonal) | Santa Cruz Biotechnology | Cat# sc-6554, RRID:AB_2262810 | IF (1:250) |
| Antibody | anti-human GATA6 (Goat polyclonal) | Santa Cruz Biotechnology | Cat# sc-9055, RRID:AB_2108768 | IF (1:50) |
| Antibody | anti-human Insulin (Guinea pig polyclonal) | Dako | Cat# A0564, RRID:AB_10013624 | IF (1:1000) |
| Antibody | Alexa Fluor 488 AffiniPure anti-Goat IgG (Donkey polyclonal) | Jackson ImmunoResearch Labs | Cat# 706-545-148, RRID:AB_2340472 | IF (1:1000) |
| Antibody | Alexa Fluor 488 AffiniPure anti-Rabbit IgG (Donkey polyclonal) | Jackson ImmunoResearch Labs | Cat# 711-545-152, RRID:AB_2313584 | IF (1:1000) |
| Antibody | Cy3 AffiniPure anti-Goat IgG (Donkey polyclonal) | Jackson ImmunoResearch Labs | Cat# 705-165-147, RRID:AB_2307351 | IF (1:1000) |
| Antibody | anti-human Insulin-PE (Rabbit monoclonal) | Cell Signaling Technology | Cat# 8508S, RRID:AB_11179076 | Flow cytometry (1:50) |
| Antibody | anti-human SOX17-PE (Mouse monoclonal) | BD Biosciences | Cat# 561591, RRID:AB_10717121 | Flow cytometry (5 ul per test) |
| Antibody | IgG-PE (Rabbit monoclonal) | Cell Signaling Technology | Cat# 5742S, RRID:AB_10694219 | Flow cytometry isotype control antibody (1:50) |
| Antibody | IgG1, κ antibody (Mouse monoclonal) | BD Biosciences | Cat# 556650, RRID:AB_396514 | Flow cytometry isotype control antibody (1:50) |
| Recombinant DNA reagent | pSpCas9(BB)−2A-Puro (Px459; V2.0) | Feng Zhang | RRID:Addgene_62988 | Cas9 from S. pyogenes with 2A-Puro, and cloning backbone for sgRNA |
| Recombinant DNA reagent | pSpCas9(BB)−2A-GFP (PX458) | Feng Zhang | RRID:Addgene_48138 | Cas9 from S. pyogenes with 2A-EGFP, and cloning backbone for sgRNA |
| Recombinant DNA reagent | pCMVR8.74 | Didier Trono | RRID:Addgene_22036 | 2nd generation lentiviral packaging plasmid |
| Recombinant DNA reagent | pMD2.G | Didier Trono | RRID:Addgene_12259 | VSV-G envelope expressing plasmid |
| Recombinant DNA reagent | pENTR/D-TOPO-LINC00261 | Kurian et al., 2015 (PMID:25739401) | Leo Kurian (University of Cologne) | |
| Recombinant DNA reagent | pRRLSIN.cPPT.PGK-GFP.WPRE | Didier Trono | RRID:Addgene_12252 | 3rd generation lentiviral backbone |
| Recombinant DNA reagent | pRRLSIN.cPPT.PGK-LINC00261.WPRE | This paper | Transient (transfection) or stable (lentiviral integration) expression of wild type LINC00261 | |
| Recombinant DNA reagent | pRRLSIN.cPPT.PGK-ΔATGsORF1-7 LINC00261.WPRE | This paper | Transient (transfection) or stable (lentiviral integration) expression of ΔATGsORF1-7 LINC00261 | |
| Recombinant DNA reagent | pRRLSIN.cPPT.PGK-LINC00261-sORF1-GFP.WPRE | This paper | Transient (transfection) or stable (lentiviral integration) expression of LINC00261-sORF1-GFP fusion protein | |
| Recombinant DNA reagent | pRRLSIN.cPPT.PGK-LINC00261-sORF2-GFP.WPRE | This paper | Transient (transfection) or stable (lentiviral integration) expression of LINC00261-sORF2-GFP fusion protein | |
| Recombinant DNA reagent | pRRLSIN.cPPT.PGK-LINC00261-sORF3-GFP.WPRE | This paper | Transient (transfection) or stable (lentiviral integration) expression of LINC00261-sORF3-GFP fusion protein | |
| Recombinant DNA reagent | pRRLSIN.cPPT.PGK-LINC00261-sORF4-GFP.WPRE | This paper | Transient (transfection) or stable (lentiviral integration) expression of LINC00261-sORF4-GFP fusion protein | |
| Recombinant DNA reagent | pRRLSIN.cPPT.PGK-LINC00261-sORF5-GFP.WPRE | This paper | Transient (transfection) or stable (lentiviral integration) expression of LINC00261-sORF5-GFP fusion protein | |
| Recombinant DNA reagent | pRRLSIN.cPPT.PGK-LINC00261-sORF6-GFP.WPRE | This paper | Transient (transfection) or stable (lentiviral integration) expression of LINC00261-sORF6-GFP fusion protein | |
| Recombinant DNA reagent | pRRLSIN.cPPT.PGK-LINC00261-sORF7-GFP.WPRE | This paper | Transient (transfection) or stable (lentiviral integration) expression of LINC00261-sORF7-GFP fusion protein | |
| Recombinant DNA reagent | pRRLSIN.cPPT.PGK-LINC00261-sORF3-FS-GFP.WPRE | This paper | LINC00261-sORF3-frameshift-GFP control plasmid | |
| Recombinant DNA reagent | pRRLSIN.cPPT.PGK-LINC00261-sORF2-STOP-GFP.WPRE | This paper | LINC00261-sORF2-STOP-GFP control plasmid | |
| Recombinant DNA reagent | pRRLSIN.cPPT.PGK-RP11-834C11.4-sORF-GFP.WPRE | This paper | Transient (transfection) or stable (lentiviral integration) expression of RP11-834C11.4-sORF-GFP fusion protein | |
| Recombinant DNA reagent | pRRLSIN.cPPT.PGK-RP11-834C11.4-sORF-FLAG.WPRE | This paper | Transient (transfection) or stable (lentiviral integration) expression of RP11-834C11.4-sORF-FLAG fusion protein | |
| Recombinant DNA reagent | pRRLSIN.cPPT.PGK-MIR7-3HG-sORF-GFP.WPRE | This paper | Transient (transfection) or stable (lentiviral integration) expression of MIR7-3HG-sORF-GFP fusion protein | |
| Recombinant DNA reagent | pRRLSIN.cPPT.PGK-RP11-LHFPL3-AS2-sORF-GFP.WPRE | This paper | Transient (transfection) or stable (lentiviral integration) expression of LHFPL3-AS2-sORF-GFP fusion protein | |
| Peptide, recombinant protein | Activin A | R and D Systems | Cat# 338-AC/CF | |
| Peptide, recombinant protein | Wnt3a | R and D Systems | Cat# 1324-WN-010 | |
| Peptide, recombinant protein | KGF/FGF7 | R and D Systems | Cat# 251 KG | |
| Peptide, recombinant protein | Noggin | R and D Systems | Cat# 3344 NG-050 | |
| Commercial assay or kit | RNeasy Mini Kit | QIAGEN | Cat# 15596018 | |
| Commercial assay or kit | RNA Clean and Concentrator−25 | Zymo Research | Cat# R1018 | |
| Commercial assay or kit | Paris Kit | Thermo Fisher Scientific | Cat# AM1921 | |
| Commercial assay or kit | RNase-Free DNase Set (50) | QIAGEN | Cat# 79254 | |
| Commercial assay or kit | TURBO DNA-free Kit | Thermo Fisher Scientific | Cat# AM1907 | |
| Commercial assay or kit | TruSeq Ribo Profile (Mammalian) Library Prep Kit | Illumina | Cat# RPYSC12116 | |
| Commercial assay or kit | TruSeq Stranded mRNA Library Prep | Illumina | Cat# 20020594 | |
| Commercial assay or kit | TruSeq Stranded Total RNA Library Prep Gold | Illumina | Cat# 20020599 | |
| Commercial assay or kit | KAPA mRNA HyperPrep Kit | Roche | Cat# KK8581 | |
| Commercial assay or kit | High Sensitivity D1000 ScreenTape | Agilent Technologies | Cat# 5067–5584 | |
| Commercial assay or kit | RNA ScreenTape | Agilent Technologies | Cat# 5067–5576 | |
| Commercial assay or kit | RNA ScreenTape Sample Buffer | Agilent Technologies | Cat# 5067–5577 | |
| Commercial assay or kit | RNA ScreenTape Ladder | Agilent Technologies | Cat# 5067–5578 | |
| Commercial assay or kit | Qubit ssDNA assay kit | Thermo Fisher Scientific | Cat# Q10212 | |
| Commercial assay or kit | KOD Xtreme DNA Hotstart Polymerase | Millipore | Cat# 71975 | |
| Commercial assay or kit | GoTaq Green Master Mix | Promega | Cat# M7123 | |
| Commercial assay or kit | TOPO TA Cloning Kit | Thermo Fisher Scientific | Cat# K452001 | |
| Commercial assay or kit | Monarch Plasmid Miniprep Kit | NEB | Cat# T1010L | |
| Commercial assay or kit | MinElute PCR Purification Kit | QIAGEN | Cat# 28006 | |
| Commercial assay or kit | iScript cDNA Synthesis Kit | Bio-Rad | Cat# 1708890 | |
| Commercial assay or kit | iQ SYBR Green Supermix | Bio-Rad | Cat# 1708880 | |
| Commercial assay or kit | Human Stem Cell Nucleofector Kit 2 | Lonza | Cat# VPH-5022 | |
| Commercial assay or kit | XtremeGene 9 DNA Transfection Reagent | Sigma-Aldrich | Cat# 06365779001 | |
| Commercial assay or kit | Cytofix/Cytoperm W/Golgi Stop Kit | BD Biosciences | Cat# 554715 | |
| Commercial assay or kit | Insulin ELISA Jumbo | Alpco | Cat# 80-INSHU-E10.1 | |
| Commercial assay or kit | Pierce BCA Protein Assay Kit | Thermo Fisher Scientific | Cat# 23227 | |
| Commercial assay or kit | TnT Coupled Wheat Germ Extract System | Promega | Cat# L4130 | |
| Chemical compound, drug | Penicillin-Streptomycin | Thermo Fisher Scientific | Cat# 15140122 | |
| Chemical compound, drug | Puromycin dihydrochloride | Sigma-Aldrich | Cat# P8833 | |
| Chemical compound, drug | ALK5 Inhibitor II | Enzo Life Sciences | Cat# ALX-270–445 | |
| Chemical compound, drug | Retinoic Acid | Sigma-Aldrich | Cat# R2625 | |
| Chemical compound, drug | Ascorbic Acid | Sigma-Aldrich | Cat# A4403-100MG | |
| Chemical compound, drug | LDN-193189 | Stemgent | Cat# 04–0074 | |
| Chemical compound, drug | SANT-1 | Sigma-Aldrich | Cat# S4572 | |
| Chemical compound, drug | TPB | Calbiochem | Cat# 565740 | |
| Chemical compound, drug | TGFβ R1 kinase inhibitor IV | EMD Biosciences | Cat# 616454 | |
| Chemical compound, drug | KAAD-Cyclopamine | Toronto Research Chemicals | Cat# K171000 | |
| Chemical compound, drug | TTNPB | Sigma-Aldrich | Cat# T3757 | |
| Chemical compound, drug | Cycloheximide | Sigma-Aldrich | Cat# C7698 | |
| Chemical compound, drug | Actinomycin D | Sigma-Aldrich | Cat# A9415 | |
| Chemical compound, drug | Polyethylenimine (PEI) | Polysciences | Cat# 23966–1 | |
| Chemical compound, drug | Hoechst 33342, Trihydrochloride, Trihydrate | Thermo Fisher Scientific | Cat# H3570 | |
| Chemical compound, drug | MitoSOX Red | Thermo Fisher Scientific | Cat# M36008 | |
| Chemical compound, drug | D-(+)-Glucose Solution, 45% | Sigma-Aldrich | Cat# G8769 | |
| Chemical compound, drug | Sodium Bicarbonate | Sigma-Aldrich | Cat# NC0564699 | |
| Chemical compound, drug | ROCK Inhibitor Y-27632 | STEMCELL Technologies | Cat# 72305 | |
| Software, algorithm | Flowjo-v10 | FlowJo, LLC | RRID:SCR_008520 | http://www.flowjo.com/download-newest-version/ |
| Software, algorithm | STAR 2.5.3a | Dobin et al., 2013 | RRID:SCR_015899 | https://github.com/alexdobin/STAR |
| Software, algorithm | Bowtie 1.1.1 | Langmead et al., 2009 | RRID:SCR_005476 | http://bowtie-bio.sourceforge.net/index.shtml |
| Software, algorithm | Cufflinks 2.2.1 | Trapnell et al., 2010 | RRID:SCR_014597 | https://github.com/cole-trapnell-lab/cufflinks |
| Software, algorithm | HTSeq 0.6.1 | Anders et al., 2015 | RRID:SCR_005514 | https://htseq.readthedocs.io/en/master/install.html |
| Software, algorithm | DEseq2 1.10.1 | Love et al., 2014 | RRID:SCR_015687 | https://www.bioconductor.org/packages/devel/bioc/html/DESeq2.html |
| Software, algorithm | RiboTaper | Calviello et al., 2016 | RRID:SCR_018880 | https://ohlerlab.mdc-berlin.de/software/RiboTaper_126/ |
| Software, algorithm | R 3.5.0 | RRID:SCR_001905 | https://cran.r-project.org/ | |
| Software, algorithm | SAMtools 1.3 | Li et al., 2009 | RRID:SCR_002105 | https://github.com/samtools/samtools |
| Software, algorithm | BEDTools 2.17.0 | Quinlan and Hall, 2010 | RRID:SCR_006646 | https://bedtools.readthedocs.io/en/latest/content/installation.html |
| Software, algorithm | HOMER 4.10 | Heinz et al., 2010 | RRID:SCR_010881 | http://homer.ucsd.edu/homer/download.html |
| Software, algorithm | GREAT 3.0.0 | McLean et al., 2010 | RRID:SCR_005807 | http://great.stanford.edu/public/html/ |
| Software, algorithm | Adobe Illustrator CS5 | Adobe | RRID:SCR_010279 | |
| Software, algorithm | Adobe Photoshop CS5 | Adobe | RRID:SCR_014199 | |
| Software, algorithm | GraphPad Prism v7.05 | GraphPad Software, LLC | RRID:SCR_002798 | |
| Other | Novex 16% Tricine Protein Gel | Thermo Fisher Scientific | Cat# EC66955BOX | |
| Other | Novex Tricine SDS Sample Buffer (2X) | Thermo Fisher Scientific | Cat# LC1676 | |
| Other | Immobilon-PSQ PVDF Membrane | Merck Millipore | Cat# ISEQ00010 | |
| Other | Stellaris RNA FISH Hybridisation Buffer | LGC Biosearch Technologies | Cat# SMF-HB1-10 | |
| Other | Stellaris RNA FISH Wash Buffer A | LGC Biosearch Technologies | Cat# SMF-WA1-60 | |
| Other | Stellaris RNA FISH Wash Buffer B | LGC Biosearch Technologies | Cat# SMF-WB1-20 | |
| Other | QuickExtract DNA Extraction Solution | Lucigen | Cat# QE09050 | |
| Other | Vectashield Antifade Mounting Medium | Vector Laboratories | Cat# H-1000 | |
| Other | FastDigest BpiI | Thermo Fisher Scientific | Cat# FD1014 | |
| Other | FastDigest BshTI | Thermo Fisher Scientific | Cat# FERFD1464 | |
| Other | FastDigest SalI | Thermo Fisher Scientific | Cat# FD0644 | |
| Other | TRIzol | Thermo Fisher Scientific | Cat# 15596018 | |
| Other | Matrigel | Corning | Cat# 356231 | |
| Other | GlutaMAX | Thermo Fisher Scientific | Cat# 35050061 | |
| Other | DPBS (without calcium and magnesium) | Corning | Cat# 45000–434 | |
| Other | mTeSR1 Complete Kit - GMP | STEMCELL Technologies | Cat# 85850 | |
| Other | RPMI 1640 Medium, HEPES | Thermo Fisher Scientific | Cat# 22400–089 | |
| Other | DMEM/F12 with L-Glutamine, HEPES | Corning | Cat# 45000–350 | |
| Other | Dulbecco’s Modified Eagle’s Medium | Corning | Cat# 45000–312 | |
| Other | HyClone Dulbecco’s Modified Eagles Medium | Thermo Fisher Scientific | Cat# SH30081.FS | |
| Other | MCDB 131 | Thermo Fisher Scientific | Cat# 10372–019 | |
| Other | Opti-MEM Reduced Serum Medium | Thermo Fisher Scientific | Cat# 31985062 | |
| Other | Insulin-Transferrin-Selenium-Ethanolamine (ITS-X) (100X) | Thermo Fisher Scientific | Cat# 51500–056 | |
| Other | B-27 Supplement (50X) | Thermo Fisher Scientific | Cat# 17504044 | |
| Other | Bovine Albumin Fraction V (7.5%) | Thermo Fisher Scientific | Cat# 15260037 | |
| Other | Fetal Bovine Serum | Corning | Cat# 35011CV | |
| Other | Donkey Serum | Gemini Bio-Products | Cat# 100-151/500 | |
| Other | Fatty Acid-Free BSA | Proliant Biologicals | Cat# 68700 | |
| Other | Accutase | eBioscience | Cat# 00-4555-56 |
Additional files
Download links
A two-part list of links to download the article, or parts of the article, in various formats.
Downloads (link to download the article as PDF)
Open citations (links to open the citations from this article in various online reference manager services)
Cite this article (links to download the citations from this article in formats compatible with various reference manager tools)
A human ESC-based screen identifies a role for the translated lncRNA LINC00261 in pancreatic endocrine differentiation
eLife 9:e58659.
https://doi.org/10.7554/eLife.58659


