Identification of functionally distinct macrophage subpopulations in Drosophila
- Department of Biomedical Science and the Bateson Centre, University of Sheffield, United Kingdom
- Department of Infection, Immunity and Cardiovascular Disease and the Bateson Centre, University of Sheffield, United Kingdom
Figures
Figure 1
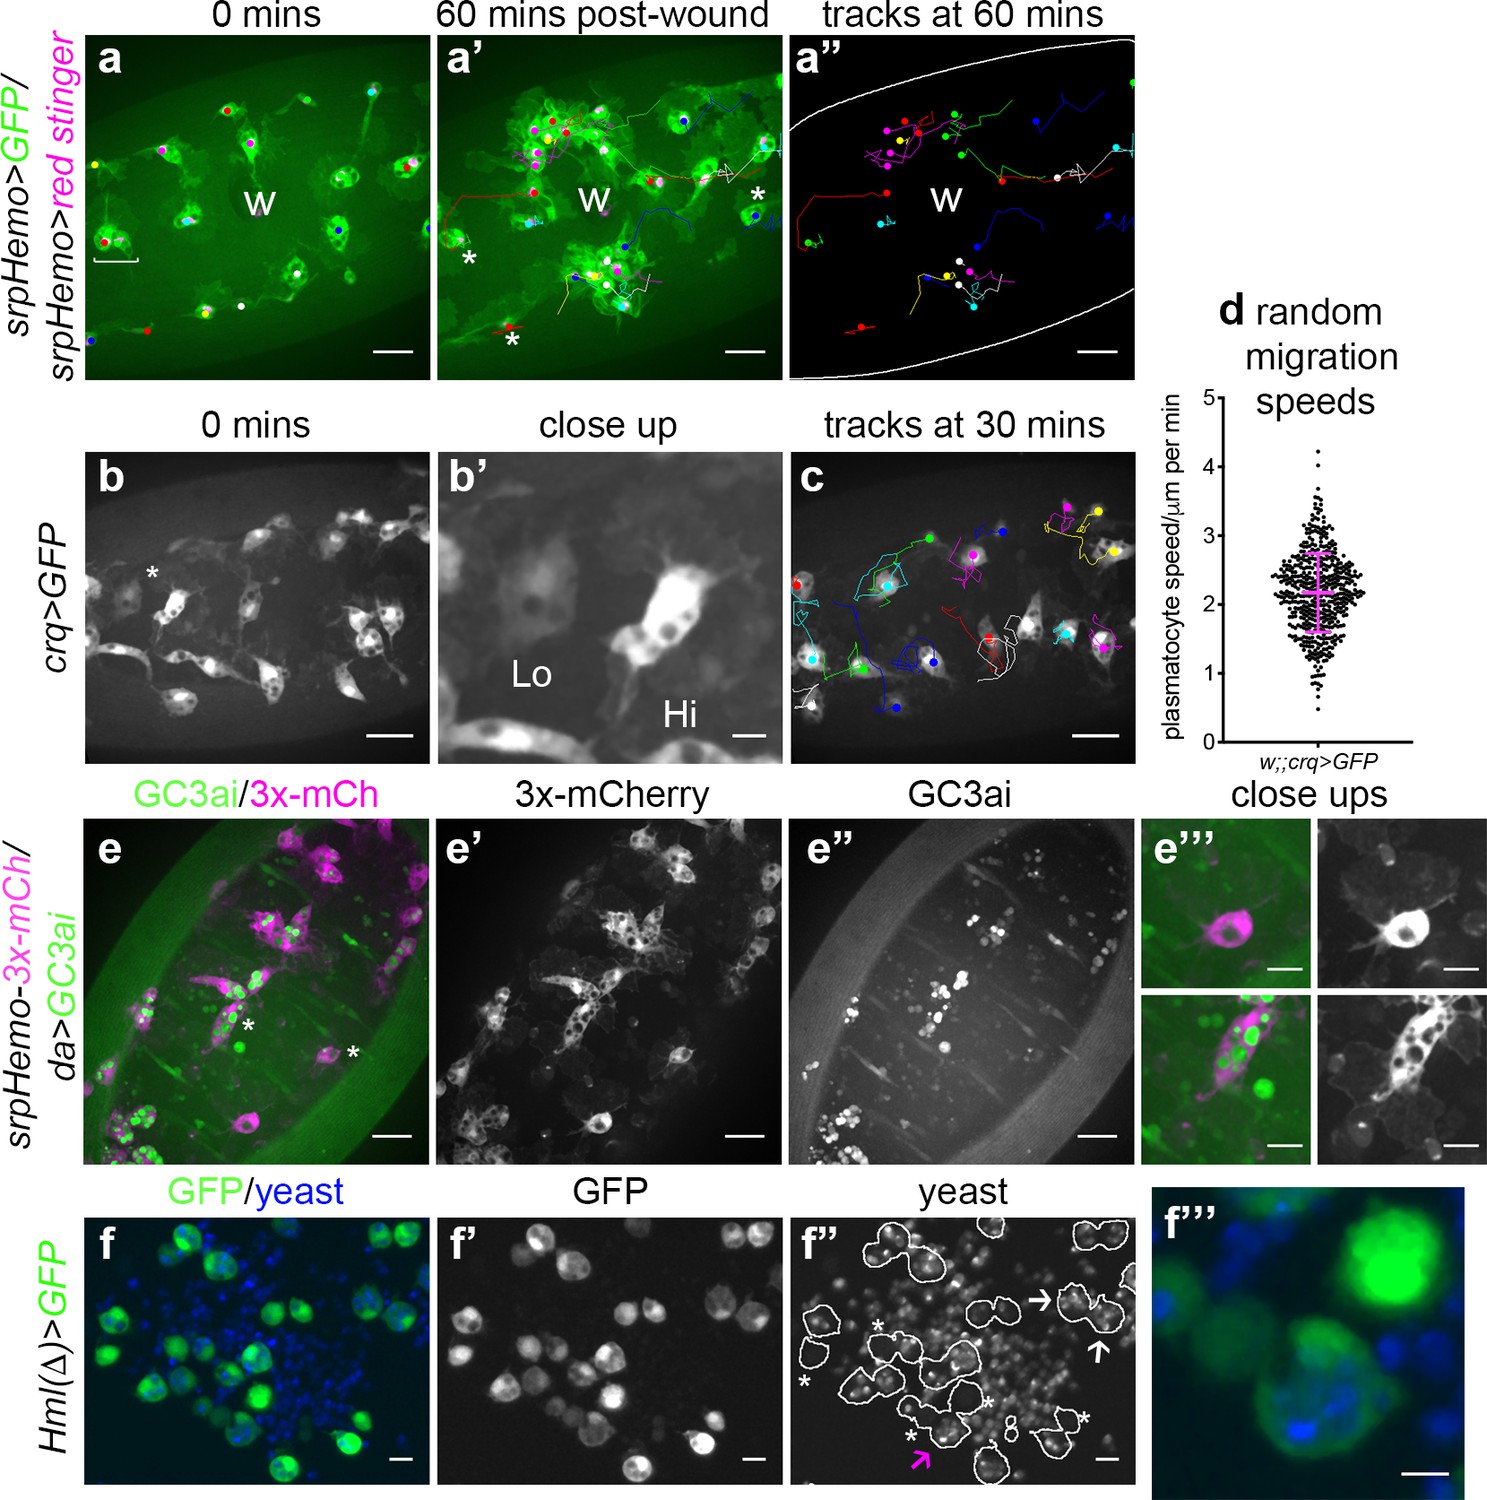
Heterogeneity of Drosophila embryonic plasmatocyte responses.
(a) GFP (green) and nuclear red stinger (magenta) labelled plasmatocytes on the ventral side of a stage 15 embryo at 0 min (a) and 60 min post-wounding (a’); plasmatocyte tracks at each timepoint are overlaid (a–a’) or shown in full (a’’). Examples of plasmatocytes failing to respond to the wound (w) indicated via asterisks; square bracket (a) indicates neighbouring plasmatocytes, one of which responds to wounding, while the other fails to respond (see Video 1). (b) Imaging of plasmatocytes labelled using crq-GAL4 to drive expression of GFP reveals a wide range in levels of crq promoter activity within plasmatocytes at stage 15; (b’) Close-up of cells marked by an asterisk in (b). (c) Overlay of plasmatocyte tracks of cells shown in (b) showing significant variation in their random migration speeds. (d) Scatterplot of plasmatocyte random migration speeds (taken from 23 embryos); line and error bars show mean and standard deviation, respectively. (e) Imaging the ventral midline at stage 15 shows a wide range in the amount of apoptotic cell clearance (green in merge; labelled via the caspase-sensitive reporter GC3ai) undertaken by plasmatocytes (magenta in merge, labelled via srpHemo-3x-mCherry reporter); (e’–e’’) mCherry and GC3ai channels; (e’’’) close-ups of cells devoid/full of engulfed GC3ai particles (indicated by asterisks in (e)). (f) Larval hemocytes (green in merge, labelled via Hml(Δ)-GAL4-driven expression of GFP) exhibit a range in their capacities to engulf calcofluor-labelled yeast (blue in merge) in vitro; (f’–f’’) GFP and yeast channels; white lines indicate cell edges in (f’’); asterisks in (f’’) indicate cells that have failed to phagocytose yeast; white arrows in (f’’) indicate cells that have phagocytosed multiple yeast particles; magenta arrow in (f’’) indicates close-up of region indicated in (f’’’). Scale bars represent 20 μm (a–a’’, b, c, e–e’’), 10 μm (e’’’, f–f’’), or 5 μm (b’, f’’’). See Supplementary file 1 for full list of genotypes.
-
Figure 1—source data 1
Numerical data used to plot panel (d) of Figure 1.
- https://cdn.elifesciences.org/articles/58686/elife-58686-fig1-data1-v1.csv
Figure 2 with 2 supplements
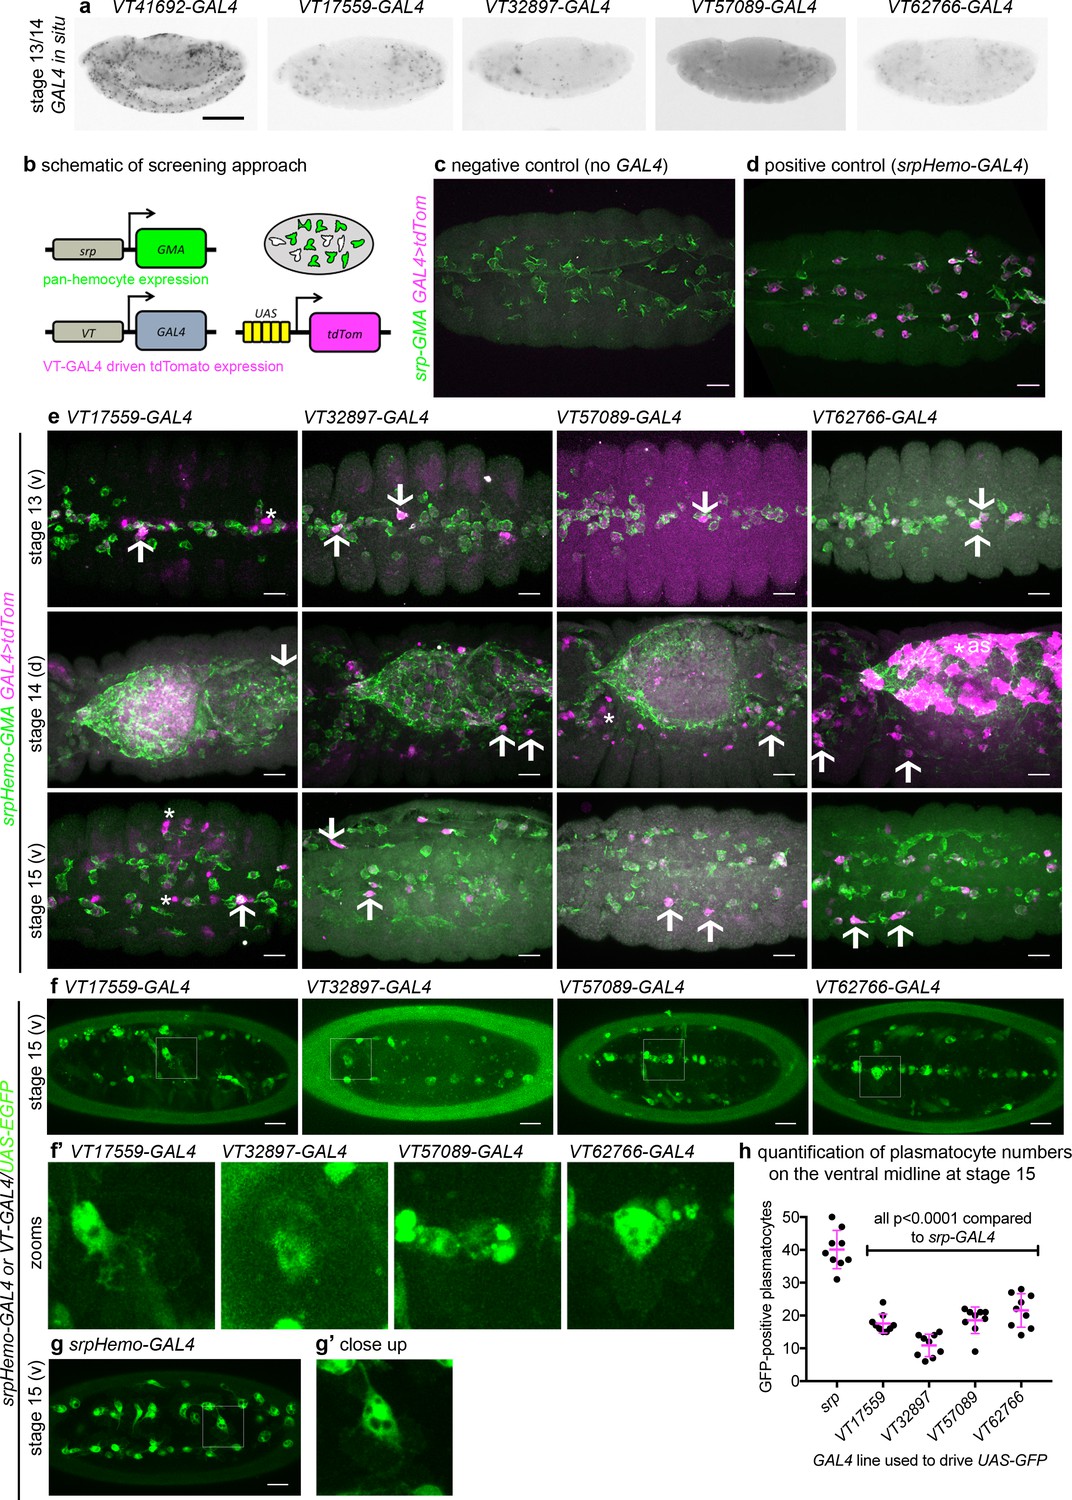
Identification of enhancers labelling discrete plasmatocyte subpopulations in Drosophila.
(a) Lateral views of stage 13/14 embryos with in situ hybridisation performed for GAL4 for indicated VT-GAL4 lines (anterior is left). Taken with permission from http://enhancers.starklab.org/ (n.b. these images are not covered by the CC-BY 4.0 licence and further reproduction of this panel would need permission from the copyright holder); VT41692-GAL4 represents an example in which the majority of plasmatocytes are labelled. (b) Schematic diagram showing screening approach to identify subpopulations of plasmatocytes: VT-GAL4-positive plasmatocytes will express both GMA (green) and tdTomato (magenta) – white cells in the schematic. (c–d) Images showing the ventral midline at stage 14 of negative control (no driver; w;UAS-tdTom/+;srpHemo-GMA) and positive control (w;srpHemo-GAL4/UAS-tdTom;srpHemo-GMA) embryos. (e) Images showing embryos containing VT-GAL4-labelled cells (via UAS-tdTomato, shown in magenta) at stage 13 (first row, ventral views), stage 14 (second row, dorsal views), and stage 15 (third row, ventral views). The entire hemocyte population is labelled via srpHemo-GMA (green); arrows indicate examples of VT-GAL4-positive plasmatocytes; asterisks indicate VT-GAL4-positive cells that are not labelled by srpHemo-GMA. N.b. VT62766-GAL4 image contrast enhanced to different parameters compared to other images owing to the very bright labelling of amnioserosal cells (cells on dorsal side of embryo destined to be removed during dorsal closure; labelled with an asterisk) in the stage 14 image. (f) Labelling of smaller numbers of plasmatocytes on the ventral midline at stage 15 using VT-GAL4 lines indicated and UAS-GFP (green); boxed regions show close-ups of VT-GAL4-positive plasmatocytes (f’). (g) Ventral view of positive control embryo (w;srpHemo-GAL4,UAS-GFP) and example plasmatocyte (g’) at stage 15. (h) Scatterplot showing numbers plasmatocytes labelled using VT-GAL4 lines to drive expression from UAS-GFP on the ventral midline at stage 15; lines and error bars represent mean and standard deviation, respectively. p-Values calculated via one-way ANOVA with a Dunnett’s multiple comparison post-test (all compared to srpHemo-GAL4 control); n = 9 embryos per genotype. Scale bars represent 150 μm (a) or 10 μm (c–g). See Supplementary file 1 for full list of genotypes; overlap of VT enhancer expression with known plasmatocyte markers can be found in Figure 2—figure supplements 1 and 2.
-
Figure 2—source data 1
Numerical data used to plot panel (h) of Figure 2.
- https://cdn.elifesciences.org/articles/58686/elife-58686-fig2-data1-v1.csv
Figure 2—figure supplement 1

Subpopulation cells do not express eater in the embryo.
(a–b) Maximum projections of the ventral surface of a negative control embryo (a) and an embryo containing eater-GFP and VT17559-RFP (b). Left-hand panels show GFP channel (green in merge); central panels show RFP channel (magenta in merge); right-hand panels show merged images. (c) Single z-slice taken from the z-series used to construct projection shown in (b) in order to confirm lack of eater expression in subpopulation cells. Scale bars represent 20 μm. See Supplementary file 1 for full list of genotypes.
Figure 2—figure supplement 2
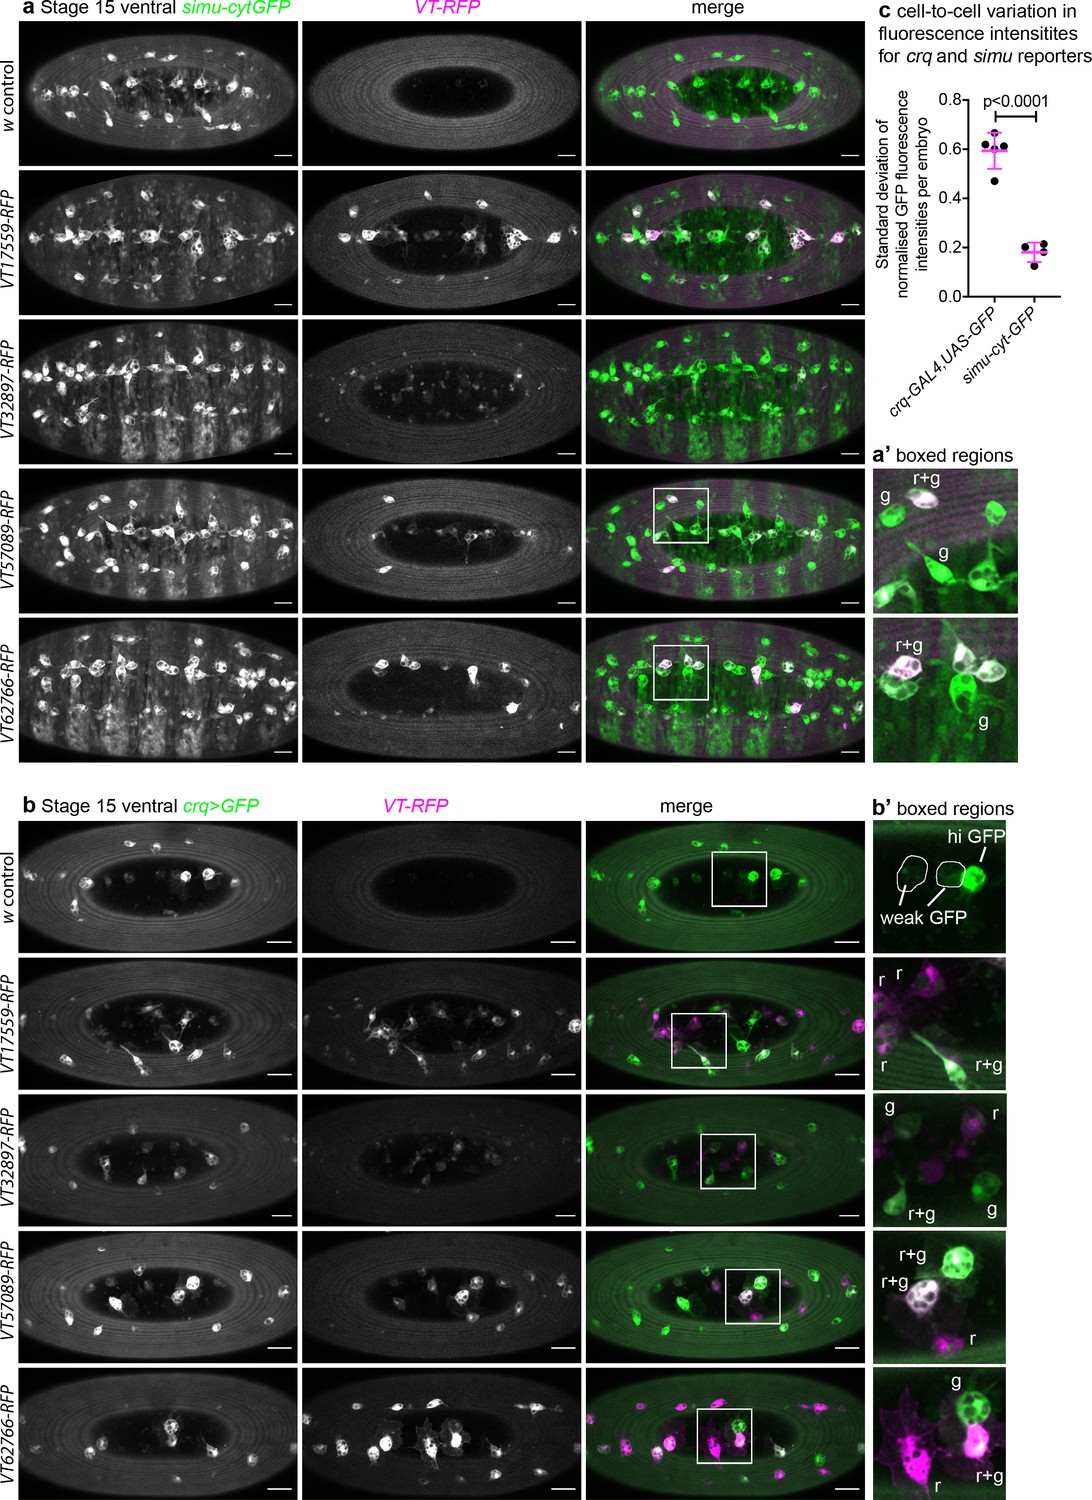
crq and simu do not specifically mark subpopulation cells in the developing embryo.
(a–b) Maximum projections of the ventral surface of embryos containing VT-RFP and either simu-cytGFP (a) or crq-GAL4,UAS-GFP (b). Left-hand panels show simu-cytGFP (a, green in merge) or crq-GAL4,UAS-GFP (b, green in merge); central panels show RFP channel (magenta in merge); right-hand panels show merged images. (a’–b’) show enlarged regions indicated by white boxes in merged images; ‘r’, ‘g’, and ‘r+g’ denote cells expressing RFP only, GFP only or both fluorophores, respectively; w1118 embryos without a VT-RFP transgene used as negative control; scale bars denote 20 μm. (c) Scatterplot of the standard deviation of normalised GFP fluorescence intensity per plasmatocyte, per embryo in controls containing crq-GAL4,UAS-GFP or simu-cytGFP. Lines and error bars show mean and standard deviation, respectively; n = 5 and 4 embryos for simu-cytGFP and crq-GAL4,UAS-GFP, respectively; p<0.0001 via Student’s t-test. See Supplementary file 1 for full list of genotypes.
-
Figure 2—figure supplement 2—source data 1
Numerical data used to plot panel (c) of Figure 2—figure supplement 2.
- https://cdn.elifesciences.org/articles/58686/elife-58686-fig2-figsupp2-data1-v1.csv
Figure 3 with 1 supplement

Plasmatocyte subpopulations are present in large numbers in L1 and L2 larvae.
(a–b) Images of L1 (a) and L2 larvae (b) with cells labelled using the split GAL4 system (srpHemo-AD in combination with srpHemo-DBD or the VT-DBD transgene indicated) to drive expression from UAS-stinger. Scale bars represent 150 μm; white lines show edge of the larva; images contrast enhanced to 0.3% saturation. (c) Scatterplot showing numbers of Stinger-positive cells labelled via the split GAL4 system per larva; numbers of cells were quantified from flattened L1 larvae. w1118;UAS-stinger/+ larvae were used as negative controls; all conditions are significantly different compared to the positive control (w1118;srpHemo-AD/UAS-stinger;srpHemo-DBD/+) via a one-way ANOVA with a Dunnett’s multiple comparison post-test: srp vs w, p<0.0001; srp vs VT17559 p<0.0001; srp vs VT32897, p=0.0013; srp vs VT57089, p=0.0029; srp vs VT62766, p=0.0047; n = 5 for w control, srp, VT17559, VT32897, and VT57089 and n = 6 for VT62766. See Supplementary file 1 for full list of genotypes; a schematic and validation of this split GAL4 approach in the embryo can be found in Figure 3—figure supplement 1.
-
Figure 3—source data 1
Numerical data used to plot panel (c) of Figure 3.
- https://cdn.elifesciences.org/articles/58686/elife-58686-fig3-data1-v1.csv
Figure 3—figure supplement 1
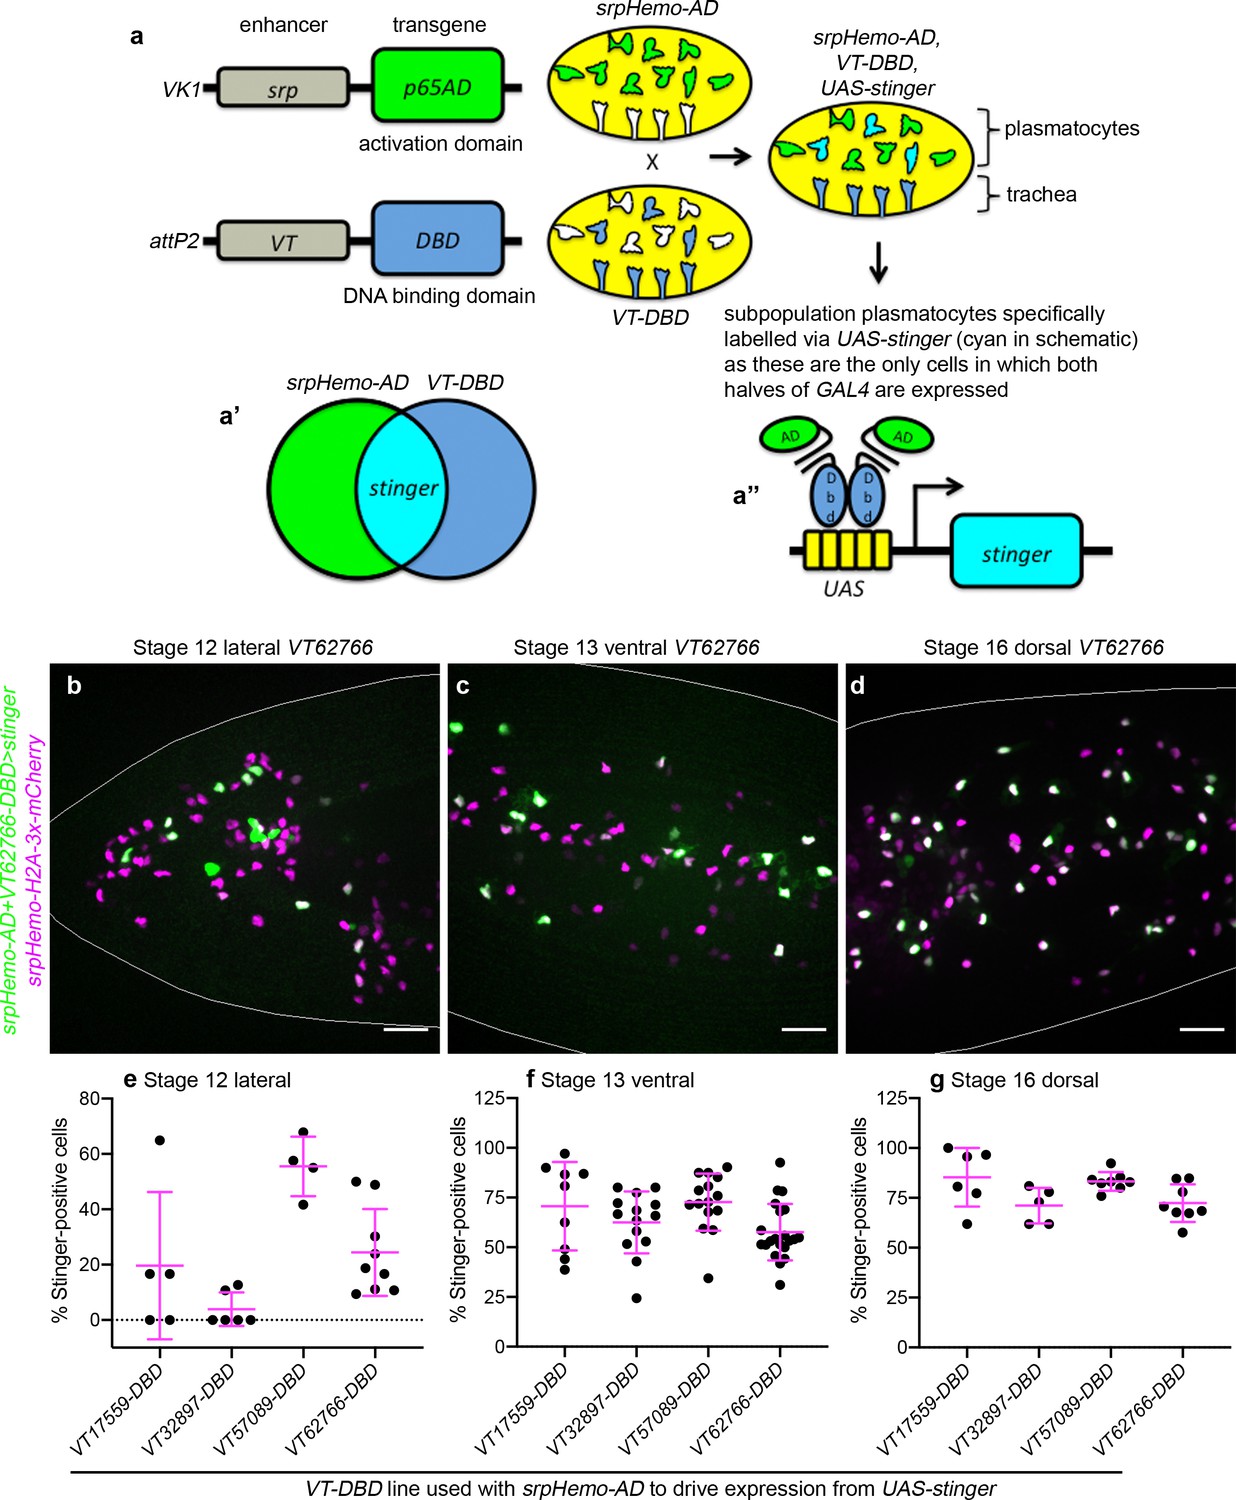
Using a split GAL4 approach to label plasmatocyte subpopulations.
(a) SrpHemo-AD and VT-DBD transgenic flies were generated: srpHemo-AD drives expression of the activation domain (AD) of GAL4 in all hemocytes (green), while VT enhancers drive expression of the DNA-binding domain (DBD) of GAL4 in a subpopulation of plasmatocytes and, in the case of some VT enhancers, other cell types (dark blue). (a’–a’’) Intersection of these expression patterns leads to the presence of both halves of GAL4 (cyan) solely within those cells in which both srp and VT enhancer regions are active (a’’). This approach restricts activation of transgenes under UAS control (e.g. UAS-stinger) to those cells that are double-positive for both srp and VT enhancer expression, ensuring expression is more specific to plasmatocyte subpopulations. (b–d) Maximum projections of live embryos containing srpHemo-H2A-3x-mCherry (all hemocytes, purple) and UAS-Stinger (green) driven via the split GAL4 system (srpHemo-AD in combination with the appropriate VT-DBD) at stages and orientations indicated. White lines show edges of the embryo; overlap of nuclear markers appears white; scale bars represent 20 μm. (e–g) Scattergraphs showing quantification of percentage of srpHemo-H2A-3x-mCherry-positive cells that are positive for Stinger expression in lateral regions of the head at stage 12 (e), on the ventral midline at stage 13 (f) and on the dorsal side of the embryo at stage 16 (g). See Supplementary file 1 for full list of genotypes.
-
Figure 3—figure supplement 1—source data 1
Numerical data used to plot panel (e) of Figure 3—figure supplement 1.
- https://cdn.elifesciences.org/articles/58686/elife-58686-fig3-figsupp1-data1-v1.csv
-
Figure 3—figure supplement 1—source data 2
Numerical data used to plot panel (f) of Figure 3—figure supplement 1.
- https://cdn.elifesciences.org/articles/58686/elife-58686-fig3-figsupp1-data2-v1.csv
-
Figure 3—figure supplement 1—source data 3
Numerical data used to plot panel (g) of Figure 3—figure supplement 1.
- https://cdn.elifesciences.org/articles/58686/elife-58686-fig3-figsupp1-data3-v1.csv
Figure 4 with 1 supplement
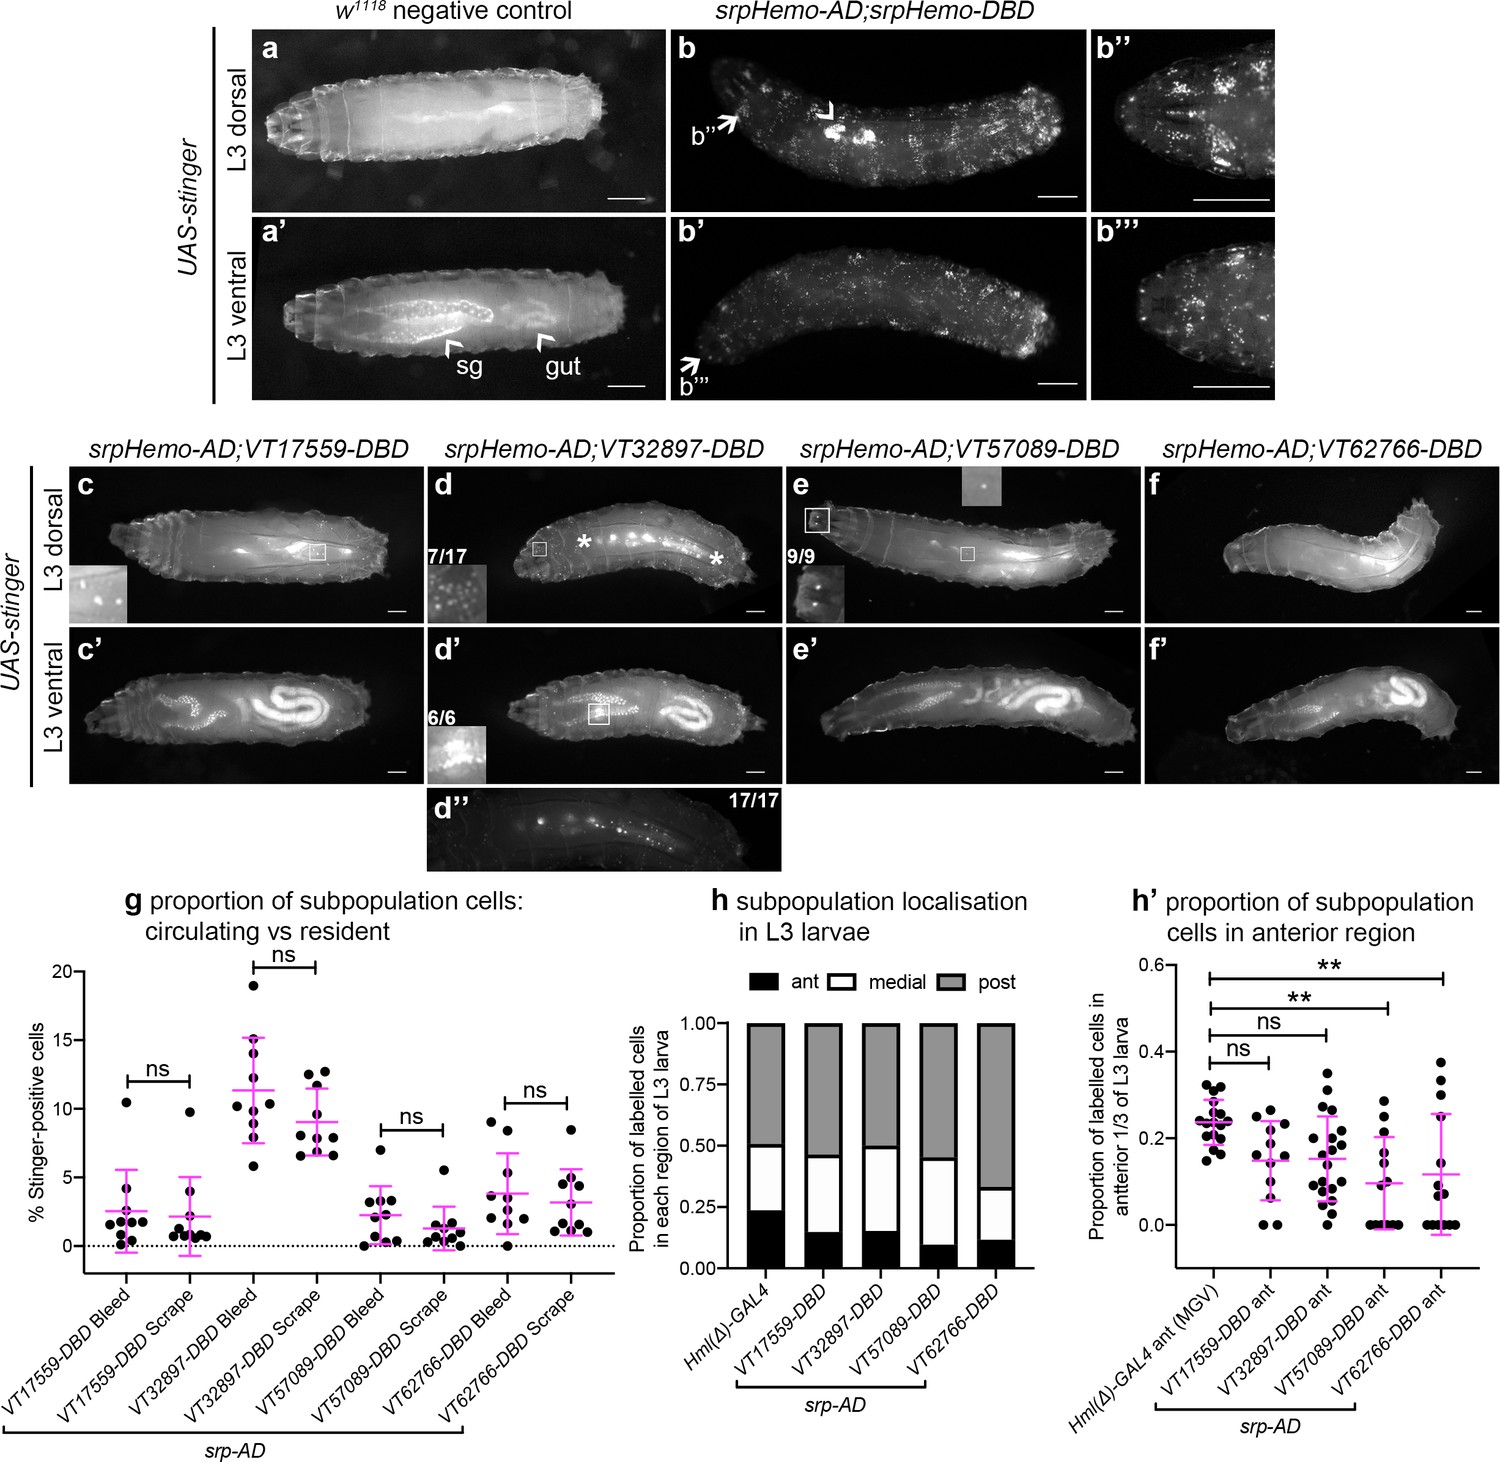
Plasmatocyte subpopulations are greatly reduced in L3 larvae but exhibit distinctive localisations.
(a–f) Dorsal and ventral views of negative control L3 larvae (a, no GAL4), positive control L3 larvae with hemocytes labelled via serpent (b, UAS-stinger driven by srpHemo-AD;srpHemo-DBD) and L3 larvae containing cells labelled through expression of UAS-stinger via srpHemo-AD and the VT-DBD transgenes indicated (c–f). Arrowheads indicate non-specific expression of Stinger in salivary glands and gut (a’ – also visible in dorsal images (c’–f’) but not labelled) and possible proventricular region hemocytes/garland cells (b); arrows (b, b') indicate regions shown in close-ups of potential hemocyte population in the head region (b’’) and in the Bolwig organ (b’’’); boxes indicate individual hemocytes (c, e) and labelling in the head region (d), proventriculus/of Garland cells (d'), and Bolwig organ (e) shown at enhanced magnification in inset panels; asterisks in (d) denote region shown as a close-up and at a reduced brightness in (d’’) in order to reveal detail of cells along the dorsal vessel; fractions indicate the number of larvae exhibiting a particular localisation out of the total imaged. (g) Scatterplot showing the proportion of subpopulation cells labelled via the split GAL4 system in circulation (initial bleed) compared to the proportions in resident/adhered populations (scraping of the carcass) in the indicated genotypes. Proportions obtained via each method compared via Student’s t-test (n = 10 larvae per genotype; p=0.77 (VT17559), p=0.13 (VT32897), p=0.27 (VT57089), p=0.60 (VT62766)). (h) Bar chart showing the relative proportions of labelled cells found within the anterior, medial or posterior 1/3 of L3 larvae using Hml(Δ)-GAL4 to drive EGFP or the split GAL4 system to express Stinger in all larval hemocytes or subpopulations, respectively (n = 17, 12, 20, 13, 14 larvae). (h’) Scatterplot of the proportions of cells found within the anterior region of L3 larvae for controls and split GAL4 lines. Kruskall-Wallis test with Dunn’s multiple comparisons test was used to compare subpopulation values with Hml(Δ)-GAL4 control; (p=0.11 (VT17559), p=0.061 (VT32897), p=0.0018 (VT57089), p=0.0063 (VT62766)). Scale bars represent 500 μm (a–f); larval images contrast enhanced to 0.3% saturation (a–f); lines and error bars represent mean and standard deviation, respectively (g, h’); bars represent mean (h); ns and ** denote not significant and p<0.01, respectively. See Supplementary file 1 for full list of genotypes; see Figure 4—figure supplement 1 for quantification of numbers of subpopulation cells labelled using the original VT-GAL4 lines and lineage tracing of subpopulation cells via G-TRACE.
-
Figure 4—source data 1
Numerical data used to plot panel (g) of Figure 4.
- https://cdn.elifesciences.org/articles/58686/elife-58686-fig4-data1-v1.csv
-
Figure 4—source data 2
Numerical data used to plot panels (h) and (h’) of Figure 4.
- https://cdn.elifesciences.org/articles/58686/elife-58686-fig4-data2-v1.csv
Figure 4—figure supplement 1
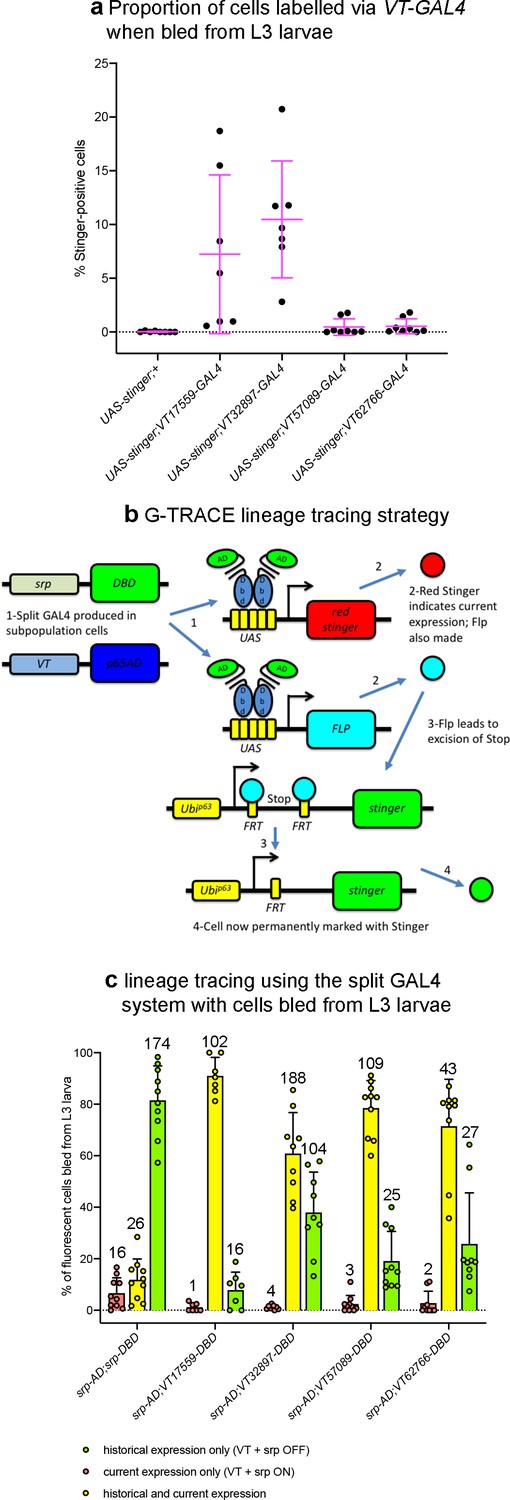
Lineage tracing shows reprogramming of subpopulation cells in L3 larvae.
(a) Scatterplot showing proportion of cells that can be labelled via VT-GAL4 (using UAS-stinger as a reporter) when bled from L3 larvae (i.e. labelled independently of a requirement for serpent expression); larvae containing UAS-stinger, but without a driver were used as a negative control. Each point represents a dissected larva (n = 8, 7, 7, 8 and 8, from left to right for indicated genotypes). Lines and error bars represent mean and standard deviation, respectively; genotypes were as follows: w;UAS-stinger, w;UAS-stinger;VT-GAL4. (b) Schematic use of G-TRACE system to lineage trace subpopulations in concert with split GAL4 transgenics. (c) Grouped bar graph showing proportion of fluorescent cells labelled using split GAL4 transgenics indicated and G-TRACE for serpent control and indicated VT lines (split GAL4 system). Red bars/dots show proportion of fluorescent cells in which only Red Stinger can be detected (current expression of split GAL4); yellow bars/dots show proportion of fluorescent cells in which both Red Stinger and Stinger can be detected (historical and current expression of split GAL4); green bars/dots show proportion of fluorescent cells in which only Stinger can be detected (historical expression of split GAL4, which has now ceased). Each point represents a dissected larva (n = 10, 7, 9, 10 and 9, from left to right for indicated genotypes). Bars and error bars show mean and standard deviation, respectively; bars annotated to show average number of cells counted across each category for 9 field of views. See Supplementary file 1 for full list of genotypes.
-
Figure 4—figure supplement 1—source data 1
Numerical data used to plot panel (a) of Figure 4—figure supplement 1.
- https://cdn.elifesciences.org/articles/58686/elife-58686-fig4-figsupp1-data1-v1.csv
-
Figure 4—figure supplement 1—source data 2
Numerical data used to plot panel (c) of Figure 4—figure supplement 1.
- https://cdn.elifesciences.org/articles/58686/elife-58686-fig4-figsupp1-data2-v1.csv
Figure 5
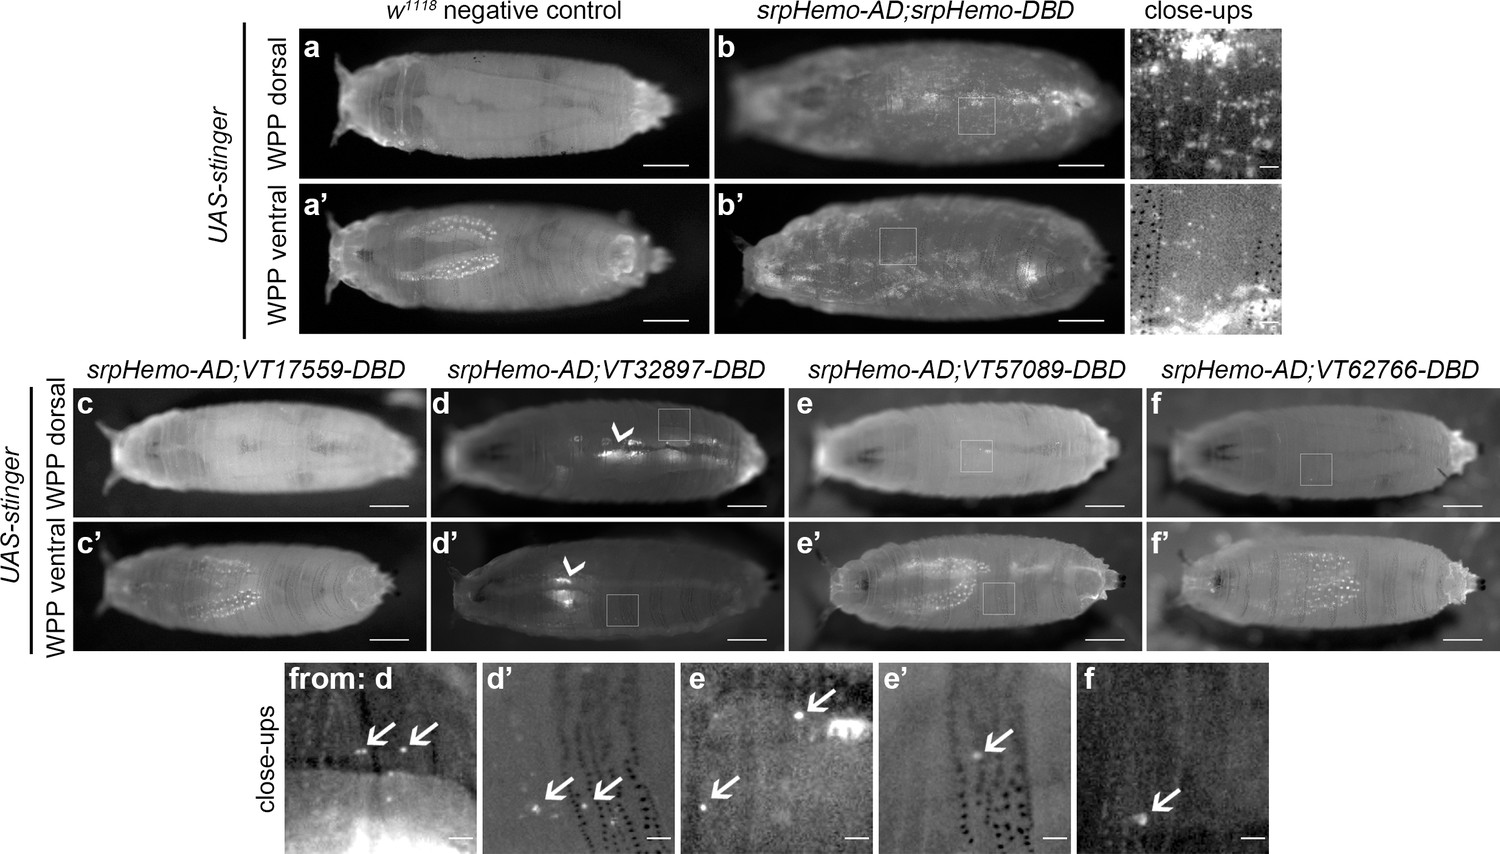
Plasmatocyte subpopulations are sparse in white pre-pupae.
(a–b) Dorsal and ventral views of negative control (a, UAS-stinger, but no driver) and positive control (b, UAS-stinger driven by srpHemo-AD;srpHemo-DBD) white pre-pupae (WPP); boxes indicate regions shown in close-up views of positive controls. (c–f) dorsal and ventral views of WPP containing cells labelled using srpHemo-AD and the indicated VT-DBD to drive expression from UAS-stinger. Very few VT enhancer-labelled cells can be detected in WPP: boxes mark regions shown in close-up views with example hemocytes indicated with an arrow; dorsal vessel-associated and proventricular region/Garland cells can also be observed in VT32897 WPP (arrowheads in d and d’, respectively); scale bars represent 500 μm (WPP) or 50 μm (close-ups); WPP images contrast enhanced to 0.3% saturation; close-up images contrast enhanced individually. See Supplementary file 1 for full list of genotypes.
Figure 6
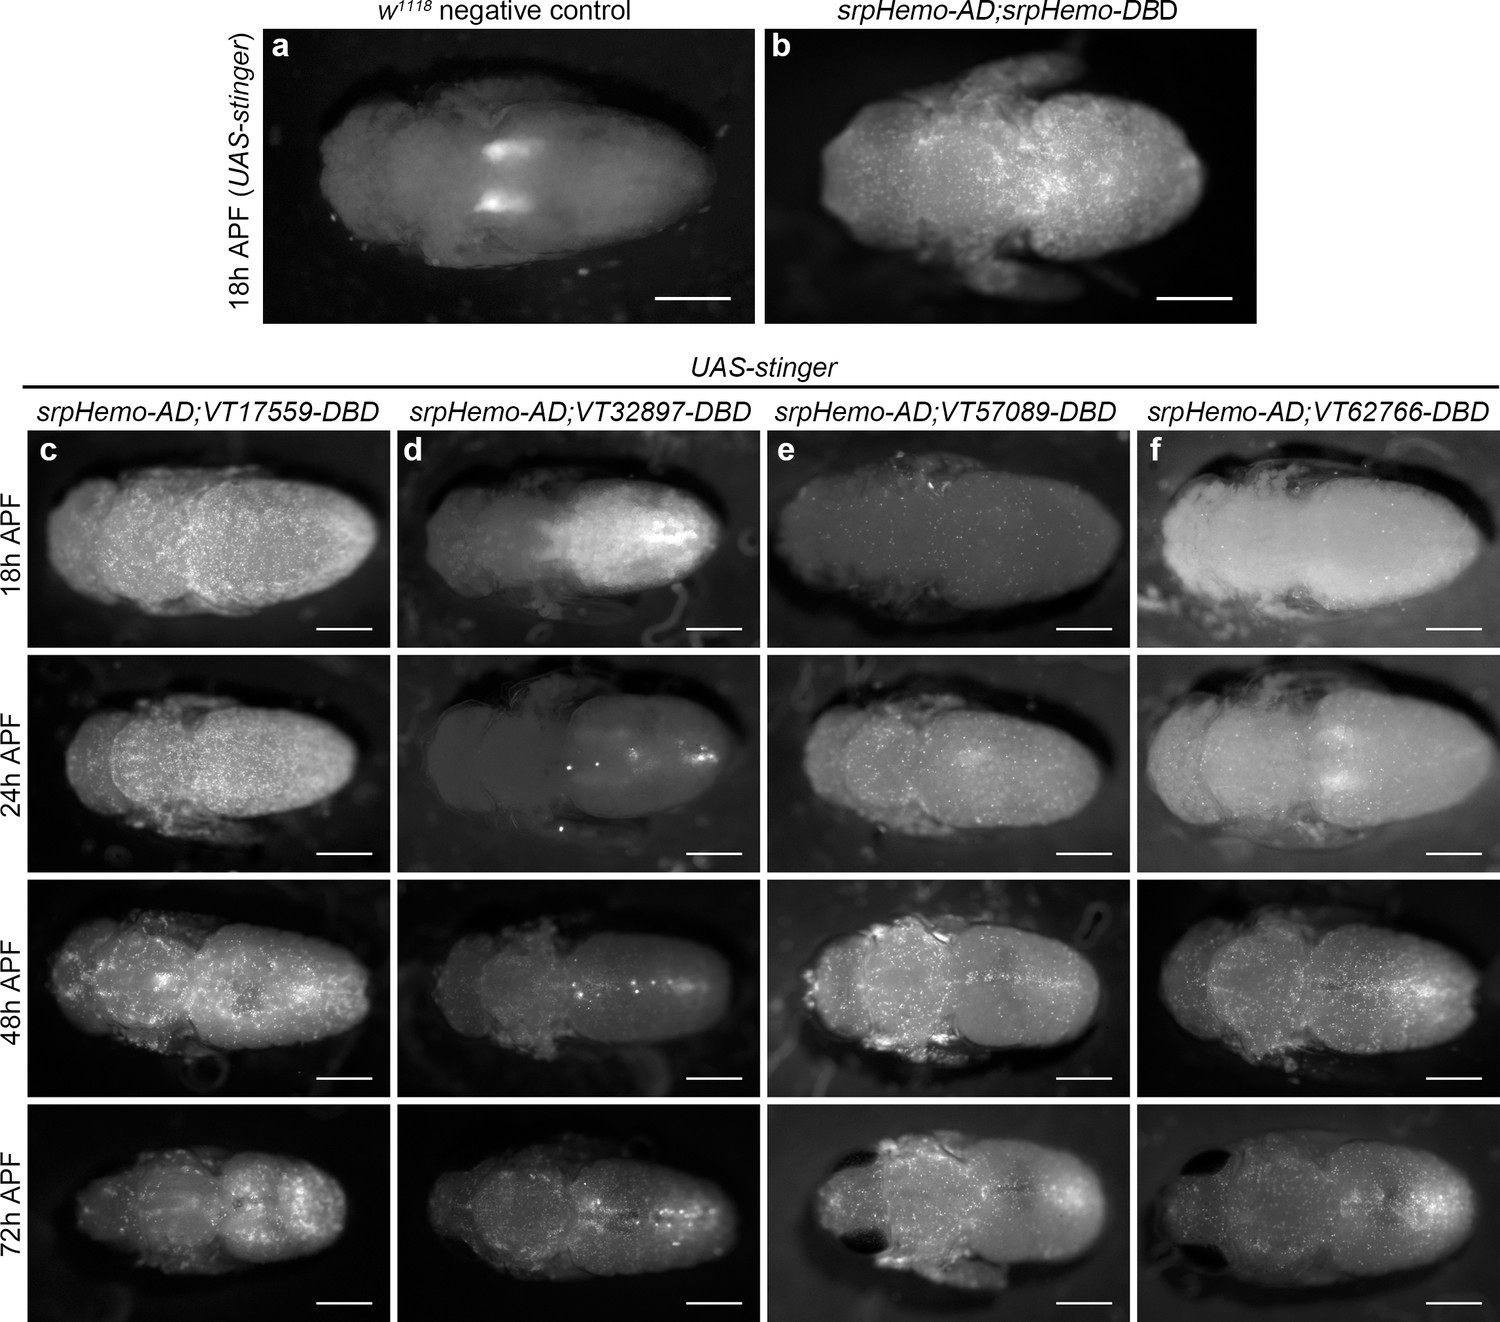
Plasmatocyte subpopulations return with distinct dynamics during pupal development.
(a–b) Dorsal images of negative control (a, no GAL4) and positive control pupae (b, labelled via srpHemo-AD;srpHemo-DBD) at 18 hr after puparium formation (APF). (c–f) dorsal images showing localisation of cells labelled using srpHemo-AD and VT-DBD (VT enhancers used to drive DBD expression indicated above panels) to drive expression of UAS-stinger during pupal development from 18 hr AFP to 72 hr APF. All image panels contrast enhanced to 0.3% saturation to reveal localisation of labelled cells due to differing intensities of reporter line expression. Scale bars represent 500 μm. See Supplementary file 1 for full list of genotypes.
Figure 7
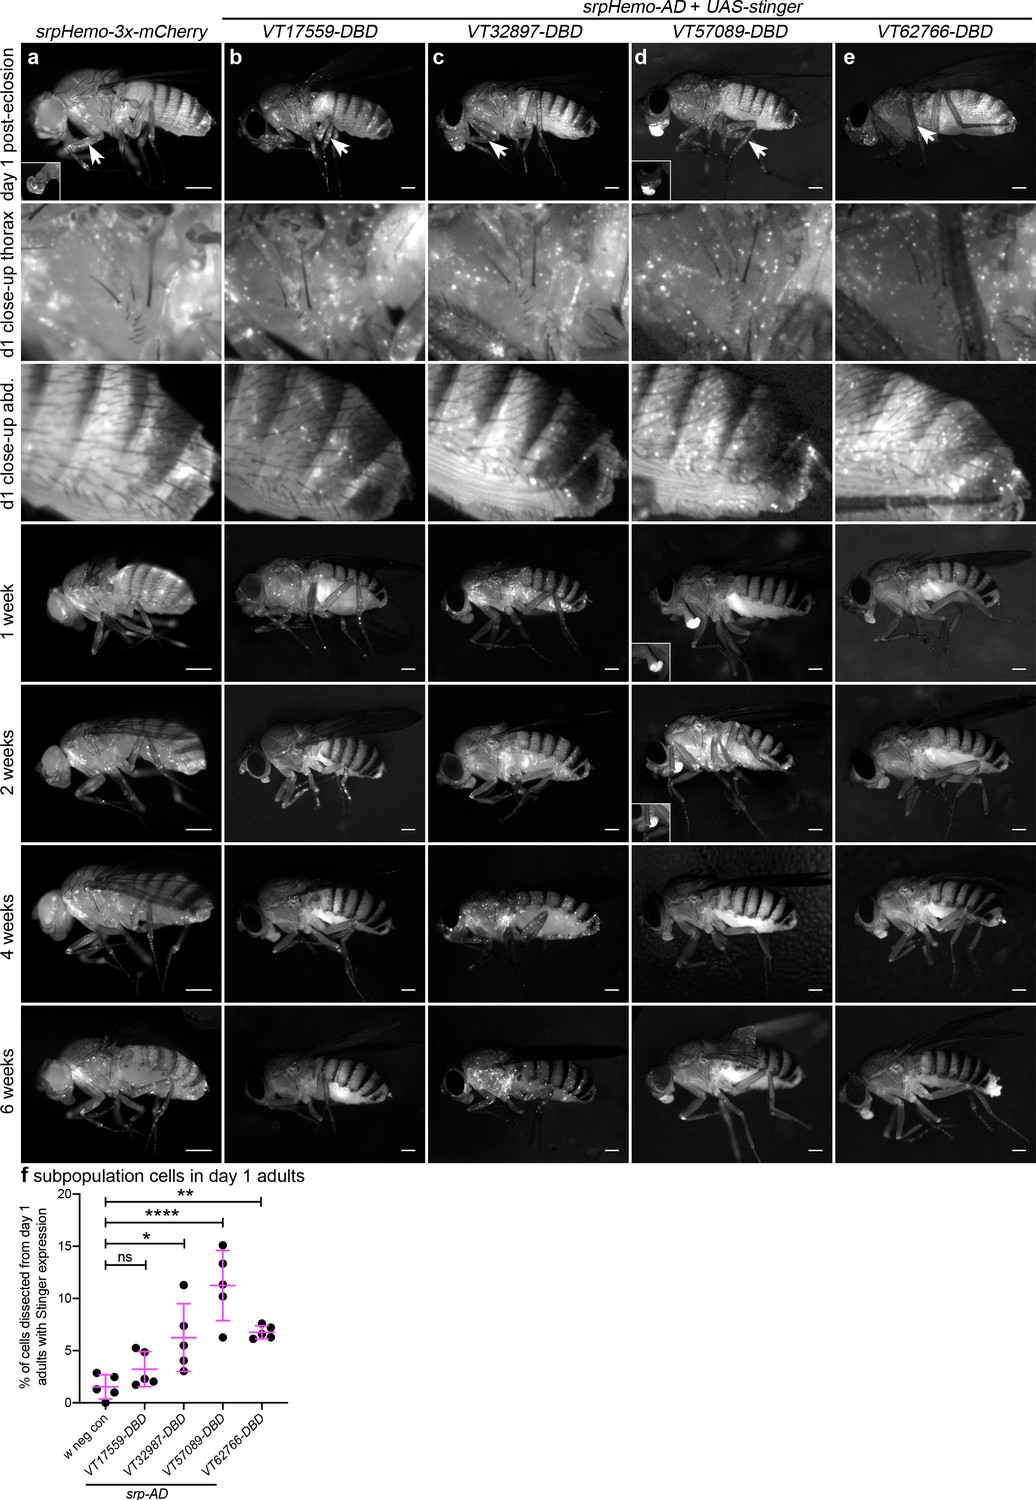
Plasmatocyte subpopulations exhibit distinct localisations and dynamics as adults age.
(a–e) Representative lateral images of adult flies between 0 and 6 weeks of age showing localisation of cells labelled using srpHemo-3x-mCherry (a, positive control), or split GAL4 to drive expression of stinger (b-e, srpHemo-AD;VT-DBD). The VT enhancers used to drive expression of the DNA-binding domain (DBD) of GAL4 correspond to VT17559 (b), VT32897 (c), VT57089 (d), and VT62766 (e); inset images show alternative view of proboscis region from same fly (a) or at a reduced level of brightness to reveal cellular detail (d). Images contrast enhanced to 0.15% saturation (a–c, e) or 0.75% (d) to reveal localisation of labelled cells due to differing intensities of reporter line expression. Arrows in top row indicate hemocytes in the legs; 2nd and 3rd rows show close-up of thorax and abdomen of day one flies; at least five flies were imaged for each timepoint; scale bars represent 500 μm. (f) Scatterplot showing proportion of cells dissected from day one adults that were labelled using srpHemo-AD and the VT-DBD transgenes indicated to drive expression from UAS-stinger. One-way ANOVA used to compare to negative control flies (w1118;UAS-stinger/+) with split GAL4 VT lines: n = 5 dissections per genotype; p=0.60 (VT17559), p=0.013 (VT32897), p<0.0001 (VT57089), and p=0.0063 (VT62766). Lines and error bars represent mean and standard deviation, respectively; ns, *, ** and **** denote not significant (p>0.05), p<0.05, p<0.01, and p<0.0001, respectively. See Supplementary file 1 for full list of genotypes.
-
Figure 7—source data 1
Numerical data used to plot panel (f) of Figure 7.
- https://cdn.elifesciences.org/articles/58686/elife-58686-fig7-data1-v1.csv
Figure 8 with 3 supplements
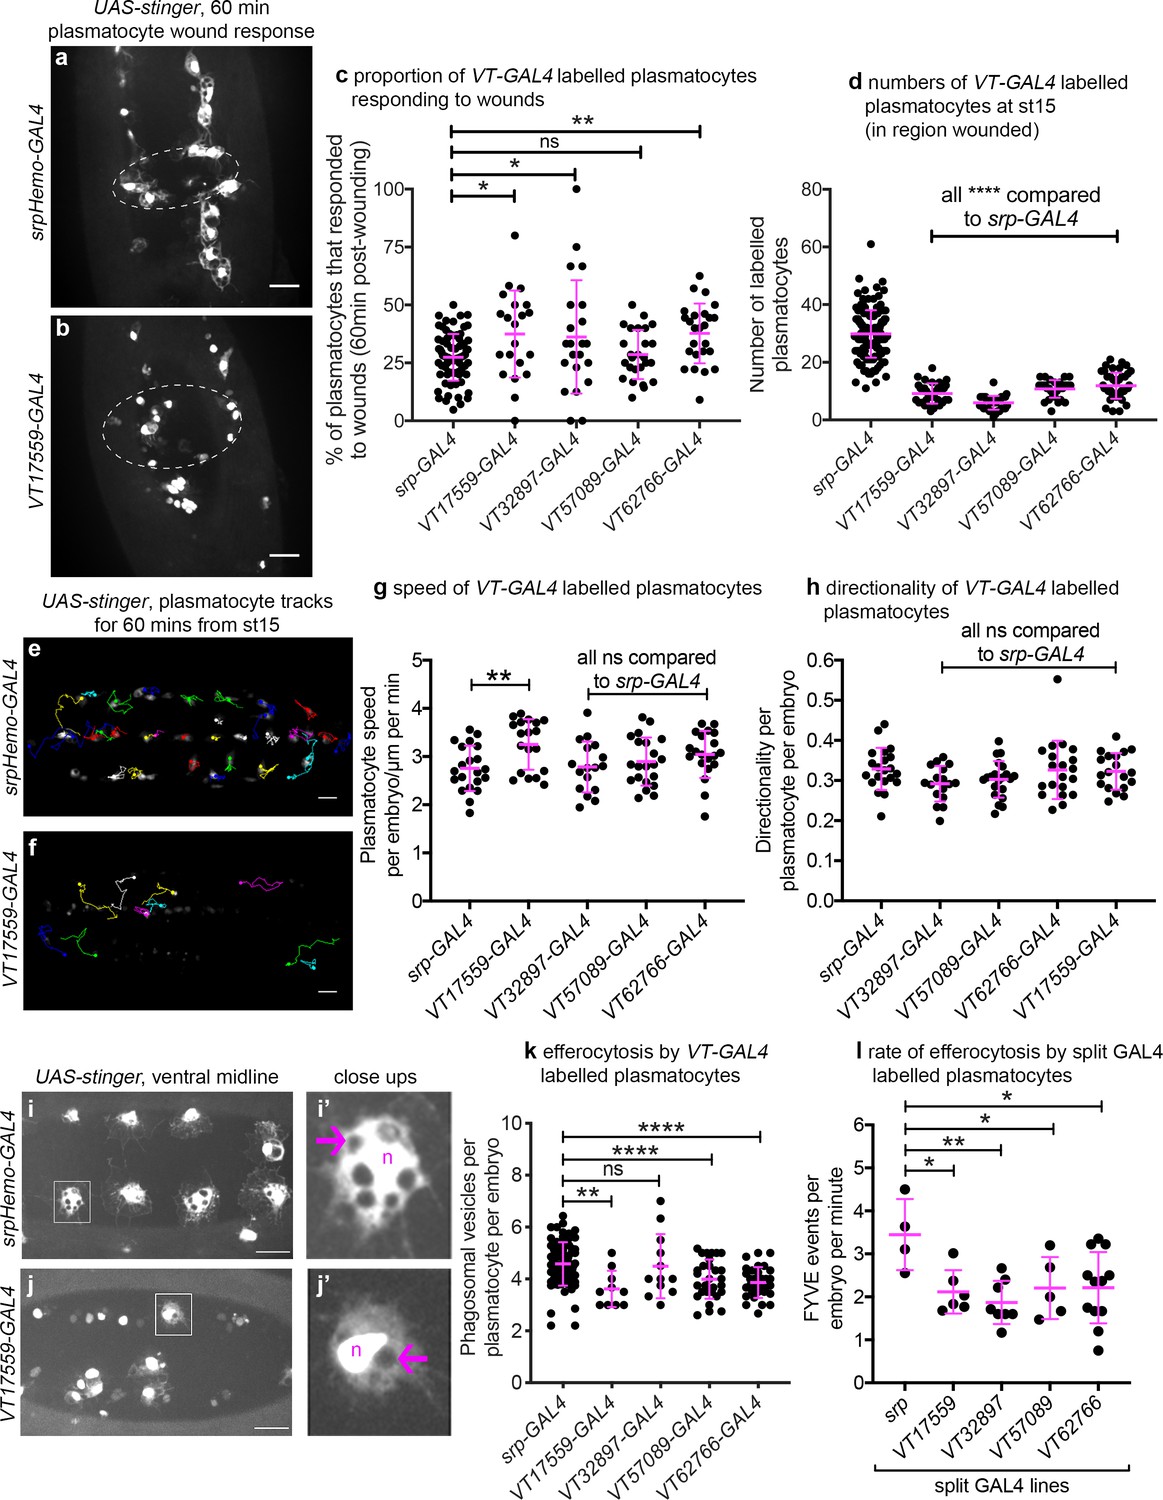
Drosophila plasmatocyte subpopulations demonstrate functional differences compared to the overall plasmatocyte population.
(a–b) Example images showing plasmatocyte wound responses at 60 min post-wounding (maximum projections of 15 μm deep regions). Cells labelled via UAS-stinger using srpHemo-GAL4 (a) and VT17559-GAL4 (b); dotted lines show wound edges. (c–d) Scatterplots showing percentage of srpHemo-GAL4 (control) or VT-GAL4-labelled plasmatocytes responding to wounds at 60 min (c) or total numbers of labelled plasmatocytes in wounded region (d); p=0.018, 0.041, 0.99, 0.0075 compared to srpHemo-GAL4 (n = 77, 21, 22, 26, 25) (c); p<0.0001 compared to srpHemo-GAL4 for all lines (n = 139, 35, 37, 30, 44) (d). (e–f) Example tracks of plasmatocytes labelled with GFP via srpHemo-GAL4 (e) and VT17559-GAL4 (f) during random migration on the ventral side of the embryo for 1 hr at stage 15. (g–h) Scatterplots showing speed per plasmatocyte, per embryo (g) and directionality (h) at stage 15 in embryos containing cells labelled via srpHemo-GAL4 (control) or the VT-GAL4 lines indicated; p=0.0097, 0.999, 0.82, 0.226 compared to srpHemo-GAL4 (n = 21, 19, 17, 21, 20) (g); p=0.998, 0.216, 0.480, 0.999 compared to srpHemo-GAL4 (n = 21, 19, 17, 21, 20) (h). (i–j) Example images of cells on the ventral midline at stage 15 with labelling via UAS-stinger expression using srpHemo-GAL4 (i) and VT17559-GAL4 (j); plasmatocytes shown in close-up images (i’, j’) are indicated by white boxes in main panels; arrows show phagosomal vesicles, ‘n’ marks nucleus; n.b. panels contrast enhanced independently to show plasmatocyte morphology. (k) Scatterplot showing phagosomal vesicles per plasmatocyte, per embryo at stage 15 (measure of efferocytosis/apoptotic cell clearance); cells labelled via srpHemo-GAL4 (control) or the VT-GAL4 lines indicated; p=0.0020, 0.99, 0.0040, 0.0002 compared to srpHemo-GAL4 (n = 76, 10, 12, 29, 31). (l) Scatterplot showing number of times 2x-FYVE-EGFP sensor recruited to phagosomes (FYVE events) per plasmatocyte, per embryo in plasmatocytes labelled via the split GAL4 system; p=0.019, 0.0034, 0.039 and 0.015 compared to srp control (n = 4, 6, 8, 5 and 12 embryos). Lines and error bars represent mean and standard deviation, respectively (all scatterplots); one-way ANOVA with a Dunnett’s multiple comparison test used to compare VT lines with srp controls in all datasets; ns, *, **, and **** denote not significant (p>0.05), p<0.05, p<0.01, and p<0.0001, respectively. All scale bars represent 20 μm. See Supplementary file 1 for full list of genotypes. N.b. Figure 8—figure supplements 1–3 show analysis of subpopulation cell morphology, ROS levels and phagocytosis in response to immune challenge, respectively.
-
Figure 8—source data 1
Numerical data used to plot panel (c) of Figure 8.
- https://cdn.elifesciences.org/articles/58686/elife-58686-fig8-data1-v1.csv
-
Figure 8—source data 2
Numerical data used to plot panel (d) of Figure 8.
- https://cdn.elifesciences.org/articles/58686/elife-58686-fig8-data2-v1.csv
-
Figure 8—source data 3
Numerical data used to plot panel (g) of Figure 8.
- https://cdn.elifesciences.org/articles/58686/elife-58686-fig8-data3-v1.csv
-
Figure 8—source data 4
Numerical data used to plot panel (h) of Figure 8.
- https://cdn.elifesciences.org/articles/58686/elife-58686-fig8-data4-v1.csv
-
Figure 8—source data 5
Numerical data used to plot panel (k) of Figure 8.
- https://cdn.elifesciences.org/articles/58686/elife-58686-fig8-data5-v1.csv
-
Figure 8—source data 6
Numerical data used to plot panel (l) of Figure 8.
- https://cdn.elifesciences.org/articles/58686/elife-58686-fig8-data6-v1.csv
Figure 8—figure supplement 1

VT-GAL4-labelled subpopulations show no gross differences in morphology compared to non-labelled plasmatocytes.
(a–e) Representative images of plasmatocytes at stage 15 on the ventral midline labelled using the pan-hemocyte marker srpHemo-GMA (green) and UAS-tdTomato (magenta) via srpHemo-GAL4 (a), VT17559-GAL4 (b), VT32897-GAL4 (c), VT57089-GAL4 (d), and VT62766-GAL4 (e); scale bars represent 20 μm. Scatterplots showing plasmatocyte spread area (f), circularity (g), aspect ratio (h), and roundness (i) for positive control cells (labelled via srpHemo-GAL4), and VT-GAL4-positive/negative cells within embryos corresponding to those shown in (a–e). Cells positive for VT-GAL4-driven tdTomato expression were compared to non-tdTomato expressing cells via Student’s t-test. No significant difference (ns) was found for any VT-GAL4 line tested; lines and error bars represent mean and standard deviation, respectively; data points represent individual plasmatocytes taken from a minimum of three embryos. See Supplementary file 1 for full list of genotypes.
-
Figure 8—figure supplement 1—source data 1
Numerical data used to plot panel (f) of Figure 8—figure supplement 1.
- https://cdn.elifesciences.org/articles/58686/elife-58686-fig8-figsupp1-data1-v1.csv
-
Figure 8—figure supplement 1—source data 2
Numerical data used to plot panel (g) of Figure 8—figure supplement 1.
- https://cdn.elifesciences.org/articles/58686/elife-58686-fig8-figsupp1-data2-v1.csv
-
Figure 8—figure supplement 1—source data 3
Numerical data used to plot panel (h) of Figure 8—figure supplement 1.
- https://cdn.elifesciences.org/articles/58686/elife-58686-fig8-figsupp1-data3-v1.csv
-
Figure 8—figure supplement 1—source data 4
Numerical data used to plot panel (i) of Figure 8—figure supplement 1.
- https://cdn.elifesciences.org/articles/58686/elife-58686-fig8-figsupp1-data4-v1.csv
Figure 8—figure supplement 2

VT-GAL4-labelled plasmatocytes show no gross differences in their ROS levels compared to the overall population.
(a–e) Representative images (single z-slices) of VT-GAL4-positive plasmatocytes (labelled via expression from UAS-tdTomato, magenta in merge) at stage 15 on the ventral midline stained via dihydrorhodamine 123 (DHR123) to show ROS levels (green in merge); srpHemo-GAL4 was used as a positive control to show the overall population. (f) Scatterplot showing quantification of mean gray value per srpHemo-GAL4 or VT-GAL4-labelled plasmatocyte, per embryo; lines and error bars represent mean and standard deviation, respectively. No statistically significant differences (p>0.05) were found between the VT-GAL4 lines shown and the overall population (labelled via srpHemo-GAL4) using a one-way ANOVA compared to control; n = 12 (control); n = 11, p>0.99 (VT17559-GAL4); n = 11, p=0.68 (VT32897-GAL4); n = 14, p>0.99 (VT57089-GAL4); n = 14, p=0.53 (VT62766-GAL4) embryos; ns denotes not significantly different to control; scale bars represent 20 μm (a–e). See Supplementary file 1 for full list of genotypes.
-
Figure 8—figure supplement 2—source data 1
Numerical data used to plot panel (f) of Figure 8—figure supplement 2.
- https://cdn.elifesciences.org/articles/58686/elife-58686-fig8-figsupp2-data1-v1.csv
Figure 8—figure supplement 3
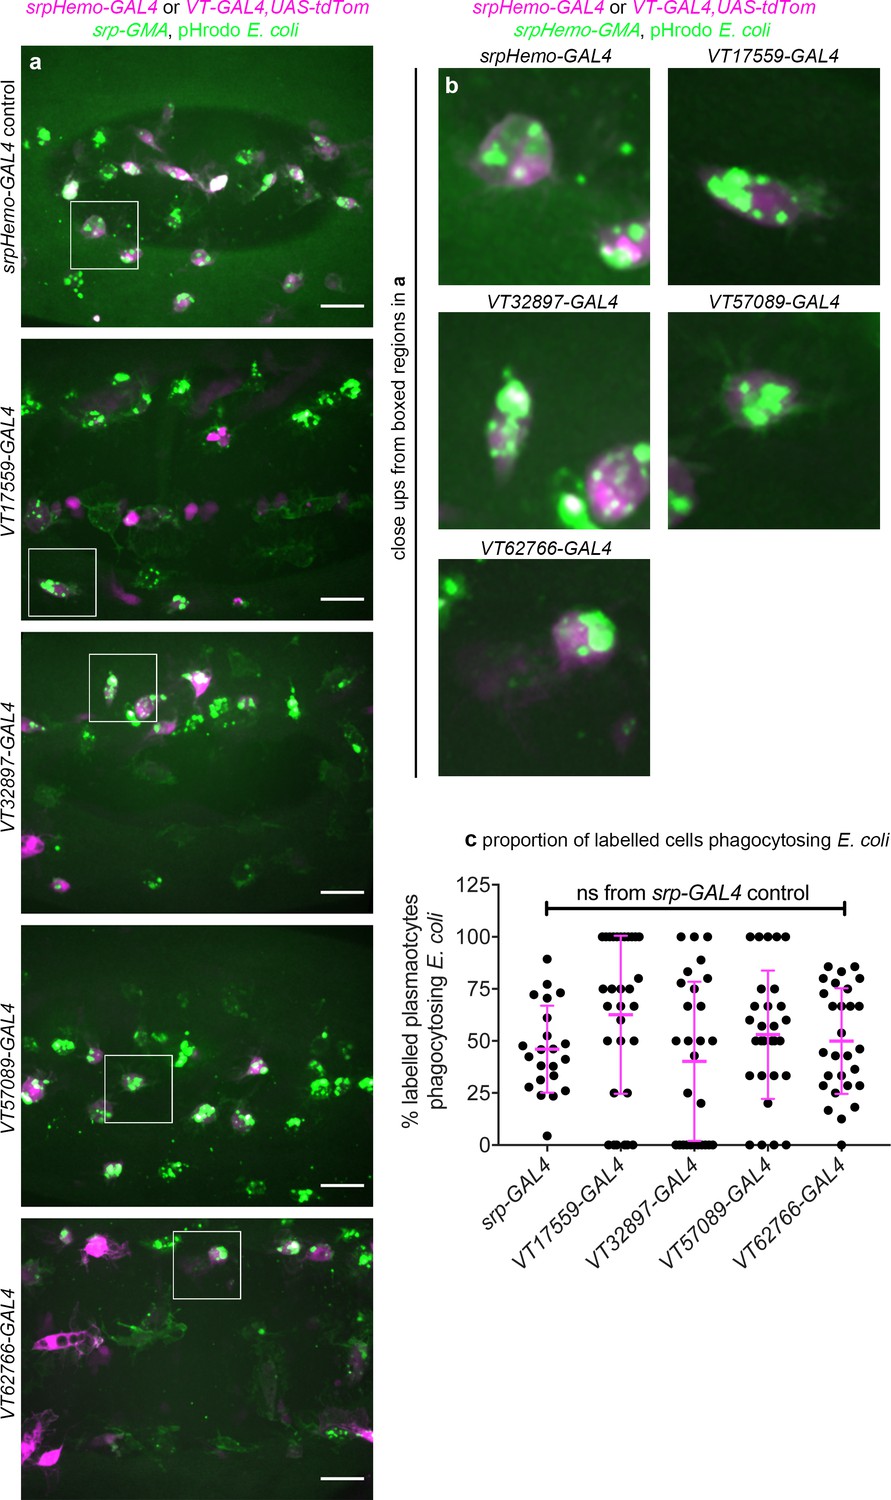
VT-GAL4-labelled plasmatocytes show no gross differences in their phagocytosis of E. coli compared to the overall population.
(a) Ventral views of stage 15 embryos containing srpHemo-GAL4 (positive control, overall population) and VT-GAL4-positive plasmatocytes (labelled via expression from UAS-tdTomato, magenta) 1 hr following injection with pHrodo-labelled E. coli particles (green); srpHemo-GAL4 was used as a positive control to show the overall population; srpHemo-GMA used to label VT-GAL4 negative plasmatocytes. (b) Shows close-ups of E. coli-positive plasmatocytes indicated by white boxes in (a). (c) Scatterplot showing quantification of the proportion of pHrodo E. coli-positive plasmatocytes per embryo in the populations labelled via srpHemo-GAL4 or the indicated VT-GAL4 reporter. Lines and error bars represent mean and standard deviation, respectively. No statistically significant difference (ns; p>0.05) was found between the VT-GAL4 lines shown and plasmatocytes labelled via srpHemo-GAL4 using a Kruskal-Wallis test with Dunn’s multiple comparisons test: n = 22 (srpHemo-GAL4); n = 31, p=0.14 (VT17559-GAL4); n = 28, p>0.99 (VT32897-GAL4); n = 29, p>0.99 (VT57089-GAL4); n = 28, p>0.99 (VT62766-GAL4). Scale bars represent 20 μm. See Supplementary file 1 for full list of genotypes.
-
Figure 8—figure supplement 3—source data 1
Numerical data used to plot panel (c) of Figure 8—figure supplement 3.
- https://cdn.elifesciences.org/articles/58686/elife-58686-fig8-figsupp3-data1-v1.csv
Figure 9
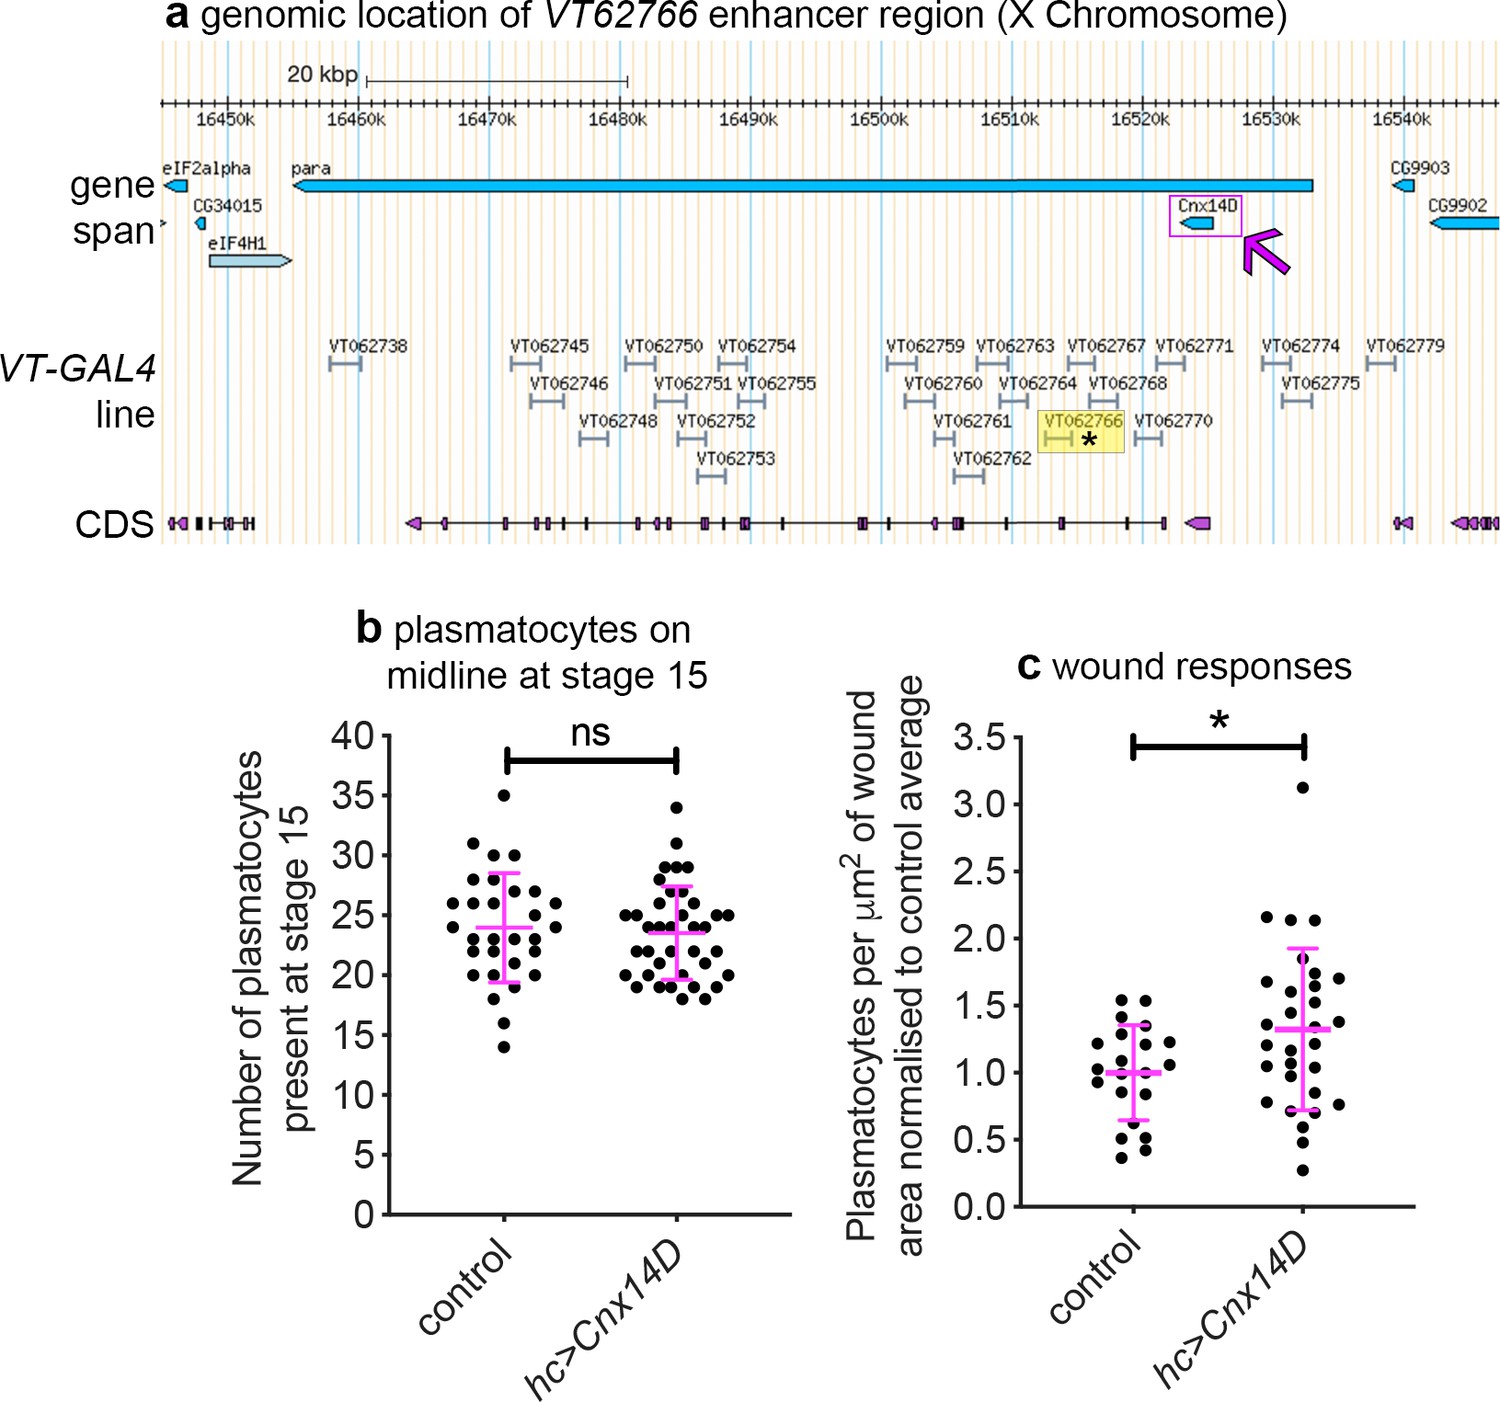
Misexpression of Cnx14D improves plasmatocyte inflammatory responses to injury.
(a) Chromosomal location of the VT62766-GAL4 enhancer region; only one transcript is shown for para, which possesses multiple splice variants. The VT62766 region is highlighted in yellow and by an asterisk; Cnx14D (indicated by magenta arrow) lies within para. (b) Scatterplot showing numbers of plasmatocytes present at stage 15 on the ventral side of the embryo ahead of wounding in controls and on misexpression of Cnx14D in all hemocytes using both srpHemo-GAL4 and crq-GAL4 (hc>Cnx14D); n = 30 and 38 for control and hc>Cnx14D embryos, respectively, p=0.670 via Student’s t-test. (c) Scatterplot of wound responses 60 min post-wounding (number of plasmatocytes at wound, normalised for wound area and to control responses); n = 21 and 30 for control and hc>Cnx14D embryos, respectively; p=0.0328 via Student’s t-test. Line and error bars represent mean and standard deviation, respectively (b–c). See Supplementary file 1 for full list of genotypes.
-
Figure 9—source data 1
Numerical data used to plot panel (b) of Figure 9.
- https://cdn.elifesciences.org/articles/58686/elife-58686-fig9-data1-v1.csv
-
Figure 9—source data 2
Numerical data used to plot panel (c) of Figure 9.
- https://cdn.elifesciences.org/articles/58686/elife-58686-fig9-data2-v1.csv
Figure 10

Drosophila plasmatocyte subpopulation identity can be controlled through exposure to apoptotic cells.
(a–b) Maximum projections showing apoptotic cells (via anti-cDCP-1 staining, magenta in merge) and plasmatocytes (via anti-GFP staining, green in merge) at stage 15 on the ventral midline in control (a) and repo mutant embryos (b). (c–g) maximum projections of the ventral midline showing a negative control embryo (c) and embryos containing VT-GAL4-labelled plasmatocytes at stage 15 in control (d–g) and repo mutant embryos (d’–g’). VT-GAL4 used to drive UAS-stinger expression (green) and srpHemo-H2A-3x-mCherry used to label plasmatocytes (magenta). Arrows and asterisks indicate examples of VT-GAL4-positive plasmatocytes and non-plasmatocyte cells, respectively; note loss of non-plasmatocyte VT-GAL4 expression in repo mutants versus controls for VT62766-GAL4. (h) Scatterplot showing percentage of H2A-3x-mCherry-positive cells that are also positive for VT-GAL4 driven Stinger expression in control and repo mutant embryos at stage 15. Student’s t-test used to show significant difference between controls and repo mutants (p=0.0009, n = 22, 15 for VT17559-GAL4 lines; p=0.0017, n = 37, 28 for VT32897-GAL4 lines; p=0.0005, n = 25, 14 for VT57089-GAL4 lines; p<0.0001, n = 22, 20 for VT62766-GAL4 lines). Scale bars represent 10 μm (a–g); lines and error bars represent mean and standard deviation (h); **, ***, and **** denote p<0.01, p<0.001, and p<0.0001, respectively. See Supplementary file 1 for full list of genotypes.
-
Figure 10—source data 1
Numerical data used to plot panel (h) of Figure 10.
- https://cdn.elifesciences.org/articles/58686/elife-58686-fig10-data1-v1.csv
Videos
Video 1
Plasmatocytes in similar positions within the embryo do not respond equally to inflammatory stimuli.
GFP (green) and red stinger (magenta) labelled plasmatocytes responding to an epithelial wound at stage 15. Tracks of cell movements are shown via dots and lines. Magenta circles show cells responding to the wound; blue circles indicate cells that are the same distance from the wound but fail to respond to the wound. Movie corresponds to stills shown in Figure 1a and lasts for 60 min post-wounding. Scale bar represents 20 μm. See Supplementary file 1 genotype in full.
Video 2
Localisation and dynamics of subpopulation cells within L1 larvae.
Movies showing localisation and movement of cells labelled using split GAL4 lines (srpHemo-AD in combination with VT17559-DBD, VT32897-DBD, VT57089-DBD, or VT62766-DBD) to drive expression from UAS-stinger in L1 larvae. Images taken from timelapse series of single focal planes to enable rapid imaging. The majority of cells detected appear attached to the body wall, since they do not shift their relative positions during larval movements, although some cells can be seen in circulation. Scale bars represent 200 μm. See Supplementary file 1 for full list of genotypes.
Video 3
Dorsal vessel-associated cells can be labelled via srp-based split GAL4 reporters in the L3 larva.
Movie showing rhythmic movements of cells labelled using srpHemo-AD in combination with srpHemo-DBD to drive expression from UAS-stinger in an L3 larva. The area indicated shows cells on dorsal midline (likely to be nephrocytes) that move in time with pumping of the dorsal vessel (see also Video 4, Video 5 and Video 7). These cells can also be seen using VT32897-based enhancers. Scale bars represent 500 μm. See Supplementary file 1 for genotype in full.
Video 4
Localisation and dynamics of subpopulation cells within L3 larvae.
Movies showing localisation and movement of cells labelled using split GAL4 lines (srpHemo-AD in combination with VT17559-DBD, VT32897-DBD, VT57089-DBD, or VT62766-DBD) to drive expression from UAS-stinger in L3 larvae. Images taken from timelapse series of single focal planes to enable rapid imaging. Far fewer cells are visible compared to L1 and L2 larvae and the majority of cells detected appear attached to the body wall, since they do not shift their relative positions during larval movements. Movies repeat with second repetition showing examples of rare cells in circulation (illustrated by overlaid tracks). Scale bars represent 500 μm. See Supplementary file 1 for full list of genotypes.
Video 5
Flow of srp-positive cells in circulation within a white pre-pupa.
Movie showing movements of srp-positive cells within the hemolymph of a white pre-pupa. Cells labelled via UAS-stinger expression driven by srpHemo-AD in combination with srpHemo-DBD. Scale bar represents 500 μm. See Supplementary file 1 for genotype in full.
Video 6
Movement of VT57089 subpopulation cells within a white pre-pupa.
Movie showing movements of VT57089 cells within the hemolymph of a white pre-pupa (examples highlighted with green circles). Cells labelled via UAS-stinger expression using srpHemo-AD and VT57089-DBD. Movie plays twice with an overlay of the tracks of cells in circulation shown in repeat. Scale bar represents 500 μm. See Supplementary file 1 for genotype in full.
Video 7
Movement of VT32897-labelled, dorsal vessel-associated, non-hemocyte cells within a white pre-pupa.
Movie showing rhythmic movements of cells in a white pre-pupa labelled using srpHemo-AD in combination with VT32897-DBD to drive expression from UAS-stinger. Cells on dorsal midline (likely to be nephrocytes) move in time with pumping of the dorsal vessel in a white pre-pupa. Scale bar represents 500 μm. See Supplementary file 1 for genotype in full.
Tables
Table 1
Summary of plasmatocyte subpopulation characteristics and their developmental regulation.
| Subpopulation characteristics (compared to overall population): | Subpopulations in: | ||||||||||
|---|---|---|---|---|---|---|---|---|---|---|---|
| Subpopulation | Wound responses | Migration speed | Efferocytosis | ROS levels | Phagocytosis of E. coli | Embryos | Larvae | Pupae | Newly hatched adults | Aged adults | |
| VT17559 | ↓ | ↓ | ↓ | no difference | no difference | distinct subpopulation | very few cells labelled | large numbers labelled by 18 hr APF | large numbers present | largely absent by 2 weeks | |
| VT32897 | ↓ | no difference | only decreased in FYVE | no difference | no difference | distinct subpopulation (fewest cells) | few cells labelled + nephrocytes and garland cells (?) | large numbers labelled by 72 hr APF | large numbers present | labelled cells persist | |
| VT57089 | no difference | no difference | ↓ | no difference | no difference | distinct subpopulation | almost no cells labelled + Bolwig Organ (?) | steady increase in numbers labelled | large numbers present | largely absent by 1 week | |
| VT62766 | ↓ | no difference | ↓ | no difference | no difference | distinct subpopulation | almost no cells labelled | large numbers labelled by 48 hr APF | large numbers present | largely absent by 1 week | |
-
Table 1—source data 1
Source data for Table 1.
Summary of plasmatocyte subpopulation characteristics and their developmental regulation.
- https://cdn.elifesciences.org/articles/58686/elife-58686-table1-data1-v1.xlsx
Table 2
VT enhancer region location and neighbouring genes.
| VT enhancer | Genomic region* | Nearest genes | Distance of enhancer from gene |
|---|---|---|---|
| VT17559 | chr2R: 12,069,698–12,070,780 | Lis-1 | overlapping |
| CG8441 | 2,929bp upstream | ||
| Ptp52F | 3,887bp downstream | ||
| VT32897 | chr3L: 18,631,149–18,633,281 | MYPT-75D | overlapping |
| bora | 13,299bp downstream | ||
| not | 15,921bp downstream | ||
| VT57089 | chrX: 4,961,770–4,962,316 | ovo | overlapping |
| CG32767 | 3,290bp upstream | ||
| CR44833 | 3,870bp downstream | ||
| VT62766 | chrX: 16,406,666–16,408,777 | para | overlapping |
| Cnx14D | 10,404bp upstream | ||
| CG9903 | 26,520bp upstream |
-
* D. melanogaster Apr. 2006 (BDGP R5/dm3) Assembly.
Data taken from http://enhancers.starklab.org/.
-
Table 2—source data 1
Source data for Table 2.
VT enhancer region location and neighbouring genes.
- https://cdn.elifesciences.org/articles/58686/elife-58686-table2-data1-v1.xlsx
Appendix 1—key resources table
| Reagent type (species) or resource | Designation | Source or reference | Identifiers | Additional information |
|---|---|---|---|---|
| Gene (Drosophila melanogaster) | w | NA | FLYB:FBgn0003996 | NA |
| Gene (D. melanogaster) | srp | NA | FLYB:FBgn0003507 | NA |
| Gene (D. melanogaster) | crq | NA | FLYB:FBgn0015924 | NA |
| Gene (D. melanogaster) | simu | NA | FLYB:FBgn0260011 | Also known as NimC4 |
| Gene (D. melanogaster) | eater | NA | FLYB:FBgn0243514 | NA |
| Gene (D. melanogaster) | Cnx14D | NA | FLYB:FBgn0264077 | NA |
| Gene (D. melanogaster) | repo | NA | FLYB:FBgn0011701 | NA |
| Genetic reagent (D. melanogaster) | w1118 | Evans lab stock | FLYB:FBal0018186 | FlyBase symbol:w1118 |
| Genetic reagent (D. melanogaster) | srpHemo-GAL4 | PMID:15239955 | FLYB:FBtp0023390 | FlyBase symbol:P{srp.Hemo-GAL4}2; Obtained from W. Wood, University of Edinburgh, UK |
| Genetic reagent (D. melanogaster) | srpHemo-Gal4,UAS-GFP | PMID:16651377 | FLYB:FBtp0023390 (P{srp.Hemo-GAL4}2) | Obtained from W. Wood, University of Edinburgh, UK |
| Genetic reagent (D. melanogaster) | srpHemo-GAL4,UAS-red stinger | PMID:23172914 | FLYB:FBtp0023390 (P{srp.Hemo-GAL4}2) | Obtained from B. Stramer, Kings College London, UK |
| Genetic reagent (D. melanogaster) | crq-GAL4,UAS-GFP | PMID:15699212 | FLYB:FBtp0022491 (P{crq-GAL4.A}) | Obtained from W. Wood, University of Edinburgh, UK |
| Genetic reagent (D. melanogaster) | da-GAL4 | PMID:FBrf0082789 | FLYB:FBtp0019571 | FlyBase symbol:P{da-GAL4.w-}; Obtained from A. Whitworth, University of Cambridge, UK |
| Genetic reagent (D. melanogaster) | UAS-GC3ai | PMID:28870988 | FLYB:FBtp0137390 | FlyBase symbol:P{UAS-GC3Ai}3; Obtained from M. Suzanne, CBI-Toulouse, France |
| Genetic reagent (D. melanogaster) | srpHemo-3x-mCherry | Bloomington Drosophila Stock Center; PMID:29321168 | BDSC: 78359; FLYB:FBtp0127793; RRID:BDSC_ 78359 | FlyBase symbol:P{srpHemo-3XmCherry}; Obtained from B, Stramer, Kings College London, UK |
| Genetic reagent (D. melanogaster) | Hml(Δ)-GAL4,UAS-GFP | Bloomington Drosophila Stock Center; PMID:15480416 | BDSC:30140; RRID:BDSC_30140; FLYB:FBtp0040877; BDSC:30142; RRID:BDSC_30142; FLYB:FBtp0040877 | FlyBase symbol:‘w1118; P{Hml-GAL4.Δ}2, P{UAS-2xEGFP}AH2’;‘w1118; P{Hml-GAL4.Δ}3, P{UAS-2xEGFP}AH3/MKRS’ |
| Genetic reagent (D. melanogaster) | VT17559-GAL4 | PMID:24896182 | VDRC:205658 | Previously available from Vienna Drosophila Research Center (stock discarded); available on request from I. Evans |
| Genetic reagent (D. melanogaster) | VT32897-GAL4 | PMID:24896182 | VDRC:214064 | Previously available from Vienna Drosophila Research Center (stock discarded); available on request from I. Evans |
| Genetic reagent (D. melanogaster) | VT57089-GAL4 | PMID:24896182 | VDRC:208119 | Previously available from Vienna Drosophila Research Center (stock discarded); available on request from I. Evans |
| Genetic reagent (D. melanogaster) | VT62766-GAL4 | PMID:24896182 | VDRC:203897 | Previously available from Vienna Drosophila Research Center (stock discarded); available on request from I. Evans |
| Genetic reagent (D. melanogaster) | UAS-tdTomato | Bloomington Drosophila Stock Center | BDSC:36327; FLYB:FBti0145103; RRID:BDSC_36327 | FlyBase symbol:P{UAS-tdTom.S}2 |
| Genetic reagent (D. melanogaster) | srpHemo-GMA | Other | NA | Globular Moesin actin-binding domain fused to GFP under the control of srpHemo; P-element insertions on chromosomes 2 and 3; Obtained from James Bloor, University of Kent, UK |
| Genetic reagent (D. melanogaster) | UAS-GFP | Bloomington Drosophila Stock Center | BDSC: 5431; FLYB: FBti0013988; RRID:BDSC_5431 | FlyBase symbol:P{UAS-EGFP}5a.2 |
| Genetic reagent (D. melanogaster) | eater-GFP | PMID:17936744 | FLYB: FBtp0054463 | FlyBase symbol:P{eater-GFP.1.7}; Obtained from L. Vesala, University of Tampere, Finland |
| Genetic reagent (D. melanogaster) | simu-cytGFP | PMID:18455990 | NA | FlyBase symbol:M{simu-cytGFP}; Obtained from E. Kurant, University of Haifa, Israel |
| Genetic reagent (D. melanogaster) | VT17559-RFP | This paper | NA | Inserted in attP2 on chromosome 3; see methods for details of cloning and transgenesis |
| Genetic reagent (D. melanogaster) | VT32897-RFP | This paper | NA | Inserted in attP2 on chromosome 3; see methods for details of cloning and transgenesis |
| Genetic reagent (D. melanogaster) | VT57089-RFP | This paper | NA | Inserted in attP2 on chromosome 3; see methods for details of cloning and transgenesis |
| Genetic reagent (D. melanogaster) | VT62766-RFP | This paper | NA | Inserted in attP2 on chromosome 3; see methods for details of cloning and transgenesis |
| Genetic reagent (D. melanogaster) | srpHemo-AD | This paper | NA | Inserted in VK1 attP site on; see methods for details of cloning and transgenesis chromosome 3 |
| Genetic reagent (D. melanogaster) | srpHemo-DBD | This paper | NA | Inserted in attP2 on chromosome 3; see methods for details of cloning and transgenesis |
| Genetic reagent (D. melanogaster) | VT17559-DBD | This paper | NA | Inserted in attP2 on chromosome 3; see methods for details of cloning and transgenesis |
| Genetic reagent (D. melanogaster) | VT32897-DBD | This paper | NA | Inserted in attP2 on chromosome 3; see methods for details of cloning and transgenesis |
| Genetic reagent (D. melanogaster) | VT57089-DBD | This paper | NA | Inserted in attP2 on chromosome 3; see methods for details of cloning and transgenesis |
| Genetic reagent (D. melanogaster) | VT62766-DBD | This paper | NA | Inserted in attP2 on chromosome 3; see methods for details of cloning and transgenesis |
| Genetic reagent (D. melanogaster) | srpHemo-H2A-3x-mCHerry | Bloomington Drosophila Stock Center; PMID:29321168 | BDSC: 78361; FLYB:FBtp0127794; RRID:BDSC_78661 | FlyBase symbol:P{srpHemo-H2A.3XmCherry}; Obtained from B. Stramer, Kings College London, UK |
| Genetic reagent (D. melanogaster) | UAS-stinger | Bloomington Drosophila Stock Center | BDSC:84277; FLYB:FBti0074589; RRID:BDSC_84277 | FlyBase symbol:P{UAS-Stinger}2 |
| Genetic reagent (D. melanogaster) | ‘w;;UAS-red stinger,UAS-FLP,Ubi-p63E(FRT.STOP)Stinger’ | Bloomington Drosophila Stock Center; PMID:19633663 | BDSC:28281; RRID:BDSC_28281 | FlyBase symbol:‘w[*]; P{w[+mC]=UAS-RedStinger}6, P{w[+mC]=UAS-FLP.Exel}3, P{w[+mC]=Ubi-p63E(FRT.STOP)Stinger}15F2’; Obtained from Alisson Gontijo, CEDOC, Lisbon, Portugal |
| Genetic reagent (D. melanogaster) | UAS-tdTomato | Bloomington Drosophila Stock Center | BDSC:36327; FLYB:FBti0145103; RRID:BDSC_36327 | FlyBase symbol:P{UAS-tdTom.S}2 |
| Genetic reagent (D. melanogaster) | UAS-GFP-myc-2xFYVE | Bloomington Drosophila Stock Center | BDSC:42712; FLYB:FBti0147756; RRID:BDSC_42712 | FlyBase symbol:P{UAS-GFP-myc-2xFYVE}2 |
| Genetic reagent (D. melanogaster) | UAS-Cnx14D | Harvard Drosophila Stock Center | FLYB:FBal0228355 | FlyBase symbol:P{XP}parad04188; Previously available from Harvard Drosophila Stock Centre (now discarded); available on request from I. Evans |
| Genetic reagent (D. melanogaster) | repo03702 | Bloomington Drosophila Stock Center; PMID:32796812 | BDSC:11604; FLYB:FBti0003552; RRID:BDSC_11604 | FlyBase symbol:ry506 P{PZ}repo03702/TM3, ryRK Sb1 Ser1; ry506 allele recombined off original stock line |
| Biological sample (D. melanogaster) | Embryos, L1-L3 larvae, white pre-pupae, pupae, adults, hemolymph (larval and adult) | NA | NA | NA |
| Biological sample (S. cerevisiae) | Isogenic S. cerevisiae wild-type yeast strain BY4741 | Euroscarf consortium | Euroscarf: Y00000 | Heat-killed and stained with calcofluor staining solution for use in phagocytosis assay; 1 × 10⁶ particles added per well in 96-well plate |
| Antibody | Anti-cleaved DCP-1 (Asp216) (Rabbit polyclonal) | Cell Signaling Technologies | Cat# 9578S; RRID:AB_2721060 | IF(1:1000); Primary antibody used to detect apoptotic cells |
| Antibody | Anti-GFP (Mouse monoclonal) | Abcam | Cat# ab1218; RRID:AB_298911 | IF(1:200); Primary antibody used to detect cells expressing GFP |
| Antibody | Alexa Fluor 488 Goat anti-Mouse IgG (Goat polyclonal) | Invitrogen/Molecular Probes | Cat# A11029; RRID:AB_138404 | IF(1:400); secondary antibody used to detect anti-GFP primary antibody |
| Antibody | Alexa Fluor 568 Goat anti-Rabbit IgG (Goat polyclonal) | Invitrogen/Molecular Probes | Cat# A11036; RRID:AB_10563566 | IF(1:400); secondary antibody used to detect anti-cleaved DCP-1 primary antibody |
| Software, algorithm | Fiji | PMID:22743772 | RRID:SCR_002285 | |
| Software, algorithm | GraphPad Prism 7 | Graphpad | RRID:SCR_002798 | |
| Other | NucBlue | Invitrogen/Molecular Probes | Cat# R37605 | NucBlue Live ReadyProbes Reagent (Hoechst 33342); two drops per ml; nuclear stain |
| Other | Calcofluor staining solution | Sigma-Aldrich | Cat# 18909–100 ML-F | 40 μl used to stain 1 × 10⁹ heat-killed yeast particles in 1 mL PBS |
| Other | Dihydrorhodamine 123 ROS dye | Sigma-Aldrich | Cat# D1054-10MG | ROS dye; used at (50 μM) in PBS to stain embryos |
| Other | pHrodo green E. coli BioParticles | Invitrogen/Molecular Probes | Cat# P35366 | Microinjected into embryos at (1 mg/ml) |
| Other | Alexa Fluor 647 phalloidin | Invitrogen/Molecular Probes | Cat# A22287; RRID:AB_2620155 | 1:200 Dilution |
| Other | Alexa Fluor 568 phalloidin | Invitrogen/Molecular Probes | Cat# A12379 | 1:500 Dilution |
Additional files
-
Supplementary file 1
Table showing genotypes and sources of fly lines used in this study.
- https://cdn.elifesciences.org/articles/58686/elife-58686-supp1-v1.xlsx
-
Supplementary file 2
Table showing the fly food recipe used in this study.
- https://cdn.elifesciences.org/articles/58686/elife-58686-supp2-v1.xlsx
-
Transparent reporting form
- https://cdn.elifesciences.org/articles/58686/elife-58686-transrepform-v1.docx
Download links
A two-part list of links to download the article, or parts of the article, in various formats.
Downloads (link to download the article as PDF)
Open citations (links to open the citations from this article in various online reference manager services)
Cite this article (links to download the citations from this article in formats compatible with various reference manager tools)
Identification of functionally distinct macrophage subpopulations in Drosophila
eLife 10:e58686.
https://doi.org/10.7554/eLife.58686


