Tumor stiffening reversion through collagen crosslinking inhibition improves T cell migration and anti-PD-1 treatment
- Institut Cochin, INSERM U1016/CNRS UMR 8104, Université de Paris, France
- Equipe Labellisée Ligue Contre le Cancer, France
- Laboratoire Matière et Systèmes Complexes (MSC), CNRS, Université de Paris, France
- Sorbonne Université, Inserm, Centre de Recherche Saint-Antoine, CRSA, France
- TGF-β and Cancer Group, Oncobell Program, Bellvitge Biomedical Research Institute (IDIBELL), Spain
- LPP (Laboratoire de physique des plasmas, UMR 7648), Sorbonne Université, Centre national de la recherche scientifique (CNRS), Ecole Polytechnique, France
- Oncology Program, CIBEREHD, National Biomedical Research Institute on Liver and Gastrointestinal Diseases, Instituto de Salud Carlos III, Spain
- CNRS ERL 9215, CRRET laboratory, University of Paris-Est Créteil (UPEC), France
- Department of Medical Microbiology and Nanobiomedical Engineering, Medical University of Białystok, Poland
- Institute of Nuclear Physics, Polish Academy of Sciences, Poland
Figures
Figure 1
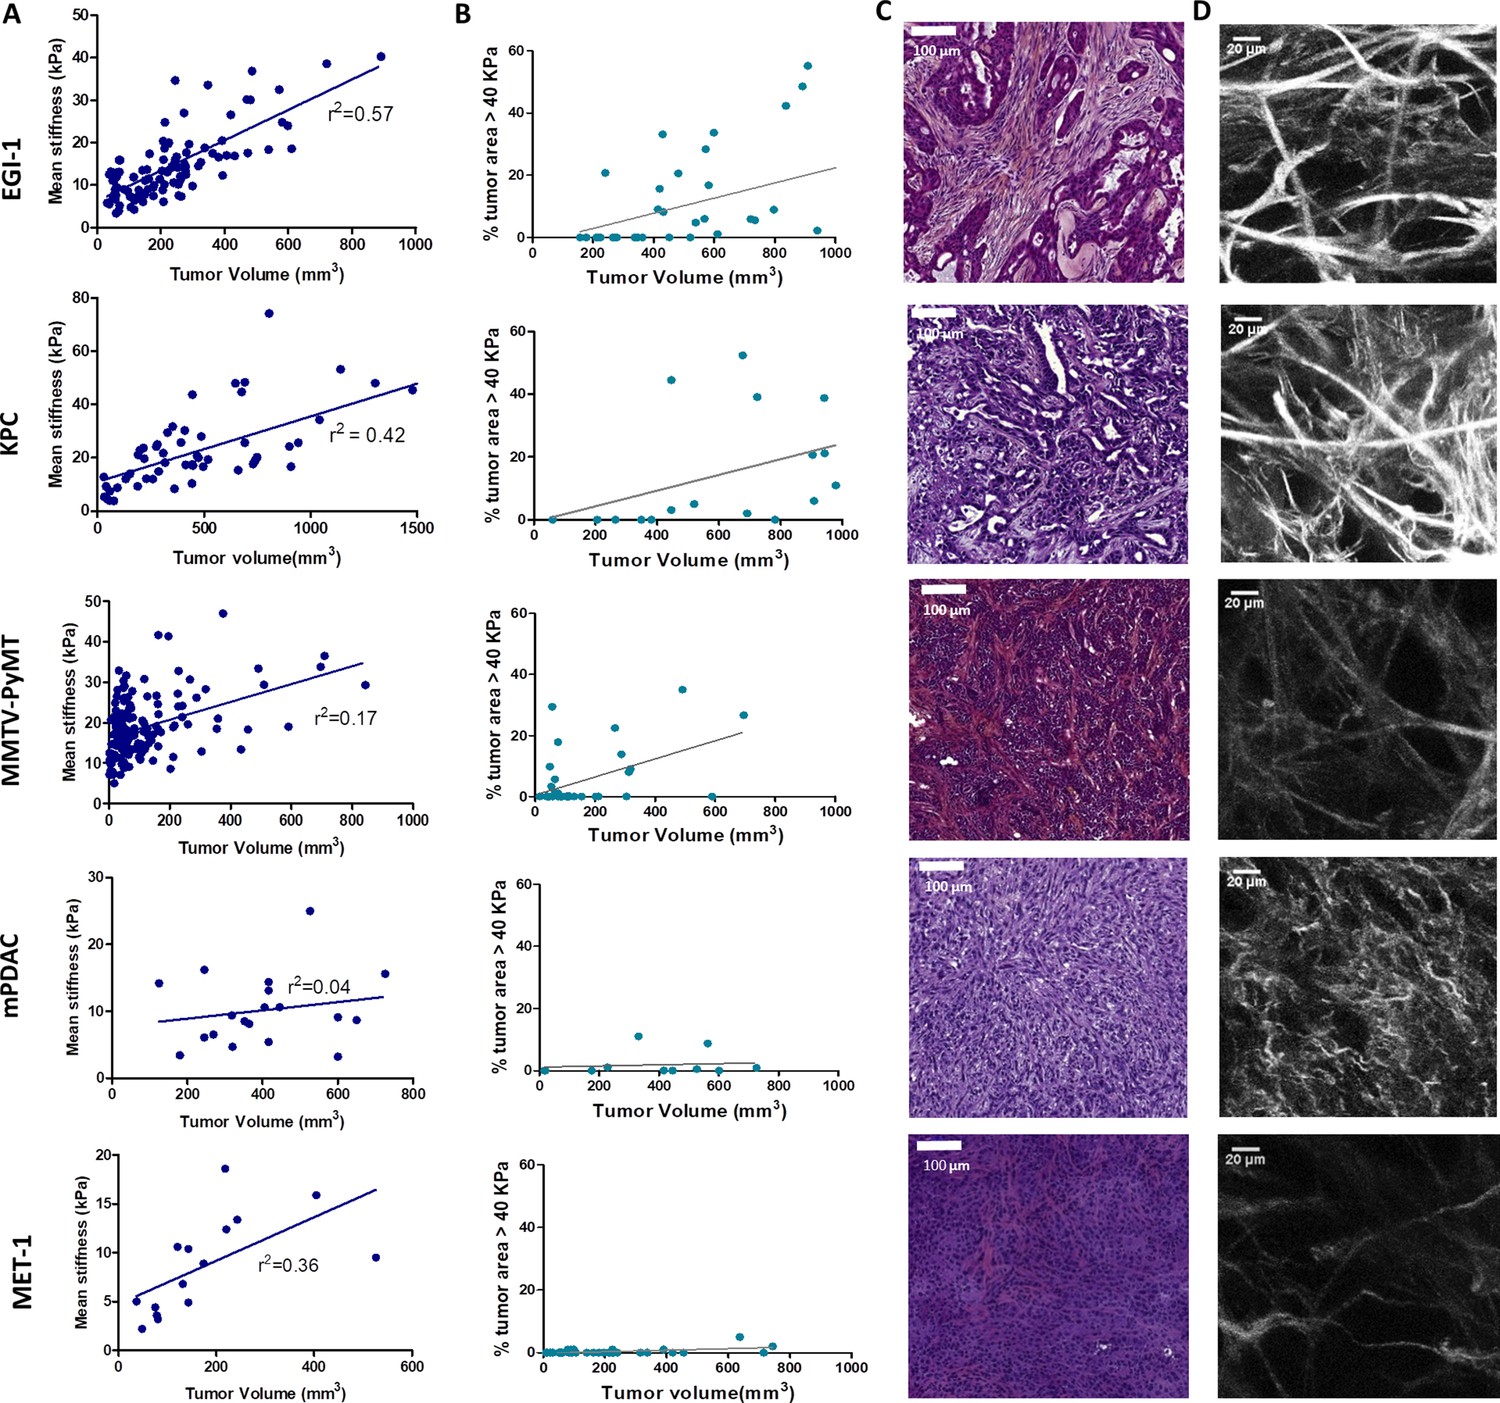
Macroscopic and microscopic characterization of EGI-1, KPC, MMTV-PyMT, mPDAC, and MET-1 tumor models.
(A) Tumor volume and tumor mean stiffness relationship. Tumor volume was measured using a caliper or ultrasound, whilst tumor mean stiffness was measured using SWE. (B) The percentage of stiff regions in relation to tumor volume. The presence of very stiff regions with an elastic modulus > 40 kPa was quantified using data from the stiffness map extracted from the SWE images. (C) Comparison of the histological diversity within the tumor models. Representative images of each tumor model (scale bar = 100 µm). (D) SHG images of the collagen network in each of the models at the end point of the experiment. Scale bar = 20 µm. EGI-1 (n = 30 mice from three independent experiments); KPC (n = 34 mice from three independent experiments); MMTV-PyMT (n = 5 mice, 10 tumors per mouse from two independent experiments); mPDAC (n = 7 mice from two independent experiments); and MET-1 (n = 12 mice from two independent experiments).
-
Figure 1—source data 1
Source data file for Figure 1.
- https://cdn.elifesciences.org/articles/58688/elife-58688-fig1-data1-v2.xlsx
Figure 2 with 6 supplements

Effect of LOX inhibition on tumor stiffness and tumor stroma organization in EGI-1, KPC, MMTV-PyMT, and mPDAC tumor models.
(A) Tumor stiffness measured by SWE in control and BAPN-treated (LOX inhibitor) tumors in relation to tumor volume for EGI-1, MMTV-PyMT, and KPC tumor models. For the mPDAC tumor model, stiffness was only measured at the endpoint of the experiment (*p-value<0.05, **p-value<0.01, ***p-value<0.001 Student’s t-test). (B) Percentage of tumor area with stiffness > 40 kPa at three different time points in the late stages of tumor development. (C) Illustrative examples of SWE images of each on the tumors at the last time point of the experiment (EGI-1 – day 30, KPC – day 41, MMTV-PyMT – day 55, mPDAC – day 21). EGI-1 (n = 30 mice/group from three independent experiments); KPC (n = 34 mice/group from three independent experiments); MMTV-PyMT (n = 5 mice/group, 10 tumors per mouse from two independent experiments); mPDAC (n = 7 mice/group from two independent experiments), and MET-1 (n = 12 mice/group from two independent experiments).
-
Figure 2—source data 1
Source data file for Figure 2.
- https://cdn.elifesciences.org/articles/58688/elife-58688-fig2-data1-v2.xlsx
Figure 2—figure supplement 1

Two-photon imaging analysis of collagen crosslink density from control and BAPN-treated conditions.
(A) Two-photon images of fibrillar collagen (SHG) and collagen crosslinks (720 nm excitation, 400 nm emission) in a KPC tumor. Boxed areas are represented at higher magnification at the right. SHG-positive regions are delineated with yellow lines. (B) Quantification of collagen crosslink density in control and BAPN-treated conditions. Average fluorescence signals were measured in collagen-positive regions. Results are from two tumors of each condition. Student’s t-test: ***p<0.001.
-
Figure 2—figure supplement 1—source data 1
Source data file for Figure 2—figure supplement 1.
- https://cdn.elifesciences.org/articles/58688/elife-58688-fig2-figsupp1-data1-v2.xlsx
Figure 2—figure supplement 2
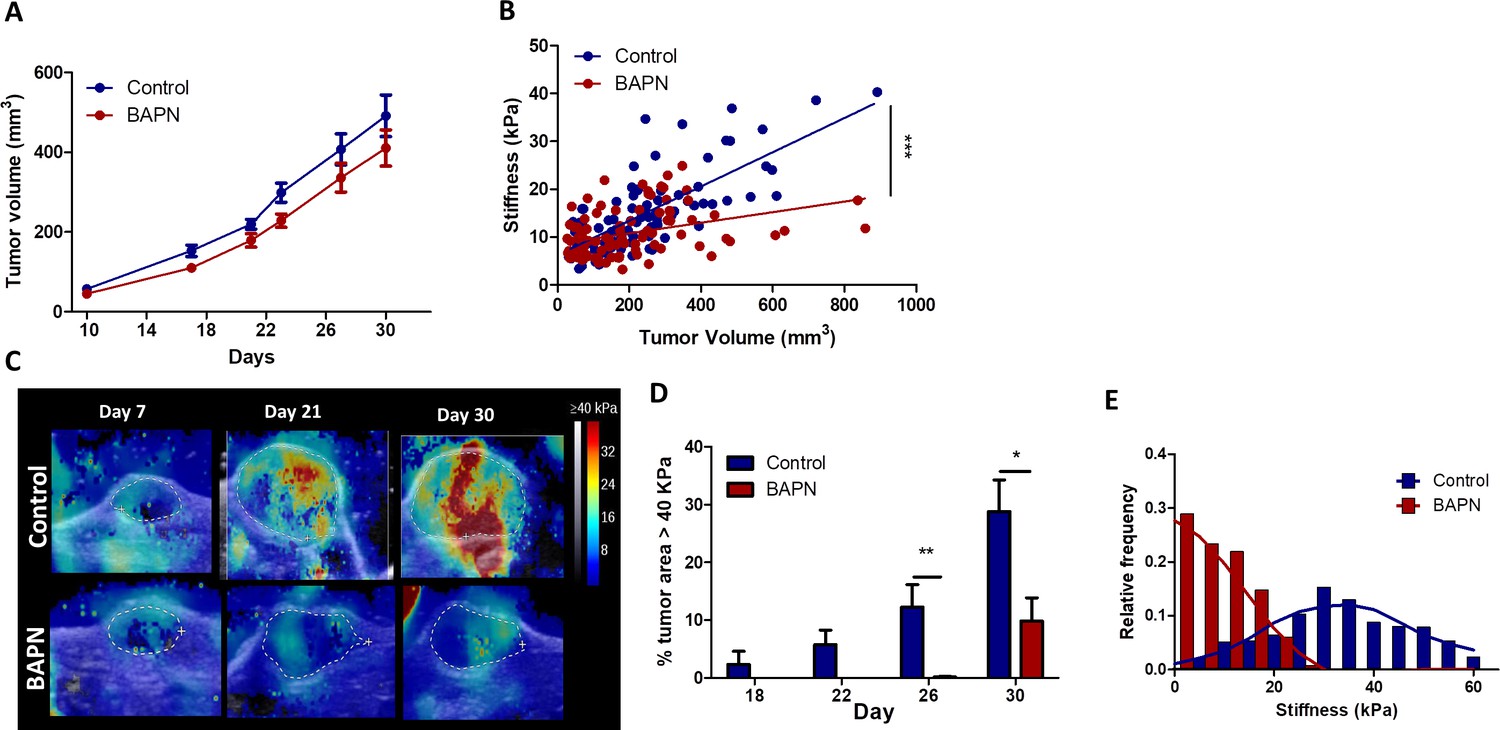
Effect of LOX inhibition in EGI-1 tumor model.
(A) Evolution of tumor growth in control and treated tumors (n = 30 mice/group from three independent experiments). (B) Correlation of tumor mean stiffness and tumor volume for control and treated tumors (***p-value<0.01 ANCOVA, n = 30 mice/group from three independent experiments). (C) Representative SWE images of control and BAPN-treated tumors at days 7, 21, and 30 of treatment. (D) Percentage of the tumor with stiffness > 40 kPa in tumors at days 18, 22, 26, and 30 of treatment. (E) Representative histogram of stiffness distribution in a control and a BAPN-treated tumor at day 30.
-
Figure 2—figure supplement 2—source data 1
Source data file for Figure 2—figure supplement 2.
- https://cdn.elifesciences.org/articles/58688/elife-58688-fig2-figsupp2-data1-v2.xlsx
Figure 2—figure supplement 3
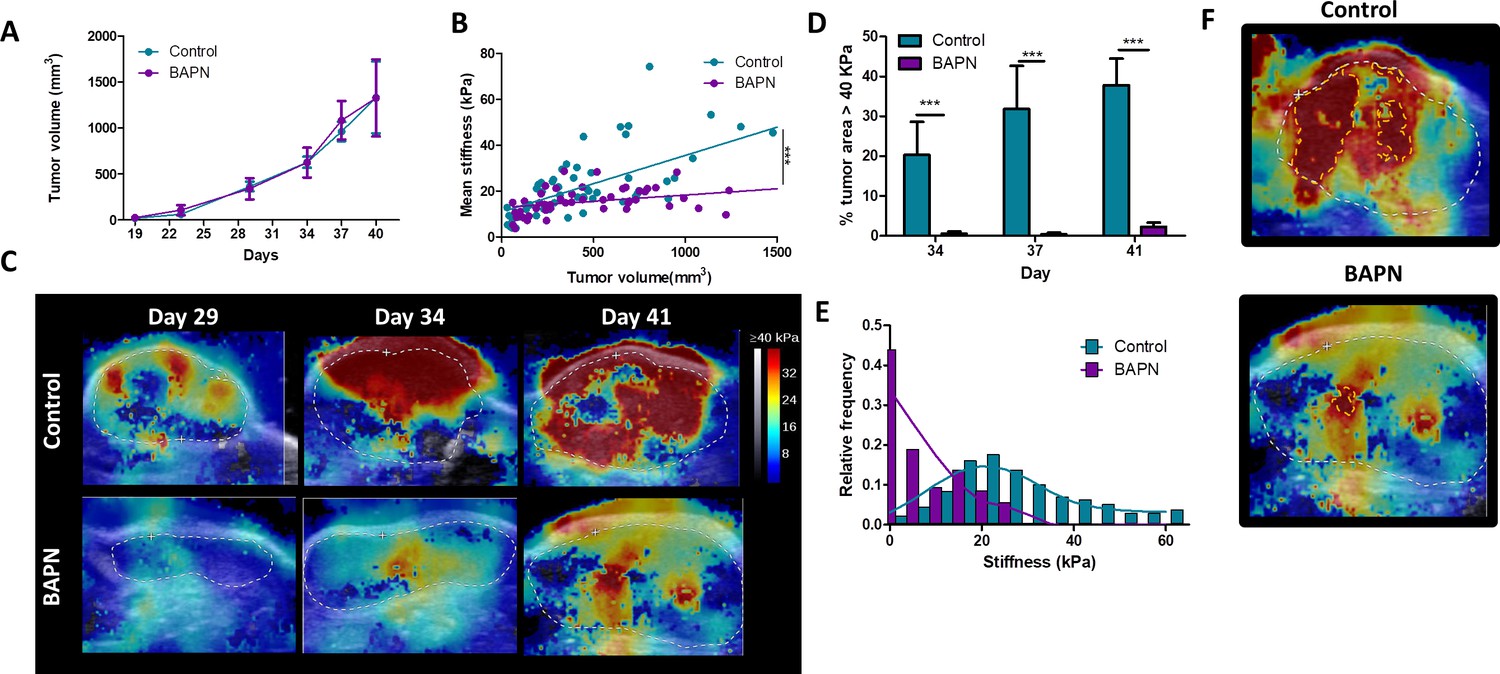
Effect of LOX inhibition in KPC tumor model.
(A) Evolution of tumor growth in control and treated tumors (n = 34 mice/group from three independent experiments). (B) Correlation of mean tumor stiffness and tumor volume for control and treated tumors (***p-value<0.01 ANCOVA, n = 34 mice/group from three independent experiments). (C) Representative SWE images of control and BAPN-treated tumors at days 29, 34, and 41 of treatment. (D) Percentage of the tumor with stiffness > 40 kPa in tumors at days 34, 37, and 41 of treatment. n = 34 mice/group from three independent experiments. (E) Representative histogram of stiffness distribution in a control and a BAPN-treated tumor at day 41. n = 34 mice/group from three independent experiments. (F) Representative SWE images of stiff regions (>40 kPa) in control and treated tumors.
-
Figure 2—figure supplement 3—source data 1
Source data for Figure 2—figure supplement 3.
- https://cdn.elifesciences.org/articles/58688/elife-58688-fig2-figsupp3-data1-v2.xlsx
Figure 2—figure supplement 4
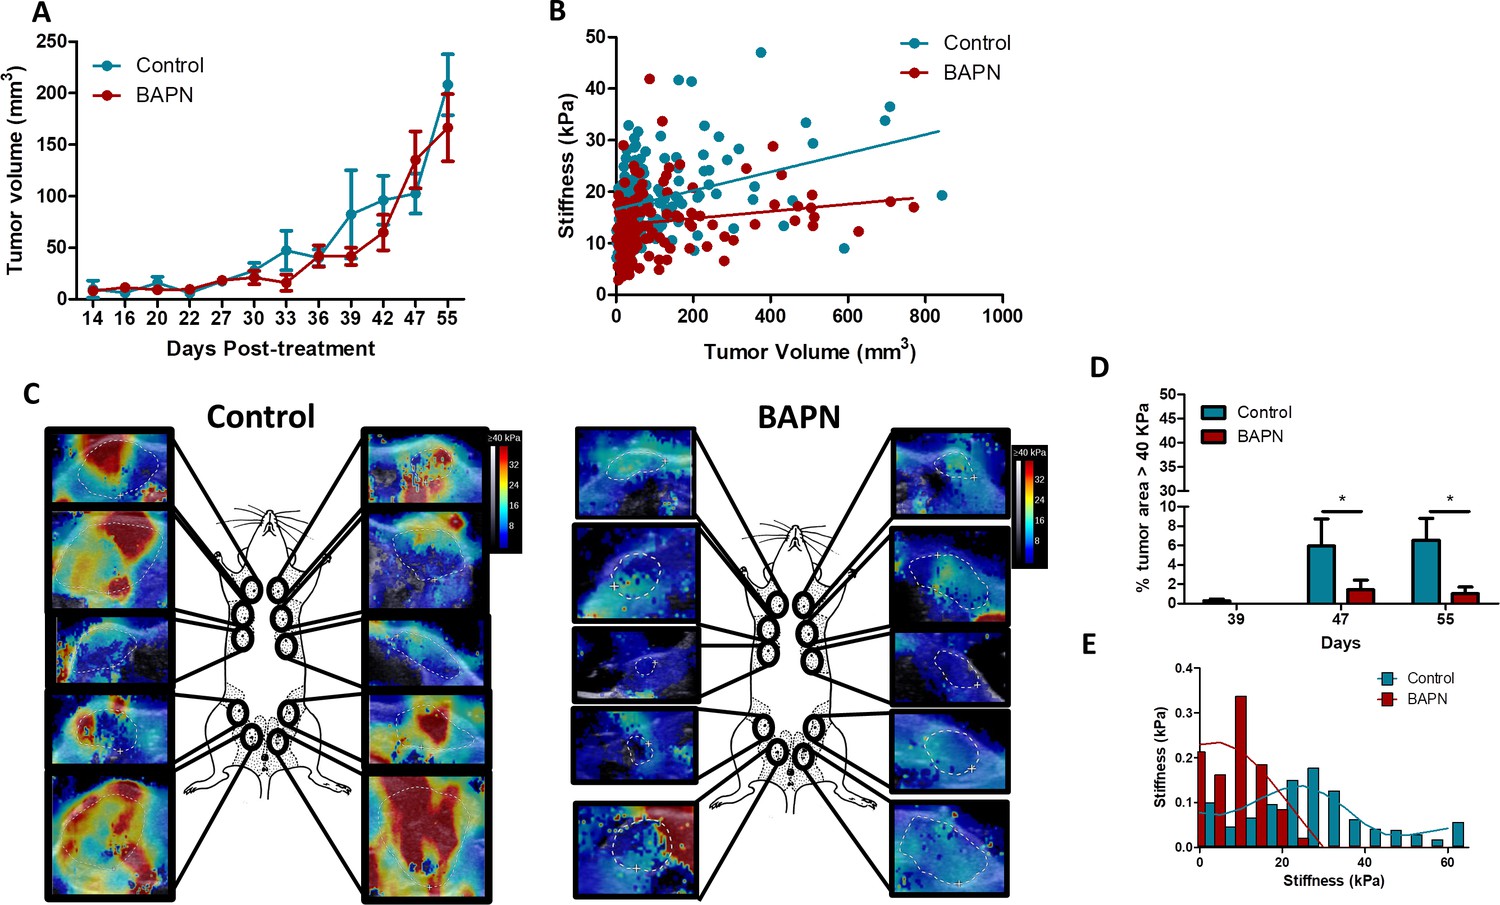
Effect of LOX inhibition in MMTV-PyMT tumor model.
(A) Evolution of tumor growth in control and treated tumors (n = 5 mice/group, 10 tumors per mouse from two independent experiments). (B) Correlation of mean tumor stiffness and tumor volume for control and treated tumors. n = 5 mice/group, 10 tumors per mouse from two independent experiments. (C) Representative SWE images of control and BAPN-treated tumors at day 42 of treatment. (D) Percentage of the tumor with stiffness > 40 kPa in tumors at days 39, 47, and 55 of treatment. n = 5 mice/group, 10 tumors per mouse from two independent experiments. (E) Representative histogram of stiffness distribution in a control and a BAPN-treated tumor at day 55.
-
Figure 2—figure supplement 4—source data 1
Source data file for Figure 2—figure supplement 4.
- https://cdn.elifesciences.org/articles/58688/elife-58688-fig2-figsupp4-data1-v2.xlsx
Figure 2—figure supplement 5
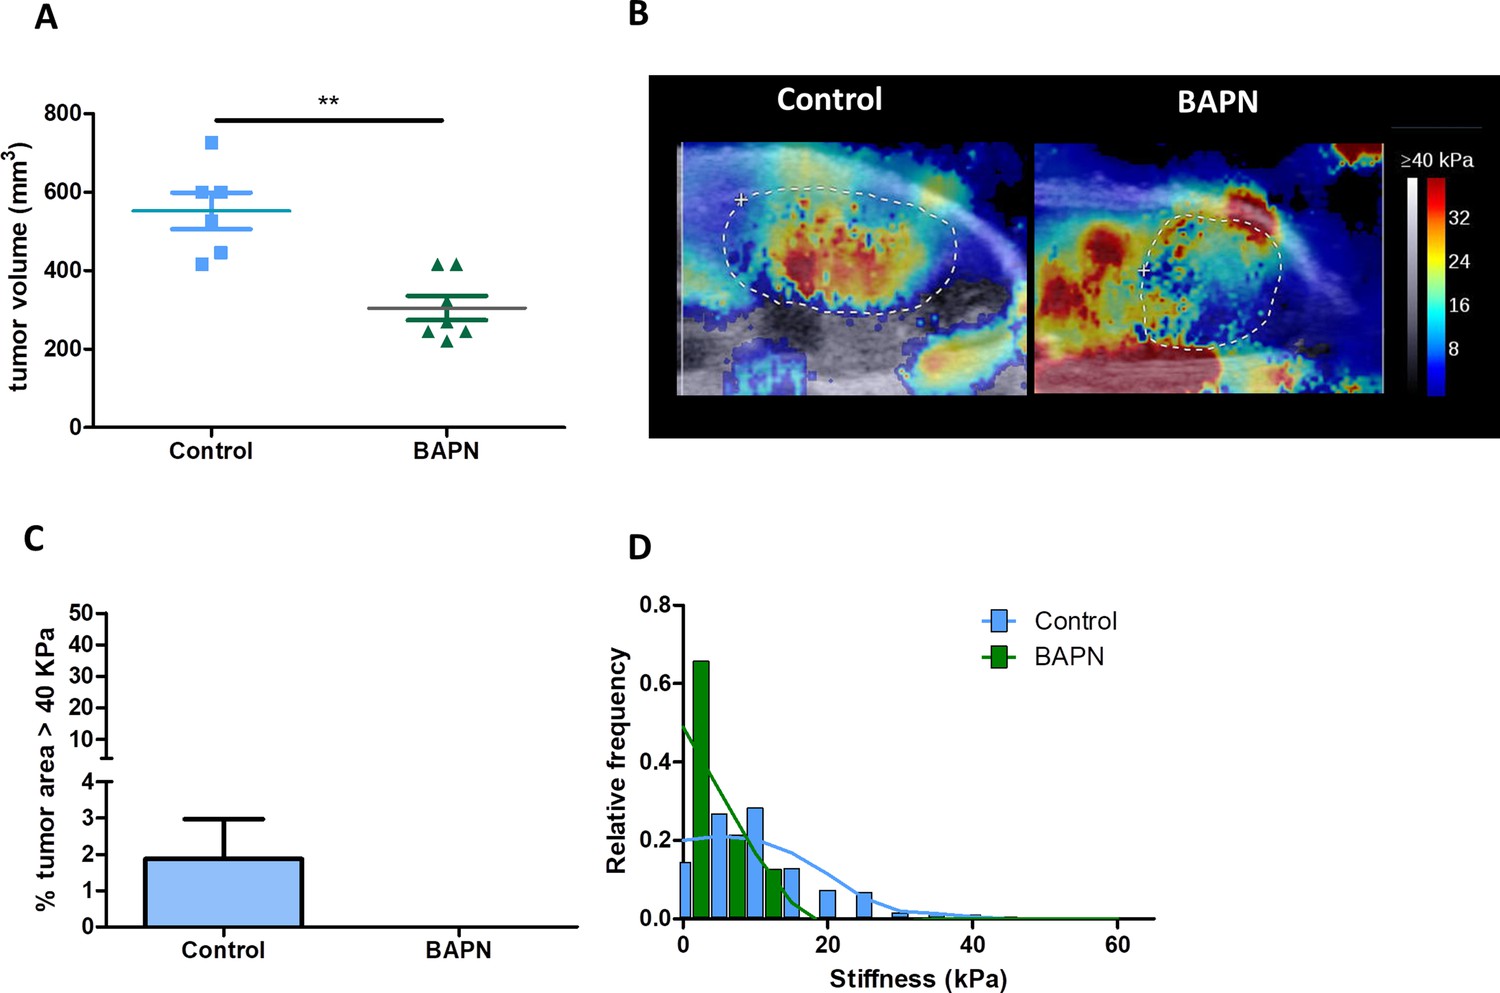
Effect of LOX inhibition in mPDAC tumor model.
(A) Tumor volume measured by ultrasound imaging, at day 21 of treatment (**p-value<0.01, Student’s t-test, n = 7 mice/group). (B) Representative SWE images of control and BAPN-treated tumors at day 21. (C) Percentage of the tumor with stiffness > 40 kPa in tumors at day 21. (D) Representative histogram of stiffness distribution in a control and a BAPN-treated tumor at day 21.
-
Figure 2—figure supplement 5—source data 1
Source data file for Figure 2—figure supplement 5.
- https://cdn.elifesciences.org/articles/58688/elife-58688-fig2-figsupp5-data1-v2.xlsx
Figure 2—figure supplement 6
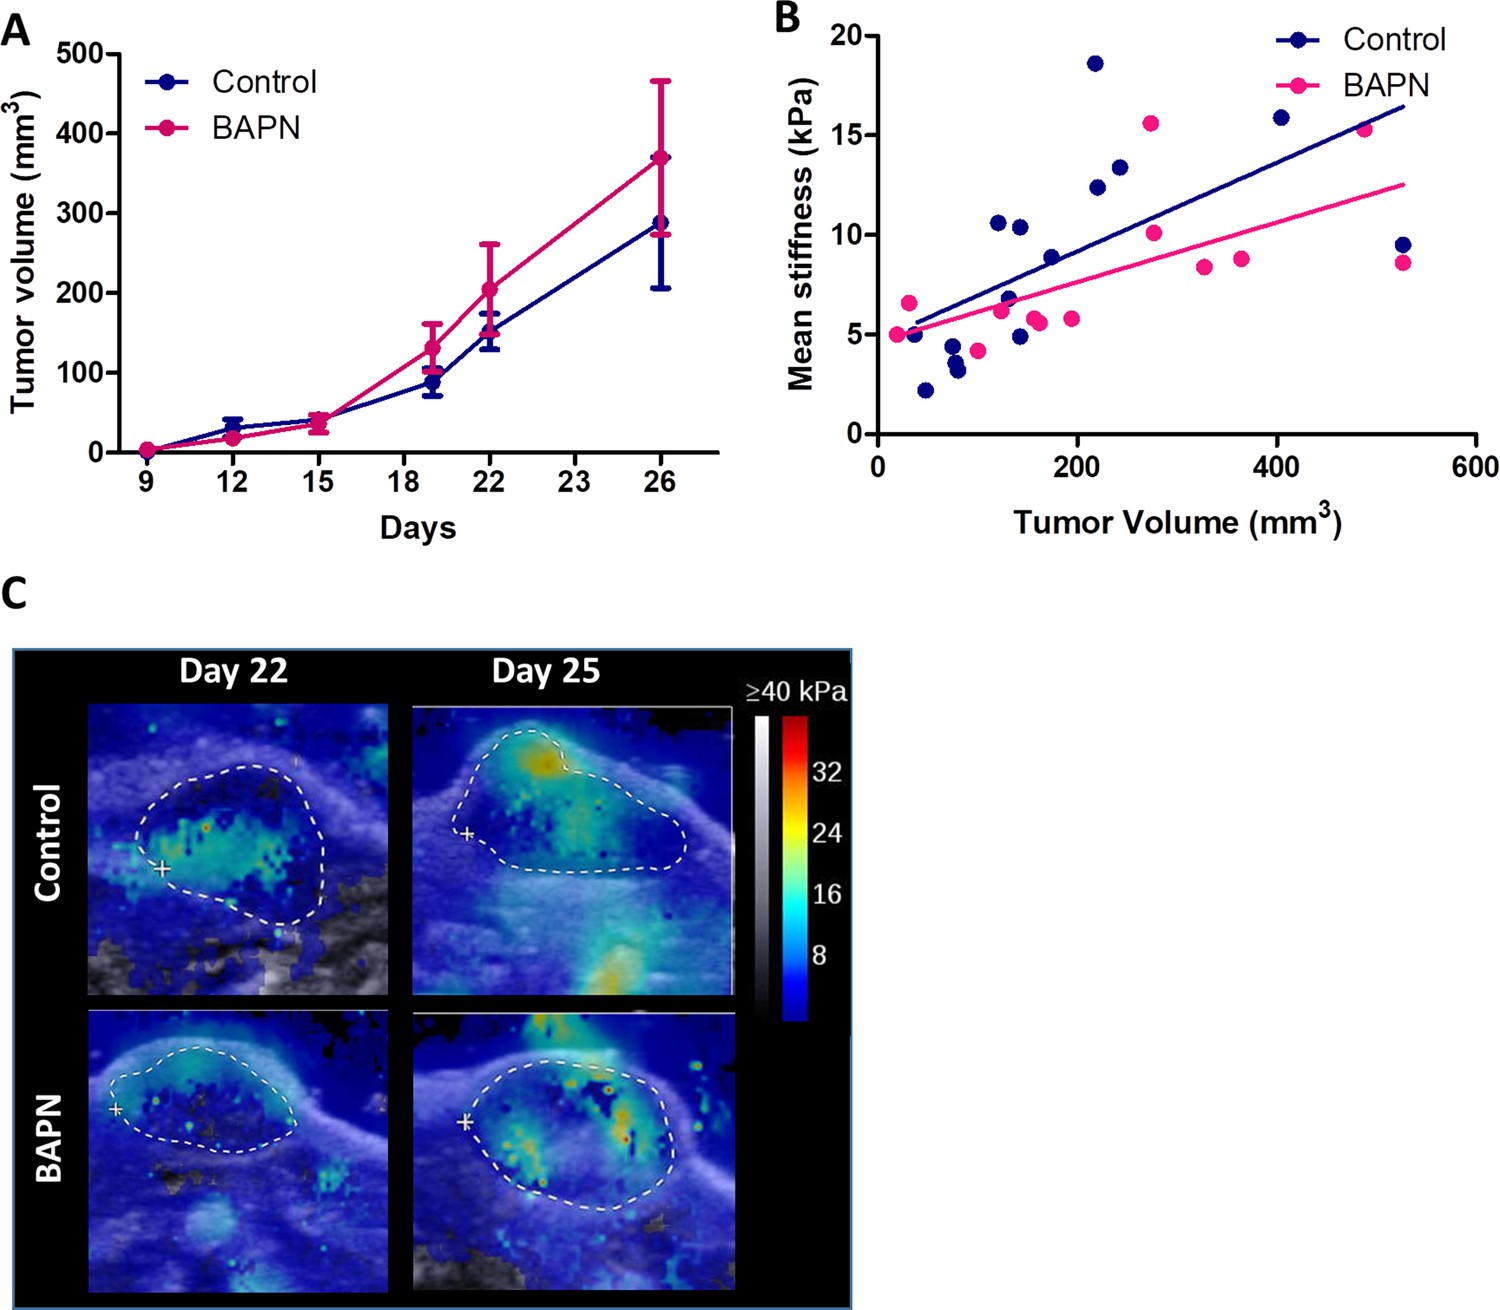
Effect of LOX inhibition in MET-1 tumor model.
(A) Evolution of tumor growth in control and treated tumors (n = 12 mice/group). (B) Correlation of tumor mean stiffness and tumor volume for control and treated tumors. (C) Representative SWE images of control and BAPN-treated tumors at day 26 of treatment.
-
Figure 2—figure supplement 6—source data 1
Source data file for Figure 2—figure supplement 6.
- https://cdn.elifesciences.org/articles/58688/elife-58688-fig2-figsupp6-data1-v2.xlsx
Figure 3 with 1 supplement
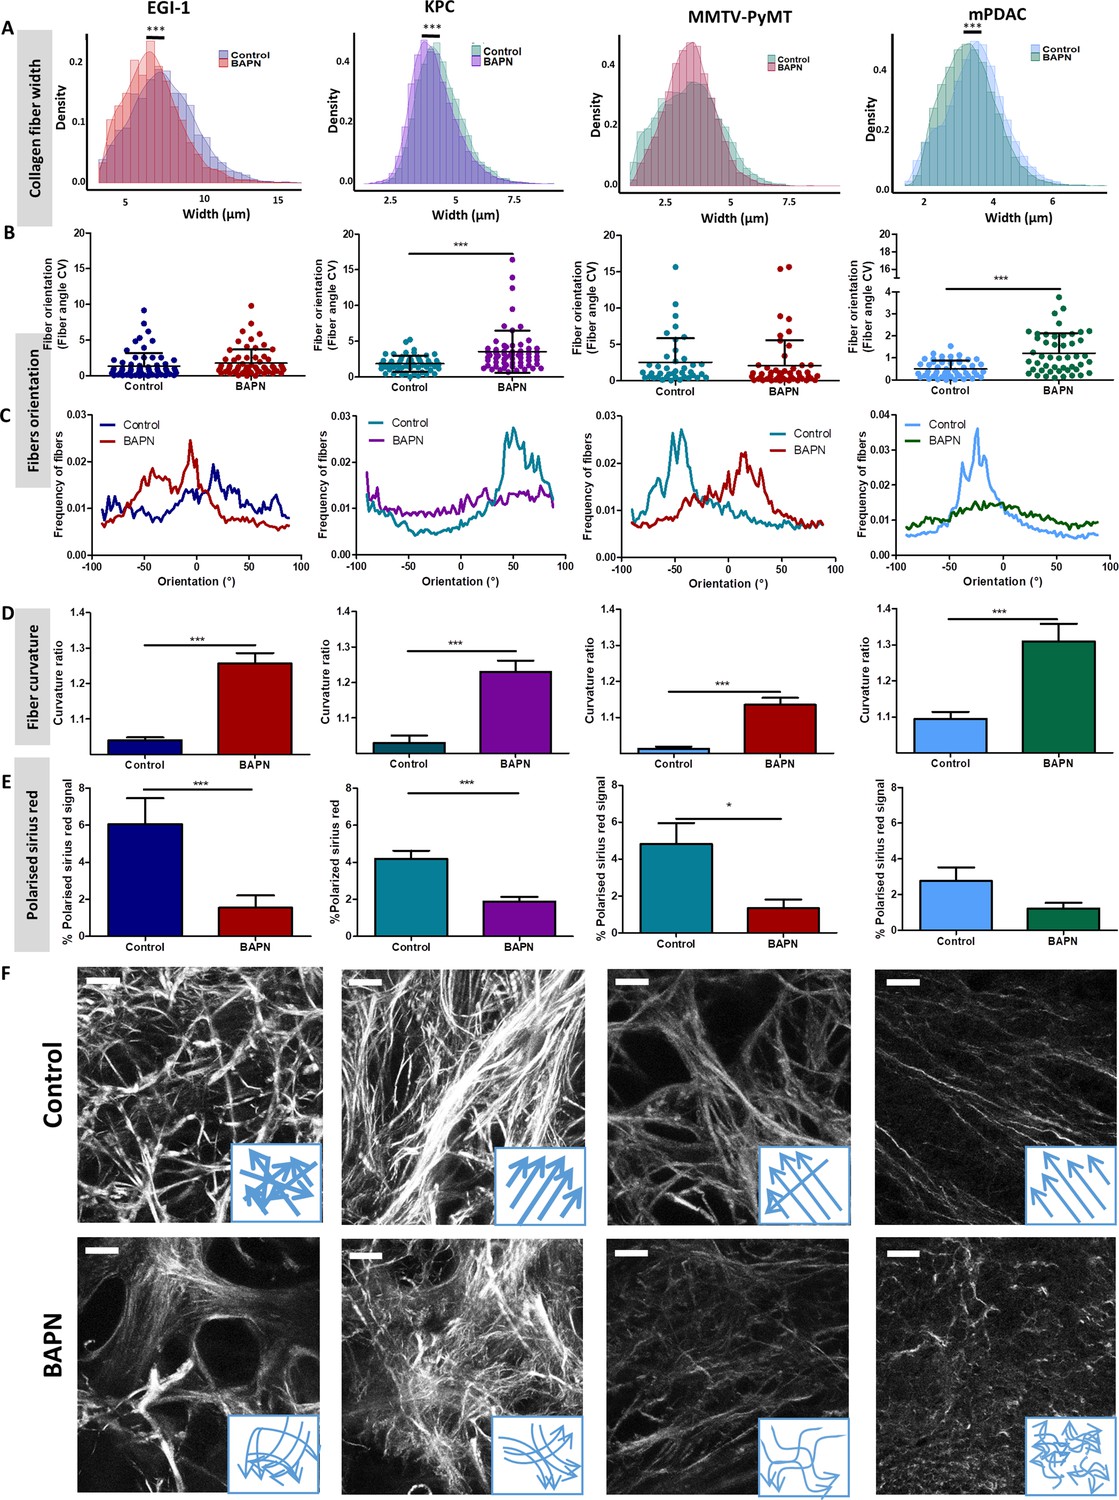
Effect of LOX inhibition on ECM architecture in EGI-1, KPC, MMTV-PyMT, and mPDAC tumor models.
(A) Collagen fiber width distribution measured from SHG images (***p-value<0.001, Student’s t-test, 50–70 images/tumor, n = 3 mice/group from three independent experiments). (B) Fiber orientation defined by the coefficient of variation (CV) (***p-value<0.001, Student’s t-test, 40–50 images/tumor, n = 3 mice/group from three independent experiments). (C) Representative example of fiber orientation distribution. (D) Collagen fiber curvature defined by the curvature ratio (***p-value<0.001, Student’s t-test, 40–50 images/tumor, n = 3 mice/group from three independent experiments). (E) Percentage of red-orange birefringent fibers combining Red Sirius staining and polarized microscopy, orange-red fibers correspond to thick and packed regions (*p-value<0.05, ***p-value<0.001, Student’s t-test, 20–30 images/tumor, n = 3 mice/group from three independent experiments). (F) SHG images of collagen networks in EGI-1, MMTV-PyMT, mPDAC, and KPC control and BAPN-treated tumors. Illustrative scheme indicating the changes in width, orientation and curvature of collagen fibers induced by BAPN treatment. Scale bar = 50 µm. Images are representative of three experiments.
-
Figure 3—source data 1
Source data file for Figure 3.
- https://cdn.elifesciences.org/articles/58688/elife-58688-fig3-data1-v2.xlsx
Figure 3—figure supplement 1
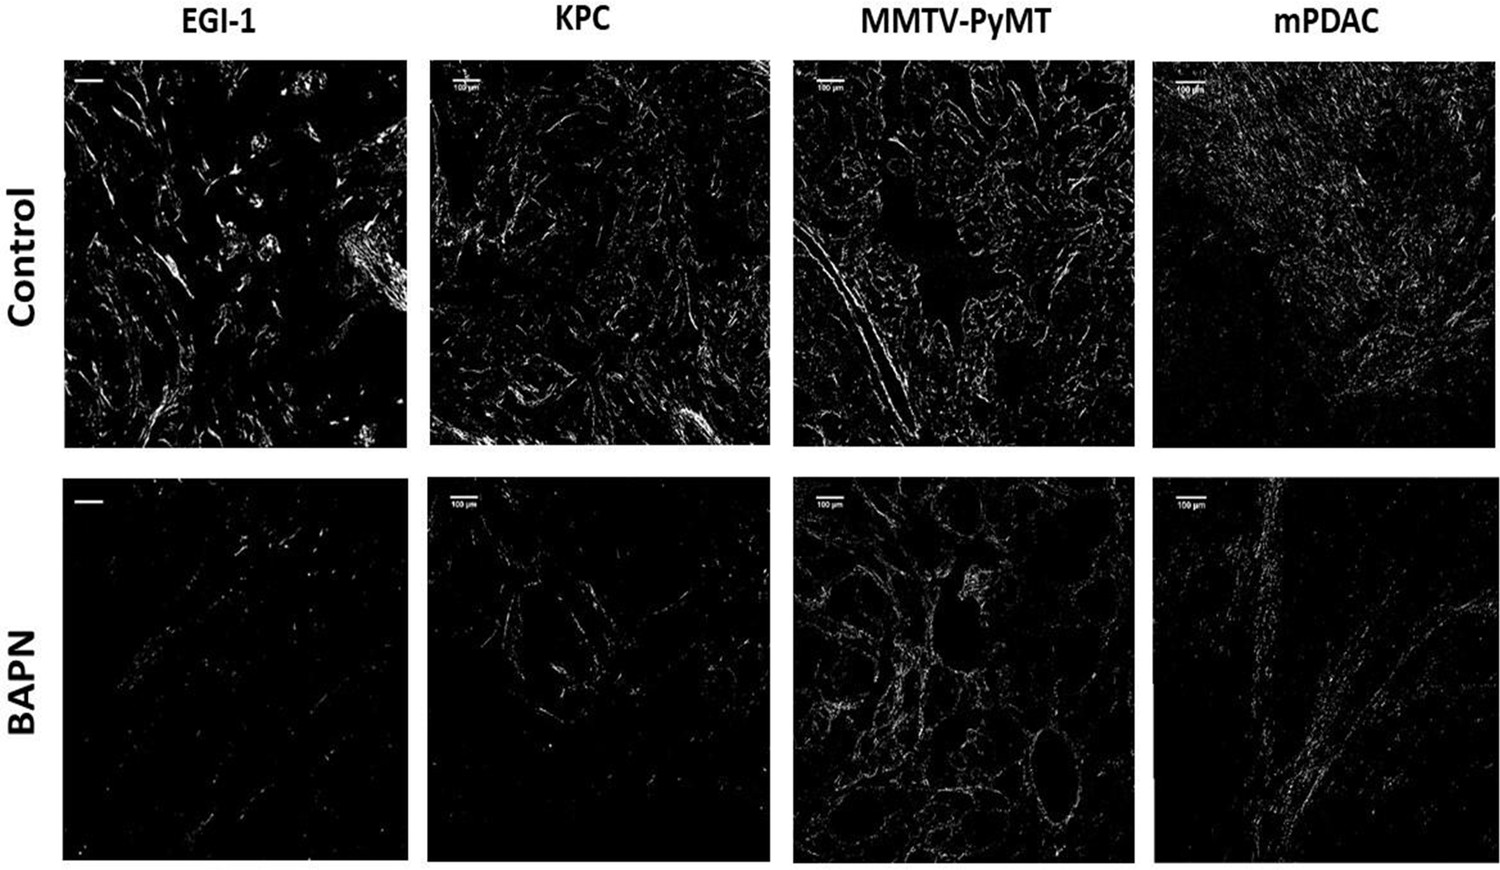
Combination of Sirius Red staining and polarized microscopy.
Surface covered by red-orange birefringent fibers that correspond to thick and packed regions in EGI-1 MMTV-PyMT, mPDAC, and KPC tumor models. Scale bar = 100 µm.
Figure 4 with 2 supplements
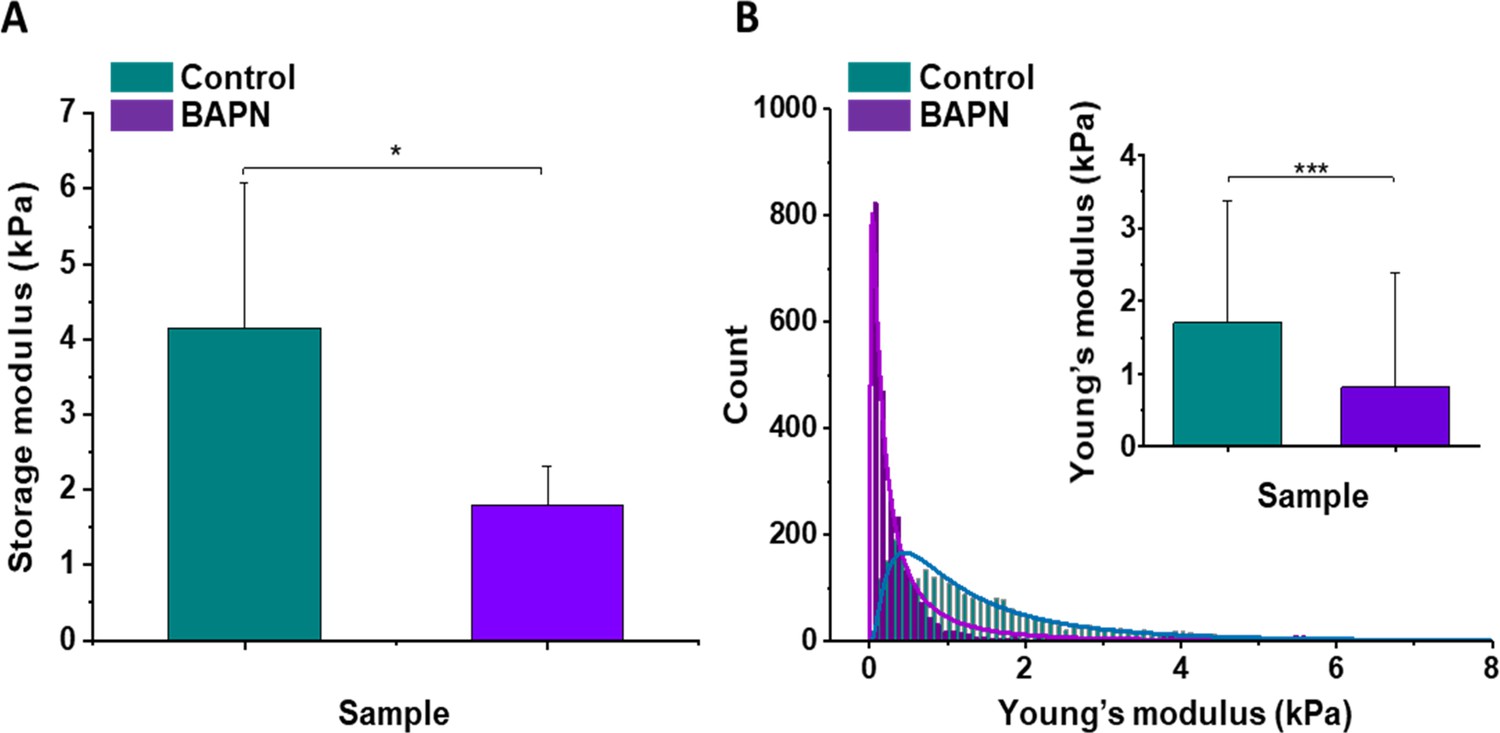
Mechanical properties of the mouse pancreatic ductal adenocarcinoma KPC tumor model and effects of LOX inhibition.
(A) Rheological properties of tumor samples measured using a plate shear rheometer. Mean storage modulus (G’) for all control and BAPN-treated samples ± SD are presented (for 5% sample compression). (B) The Young’s modulus values distributions obtained for all control and treated tumor samples using the AFM indentation technique. Inset in (B) shows tissues’ Young’s modulus mean values ± standard deviation to highlight the difference between control and BAPN tissues. Statistical significance was determined using a two-tailed Student’s t-test for overall values (***p-value<0.001, Student’s t-test, n = 6 tumors/group from three AFM experiments; *p-value<0.05, Student’s t-test, n = 5 tumors/group from three rheometer experiments).
-
Figure 4—source data 1
Source data file for Figure 4.
- https://cdn.elifesciences.org/articles/58688/elife-58688-fig4-data1-v2.xlsx
Figure 4—figure supplement 1
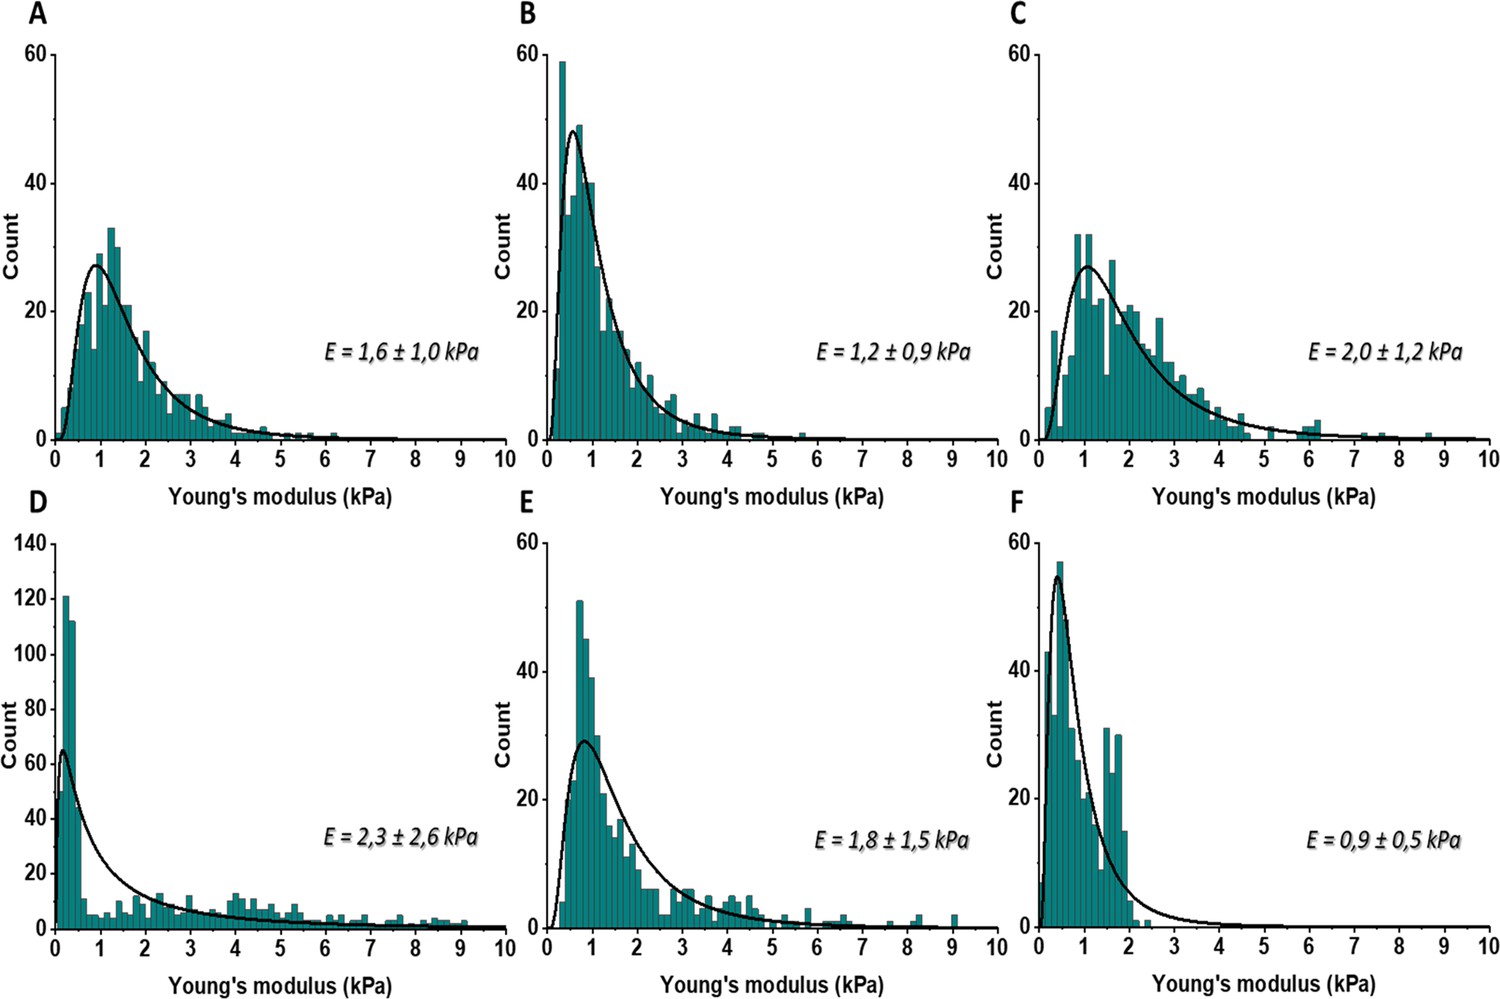
The distributions of Young’s moduli obtained for the control mouse pancreatic ductal adenocarcinoma.
KPC tumor model (control) using AFM indentation technique with maximal indentation depth by AFM probe equal 2 µm. Distributions were fitted with the probability density function of the log-normal distribution and corresponding mean ± SD values are presented on the right side of each distribution.
-
Figure 4—figure supplement 1—source data 1
Source data file for Figure 4—figure supplement 1.
- https://cdn.elifesciences.org/articles/58688/elife-58688-fig4-figsupp1-data1-v2.xlsx
Figure 4—figure supplement 2
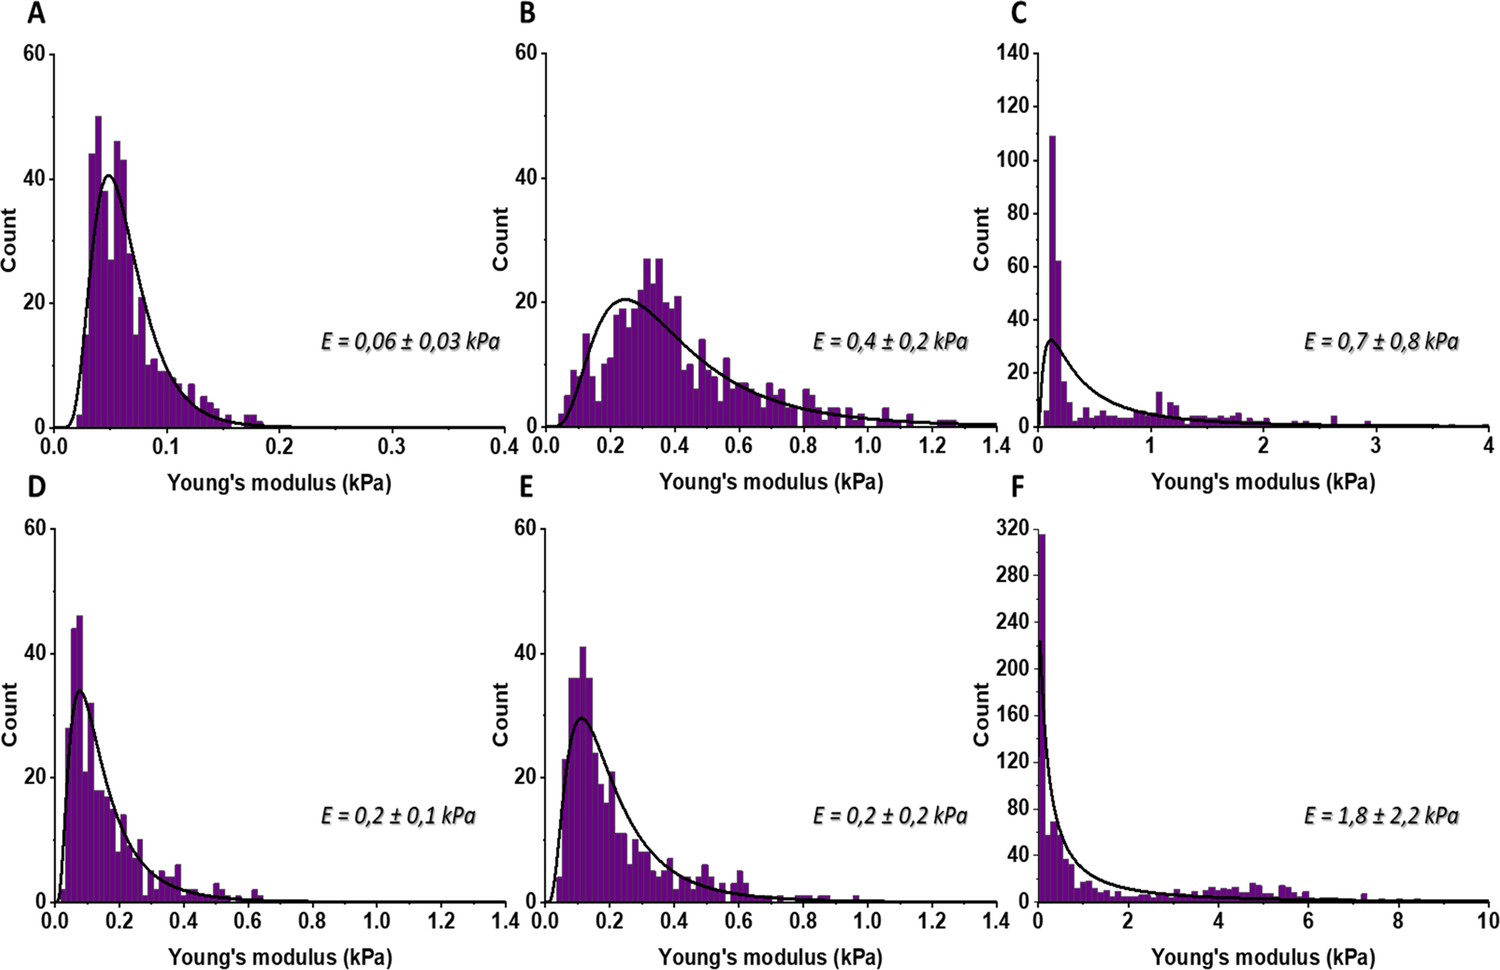
The distributions of Young’s moduli obtained for the BAPN-treated mouse pancreatic ductal adenocarcinoma.
KPC tumor model (BAPN) using AFM indentation technique with maximal indentation depth by AFM probe equal 2 µm. Distributions were fitted with the probability density function of the log-normal distribution and corresponding mean ± SD values are presented on the right side of each distribution.
-
Figure 4—figure supplement 2—source data 1
Source data file for Figure 4—figure supplement 2.
- https://cdn.elifesciences.org/articles/58688/elife-58688-fig4-figsupp2-data1-v2.xlsx
Figure 5 with 1 supplement

Impact of LOX inhibition on T cell migration in EGI-1, MMTV-PyMT, mPDAC, and KPC tumor models.
Migration of activated PBT plated onto fresh tumor slices was analyzed in EGI-1 and MMTV-PyMT tumor model, whilst resident tumor-infiltrating T lymphocytes were analyzed in mPDAC and KPC tumor model. Illustrative images of T cell migration tracks in EGI-1, MMTV-PyMT, mPDAC, and KPC tumor models. Tumor stroma (fibronectin) in red, tumor cells (EpCAM in EGI-1, MMTV-PyMT, and KPC tumor models, CD44 in mPDAC tumor models), in blue and T cells (CD8 in mPDAC and KPC, Calcein in MMTV-PyMT, and EGI-1 tumor models) in green. Tracks are color-coded to illustrate track displacement. Scale bar = 100 µm. T cell migration speed, T cell displacement, and trajectory straightness in all tumor models. ***p-value>0.001, p-value>0.05, Student’s t-test. Results are shown as mean ± SD.
-
Figure 5—source data 1
Source data file for Figure 5.
- https://cdn.elifesciences.org/articles/58688/elife-58688-fig5-data1-v2.xlsx
Figure 5—figure supplement 1
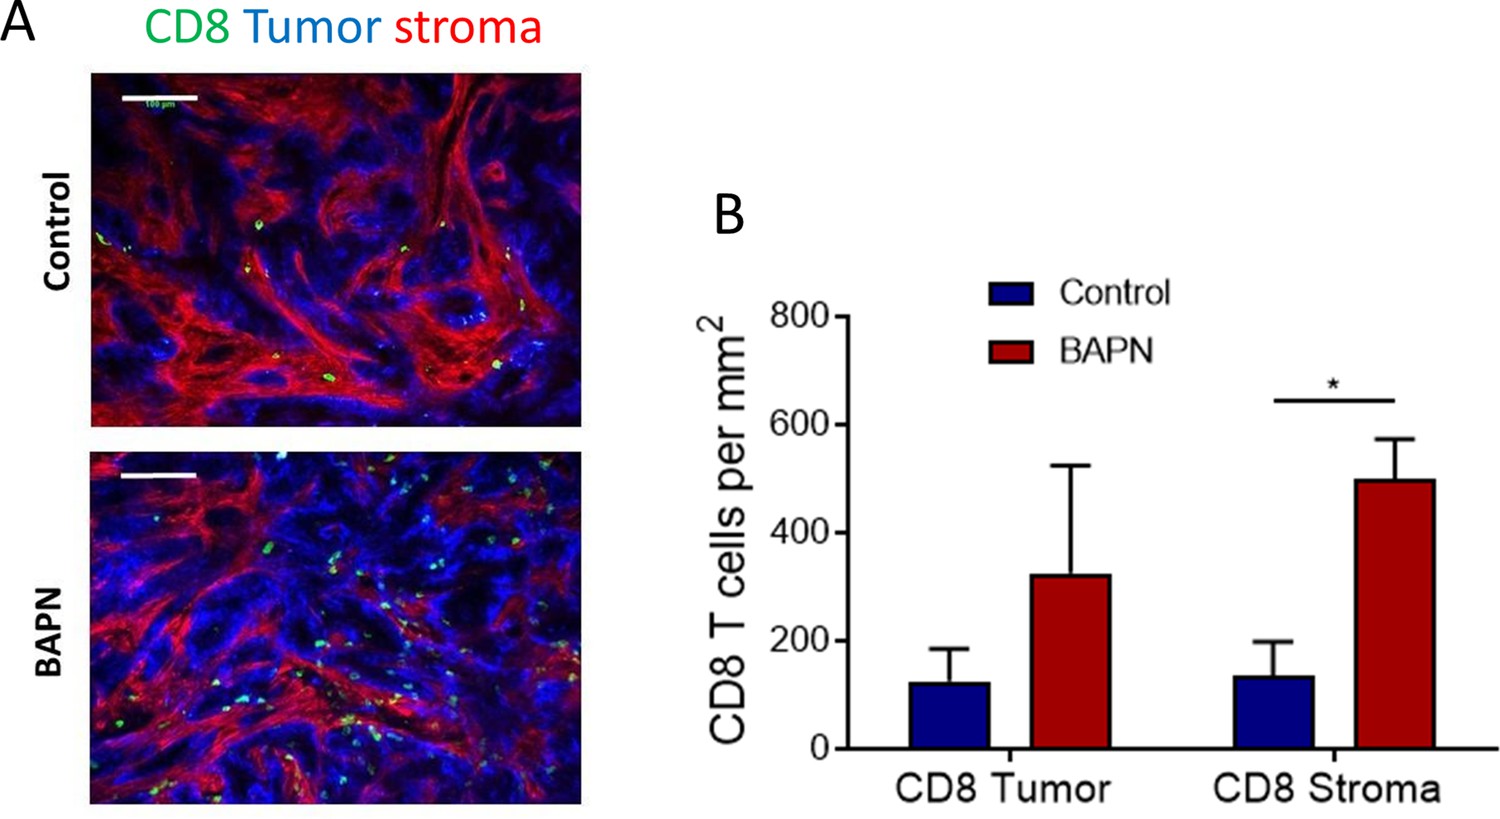
BAPN treatment induces an increased infiltration of effector CD8+T cells in KPC tumors.
(A) Representative images of Control and BAPN-treated KPC tumors. Tumor cells (EpCAM) in blue, tumor stroma (fibronectin) in red, and T cells (CD8) in green. Scale bar = 100 µm. (B) Quantification of CD8+ T cells per mm2 in tumor islets and stroma regions in control and BAPN (*p<0.01, Student’s t-test, n = 2–3 mice/group).
-
Figure 5—figure supplement 1—source data 1
Source data file for Figure 5—figure supplement 1.
- https://cdn.elifesciences.org/articles/58688/elife-58688-fig5-figsupp1-data1-v2.xlsx
Figure 6
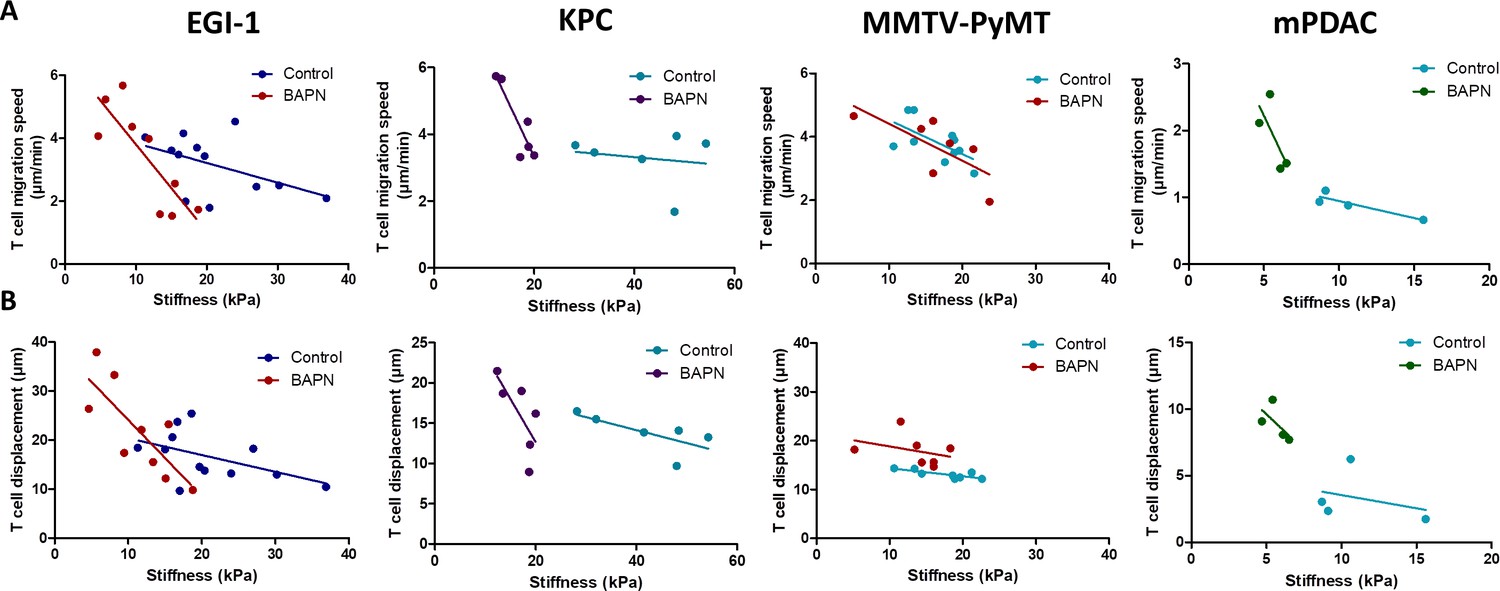
Correlation between mean tumor stiffness and T cell migration parameters in EGI-1, KPC, MMTV-PyMT, and mPDAC tumor models.
(A) Correlation between mean tumor stiffness and mean T cell velocity. (B) Correlation between mean tumor stiffness and mean T cell displacement. Averaged T cell velocity and displacement were calculated from at least 50 individual cells. Each point represents values from an individual mouse. EGI-1 (n = 8 mice/group); KPC (n = 4 mice/group); MMTV-PyMT (n = 6–7 mice/group); and mPDAC (n = 4 mice/group) from two to three experiments.
-
Figure 6—source data 1
Source data file for Figure 6.
- https://cdn.elifesciences.org/articles/58688/elife-58688-fig6-data1-v2.xlsx
Figure 7 with 2 supplements

LOX inhibition increases the efficiency of anti-PD-1 therapy in KPC tumor model.
(A) Tumor volume fold change after combination therapy of BAPN with anti-PD-1. n = 8 mice/group from two independent experiments. (B) CD11b+, Ly6G+, Ly6C+PMN/mg of tissue. (C) CD64+F4/80+MHCII+TAMs/mg of tissue. (D) CD8+ T cells/mg tissue. (E) CD8+ to FoxP3+Treg ratio. (F–H) Multiplex analysis of inflammatory chemokines (TNFα, RANTES, and GrzmB) produced by fresh KPC tumor slices kept in culture for 18 hr (*** p-value<0.001, * p-value<0.05, one-way ANOVA, Krustal Walis, n = 8 slices per condition from two independent experiments).
-
Figure 7—source data 1
Source data file for Figure 7.
- https://cdn.elifesciences.org/articles/58688/elife-58688-fig7-data1-v2.xlsx
Figure 7—figure supplement 1
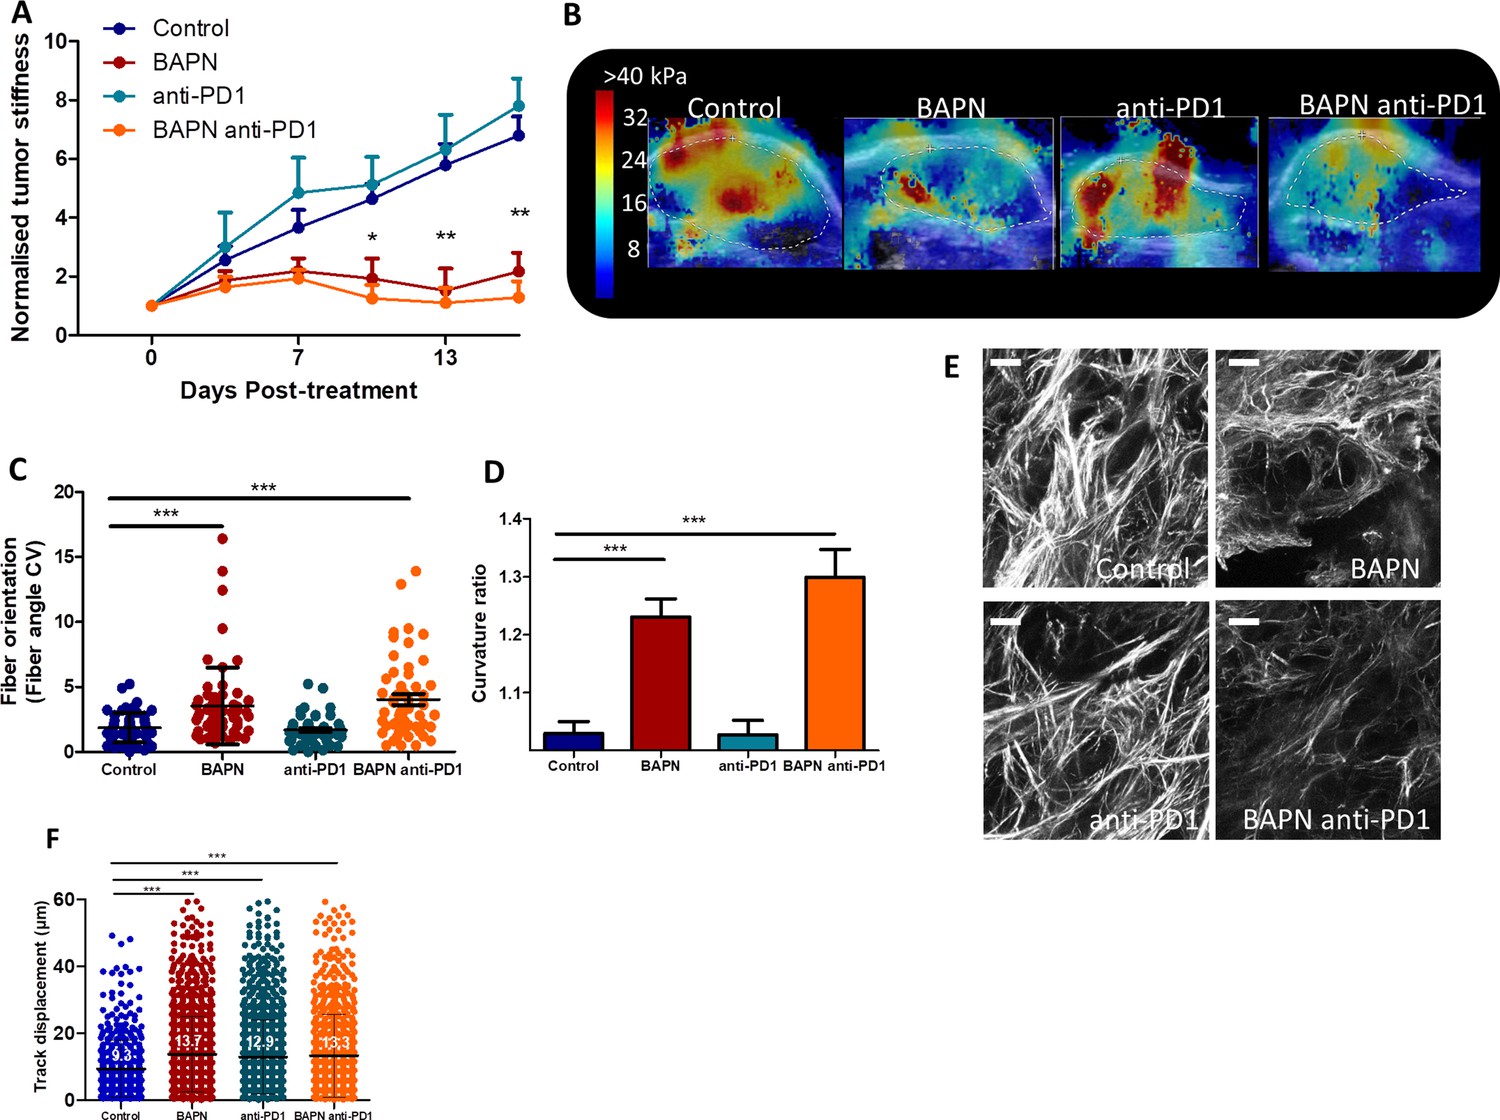
Effect of LOX inhibition and anti-PD1 therapy on tumor stiffness, stroma organization and T cell motility in KPC tumors.
(A) Tumor stiffness measured by SWE in control, BAPN, anti-PD1, and combination of BAPN and anti-PD1 treated tumors (**p-value<0.01, *p-value<0.05, one-way ANOVA, Kruskal–Walis, n = 8 mice/group from two independent experiments). (B) Illustrative examples of SWE of each of the conditions at day 17 post-treatment (experiment endpoint). (C) Fiber orientation defined by the coefficient of variation (CV) (***p-value<0.001, one-way ANOVA, Kruskal–Walis, 40–50 images/tumor, n = 3 mice/group). (D) Collagen fiber curvature defined by the curvature ratio (***p-value<0.001, one-way ANOVA, Kruskal–Walis, 40–50 images/tumor, n = 3 mice/group). (E) SHG images of collagen networks of KPC tumor models for the different conditions: control, BAPN, anti-PD1, combination BAPN, and anti-PD1. Scale bar = 50 µm. (F) Displacement of endogenous CD8 T cells in KPC tumor slices (n = 3 mice/group from two independent experiments). ***p-value>0.001, p-value>0.05, Student’s t-test. Results are shown as mean ± SD.
-
Figure 7—figure supplement 1—source data 1
Source data file for Figure 7-figure supplement 1.
- https://cdn.elifesciences.org/articles/58688/elife-58688-fig7-figsupp1-data1-v2.xlsx
Figure 7—figure supplement 2
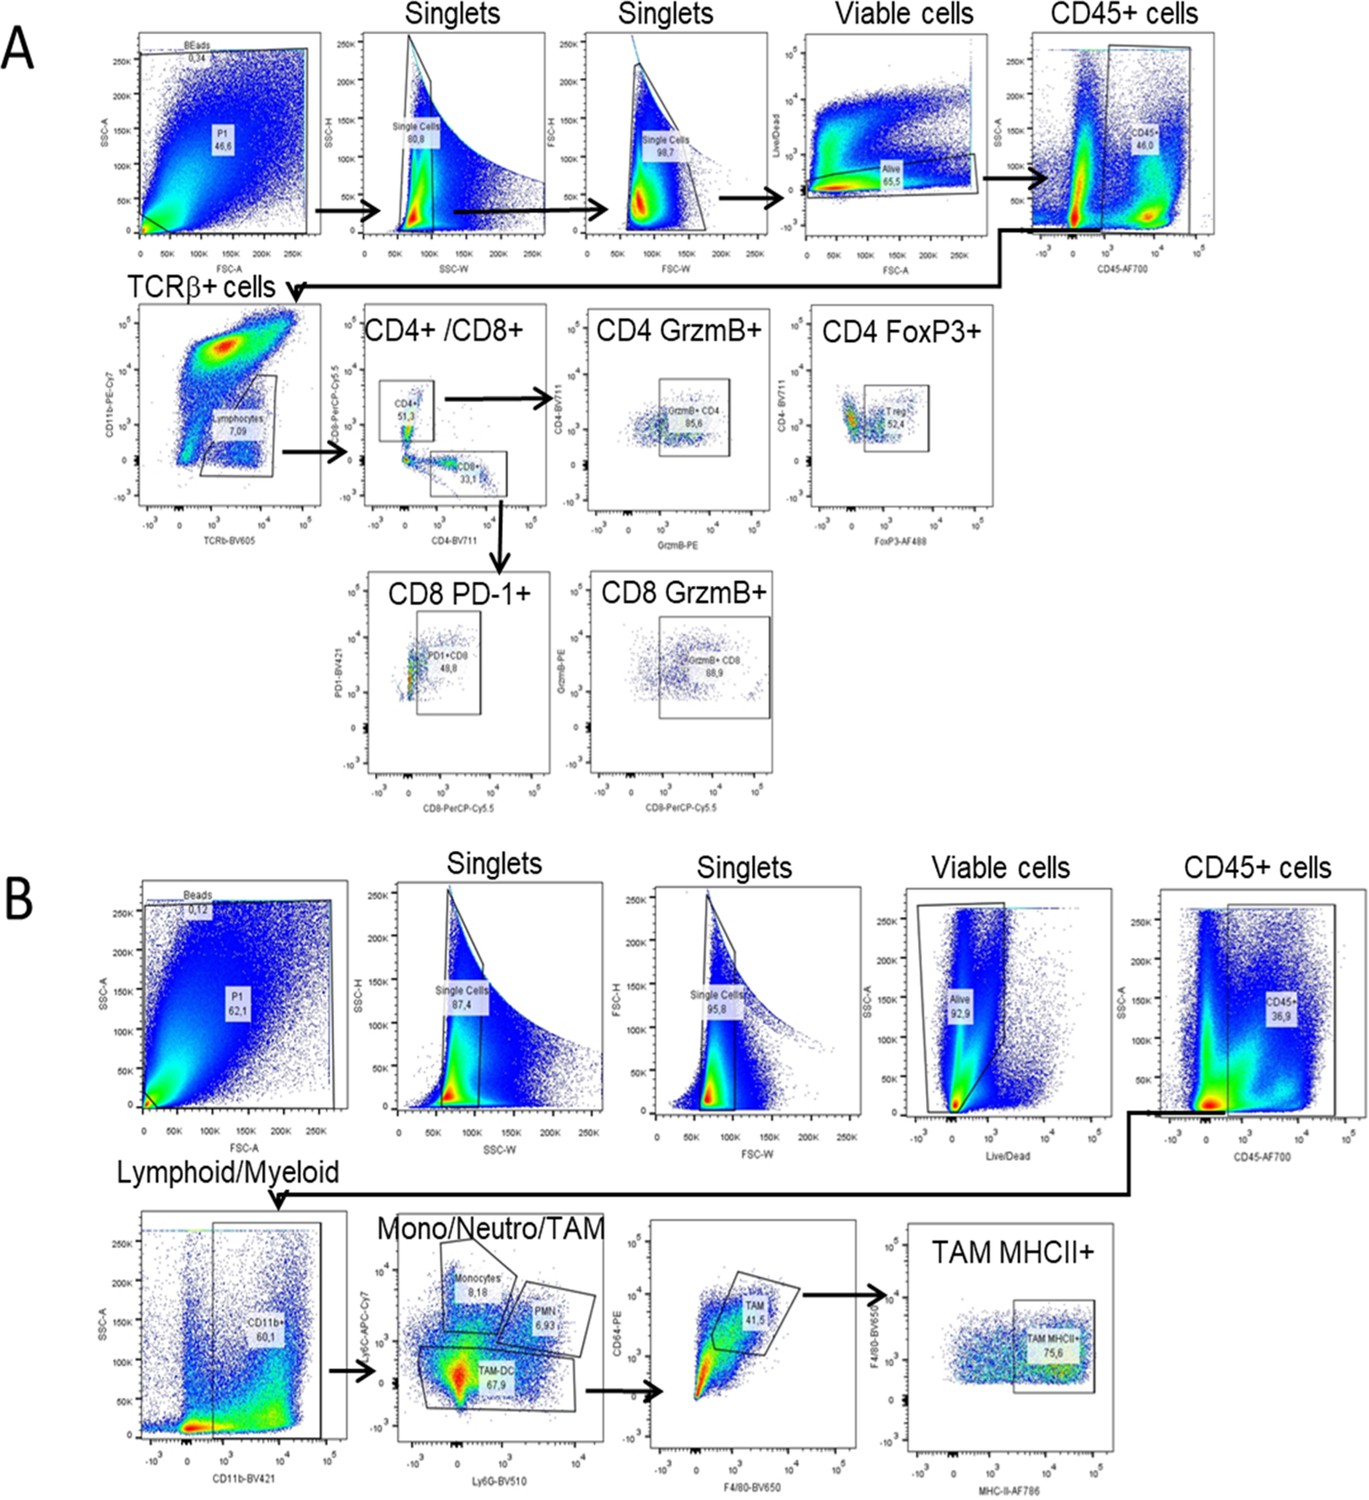
FACS sequential gating strategies.
Tumor immune infiltrating cells in KPC tumors were identified after exclusion of doublets and dead cells (live/deadneg;CD45+). Sequential gating allows for identification of CD4 and CD8 T cells (live/deadneg;CD45+;TCR+;CD4+; or CD8+) including GrzmB+, FoXP3, and PD-1 subsets (A) and TAM (live/deadneg;CD45+;CD11b+;Ly6C+/Ly6G+; CD64+/F480+), including MHC II + TAM subset (B).
Author response image 1
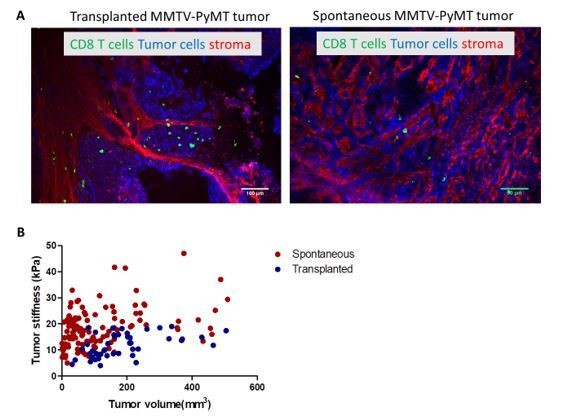
(A) Confocal microscopy images of transplanted and spontaneous MMTV-PyMT tumors.
Fibronectin (red), EpCAM (tumor cells, blue) CD8 (green). (B) Correlation of tumor mean stiffness and tumor volume in spontaneous and transplanted MMTV-PyMT tumors.
Author response image 2
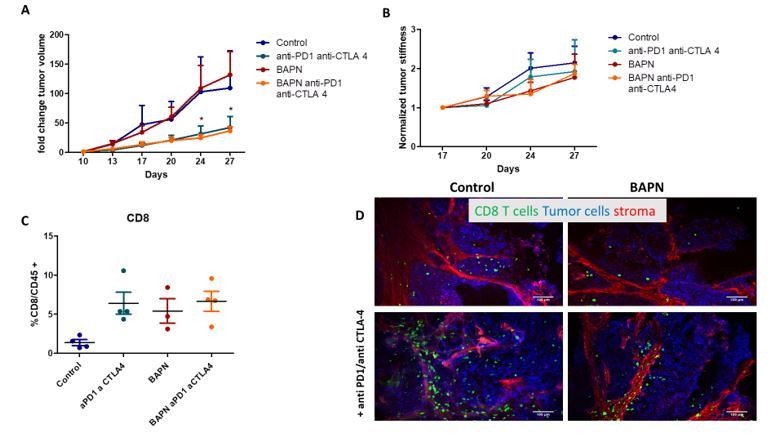
Tumor fold change after combination therapy of BAPN and anti-PD1/anti-CTLA 4 in transplanted MMTV-PyMT tumor.
(B) Normalized tumor stiffness (C) %CD8+T cell/CD45+ cells (D) Confocal microscopy images Fibronectin (red), EpCAM (tumor cells, blue) CD8 (green).
Videos
Video 1
T cell migration in the control EGI-1 tumor model.
The slices stained with calcein for the T cells (green), anti-EpCAM (blue), anti-fibronectin (red) were imaged with a spinning disk confocal microscope. Tracks are color-coded according to T cell displacement length. Frame interval 30 s. The animations represent 3D reconstructions of sequential z series. A still image is shown in Supplementary file 4.
Video 2
T cell migration in the LOX inhibited EGI-1 tumor model.
The slices stained with calcein for the T cells (green), anti-EpCAM (blue), and anti-fibronectin (red) were imaged with a spinning disk confocal microscope. Tracks are color-coded according to T cell displacement length. Frame interval 30 s. The animations represent 3D reconstructions of sequential z series. A still image is shown in Supplementary file 4.
Tables
Key resources table
| Reagent type (species) or resource | Designation | Source or reference | Identifiers | Additional information |
|---|---|---|---|---|
| Strain, strain background (M. musculus) | FVB/N | Janvier Labs | FVB/N | |
| Strain, strain background (M. musculus) | C57Bl/6J | Janvier Labs | C57Bl/6J | |
| Strain, strain background (M. musculus) | MMTV-PyMT | Guy et al., 1992 | Spontaneous mammary carcinoma mouse model | |
| Strain, strain background (M. musculus) | NMRI-nu (nu/nu) | Envigo | NMRI nude | HsdCpb:NMRI-Foxn1nu |
| Cell line (Homo-sapiens) | EGI-1 | German Collection of Microorganisms and Cell Cultures | ACC385 | Human bile duct carcinoma cell line |
| Cell line (M. musculus) | KPC | Kind gift from Corinne Bousquet, Université Toulouse III | Cell line derived from a pancreatic tumor obtained from KrasLSL_G12D, Trp53R172H/+ mice. | |
| Cell line (M. musculus) | mPDAC | Kind gift from Douglas Hanahan, Swiss Institute for Experimental Cancer Research | Cell line derived from a pancreatic tumor obtained from KrasLSL_G12D; Trp53R172H/+, Cdkn2a−/+mice. | |
| Cell line (M. musculus) | MET-1 | Kind gift from Robert Cardiff, the University of California Research (Borowsky et al., 2005) | Cell line derived from a mammary carcinoma in FVB/N-Tg (MMTV-PymT). | |
| Antibody | Anti-CD11b (monoclonal rat anti-mouse/human, clone M1/70) | Biolegend | 101201 RRID:AB_312784 | (10 µg/mL) |
| Antibody | Anti-CD11c (monoclonal rat anti-mouse, clone N418) | Biolegend | 117333 RRID:AB_11204262 | (10 µg/mL) |
| Antibody | Anti-CD45 (monoclonal rat anti-mouse, clone 30-F11) | Biolegend | 103127 RRID:AB_493714 | (10 µg/mL) |
| Antibody | Anti-Ly6C (monoclonal rat anti-mouse, clone HK1.4) | Biolegend | 128025 RRID:AB_10643867 | (10 µg/mL) |
| Antibody | Anti-Ly6G (monoclonal rat anti-mouse, 1A8) | Biolegend | 127633 RRID:AB_2562937 | (10 µg/mL) |
| Antibody | Anti-CD4 (monoclonal rat anti-mouse, clone GK1.5) | BD Biosciences | 563050 RRID:AB_2737973 | (10 µg/mL) |
| Antibody | Anti-CD8a (monoclonal rat anti-mouse, clone 53–6.7) | eBioscience | 46-0081-82 RRID:AB_1834433 | (10 µg/mL) |
| Antibody | Anti- TCRβ (monoclonal hamster anti-mouse, clone H57-597) | BD Biosciences | 562840 RRID:AB_2687544 | (10 µg/mL) |
| Antibody | Anti-Nkp46 (monoclonal rat anti-mouse, clone 29A1.4) | eBioscience | 50-3351-82 RRID:AB_10598664 | (10 µg/mL) |
| Antibody | Anti-PD-1 (monoclonal rat anti-mouse, clone 29F.1A12) | Biolegend | 135221 RRID:AB_2562568 | (10 µg/mL) |
| Antibody | Anti-MHC II (monoclonal rat anti-mouse, clone M5/114.15.2) | Biolegend | 107645 RRID:AB_2565977 | (10 µg/mL) |
| Antibody | Anti-CD80 (monoclonal hamster anti-mouse, clone 16-10A1) | Biolegend | 104705 RRID:AB_313126 | (10 µg/mL) |
| Antibody | Anti-CD64 (monoclonal mouse anti-mouse, clone X54-5/7.1) | Biolegend | 139303 RRID:AB_10613467 | (10 µg/mL) |
| Antibody | Anti-CD206 (monoclonal rat anti-mouse, clone CO68C2) | Biolegend | 141721 RRID:AB_2562340 | (10 µg/mL) |
| Antibody | Anti-F4/80 (monoclonal rat anti-mouse, clone CI:A3-1) | BIO-RAD | MCA497SBV670 RRID:AB_323806 | (10 µg/mL) |
| Antibody | Anti-FoxP3 (monoclonal rat anti-mouse, clone MF-14) | Biolegend | 126405 RRID:AB_1089114 | (10 µg/mL) |
| Antibody | Anti-GrzmB (monoclonal rat anti-mouse, clone QA16A02) | Biolegend | 372207 RRID:AB_2687031 | (10 µg/mL) |
| Antibody | Anti-Fibronectin (monoclonal mouse anti-human/mouse, clone HFN7.1) | Acris Antibodies | AM00389AF-N RRID:AB_981328 | (10 µg/mL) |
| Antibody | Anti-Podoplanin (monoclonal Hamster anti- mouse, clone 8.1.1) | Biolegend | 127407 RRID:AB_2161929 | (10 µg/mL) |
| Antibody | Anti-EpCAM (monoclonal mouse anti-human, clone 9C4) | Biolegend | 324219 RRID:AB_11124342 | (10 µg/mL) |
| Antibody | Anti-EpCAM (monoclonal rat anti-mouse, clone G8.8) | Biolegend | 118225 RRID:AB_2563983 | (10 µg/mL) |
| Antibody | Anti-PD-1 (monoclonal rat anti-mouse, clone RMP1-14) | BioXcell | BE0146 RRID:AB_10949053 | (200 µg) |
| Peptide, recombinant protein | Human IL-7 | Miltenyi Biotec | 130-095-361 | |
| Peptide, recombinant protein | Human IL-15 | Miltenyi Biotec | 130-095-762 | |
| Commercial assay or kit | Milliplex map Mouse cytokine/chemokine detection | Merck Millipore | MCYTOMAG-70K | |
| Commercial assay or kit | Human CD8 + T Cell Isolation Kit | Stemcell technologies | 17953 | |
| Commercial assay or kit | CD8a + T Cell Isolation Kit, mouse | Miltenyi Biotec | 130-104-075 | |
| Commercial assay or kit | Human T cell activation kit, TransAct | Miltenyi Biotec | 130-111-160 | |
| Commercial assay or kit | Dynabeads Mouse T-Activator CD3/CD28 | ThermoFischer | 11456D | |
| Chemical compound, drug | beta-aminopropionitrile (BAPN) | Sigma | A3134 | (3 mg/mL) |
| Chemical compound, drug | CellTrace Calcein Red-Orange | ThermoFischer | C34851 | (125 nM) |
| Software, algorithm | Image J/FIJI | National Institutes of Health | imagej.net | |
| Software, algorithm | Imaris 7.4 | Oxford Instruments | imaris.oxinst.com | |
| Software, algorithm | Prism GraphPad Software version 8 | GraphPad | graphpad.com | |
| Software, algorithm | FlowJo | FlowJo, LLC | flowjo.com |
Additional files
-
Supplementary file 1
Summary of relevant preclinical models for solid tumors used in this study.
- https://cdn.elifesciences.org/articles/58688/elife-58688-supp1-v2.pptx
-
Supplementary file 2
Tumor stiffness and tumor architecture parameters for EGI-1, KPC, MMTV-PyMT, mPDAC and MET-1 models.
Mean stiffness of tumors with volume > 600 mm3 measured with SWE. Percentage of stiff regions of tumors with volume > 600 mm3. Tumor architecture was characterized by the percentage of the tumor covered by the stromal compartment, estimated from HES images; collagen fiber width and length, calculated from SHG images; percentage of red-orange birefringent fibers combining Red Sirius staining and polarized microscopy, orange-red fibers correspond to thick and packed regions. EGI-1 (n = 30 mice/group from three independent experiments); KPC (n = 34 mice/group from three independent experiments); MMTV-PyMT (n = 5 mice/group, 10 tumors per mouse from two independent experiments); mPDAC (n = 7 mice/group from two independent experiments); and MET-1 (n = 12 mice/group from two independent experiments).
- https://cdn.elifesciences.org/articles/58688/elife-58688-supp2-v2.pptx
-
Supplementary file 3
Collagen fiber width and length in EGI-1, MMTV-PyMT, mPDAC and KPC tumor models in control and BAPN-treated conditions.
Results are shown as mean ± SD.
- https://cdn.elifesciences.org/articles/58688/elife-58688-supp3-v2.pptx
-
Supplementary file 4
T cell migration in the different tumor models and effect of LOX inhibition.
Migration of activated PBT overlaid onto fresh tumor slices was analyzed in EGI-1 and MMTV-PyMT model, whilst resident tumor infiltrated T lymphocyte migration was analyzed in mPDAC and KPC models (* p-value<0.05, ***p-value<0.001, Students’ t-test, n = 3–12 mice/group from three experiments, 70–250 T cells per slice analyzed). T cell migration was analyzed at the endpoint of the experiment: day 30 for EGI-1, day 40 for KPC, day 55 for MMTV-PyMT and day 21 for mPDAC. T cell infiltration (CD8/mm2) calculated from immunofluorescence images. Results are shown as mean ± SD. Illustrative images of T cell migration tracks in EGI-1 tumor model. Tumor stroma (fibronectin) in red, tumor cells (EpCAM) in blue and T cells (Calcein) in green. Tracks are color-coded to illustrate track displacement. Scale bar = 100 µm. See also Videos 1 and 2. TILs: tumor-infiltrating T lymphocytes.
- https://cdn.elifesciences.org/articles/58688/elife-58688-supp4-v2.pptx
-
Transparent reporting form
- https://cdn.elifesciences.org/articles/58688/elife-58688-transrepform-v2.docx
Download links
A two-part list of links to download the article, or parts of the article, in various formats.
Downloads (link to download the article as PDF)
Open citations (links to open the citations from this article in various online reference manager services)
Cite this article (links to download the citations from this article in formats compatible with various reference manager tools)
Tumor stiffening reversion through collagen crosslinking inhibition improves T cell migration and anti-PD-1 treatment
eLife 10:e58688.
https://doi.org/10.7554/eLife.58688


