Co-expression analysis reveals interpretable gene modules controlled by trans-acting genetic variants
- Institute of Computer Science, University of Tartu, Estonia
Figures
Figure 1 with 6 supplements
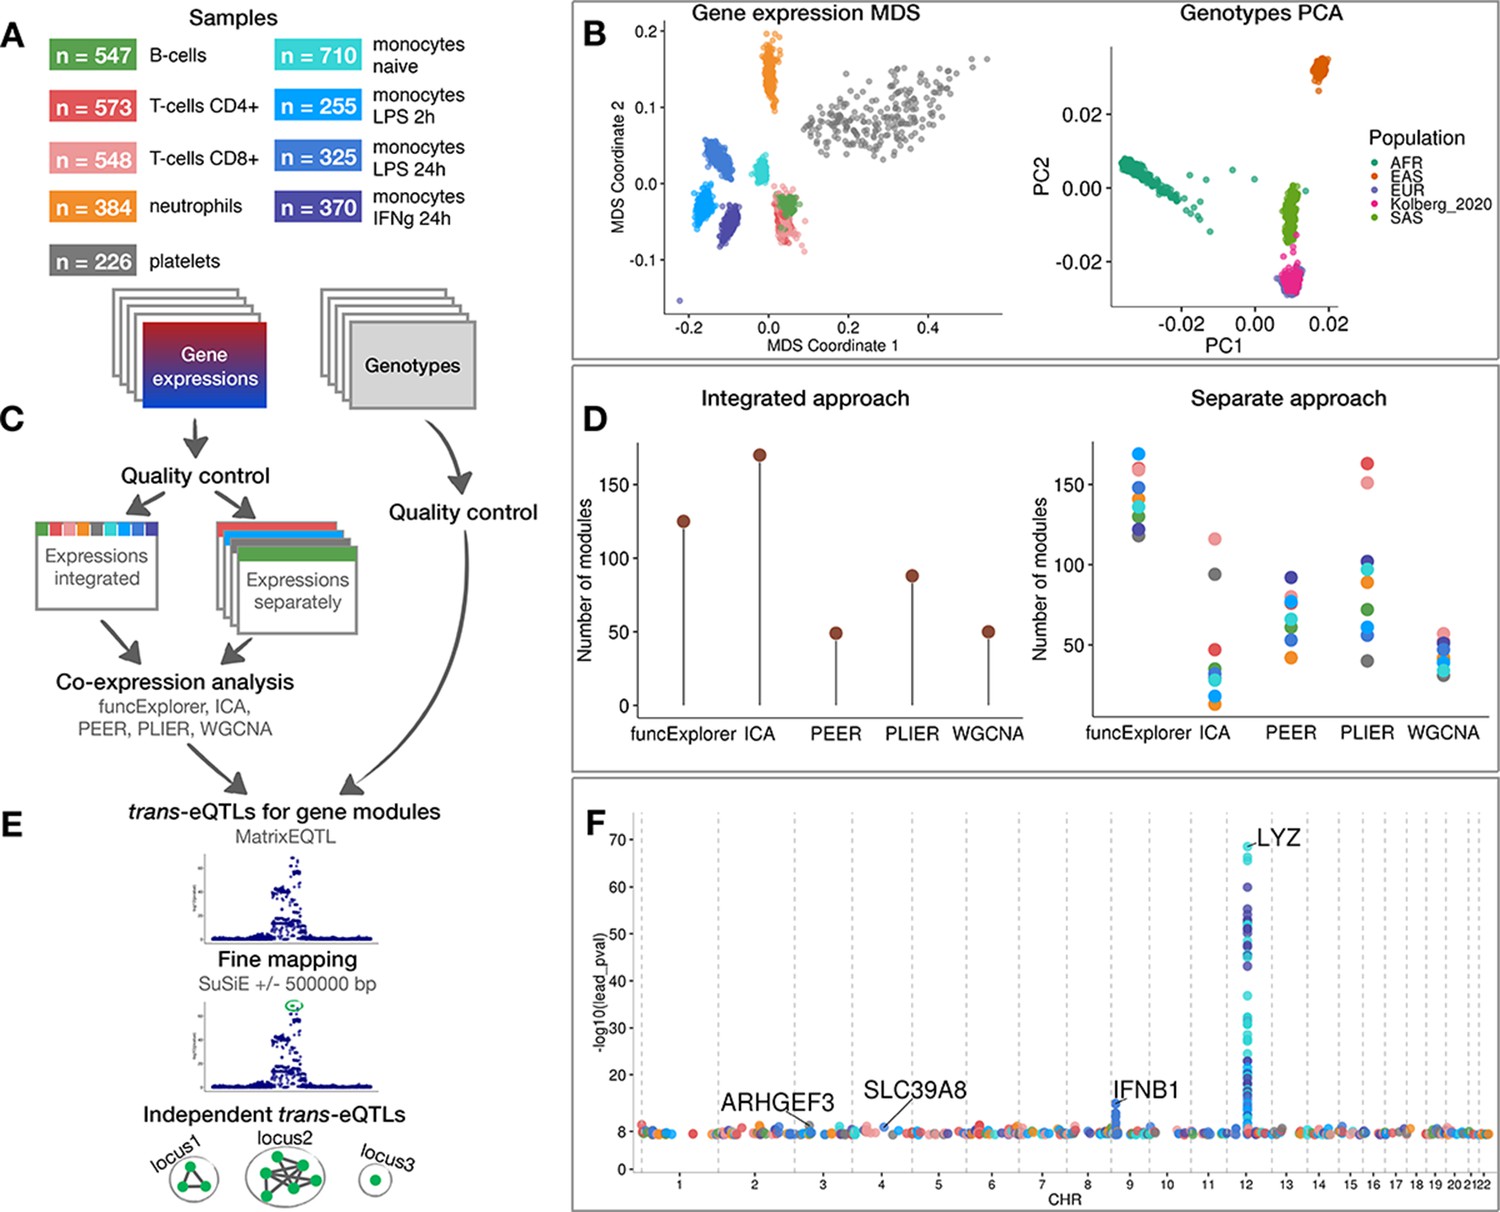
Data, analysis workflow and results.
(A) Sample sizes of cell types and conditions included in the analysis. LPS - lipopolysaccharide, IFNg - interferon-gamma. (B) Multidimensional scaling (MDS) analysis of the gene expression data and principal component analysis (PCA) of genotype data after quality control and normalisation. Cell types and conditions are colour-coded according to panel A. Genotyped samples from this study have been projected to the 1000 Genomes Project reference populations. (C) Following quality control, five co-expression methods were applied to two different data partitioning approaches: (1) gene expression profiles across all cell types and conditions were analysed together (integrated approach), (2) gene expression profiles from each cell type and condition were analysed separately (separate approach). (D) The number of gene modules detected from integrated and separate analyses. (E) For trans-eQTL analysis we used the estimated module activity profile (‘eigengene’) as our phenotype. To identify independent trans-eQTLs, we performed statistical fine mapping for all nominally significant (p-value<5×10⁻⁸) associations and grouped together all associations with overlapping credible sets. (F) Manhattan plot of nominally significant (p-value<5×10⁻⁸) trans-eQTLs. Each point corresponds to a gene module that was associated with the corresponding locus and is colour-coded by the cell type from panel A.
Figure 1—figure supplement 1
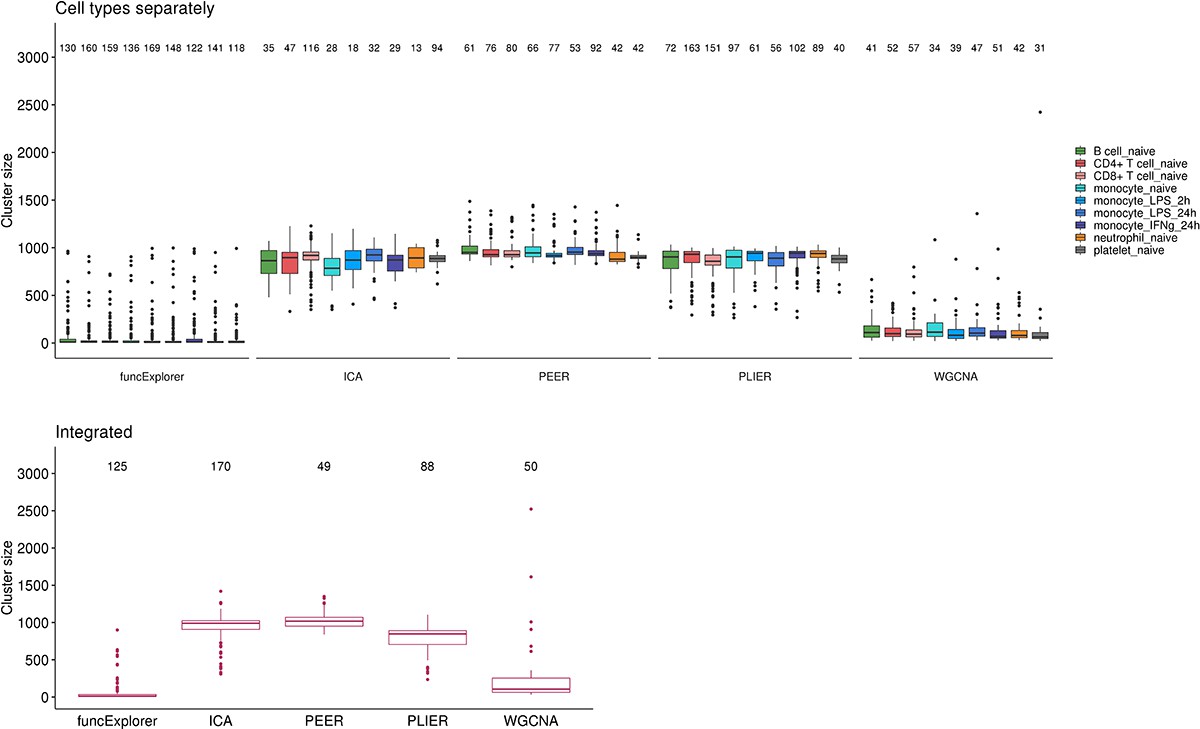
Number of detected gene modules and their size distributions across co-expression analysis methods and data partitioning approaches.
The modules from WGCNA and funcExplorer are non-overlapping while ICA, PLIER and PEER can define larger modules that share the same set of genes. The values above the boxplots show the number of modules obtained from each method.
Figure 1—figure supplement 2

Aggregating fine mapping credible sets in the example of ARHGEF3 trans-eQTL locus.
We performed fine mapping on the lead variants of every gene module to find corresponding credible sets (see ‘Materials and methods’). (A) The figure shows an example of three credible sets on chromosome three for three gene modules: IC68 from applying ICA to integrated expression data; Cluster_12953 from funcExplorer and X6.WIERENGA_STAT5A_TARGETS_DN from PLIER, both applied to gene expression data from platelets. The associations shown here were detected in platelets. Each circle represents a variant belonging to the corresponding credible set and the different credible sets are distinguished by colours. (B) The credible sets are combined into a graph structure where every node is a credible set of variants and we define an edge between two nodes if they share at least one variant. Grey circles represent all the credible sets from other genomic regions. Here, the number of shared variants is shown on the edges and the number of variants belonging to the credible set is shown on the nodes. We searched for connected components, grouped these credible sets together and defined a lead variant for every group based on the largest average posterior inclusion probability (PIP) value within the group. In this example, as all the credible sets share a single variant, rs1354034, then they are grouped together and the overlapping variant with largest PIP is rs1354034.
Figure 1—figure supplement 3

Monocytes-specific trans-eQTL near IFNB1 that was first detected by Fairfax et al., 2014 and later replicated in Quach et al., 2016 after 6 hr of LPS stimulation (Table 1).
(A) Association signals for IFNB1 cis-eQTL after 2 hr of LPS stimulation and trans-eQTL for module IC140 (ICA, 445 genes) after 24 hr of LPS stimulation. We do not detect a colocalisation between the cis and trans associations, but this could be due to potential confounding caused by probe hybridisation bias in our cis-eQTL analysis. (B) Line graph showing that the association between the co-expression modules and IFNB1 trans-eQTL lead variant is specific to LPS stimulation. (C) Manhattan plot of gene-level analysis for trans-eQTL lead variant rs13296842 (chr9_20818520_A_G). Dark blue points mark genes belonging to module IC140. The module also includes IFNB1. Light blue points show significantly associated genes (variant-level Benjamini-Hochberg FDR 5%) not included in the module. (D) Association between trans-eQTL lead variant (rs13296842) and eigengene values of a representative ICA module IC140 across cell types. (E) Functional enrichment analysis of the IFNB1 associated modules (see https://biit.cs.ut.ee/gplink/l/Tnz7Ql3-S7 for full results). Empty cell indicates that no gene in the module is annotated to the corresponding term. The last column combines the FDR 5% significant genes from the gene-level analysis. The table shows adjusted enrichment p-values. GO - Gene Ontology, REAC - Reactome Pathways, TF - transcription factor binding sites from TRANSFAC, WP - WikiPathways.
Figure 1—figure supplement 4
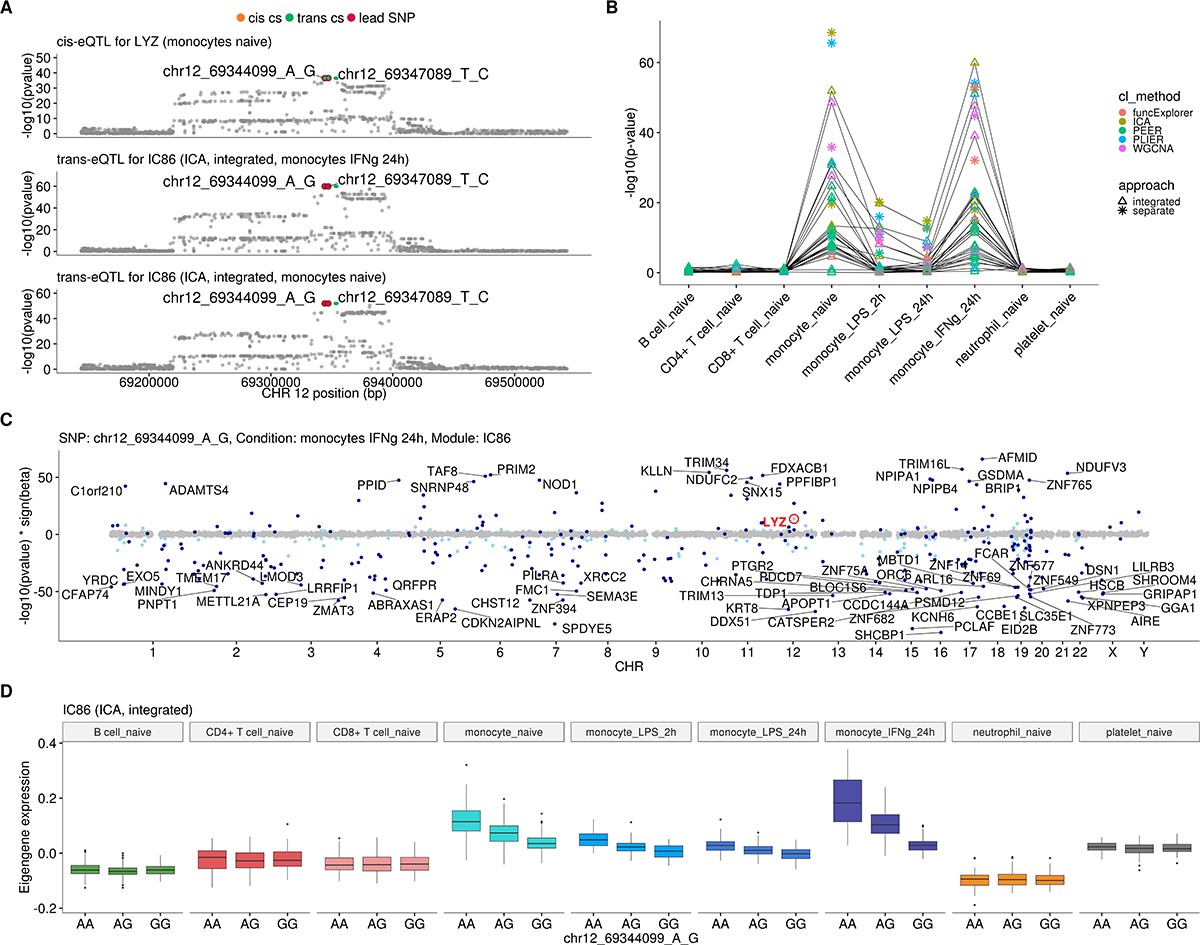
Monocyte-specific trans-eQTL near LYZ that has been previously detected in three independent studies (Fairfax et al., 2012; Rakitsch and Stegle, 2016; Rotival et al., 2011; Table 1).
(A) Colocalisation between cis-eQTL for LYZ in naive monocytes and trans-eQTLs for module IC86 (ICA, 309 genes) in naive monocytes and 24 hr after stimulation with IFNγ. The cis and trans credible sets shown in this figure are identical and contain four variants. (B) Line graph showing that the association between the modules and LYZ trans-eQTL locus is detected only in naive and stimulated monocytes. This association was detected by at least one module from each of the five co-expression methods and both data partitioning approaches. In total, 58 gene modules (54 after Bonferroni threshold) were associated with the locus and 15 of the modules contained the LYZ gene itself. There were 14 integrated approach modules that were associated in both naive and stimulated monocytes. (C) Manhattan plot of gene-level analysis for trans-eQTL lead variant rs10784774 (chr12_69344099_A_G) in monocytes after 24 hr of stimulation with IFNγ. Dark blue points highlight the genes in module IC86. Light blue points show significantly associated genes (variant-level Benjamini-Hochberg FDR 5%) not included in the module. (D) Association between trans-eQTL lead variant (rs10784774) and eigengene of ICA module IC86 across cell types. For g:Profiler enrichment results with all associated modules see https://biit.cs.ut.ee/gplink/l/gRMSZHYYSI.
Figure 1—figure supplement 5
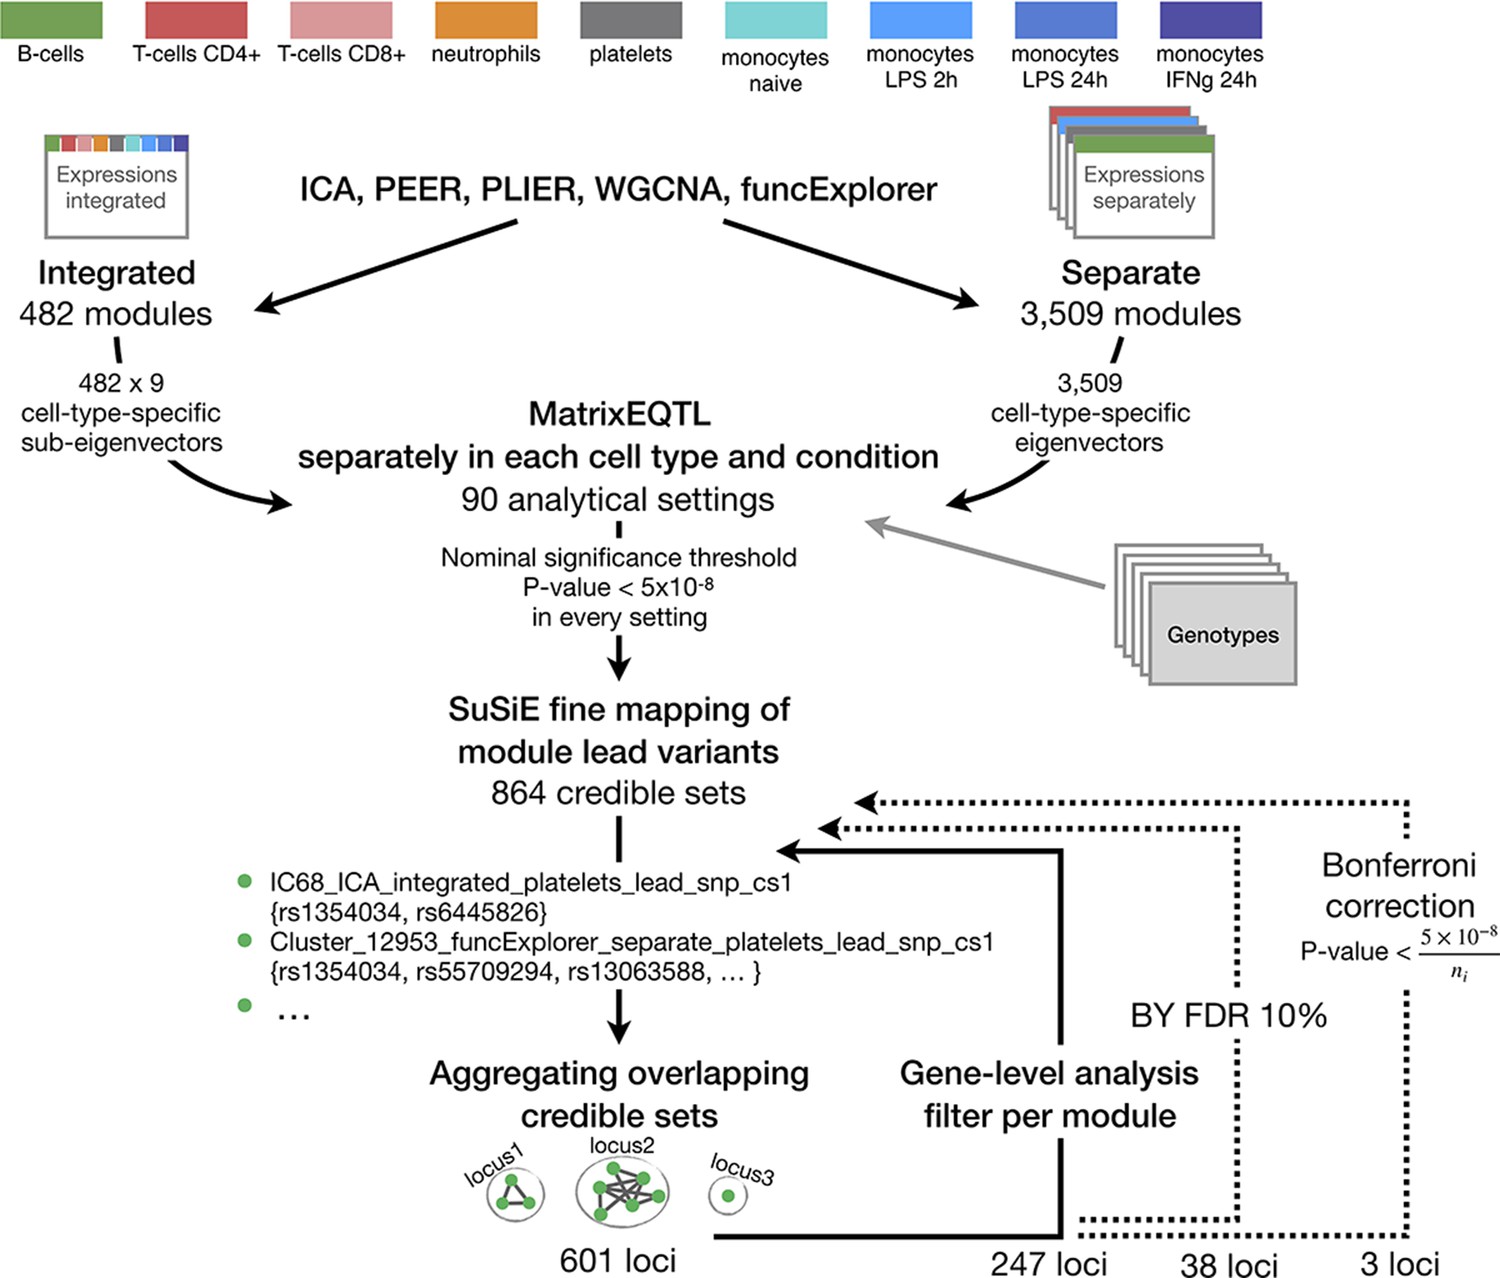
The complete analysis workflow from gene co-expression analysis and gene module trans-eQTL mapping to multi-step filtering approaches.
Aggregating nominally significant credible sets to non-overlapping groups (Figure 1—figure supplement 2) resulted in 601 loci. This was followed by gene-level trans-eQTL analysis to exclude credible sets of modules where the module genes did not significantly overlap with gene-level-significant trans genes (FDR 5%). The remaining credible sets were again aggregated using the same approach, 247 loci remained. The credible sets were further filtered by applying Benjamini-Yekutieli FDR 10% threshold to the associations and excluding corresponding credible sets before the aggregation procedure which left us with 38 non-overlapping loci. An even more conservative Bonferroni threshold which takes into account the number of modules detected by corresponding clustering method and analysis setting (ni, i = 1,...,90) was applied which further reduced the set of significant trans-eQTLs to 3.
Figure 1—figure supplement 6
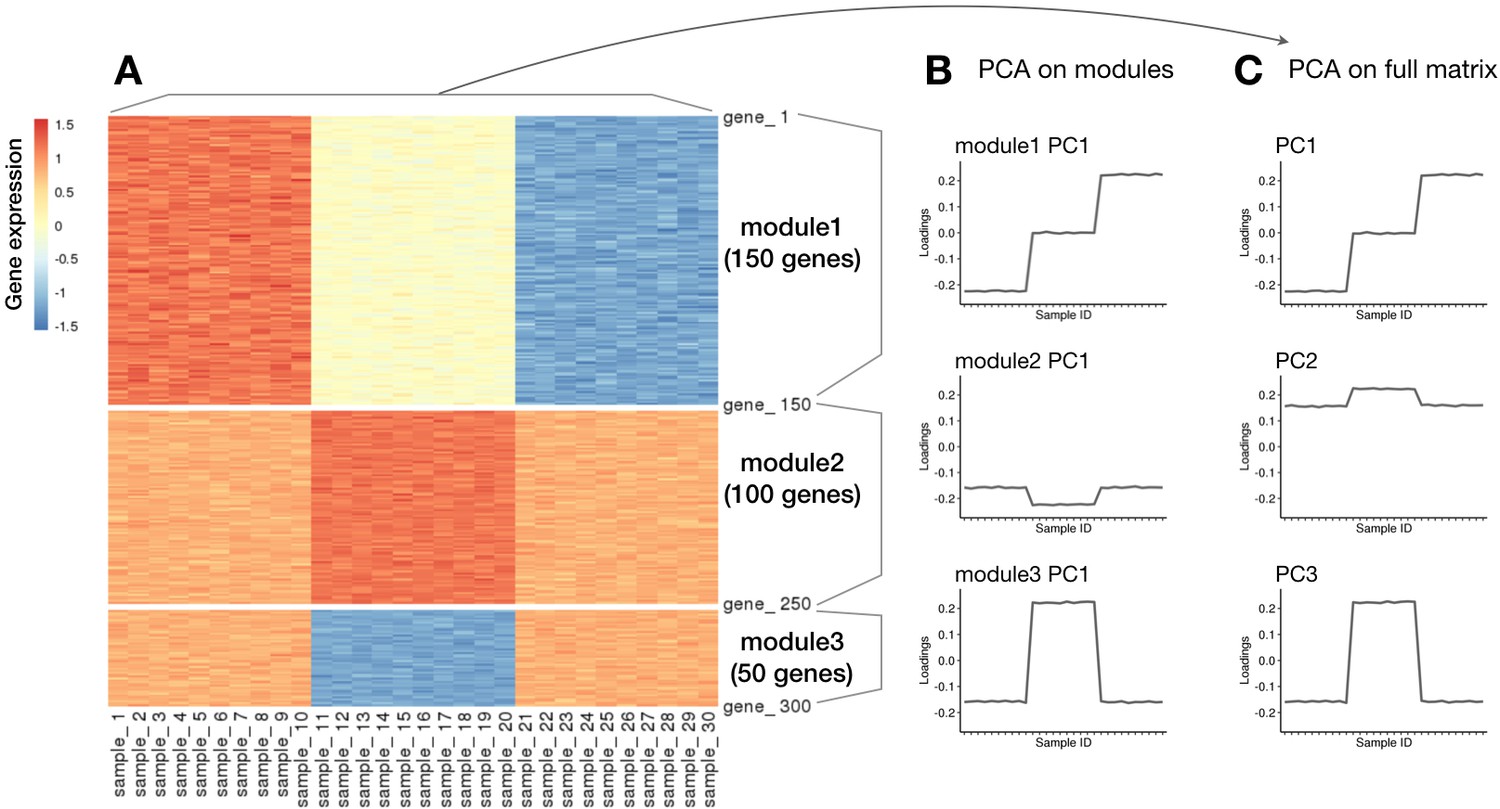
Simulation of eigenvectors obtained from different partitions of the same data versus the full data.
(A) Heatmap of simulated gene expression matrix consisting of three gene modules generated based on three orthogonal vectors. (B) Profiles of first eigenvectors when PCA is applied to each of the predefined module matrix separately. These represent the eigenvectors in case of co-expression clustering methods. (C) Profiles of first three eigenvectors when PCA is applied to the full data matrix. This represents the eigenvectors found by matrix factorisation methods.
Figure 2 with 3 supplements
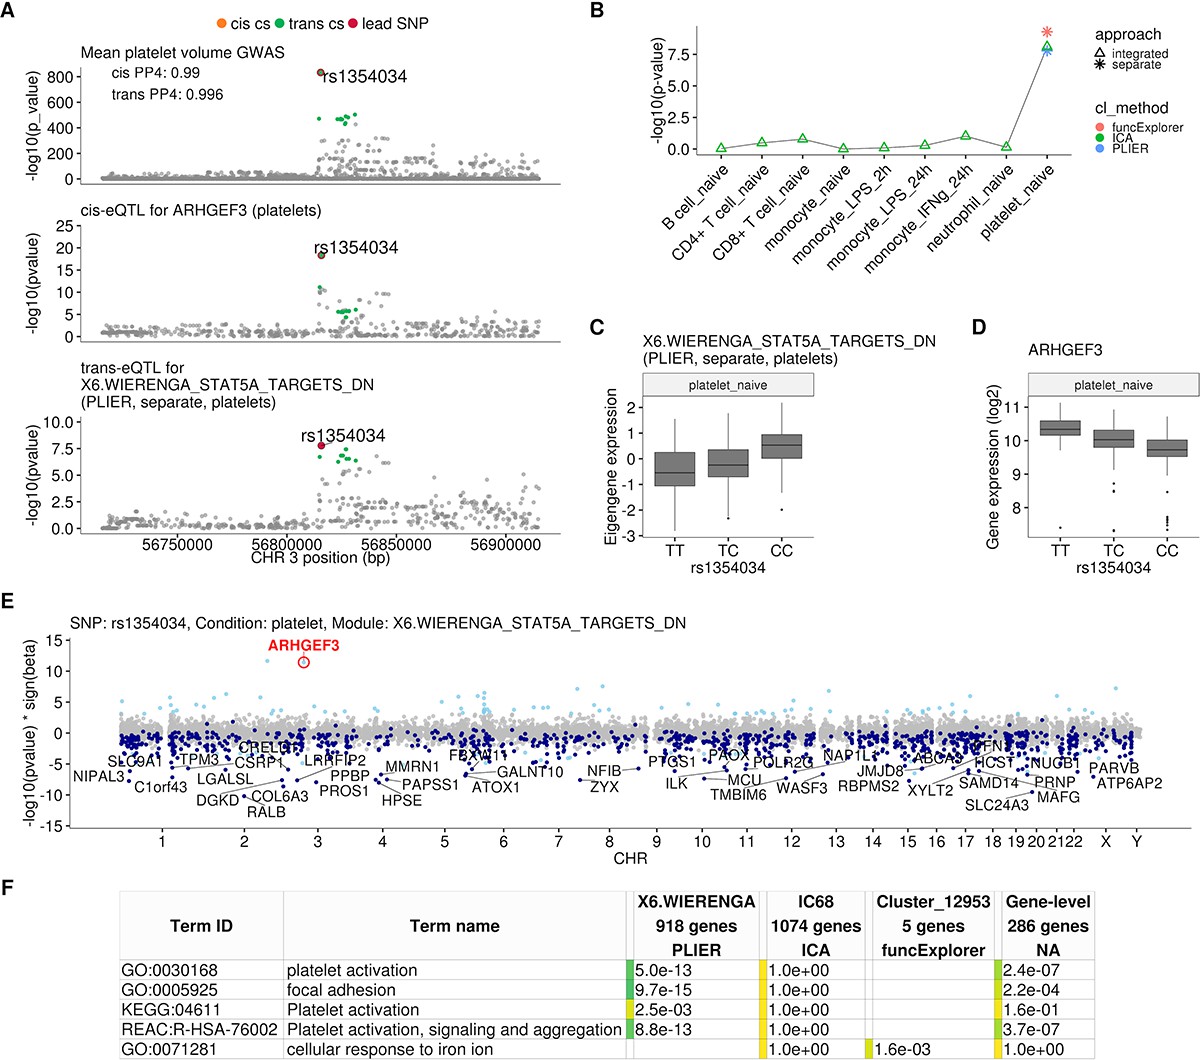
Platelet-specific trans-eQTL at the ARHGEF3 locus.
(A) Regional plots showing colocalisation between GWAS signal for mean platelet volume (Astle et al., 2016), cis-eQTL for ARHGEF3 in platelets and trans-eQTL for a platelet-specific co-expression module detected by PLIER. Cis and trans credible sets (cs) are marked on the plots. The cis credible set consists of only the lead variant (rs1354034), which occludes the orange highlight. (B) Line graph showing that the association between the modules and ARHGEF3 locus is platelet specific. In cell-type-specific clustering, only a single p-value from the corresponding cell type is available. The integrated modules have p-values from each of the cell types and the values are connected by a line. (C) Association between the trans-eQTL lead variant (rs1354034) and eigengene of module X6.WIERENGA_STAT5A_TARGETS_DN in platelets. (D) Association between the trans-eQTL lead variant (rs1354034) and ARHGEF3 expression in platelets. (E) Manhattan plot of gene-level eQTL analysis for the trans-eQTL lead variant. Dark blue points highlight the genes in module X6.WIERENGA_STAT5A_TARGETS_DN. Light blue points show significantly associated genes (variant-level Benjamini-Hochberg FDR 5%) not included in the module. (F) Functional enrichment analysis of modules associated with ARHGEF3 locus (see full results at https://biit.cs.ut.ee/gplink/l/CY6ZukXhSq). Empty cell indicates that no gene in the module is annotated to the corresponding term, enrichment p-value=1 shows that at least some of the genes in the module are annotated to the term, but not enough to report over-representation. The last column combines the FDR 5% significant genes from the gene-level analysis. The table shows adjusted enrichment p-values. GO - Gene Ontology, KEGG - Kyoto Encyclopedia of Genes and Genomes Pathways, REAC - Reactome Pathways.
Figure 2—figure supplement 1
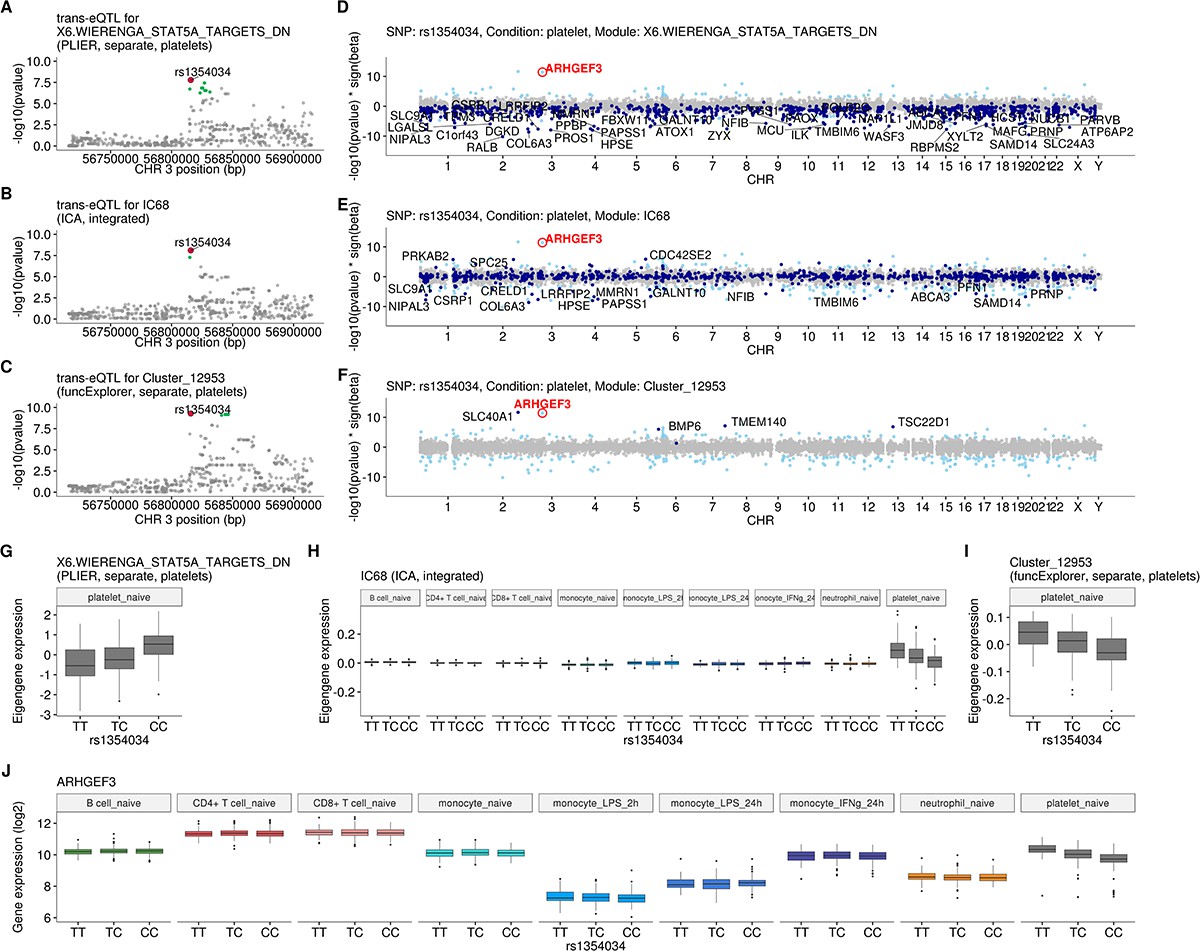
Intronic variant located within the ARHGEF3 gene (rs1354034) is associated with three co-expression modules in platelets.
(A–C) Regional plots of trans-eQTL summary statistics for each of the modules. Corresponding credible sets are highlighted in green. (D–F) Manhattan plots of gene-level eQTL analysis for the trans-eQTL lead variant (rs1354034). Dark blue points highlight the genes in the corresponding module. Light blue points show significantly associated genes (variant-level Benjamini-Hochberg FDR 5%) not included in the module. (G–I) Association between rs1354034 and eigengene values of three modules. (J) Mean expression of the ARHGEF3 stratified by the lead variant (rs1354034). Although ARHGEF3 is expressed in multiple cell types, the cis-eQTL effect is only visible in platelets.
Figure 2—figure supplement 2
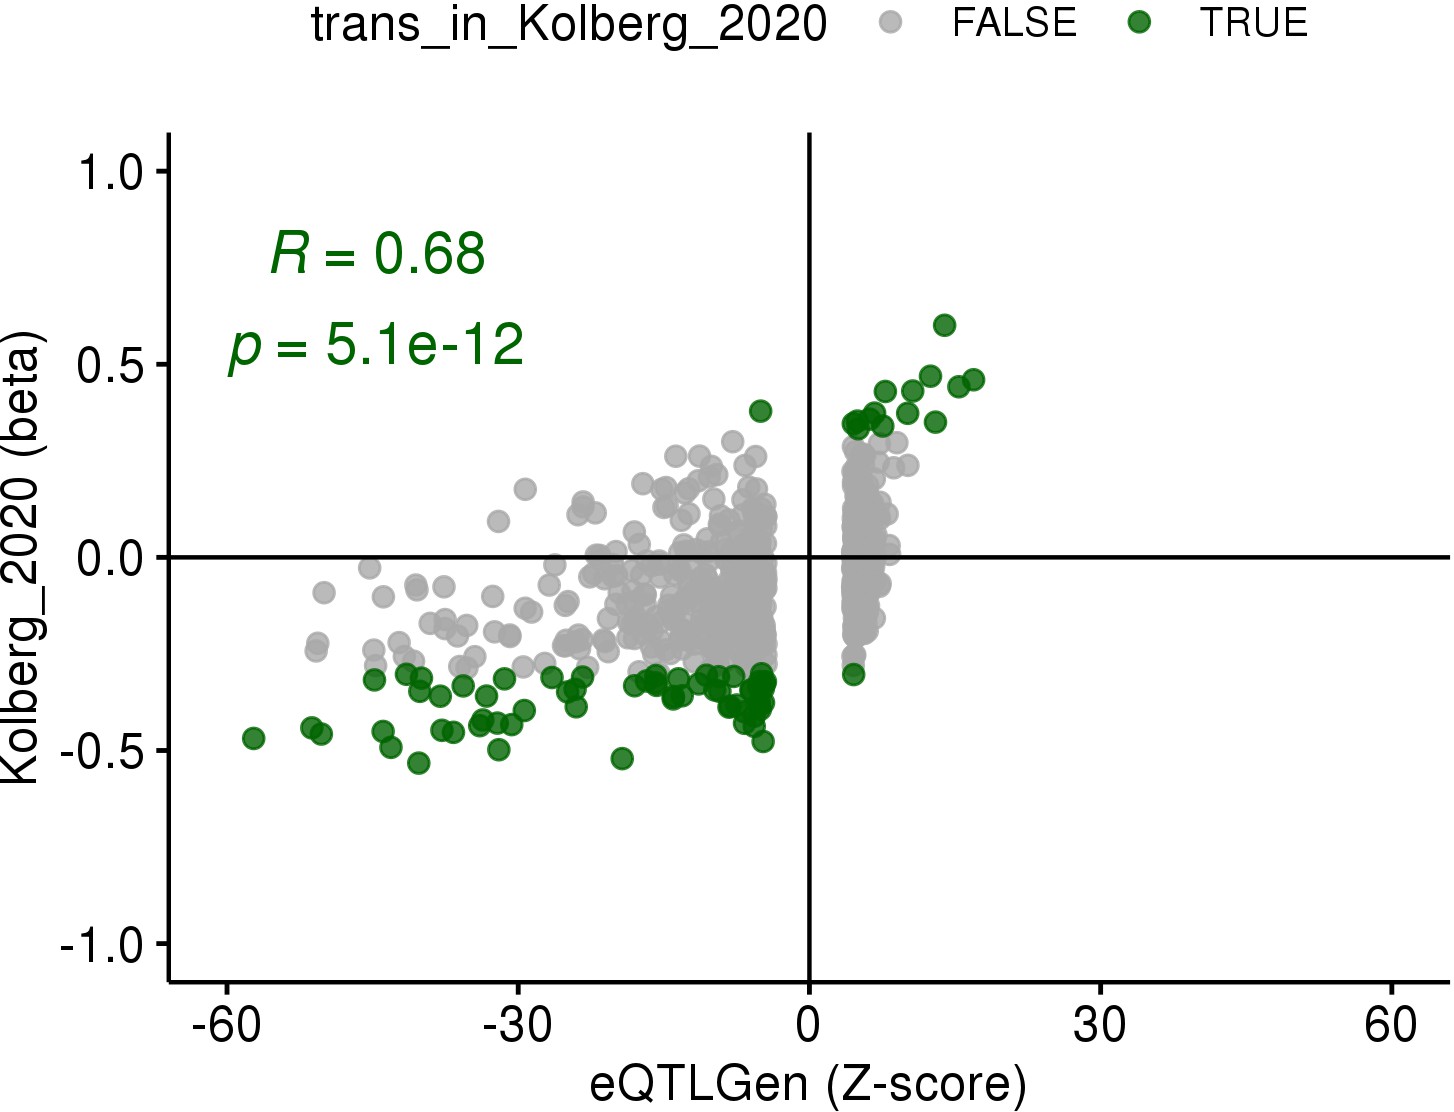
Replication of the ARHGEF3 trans-eQTL association in the eQTLGen study (Võsa et al., 2018).
Z-scores of all genes associated with the rs1354034 variant in trans from eQTLGen (FDR < 0.05) are shown on the x-axis and effect sizes in platelet samples (n = 226) from this study are shown on the y-axis. The effect sizes for genes significantly associated in platelets (FDR < 0.05, green dots) are correlated between the two studies (Pearson’s r = 0.68) and agree in effect size direction.
Figure 2—figure supplement 3
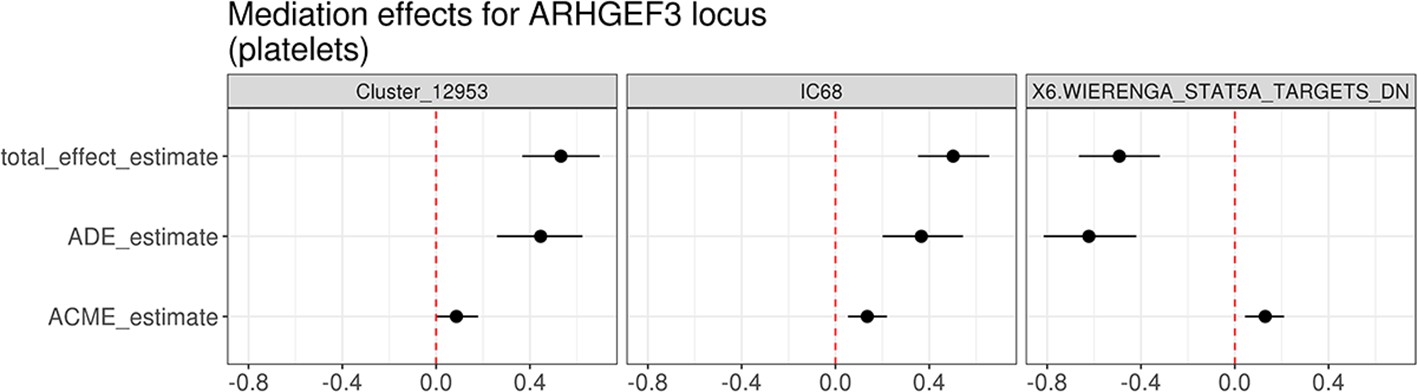
Mediation analysis between the cis-eQTL for ARHGEF3 and trans-eQTLs for three co-expression modules associated with the same lead variant (rs1354034).
The effect estimates along with 95% confidence intervals were evaluated using the bootstrap method (1000 resamples). ACME stands for average causal mediation effect (or indirect effect) and ADE for average direct effect.
Figure 3 with 3 supplements
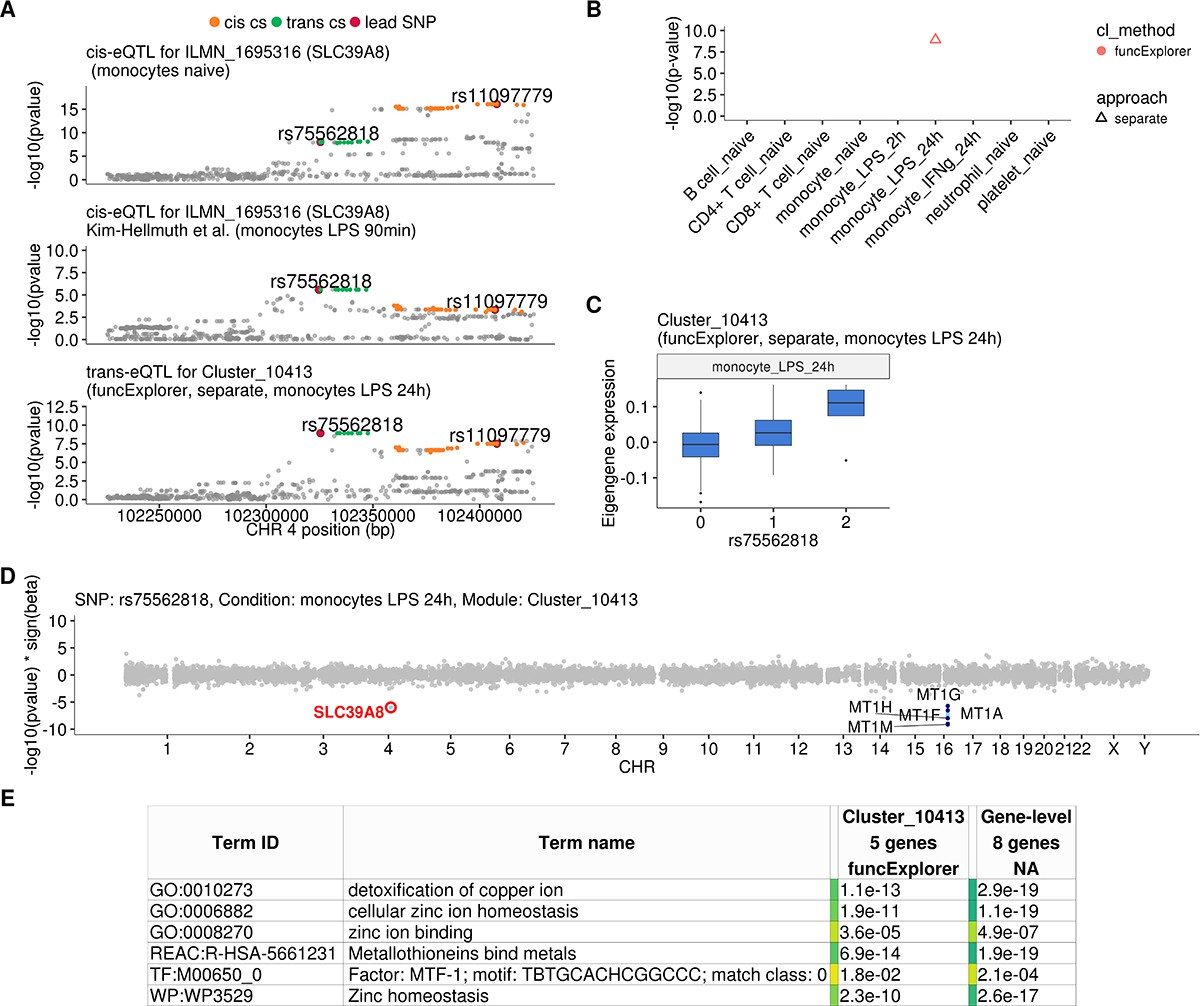
Transient cis-eQTLs for SLC39A8 is associated with the expression of seven metallothionein genes in trans in monocytes stimulated with LPS for 24 hr.
(A) Regional plots comparing association signals between naive (rs11097779) and transiently induced cis-eQTLs (rs75562818) for SLC39A8 and trans-eQTL (rs75562818) for a module of five co-expressed metallothionein genes. LPS-induced cis-eQTL summary statistics 90 min post stimulation (n = 134) were obtained from Kim-Hellmuth et al., 2017. (B) Graph showing that the association between the module and SLC39A8 locus is stimulation specific. As this module was detected by a cell-type-specific clustering, only a single value from the corresponding cell type is available. (C) Association between trans-eQTL (rs75562818) and eigengene of funcExplorer module Cluster_10413 in monocytes after 24 hr of LPS stimulation. (D) Manhattan plot of gene-level eQTL analysis for rs75562818. Dark blue points highlight the genes in module Cluster_10413. Light blue points show significantly associated genes (variant-level Benjamini-Hochberg FDR 5%) not included in the module. (E) Functional enrichment analysis of the SLC39A8 associated module (see https://biit.cs.ut.ee/gplink/l/aohV4uKeT1 for full results). The last column combines the FDR 5% significant genes from the gene-level analysis. The table shows adjusted enrichment p-values. MTF1 - metal transcription factor 1. GO - Gene Ontology, WP - WikiPathways, REAC - Reactome Pathways, TF - transcription factor binding sites from TRANSFAC.
Figure 3—figure supplement 1
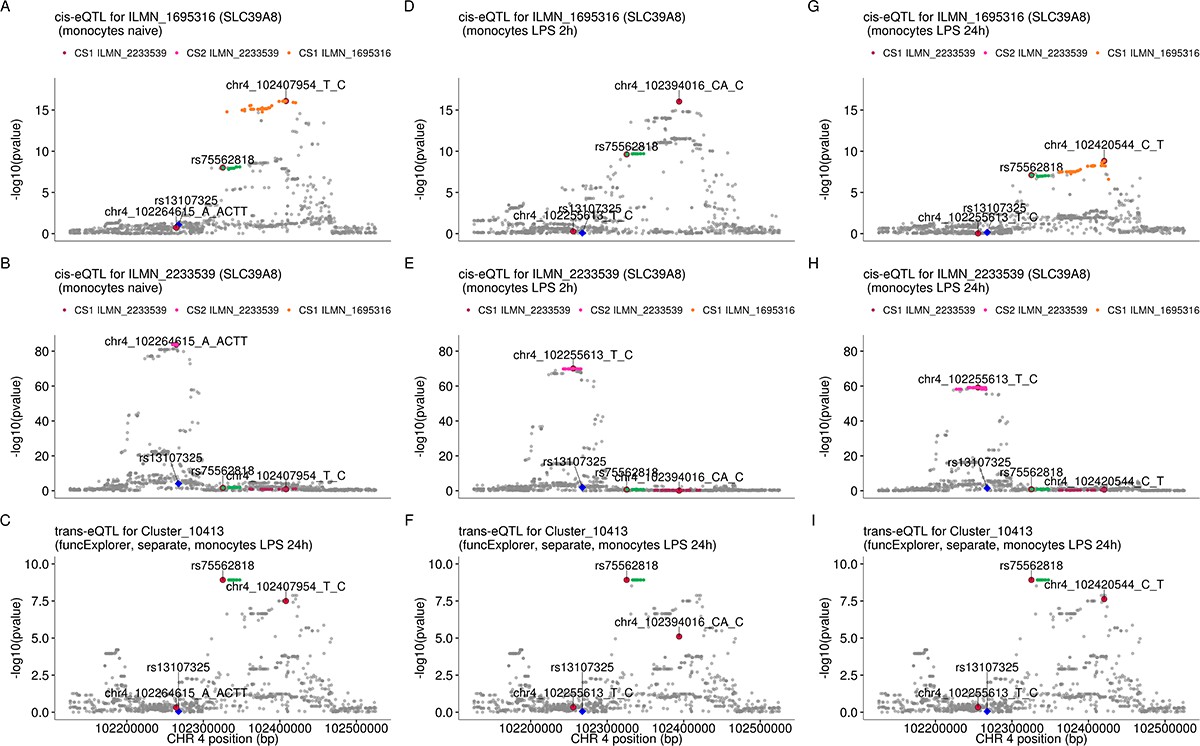
The SLC39A8 trans-eQTL lead variant (rs75562818) and cis-eQTLs for SLC39A8 probe sets (ILMN_1695316 and ILMN_2233539) do not colocalise in any of the monocyte conditions in our data.
While the trans and cis credible sets do not overlap, one of the cis credible set for probe ILMN_2233539 overlaps with the credible set of probe ILMN_1695316 in naive and 24 hr LPS stimulated monocytes. (A–C) cis-eQTL summary statistics from naive monocytes for probes ILMN_1695316 (A), ILMN_2233539 (B) and trans-eQTL for module Cluster_10413 in monocytes after 24 hr of LPS stimulation (C). (D–F) cis-eQTL summary statistics from monocytes after 2 hr of LPS stimulation. (G–I) cis-eQTL summary statistics from monocytes after 24 hr of LPS stimulation. The trans credible set is shown in green. The position of the missense variant in the SLC39A8 gene (rs13107325) is shown with the blue diamond. The cis and trans lead variants are highlighted with red circles.
Figure 3—figure supplement 2
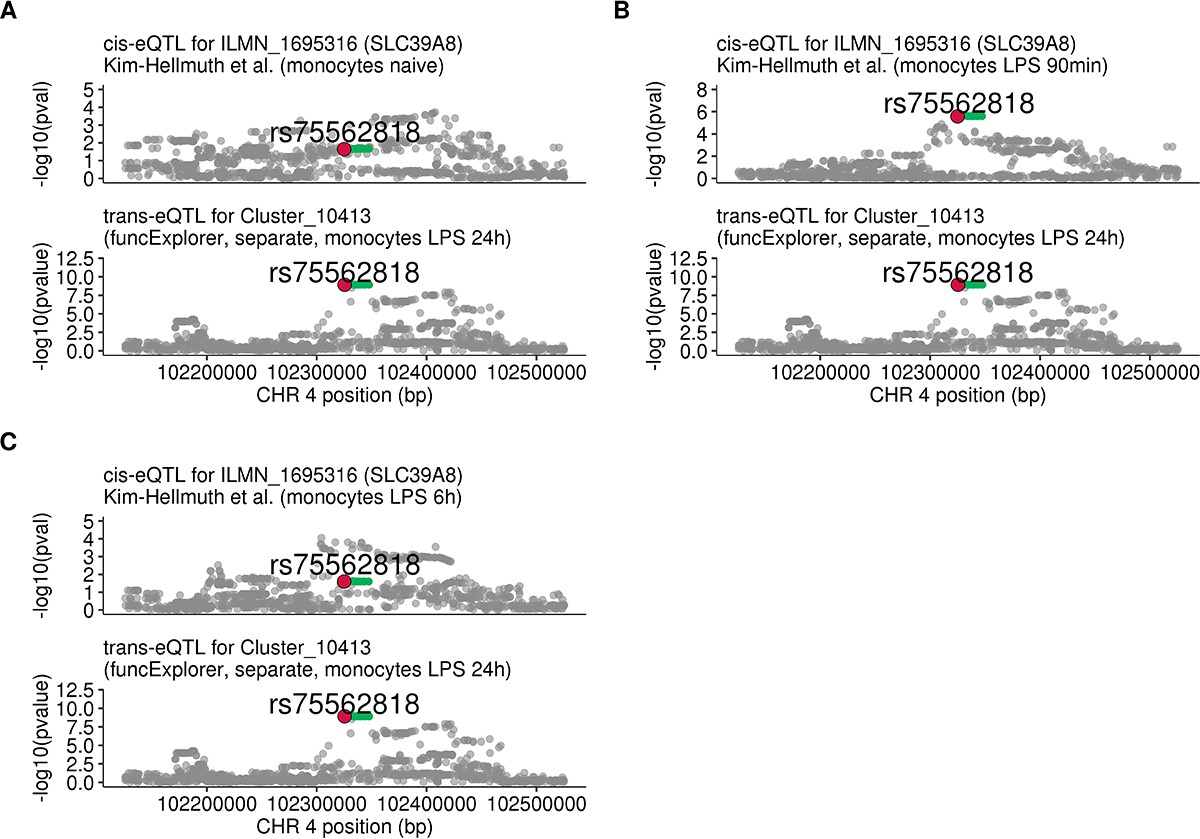
Regional plots comparing association signals of SLC39A8 trans-eQTL (rs75562818) and cis-eQTLs from Kim-Hellmuth et al., 2017.
(A) cis-eQTL summary statistics from naive monocytes (n = 134). (B) cis-eQTL summary statistics 90 min after LPS stimulation (n = 134). (C) cis-eQTL summary statistics 6 hr after LPS stimulation (n = 134). The cis-eQTL signal seen after 90 min of stimulation has disappeared by 6 hr of stimulation.
Figure 3—figure supplement 3
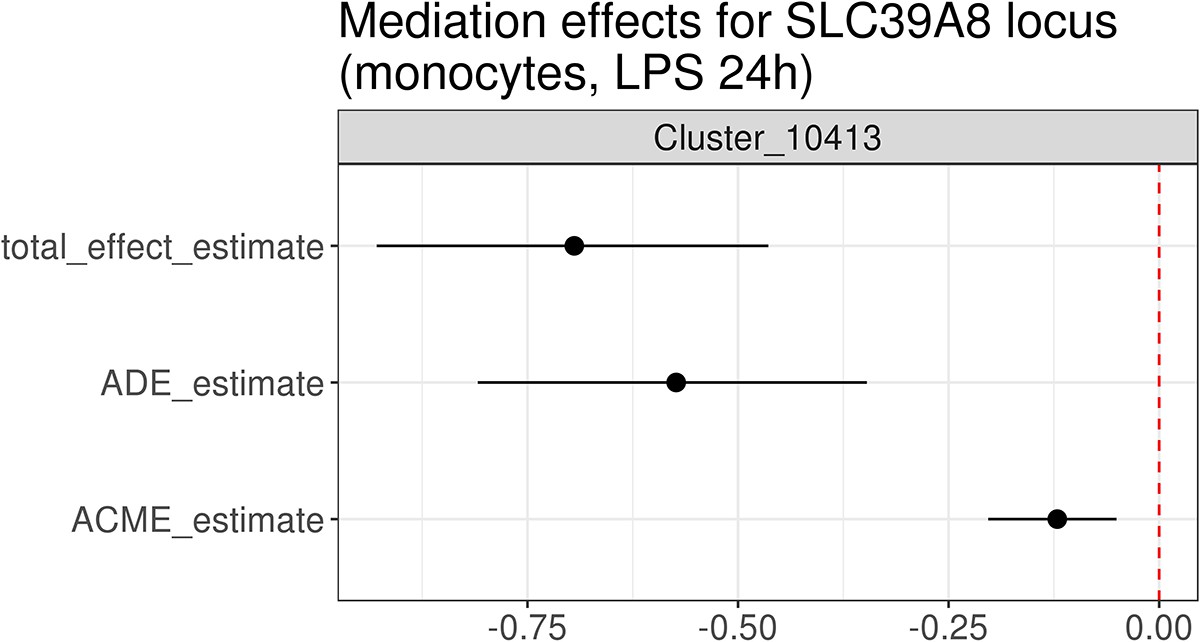
Mediation analysis between the cis-eQTL for SLC38A8 and the trans module associated with the same lead variant (rs75562818) in monocytes stimulated with LPS for 24 hr.
Note that the trans-eQTL lead variant at 24 hr is distinct from the strongest cis association at the same time point (Figure 3—figure supplement 1), which might bias the mediation estimates. The effect estimates along with 95% confidence intervals were evaluated using the bootstrap method (1000 resamples). ACME stands for average causal mediation effect (or indirect effect) and ADE for average direct effect.
Figure 4
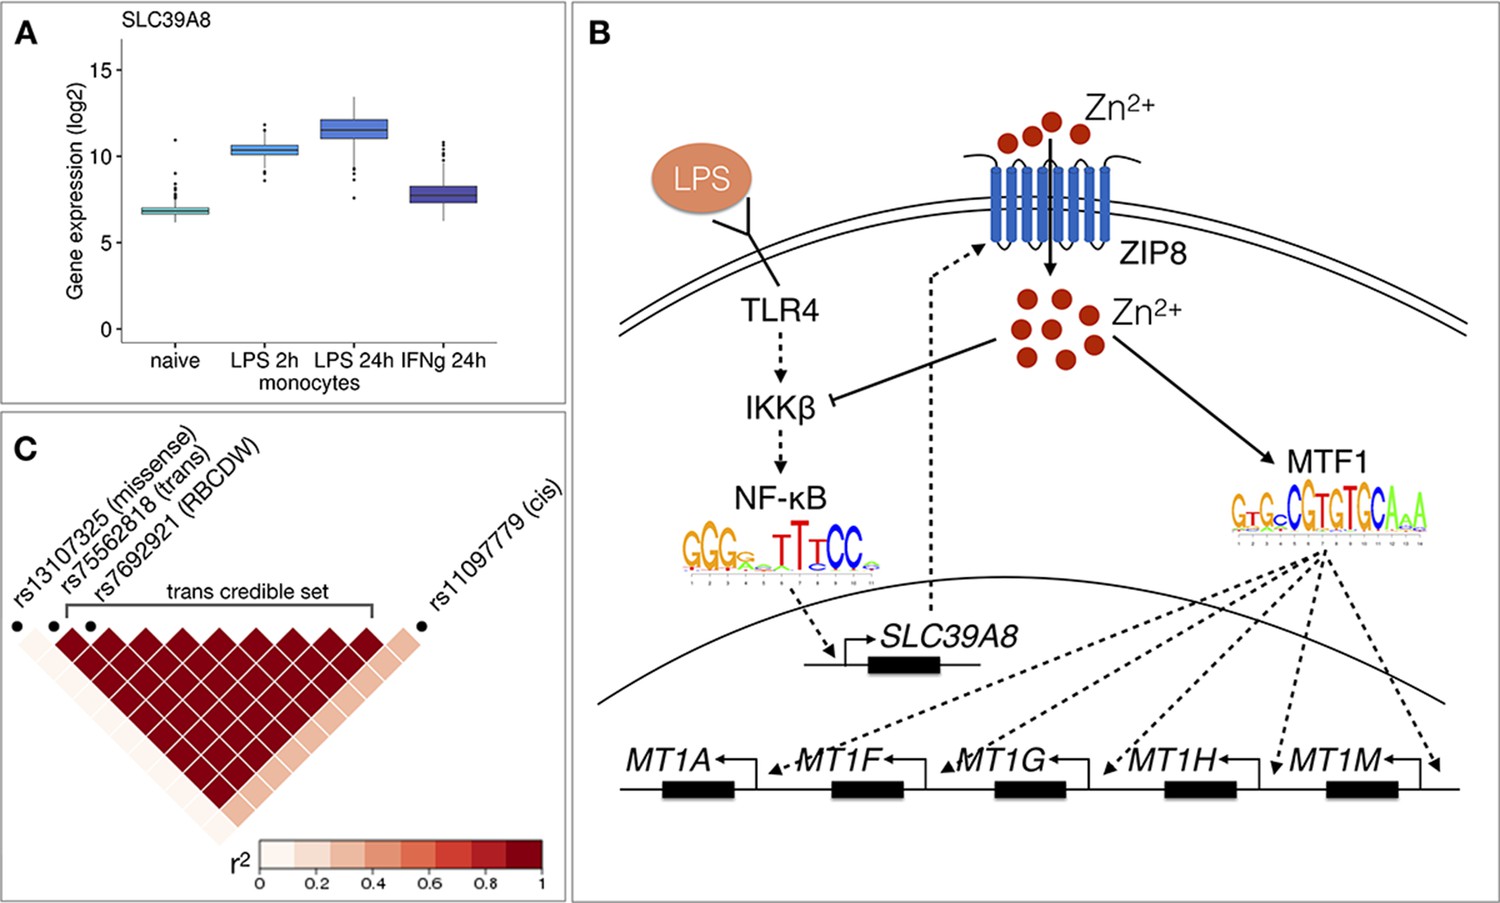
Molecular mechanisms underlying the SLC39A8 trans-eQTL locus.
(A) SLC39A8 gene expression values (log2 intensities) across naive and stimulated monocytes. (B) Overview of the known regulatory interactions underlying the cis and trans eQTL effects at the SLC39A8 locus. Figure adapted from Liu et al., 2013. (C) Pairwise LD (r2 within 1000 Genomes European populations) between the SLC39A8 variants highlighting missense variant (rs13107325), trans-eQTL (rs75562818), red blood cell distribution width (RBCDW) associated SNP (rs7692921) in our credible set and the cis lead variant from naive monocytes (rs11097779). LD was calculated using the LDlinkR (v.1.0.2) R package (Myers et al., 2020).
Tables
Table 1
Literature-based replication of trans-eQTL loci near IFNB1, LYZ and ARHGEF3 genes.
Linkage disequilibrium (r2) was calculated using European samples from the 1000 Genomes Phase 3 reference panel. The last column indicates if any of the associated modules had a significant overlap with the genes reported by the independent study according to one-sided Fisher’s exact test after Bonferroni correction. The overlaps with individual modules are shown in Supplementary file 5. GHS - Gutenberg Health Study, FHS - Framingham Heart Study, CTS - Cardiogenics Transcriptomic Study, * - largest observed r2 in the credible set.
| trans-eQTL | Replication | ||||||||
|---|---|---|---|---|---|---|---|---|---|
| Locus | Lead rs ID | Context | Study | Dataset | Context | rs ID | r2 | Replication variant in credible set | Significant overlap with a module |
| IFNB1 | rs13296842 | Monocytes LPS 24 hr | Fairfax et al., 2014 | Fairfax_2014 | Monocytes LPS 24 hr | rs2275888 | 0.57 (0.86*) | FALSE | - |
| Quach et al., 2016 | Quach_2016 | Monocytes LPS 6 hr | rs12553564 | 0.57 (0.86*) | FALSE | TRUE | |||
| Ramdhani et al., 2020 | Fairfax_2014 | Monocytes LPS 24 hr | rs2275888 | 0.57 (0.86*) | FALSE | - | |||
| Ruffieux et al., 2018 | Fairfax_2014 | Monocytes LPS 24 hr | rs3898946 | 0.88 | TRUE | - | |||
| LYZ | rs10784774 | Monocytes naive, LPS 2 hr, LPS 24 hr, IFNγ 24 hr | Rotival et al., 2011 | GHS | Monocytes | rs11177644 | 0.79 | TRUE | TRUE |
| Fairfax et al., 2012 | Fairfax_2012 | Monocytes | rs10784774 | 1 | TRUE | - | |||
| Rakitsch and Stegle, 2016 | CTS | Monocytes | rs6581889 | 0.79 | TRUE | TRUE | |||
| ARHGEF3 | rs1354034 | Platelets | Võsa et al., 2018 | eQTLGen | Blood | rs1354034 | 1 | TRUE | TRUE |
| Mao et al., 2019 | Battle_2014 | Blood | rs1354034 | 1 | TRUE | - | |||
| Rotival et al., 2011 | GHS | Monocytes | rs12485738 | 0.6 | FALSE | - | |||
| rs1344142 | 0.6 | TRUE | - | ||||||
| Wheeler et al., 2019 | FHS | Blood | - | - | - | - | |||
| Nath et al., 2017 | DILGOM07 | Blood | rs1354034 | 1 | TRUE | TRUE | |||
Table 2
Number of samples included in the analysis from each study and each cell type.
| Cell type | Fairfax_2012 | Fairfax_2014 | Naranbhai_2015 | Kasela_2017 | CEDAR |
|---|---|---|---|---|---|
| B cell | 281 | - | - | - | 266 |
| T cell CD4+ | - | - | - | 279 | 294 |
| T cell CD8+ | - | - | - | 267 | 281 |
| Neutrophil | - | - | 93 | - | 291 |
| Platelet | - | - | - | - | 226 |
| Monocyte naive | - | 420 | - | - | 290 |
| Monocyte LPS 2 hr | - | 255 | - | - | - |
| Monocyte LPS 24 hr | - | 325 | - | - | - |
| Monocyte IFNγ 24 hr | - | 370 | - | - | - |
Additional files
-
Supplementary file 1
Co-expression trans-eQTL analysis results together with links to g:Profiler enrichment analysis (XLSX).
- https://cdn.elifesciences.org/articles/58705/elife-58705-supp1-v1.xlsx
-
Supplementary file 2
Module credible sets and overlaps with gene-level trans-eQTL analysis results (XLSX).
- https://cdn.elifesciences.org/articles/58705/elife-58705-supp2-v1.xlsx
-
Supplementary file 3
Functional enrichment evaluation of associated gene modules and gene-level analysis results (XLSX).
- https://cdn.elifesciences.org/articles/58705/elife-58705-supp3-v1.xlsx
-
Supplementary file 4
Mediation analysis results for LYZ, ARHGEF3 and SLC39A8 (XLSX).
- https://cdn.elifesciences.org/articles/58705/elife-58705-supp4-v1.xlsx
-
Supplementary file 5
Literature replication results (XLSX).
- https://cdn.elifesciences.org/articles/58705/elife-58705-supp5-v1.xlsx
-
Transparent reporting form
- https://cdn.elifesciences.org/articles/58705/elife-58705-transrepform-v1.docx
Download links
A two-part list of links to download the article, or parts of the article, in various formats.
Downloads (link to download the article as PDF)
Open citations (links to open the citations from this article in various online reference manager services)
Cite this article (links to download the citations from this article in formats compatible with various reference manager tools)
Co-expression analysis reveals interpretable gene modules controlled by trans-acting genetic variants
eLife 9:e58705.
https://doi.org/10.7554/eLife.58705


