Membrane voltage dysregulation driven by metabolic dysfunction underlies bactericidal activity of aminoglycosides
- BioFrontiers Institute and the Department of Molecular, Cellular, Developmental Biology, University of Colorado Boulder, United States
Figures
Figure 1 with 1 supplement
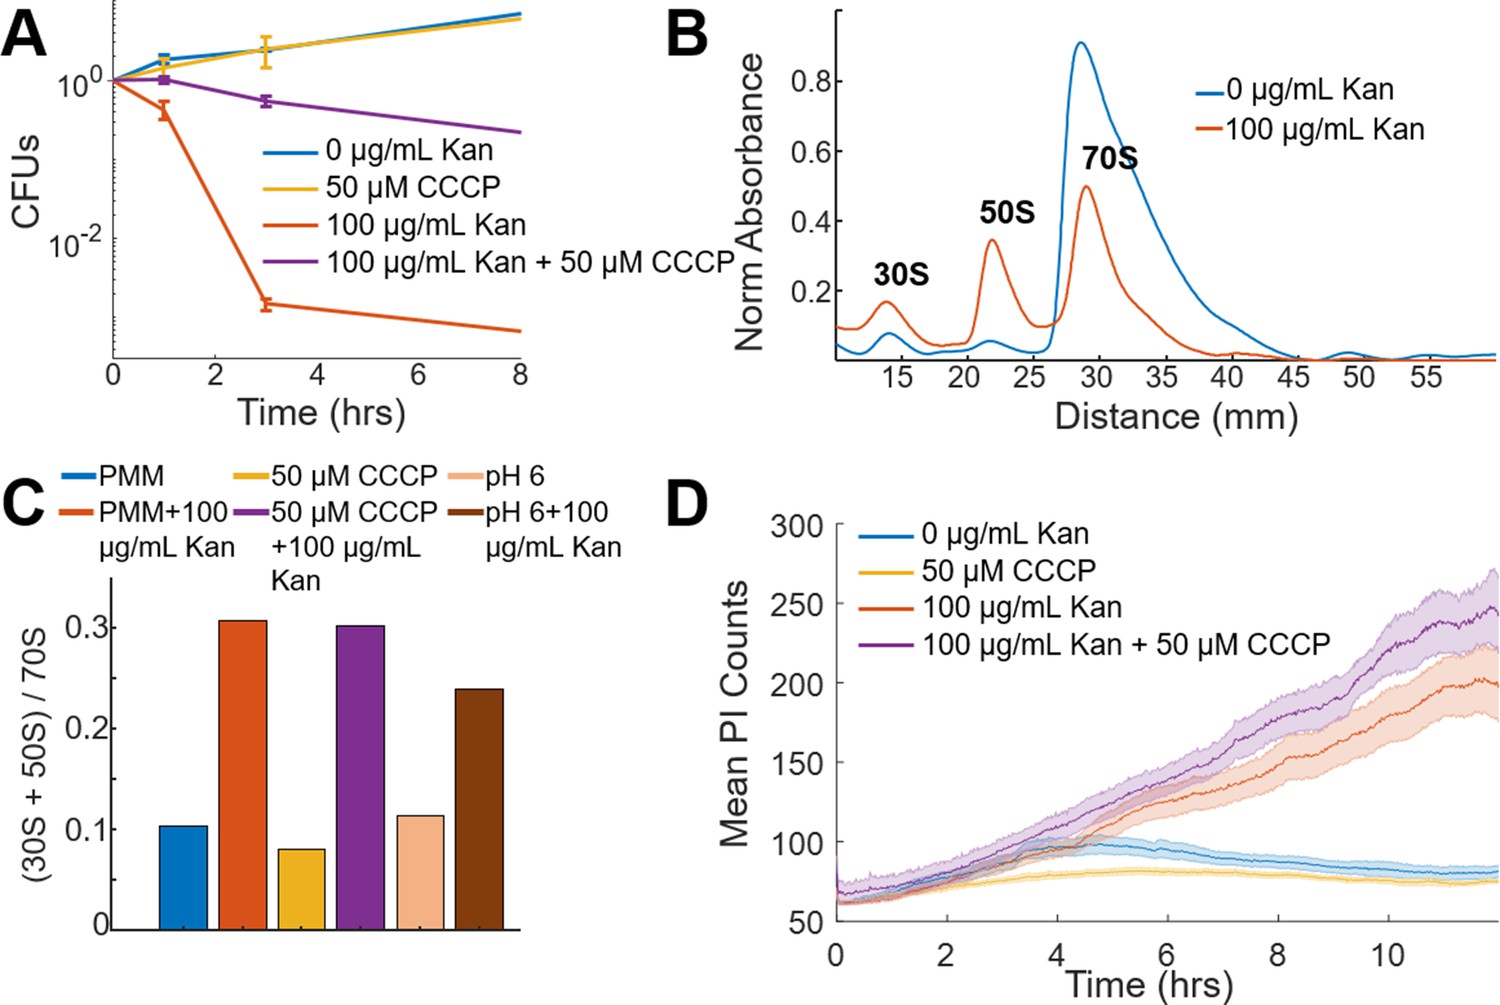
Voltage is not necessary for aminoglycoside uptake or inner membrane pore formation in E. coli but is required for bactericidal activity.
(A) Colony forming units (CFUs) of untreated cells (blue) over four time points compared to cells treated with 50 µM CCCP (yellow), 100 µg/mL kanamycin (orange), and 50 µM CCCP + 100 µg/mL kanamycin (purple). Each curve averages three biological replicates, with mean and standard deviation plotted for each time point. (B) Ribosomal sucrose gradient depth plotted against 254 nm absorbance from LB grown E. coli treated with vehicle (blue), 100 µg/mL kanamycin (orange). The 30S, 50S, and 70S peaks are labeled. (C) Ratio of the area under the curve for the 30S + 50S to 70S peaks from E. coli in PMM pH 7.5, +50 μM CCCP, or pH 6 in the presence or absence of kanamycin. (D) Propidium iodide (3.75 µM in PMM) fluorescence in cells that were untreated (blue), 50 µM CCCP (yellow), 100 µg/mL kanamycin (orange), and 50 µM CCCP + 100 µg/mL kanamycin (purple) treated. The curve is the mean (solid) and standard deviation (shaded) for three biological replicates.
Figure 1—figure supplement 1
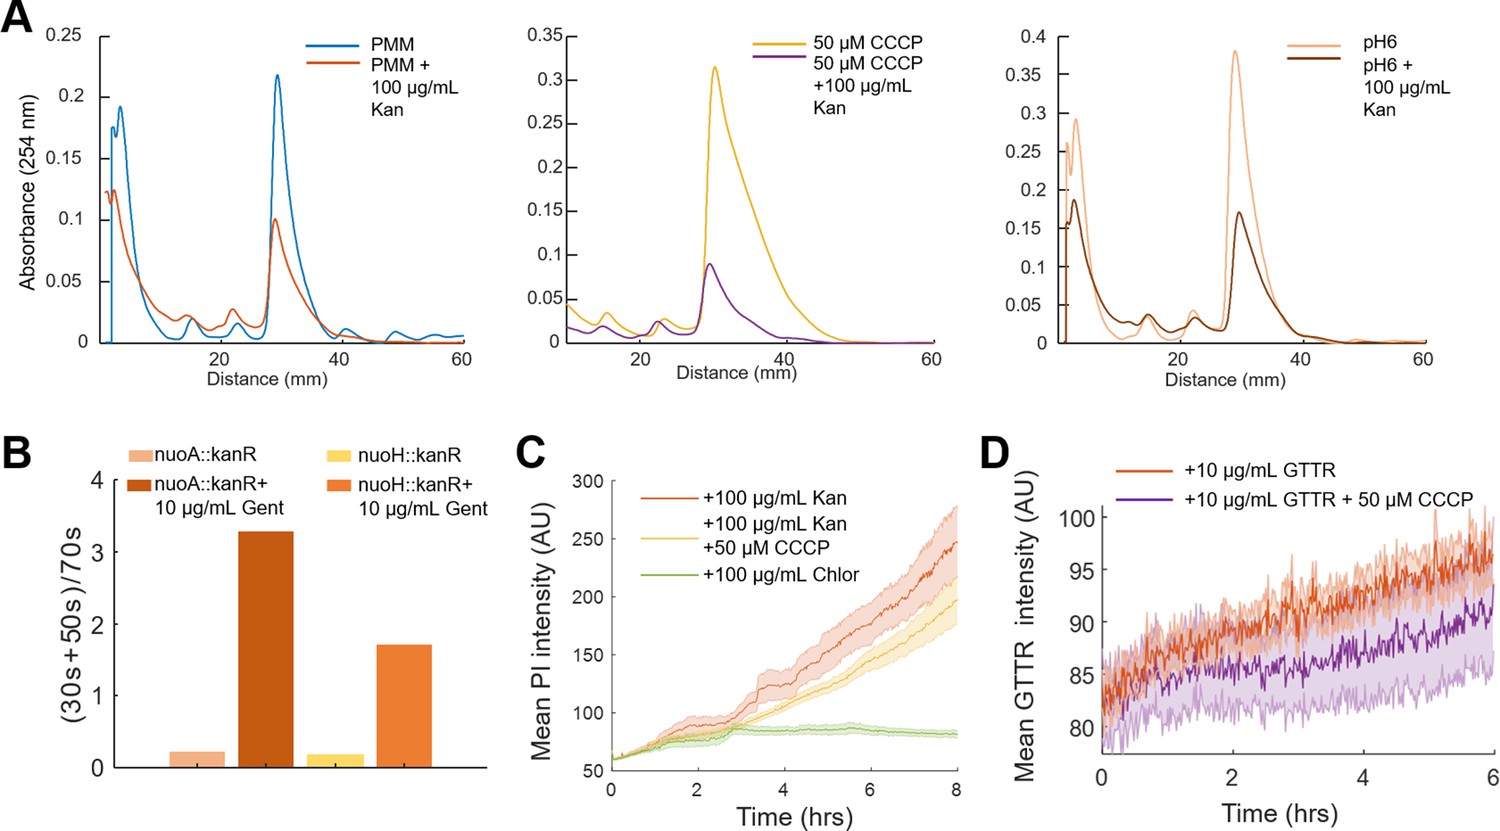
Aminoglycosides enter cells and induce ribosomal dissociation in the abscence of membrane voltage.
(A) Ribosomal sucrose gradient depth plotted against 254 nm absorbance from E. coli in treatment conditions from Figure 1C. (B) Ratio of the area under the curve for the 30S + 50S to 70S peaks from nuoA::kanR and nuoH::kanR E. coli strains in the absence and presence of gentamicin. (C) The uptake of 3.75 µM propidium iodide (PI) was measured by microscopy in cells that were 100 μg/mL kanamycin (orange), 100 μg/mL kanamycin + 50 µM CCCP (yellow), and 100 μg/mL chloramphenicol (green) treated. The mean (line) and standard deviation (shaded) are plotted over time. (D) Texas red fluorescence of a population of cells treated with 10 μg/mL gentamicin Texas red (GTTR) in cells pretreated with 0 μM CCCP (orange) or 50 μM CCCP (purple). The solid line indicates the mean, and the shaded error bars indicate the standard deviation at each time point.
Figure 2 with 4 supplements
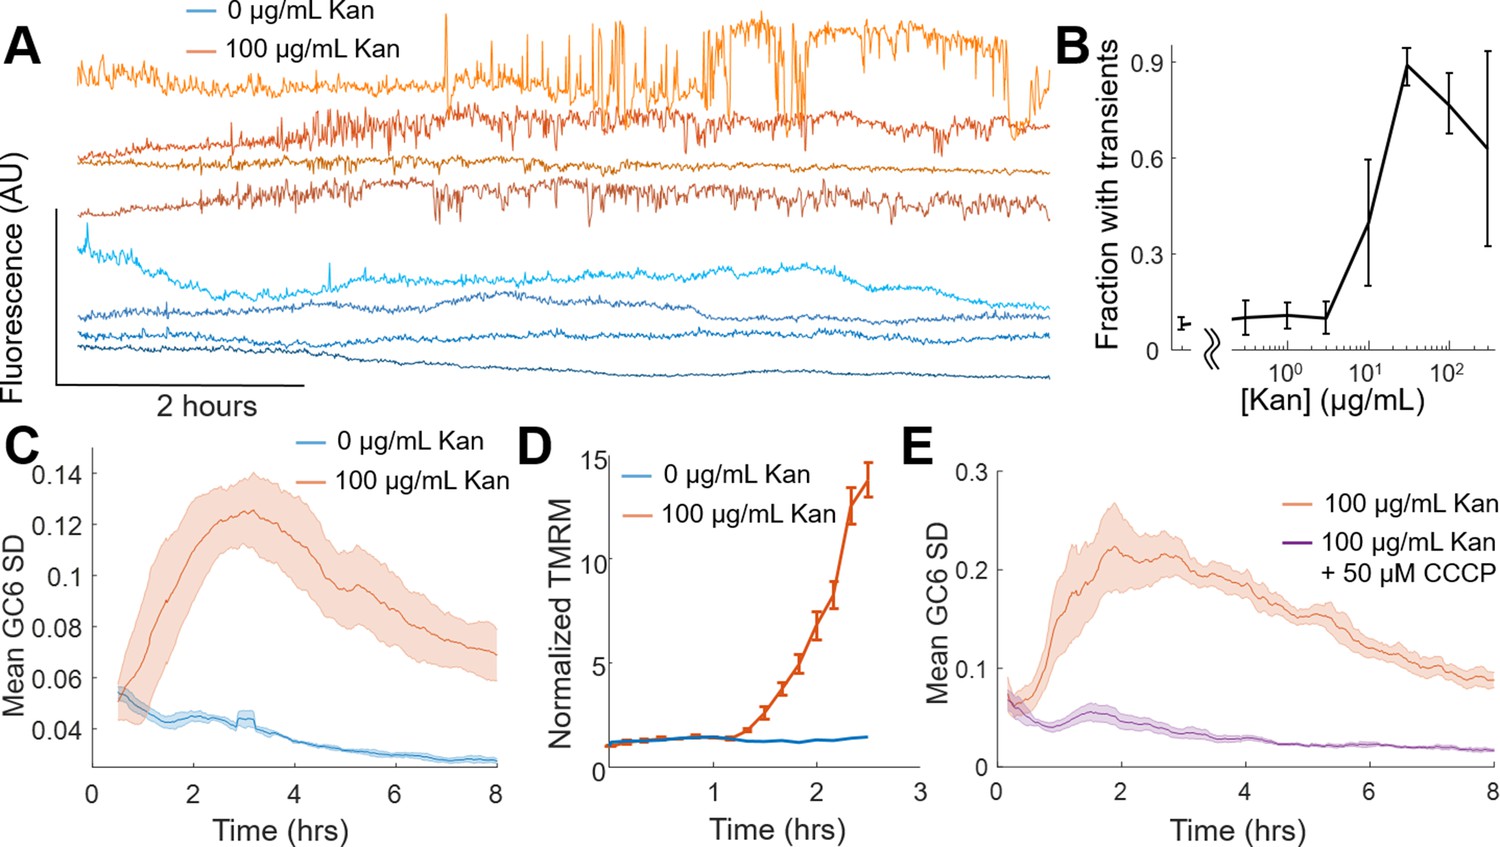
Voltage and calcium exhibit altered electrophysiological flux in response to aminoglycosides.
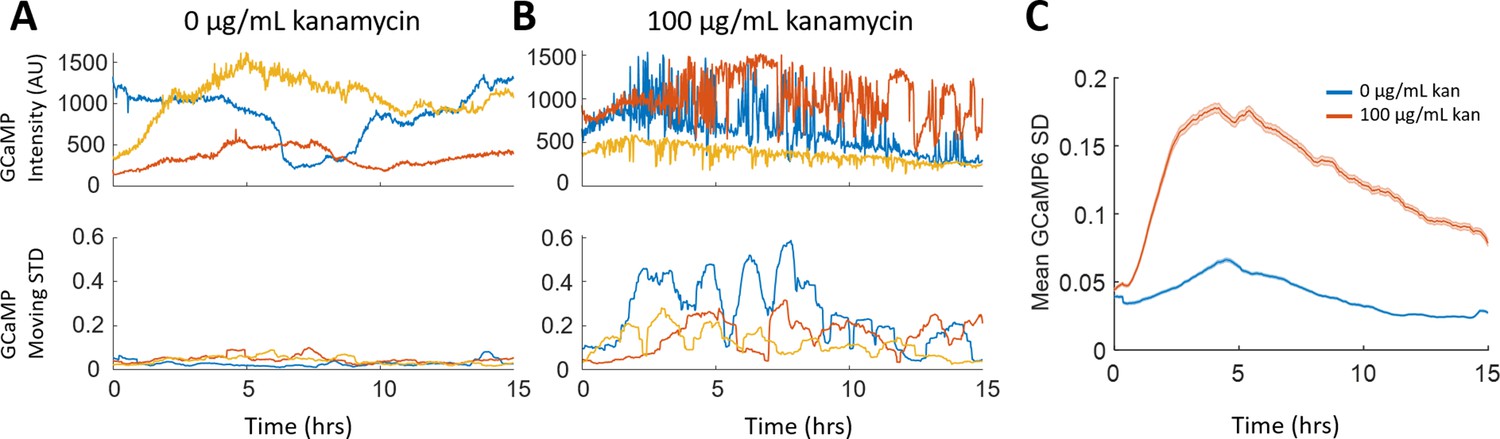
(A) Time traces of GCaMP6 fluorescence from single cells treated with 0 µg/mL (blue shades) and 100 µg/mL (orange shades) kanamycin. Individual cells display non-oscillatory transients. (B) The fraction of cells in a population of GCaMP6F expressing cells E. coli experiencing the transients in A at different concentrations of Kanamycin. The mean (line) and standard deviation (error bars) are shown for three biological replicates. (C) The average (solid line) and standard deviation (shading) of the moving GCaMP6f standard deviation (SD) over time from 0 µg/mL (blue) and 100 µg/mL kanamycin (orange) treated cells. (D) TMRM fluorescence from untreated (blue) or kanamycin treated (orange) (100 µg/mL, 2 hr) E. coli measured by cytometry. The average (line) and standard deviation (error bars) of three biological replicates are plotted. (E) The average (solid line) and standard deviation (shading) of the moving GCaMP6f Standard Deviation over time from 100 µg/mL kanamycin-treated cells in the absence (orange) or presence (purple) of 50 µM CCCP.
Figure 2—figure supplement 1
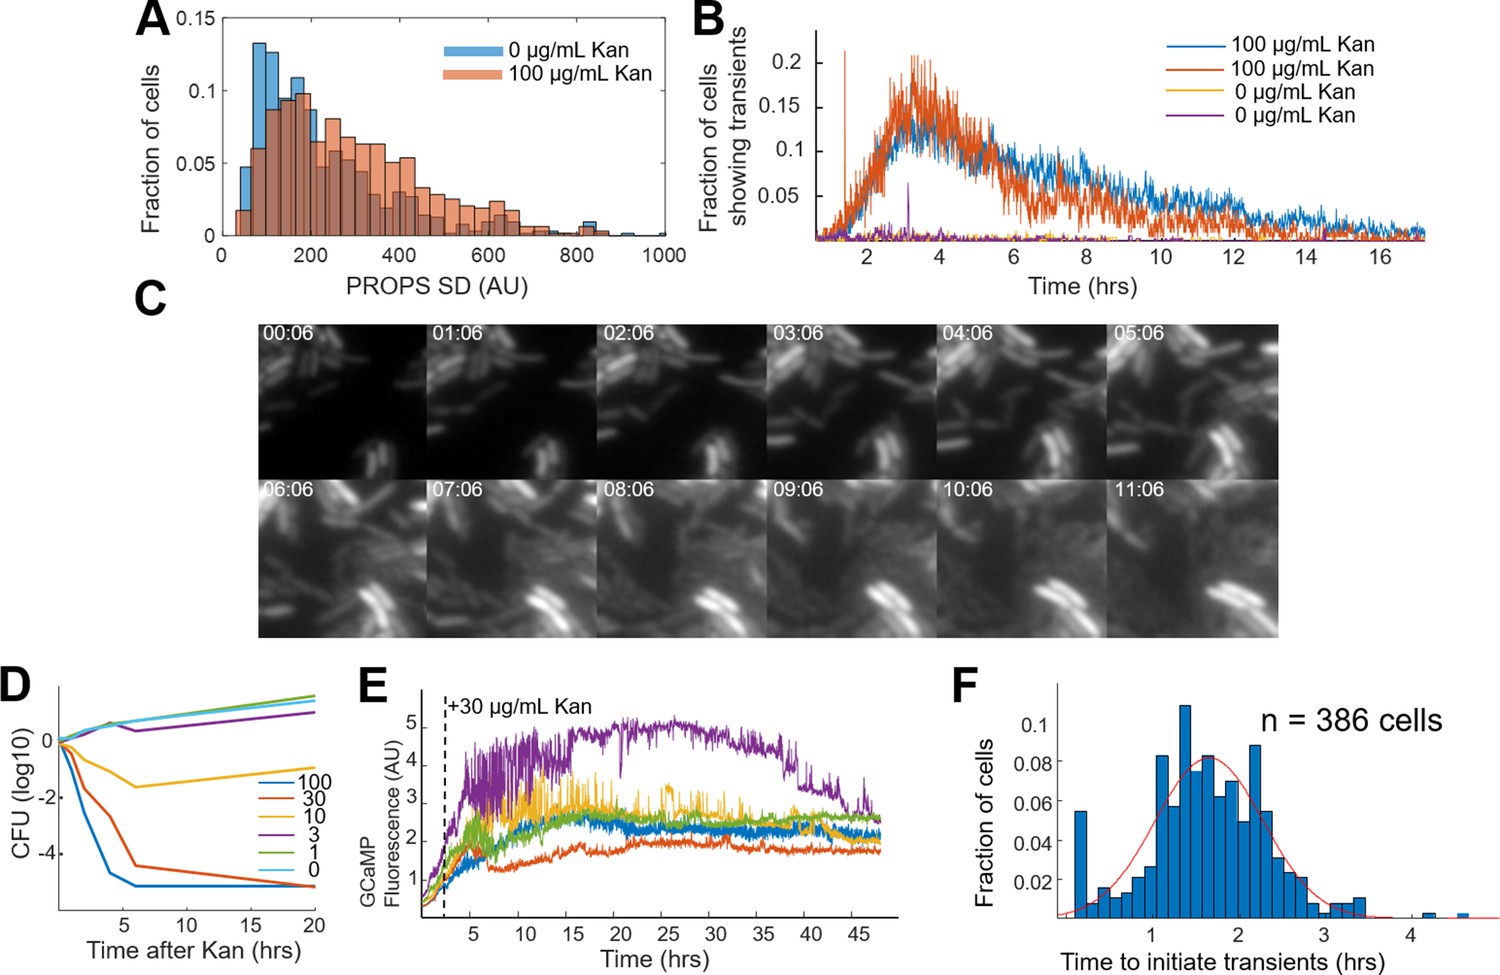
Kanamycin induces voltage and calcium transients.
(A) A histogram of the fraction of cells with a given standard deviation of PROPS fluorescence in the absence (blue) and presence (orange) of 100 μg/mL kanamycin. (B,C) Untreated cells have substantially fewer large calcium transients. (B) Fraction of cells exhibiting calcium transients as a function of time for untreated (yellow, purple) compared to treated (red, blue) cells. Each trace represents the mean of biological replicates of > 200 individual cells. Untreated cells do not show any coordinated transients. (C) Strip chart showing the growth of untreated cells. Unlike antibiotic-treated cells under identical imaging conditions, these E. coli cells were able to grow and divide until filling the entire field of view. The time is shown in (HH:MM) format. (D) Survival of cells in liquid culture upon increasing kanamycin concentration in µg/mL, measured by CFUs at indicated dose and time. Each curve averages three biological replicates. (E) Kanamycin-treated cells are capable of exhibiting transients for at least 48 hr. Time traces of GCaMP6 fluorescence from individual cells. Each color represents the mean fluorescence from a single cell. The black dotted line represents the addition of 30 µg/mL kanamycin. The majority of calcium transients occur within the first 12 hr after treatment, but individual cells still show activity even up to 48 hr after treatment. (F) Histogram shows the time of the first transient for cells that had transients. The population fit to a Gaussian with a peak of 1.64 hr after kanamycin addition.
Figure 2—figure supplement 2
Calculating moving standard deviation from treated cells.
(A) Top - GCaMP6 intensity traces from single cells marked by different colors under no external antibiotic concentrations. Bottom – Moving standard deviation traces from the same cells in the top, where the same color indicates the standard deviation from that cell. The fluorescence changes were transformed to the GCaMP6f moving standard deviation by first normalizing by dividing by a 45 min moving median. Then the moving standard deviation was calculated from the normalized trace using a 30 min sliding window, the output of which is shown here. (B) The same as in part A, except cells were treated with 100 μg/mL kanamycin. (C) Mean of the moving standard deviations from the untreated (blue) or kanamycin-treated (orange) populations. The solid line indicates the mean, and the shaded error bars indicate the standard deviation at each time point.
Figure 2—figure supplement 3
Only aminoglycosides induce calcium transients.
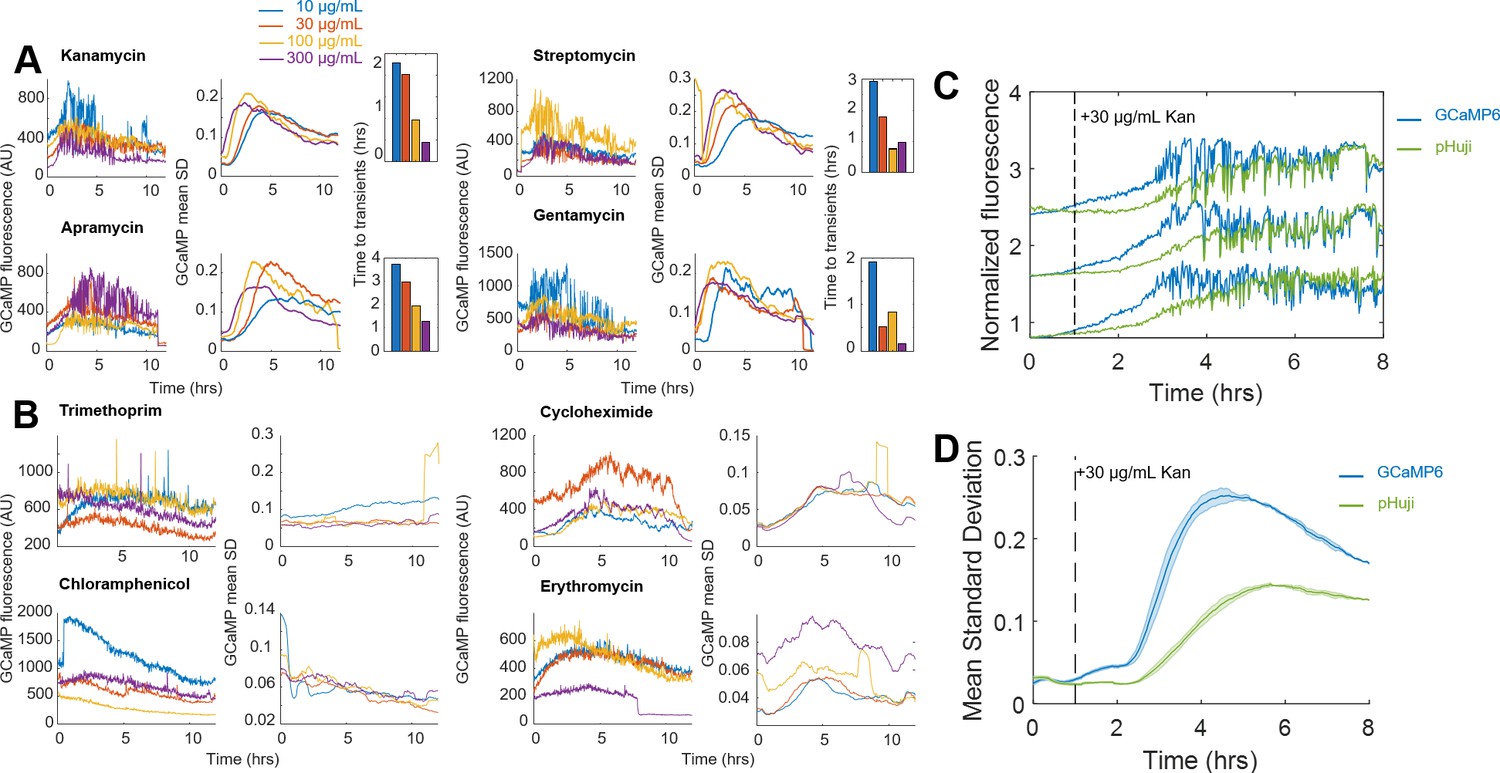
(A) All aminoglycosides tested (kanamycin, streptomycin, apramycin, gentamicin) exhibit calcium transients in a concentration dependent fashion. For each compound tested, the fraction of cells exhibiting transients increased, while the time of transient onset decreased with increasing concentration of aminoglycoside treatment. Each three panel set of the compounds; Kanamycin, Streptomycin, Apramycin, and Gentamicin: (left) representative GCaMP6 time traces at 100 µg/mL compound, (middle) the mean GCaMP6 standard deviation of the population, and (right) the mean of the Gaussian fit for the onset of transients for a population as a function of treatment concentration. (B) Antibiotics that are not aminoglycosides did not induce catastrophic calcium transients in any fashion. For trimethoprim, cyclohexamide, chloramphenicol, and erythromycin, representative traces of individual cells are shown at a treatment of 100 µg/mL (Left). The mean GCaMP6 standard deviation for the population is shown across a titration of each antibiotic (right). Each trace is the mean of two biological replicates. (C) Single-cell traces over time of pHuji (green) + GCaMP6f (blue) expressing cells treated with 30 μg/mL kanamycin. (D) Mean moving standard deviation plots of populations of cells represented in C. Dashed line represents addition of aminoglycoside treatment.
Figure 2—figure supplement 4
High pH is necessary to induce calcium transients.
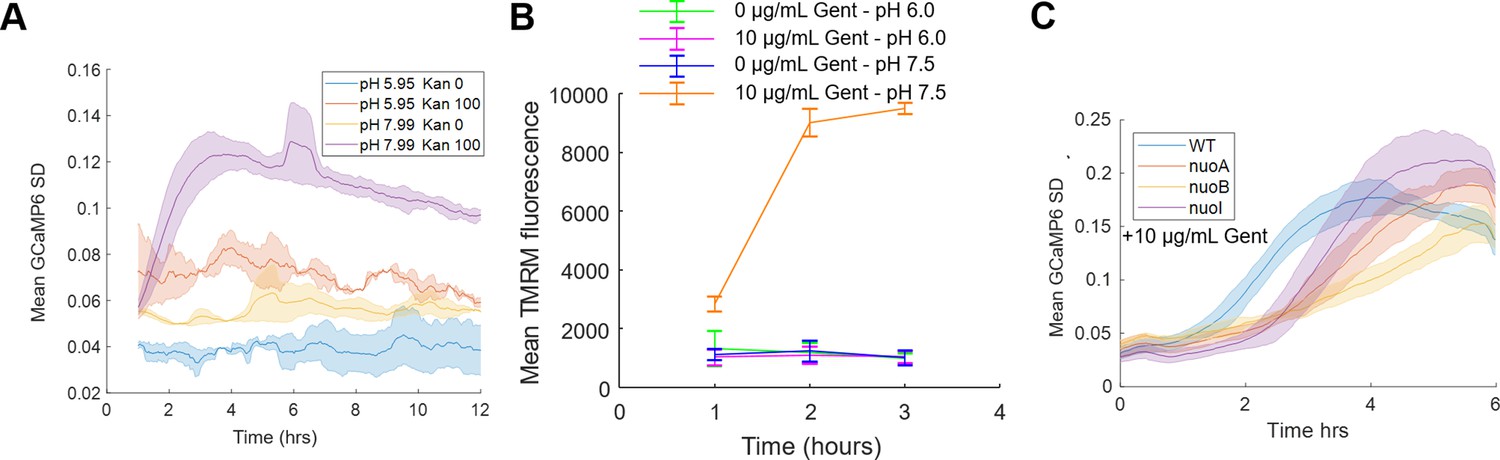
(A) The average of the moving SD from a population of cells at pH 5.95 and pH 7.99, either treated with 0 or 100 µg/mL kanamycin. Each curve averages three biological replicates. Shading around the line is the standard deviation. (B) Mean (line) and standard deviation (error bars) of TMRM fluorescence of cells over time measured by cytometry in 200 nM TMRM in PMM. E. coli in pH 6.0 in the absence (green) or presence (magenta) of 10 µg/mL gentamicin were compared to E. coli at pH 7.5 in the absence (blue), and presence (orange) of 10 µg/mL gentamicin. (C) The average of the moving SD from a population of cells treated with 10 µg/mL gentamicin that were WT (blue), nuoA::kanR (orange), nuoB::kanR (yellow), and nuoI::kanR (purple) strains. Each curve averages three biological replicates. Shading around the line is the standard deviation.
Figure 3 with 1 supplement
Single-cell calcium flux predicts cellular aminoglycoside response.
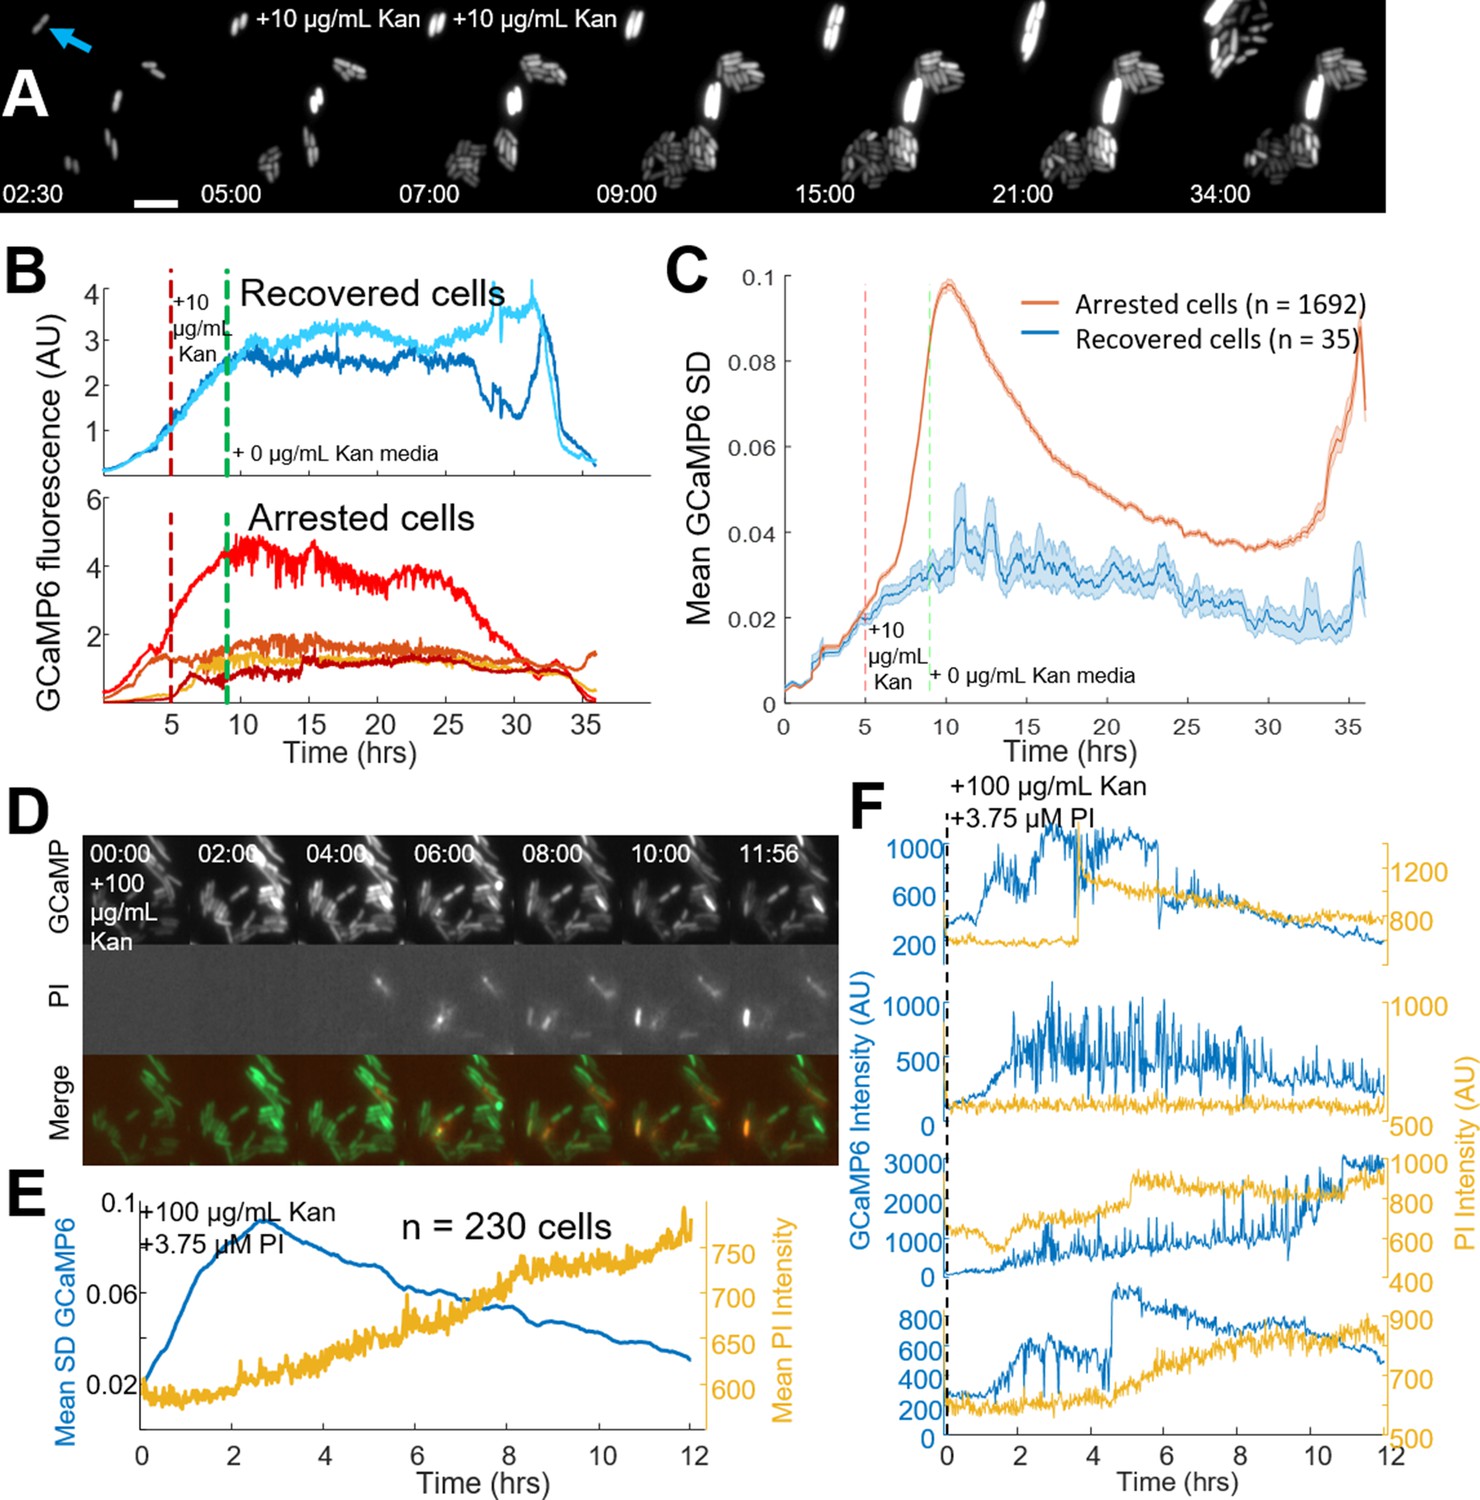
(A) Strip chart of cells expressing GCaMP6f. Cells were imaged in PMM alone for 5 hr, then exposed to 10 µg/mL kanamycin for 4 hr. After 4 hr, PMM alone was flowed in for an additional 26 hr. The blue arrow indicates a cell that was able to divide after treatment with kanamycin, 5 µm scale bar. Time is shown in (HH:MM) format. (B) Individual GCaMP6 time traces from cells that regrow after treatment compared to a random selection of cells that do not regrow within 24 hr. (C) The average (line) and standard deviation (shaded region) of the moving SD from all cells that regrow (blue) vs those that do not regrow (red). (D) Strip chart showing GCaMP6 fluorescence (top), propidium iodide fluorescence (middle), and the merge. Cells were treated with 100 µg/mL kanamycin at time t = 0. Time is shown in (HH:MM) format. (E) The mean GCaMP6 standard deviation for the population is shown in blue. Yellow shows the population average of the PI fluorescence. (F) Time traces of individual cells showing the GCaMP6 fluorescence (blue) and the PI fluorescence (yellow) on the same cells. The PI fluorescence was not correlated with the onset of transients, although many cells did uptake PI during the course of the experiment.
Figure 3—figure supplement 1
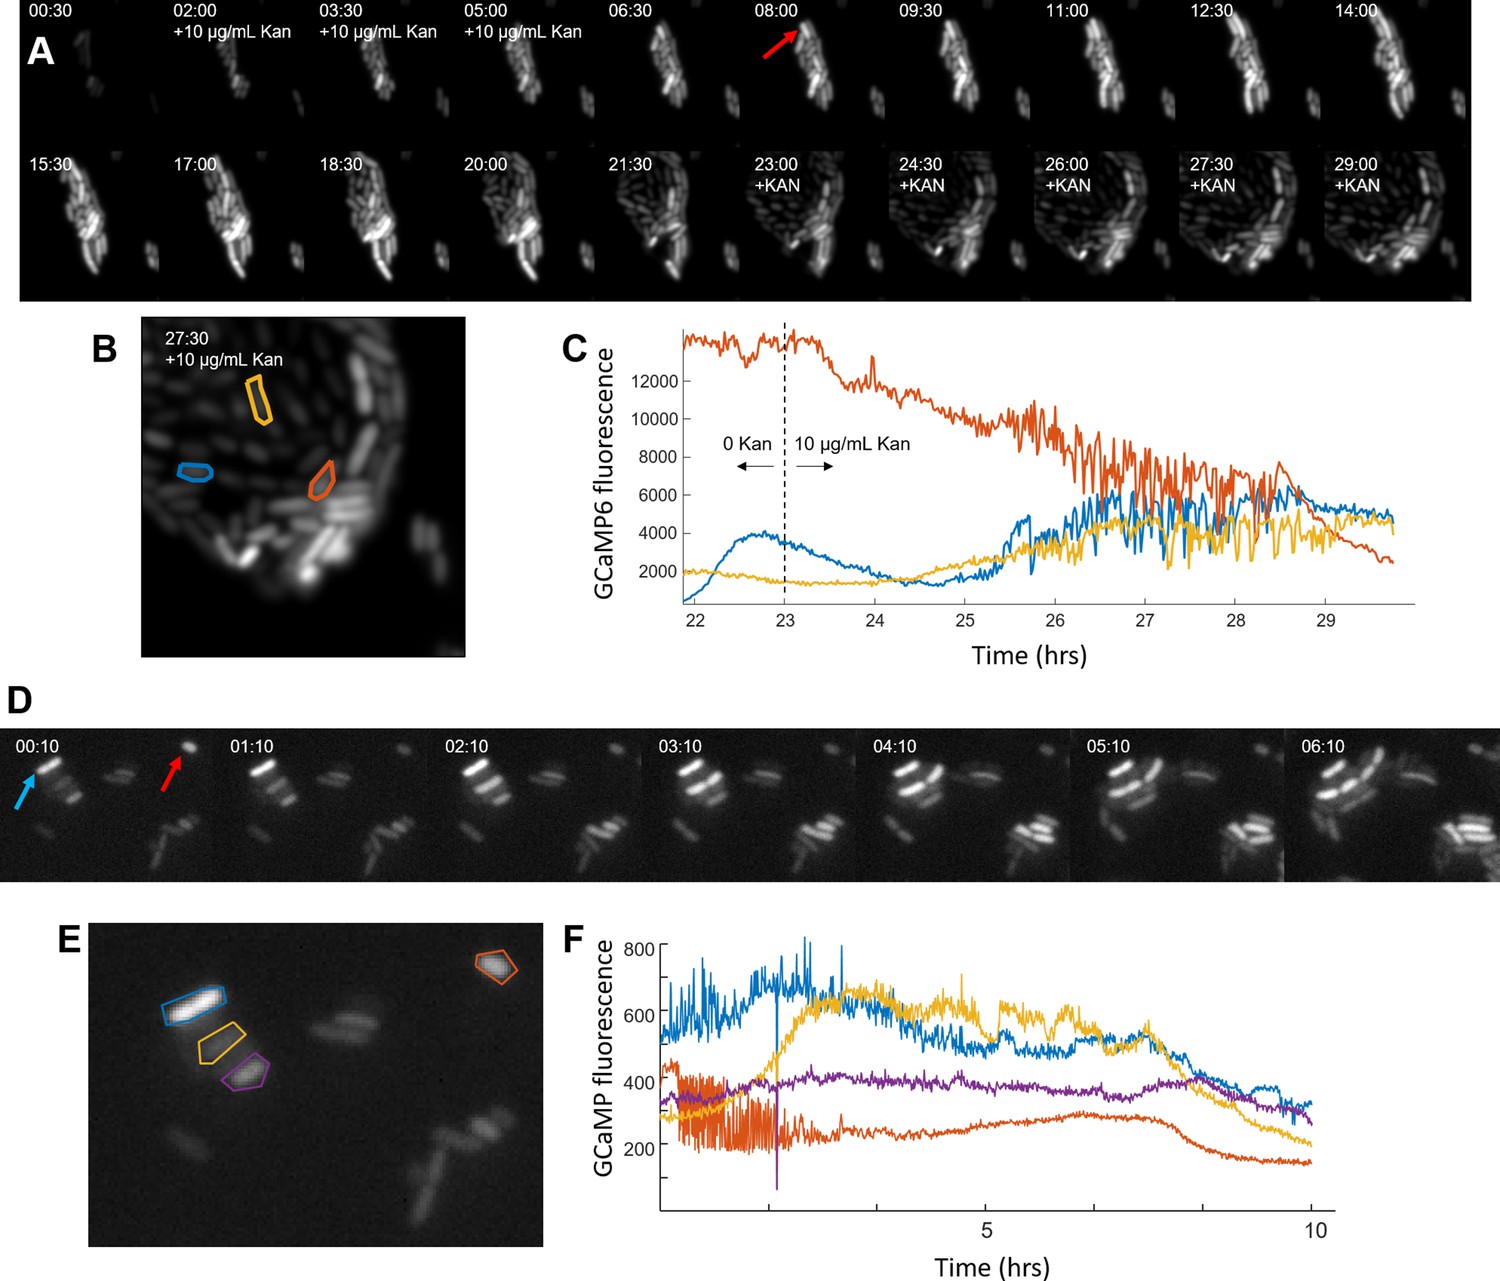
Cells that did not experience calcium transients are not genetically resistant.
(A–C) Cells that regrow after 1 treatment of kanamycin are not genetically resistant. (A) Strip chart of E. coli with 0 µg/mL kanamycin (t = 0–2 hr), 10 µg/mL kanamycin (t = 2–6 hr), 0 µg/mL kanamycin (t = 6–23 hr), and 10 µg/mL kanamycin (t = 23–30 hr). Time is shown at each frame in (HH:MM) format. The red arrow indicates a cell that regrows after the first kanamycin exposure. (B) Image from A at t = 27.5 hr. Individual cells were manually highlighted and shown with three different colors. Each cell has it’s GCaMP6 time trace shown in (C) for just the time period of the second kanamycin addition. (C) GCaM6f fluorescence over time of individual cells in B. (D–F) Untreated cells that exhibit transients do not divide. (D) Strip chart of E. coli imaged via the GCaMP6 fluorescence under PMM without aminoglycoside treatment. The blue and red arrow mark cells that do not divide. The time is shown in (HH:MM) format. (E) Image taken after 10 min of imaging with individual cells segmented manually. Each color corresponds to the GCaMP6 fluorescent trace shown in (F). Any cell that exhibited transients in the untreated conditions did not divide within the movie, which ended with a fully overgrown field of view.
Figure 4 with 1 supplement
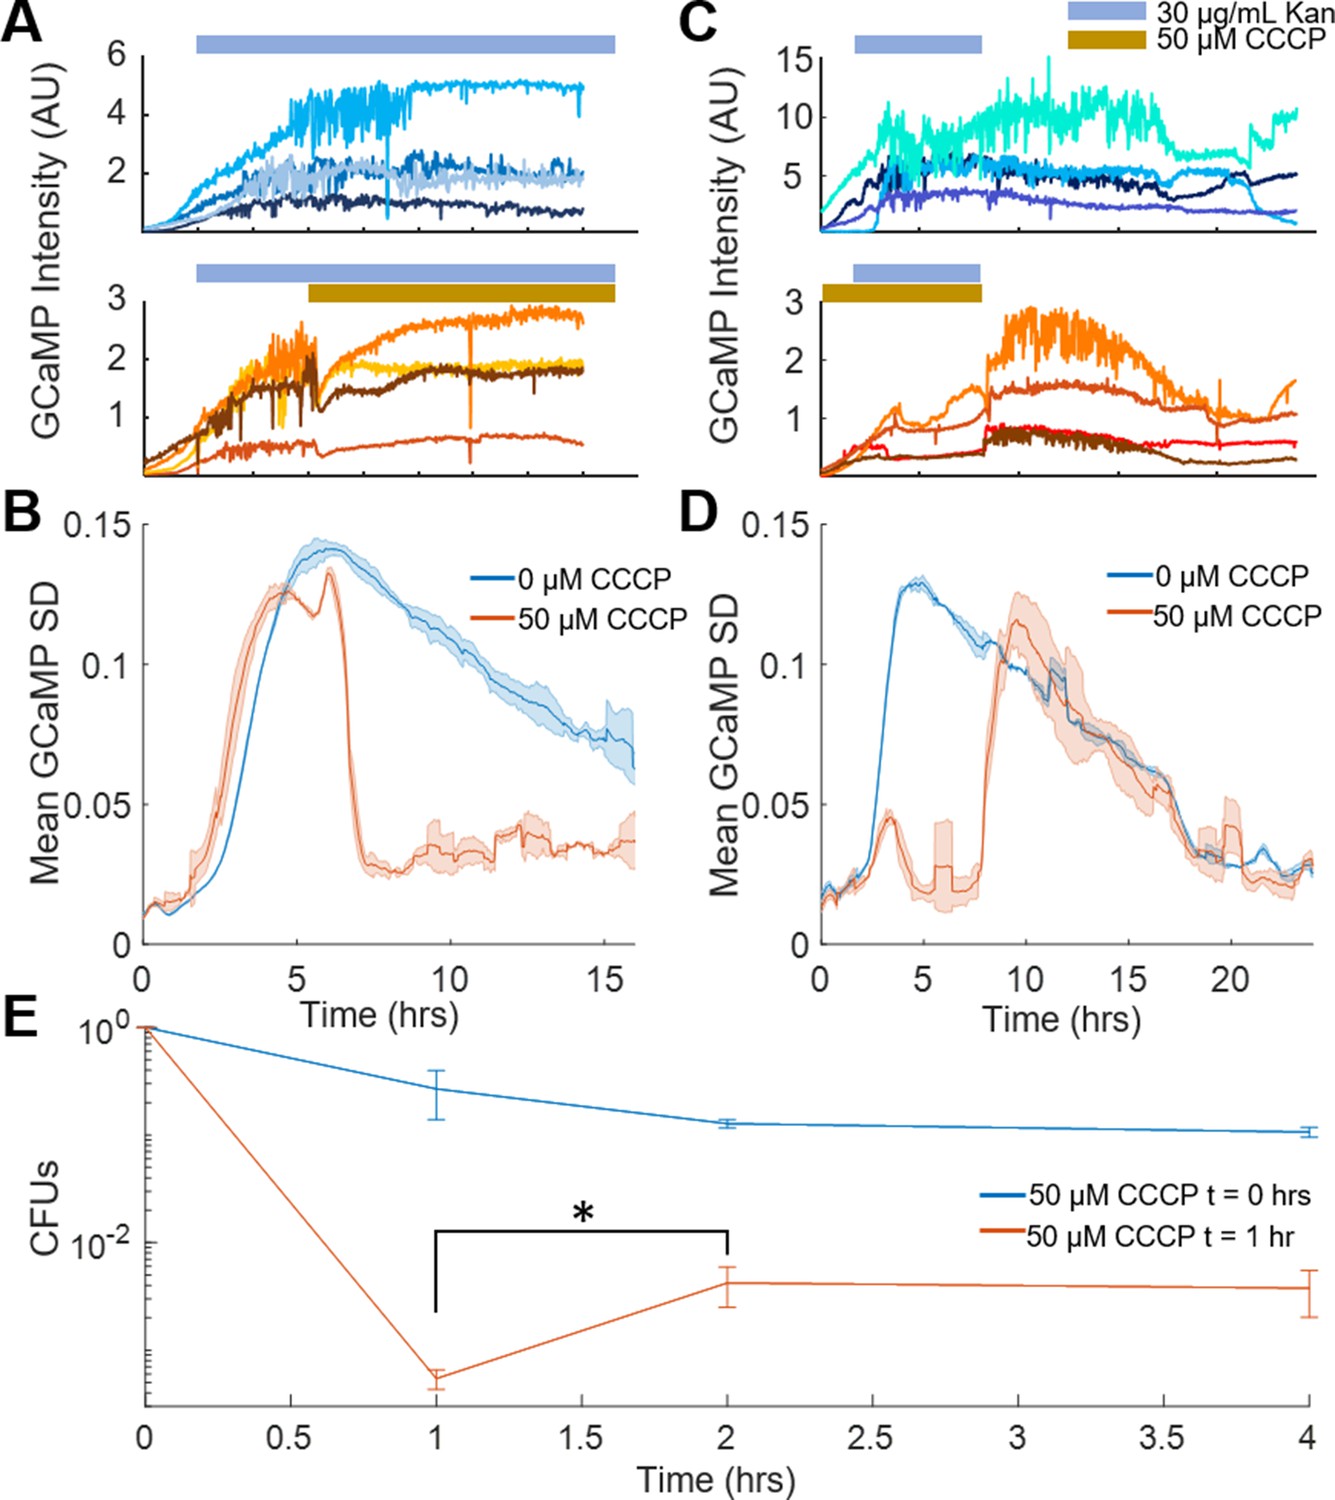
Voltage toggles between bactericidal and bacteriostatic activity in aminoglycoside-treated cells.
(A) Single-cell traces of GCaMP6f intensity over time upon treatment with kanamycin (blue bar, top), or with kanamycin followed by CCCP (yellow bar, bottom). (B) Mean GCaMP6f moving SD of biological replicates over time. The population traces are the mean of the single-cell experiments in B, with kanamycin (blue, corresponds to A top) or kanamycin +CCCP-treated cells (orange, corresponds to A bottom). (C) Single-cell traces of GCaMP6f intensity over time after kanamycin (indicated with a blue bar) was flowed across the cells at 2 hr that were pretreated with vehicle (top) or CCCP (bottom, indicated with a yellow bar). Kanamycin and CCCP were then flowed out of the chamber at 6 hr. (D) Mean GCaMP6f moving SD of biological replicates over time. The population traces are the mean of the single-cell experiments in C, with kanamycin (blue, corresponds to C top) or kanamycin +CCCP-treated cells (orange, corresponds to C bottom). (E) Cells treated with 10 μg/mL gentamycin with CCCP added at t = 0 hr (blue line), or CCCP added at t = 1 hr (orange line). CFUs taken at 1 hr were counted before addition of CCCP, which increased the number of surviving cells at t = 2 hr. *p<0.05.
Figure 4—figure supplement 1
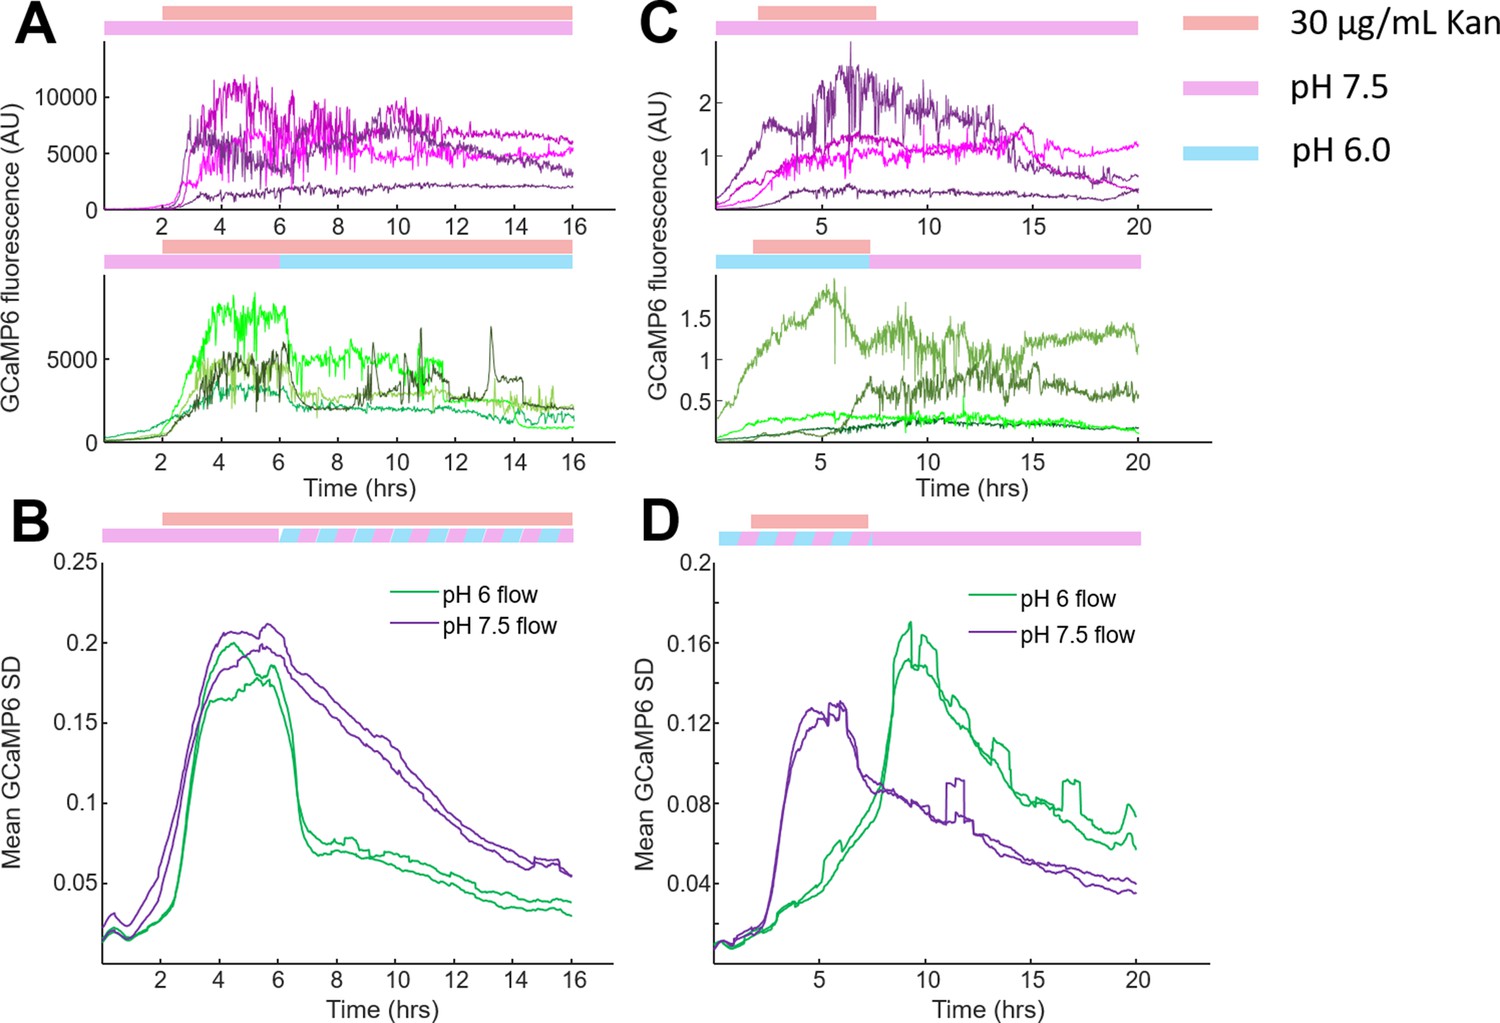
Catastrophic calcium transients require a membrane potential as indicated by low pH protection.
(A–D) Catastrophic calcium transients require a membrane potential as indicated by low pH protection. (A) Random single-cell traces of GCaMP6f intensity over time upon treatment with kanamycin (pink bar, top) at pH 7.5 (lilac bar, top), or with kanamycin and normal to low pH transition (lilac to blue bar, bottom). (B) Mean GCaMP6f standard deviation of biological replicates plotted over time. The population traces correspond to the mean of the single-cell experiments in A, with kanamycin (purple, A-top, pH 7.5 only) or kanamycin +low pH-treated cells (green, A-bottom, pH 7.5- > 6.0). (C) Random single cell traces of GCaMP6f intensity over time after kanamycin was flowed on top of the cells at 2 hr that were pretreated with PMM at pH 7.5 (top, lilac bar) or PMM at low pH (bottom, blue to lilac bar). Kanamycin and low pH were then flowed out of the chamber at 6 hr (pH was restored to 7.5, lilac bar). (D) Mean GCaMP6f standard deviation of biological replicates plotted over time. The population traces correspond to the mean of the single-cell experiments in C, with kanamycin at constant pH 7.5 (purple, C-top, pH 7.5 only) or kanamycin +low pH transition-treated cells (green, C-bottom, pH 6.0- > 7.5).
Figure 5 with 3 supplements
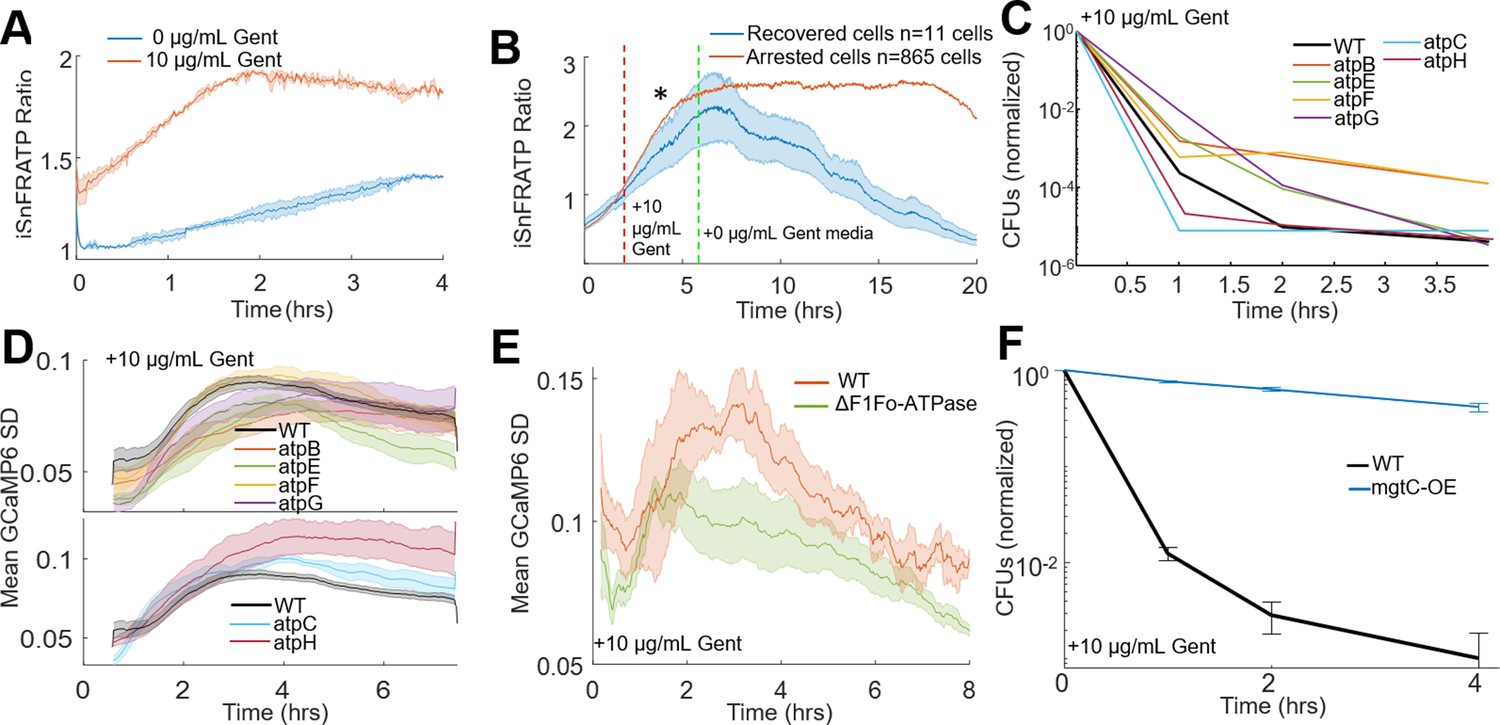
ATP dysregulation precedes voltage-induced bactericidal killing.
(A) iATPSnFR ratios from E. coli treated with vehicle (blue) or 10 µg/mL gentamicin (orange). The ratio of iATPSnFR (488 nm) to mRuby (561 nm) indicates ATP concentration. Each trace averages two biological replicates. (B–F) Cells treated with 10 µg/mL gentamicin. (B) iATPSnFR ratios from gentamicin-treated cells that do (blue) or do not (orange) regrow. The star represents a significance of < 0.05 tested at 2 hr after treatment using a student t-test with unequal variance. (C) Normalized CFUs of gentamicin-treated knockouts of components of the F1Fo-ATPase compared to WT. Each data point is in biological triplicate. (D) Mean moving GCaMP6f SD for gentamicin-treated F1Fo-ATPase component knockouts compared to WT. Each curve averages four biological replicates. (E) Mean moving GCaMP6f SD for gentamicin-treated E. coli strain DK8, missing all components of the F1Fo-ATPase compared to WT. Each curve averages four biological replicates. (F) Normalized CFUs of gentamicin-treated mgtC expressing E. coli compared to WT.
Figure 5—figure supplement 1
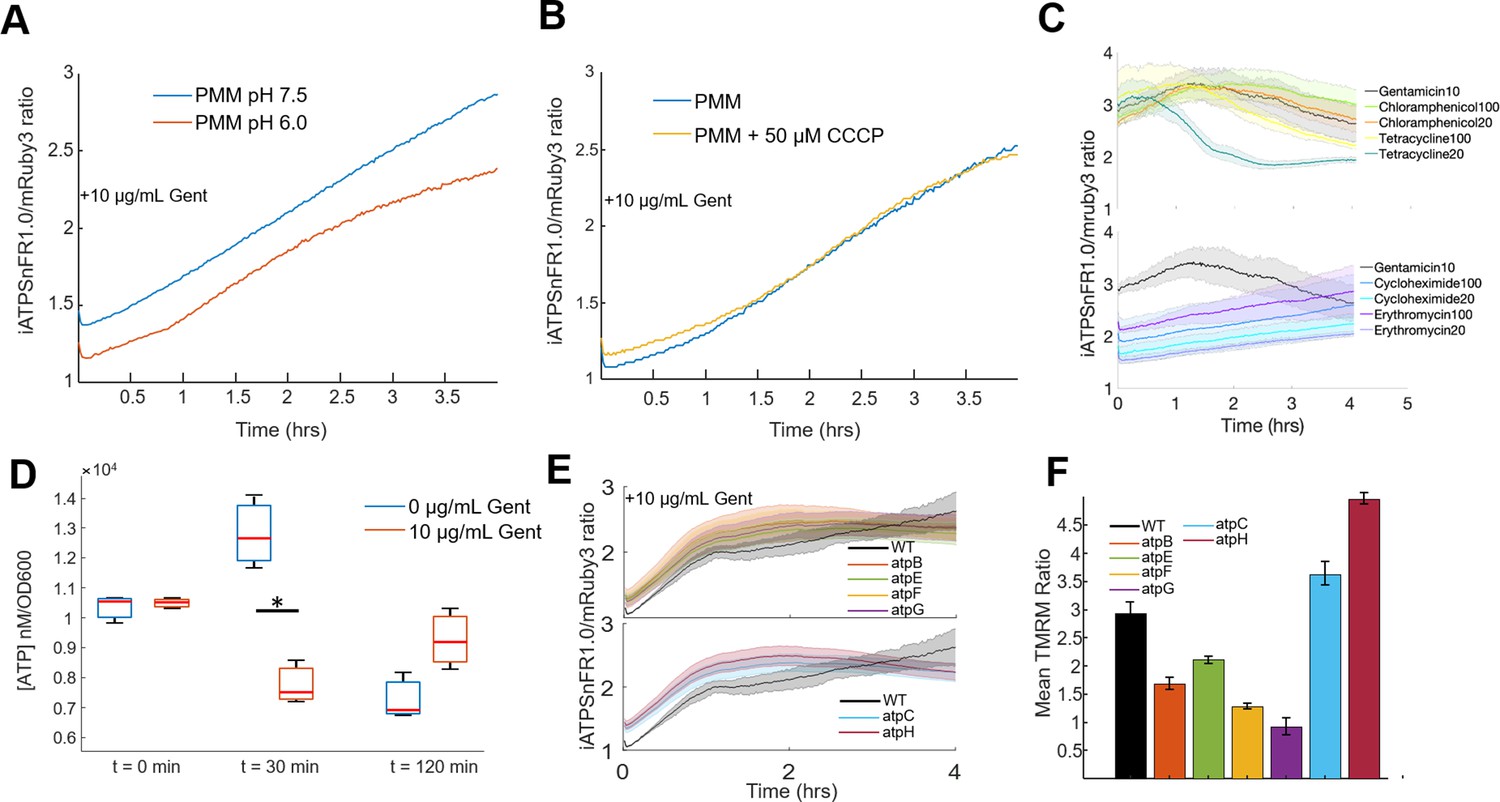
ATP and membrane potential measurements are consistent with ATP dysregulation.
(A,B) Low pH and CCCP maintain the rise in the iATPSnFR1.0/mRuby ratio upon gentamicin treatment when compared to controls. (A) ATP measured in PMM pH 7.5 (blue) or low pH (orange) upon treatment with 10 µg/mL gentamicin. Each line represents the average of three biological replicates. (B) ATP measured in PMM (blue) or PMM + 50 µM CCCP (yellow) upon treatment with 10 µg/mL gentamicin. Each line represents the average of four biological replicates. Even under protective conditions of CCCP or pH 6, 10 µg/mL gentamicin still induced a rise in ATP, but was not coupled with cell death. (C) Some bacteriostatic antibiotics have similar iATPSnFR1.0 ratios compared to gentamicin-treated cells. (D) ATP concentration was quantified with a BacTiter Glo kit in the absence (blue boxplots) and presence (orange boxplots) of 10 µg/mL gentamicin at 0, 30, and 120 min. Simultaneously the optical density at 600 nm was read out, and the proportion of ATP to OD was taken to normalize the amount of ATP across the different time points and treatment conditions. The only significant difference between conditions is at 30 min with a p-value of 0.0036. (E,F) Compared to WT (black). (E) ATP concentration of 10 µg/mL gentamicin-treated F1Fo-ATPase component knockouts. Each curve averages four biological replicates. (F) A bar plot of the ratio of the mean TMRM fluorescence from gentamicin treated (2 hr) to untreated cells measured by flow cytometry. Error bars are 95% confidence interval.
Figure 5—figure supplement 2
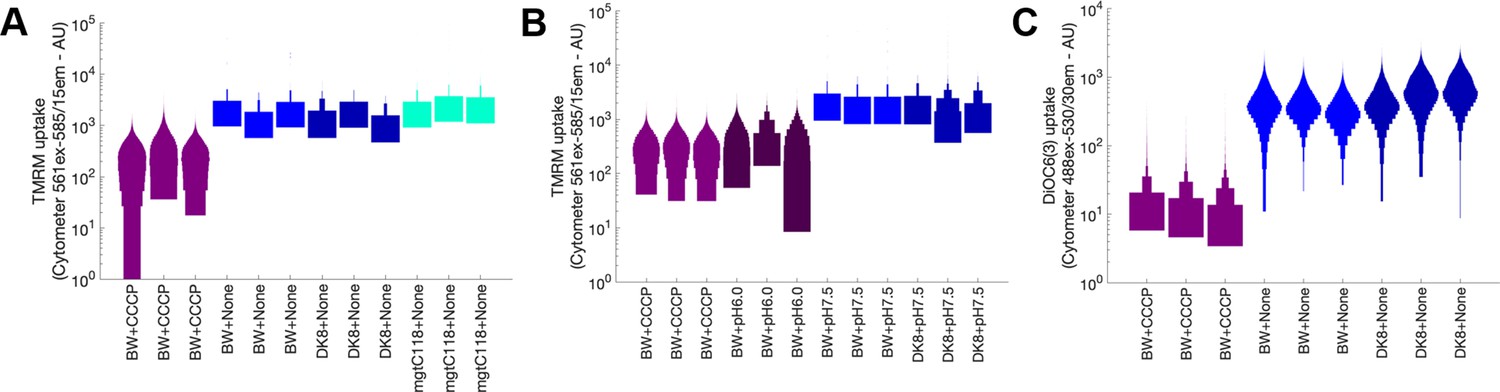
Basal membrane potential measured in strains tested that protect against aminoglycosides does not explain the protective effect.
(A) Violin plots of individual clonal populations of E. coli treated with 200 nM TMRM measured by flow cytometry, with additional strain and treatment indicated on the x-axis. CCCP concentration is 50 µM. All strains are grown to mid-log. (B) Violin plots of individual clonal populations of E. coli treated with 200 nM TMRM measured by flow cytometry, with additional strain and treatment indicated on the x-axis. CCCP concentration is 50 µM. All strains are grown to mid-log. (C) Violin plots of individual clonal populations of E. coli treated with 1 µM DiOC6(3) measured by cytometry, with additional strain and treatment indicated on the x-axis. CCCP concentration is 50 µM. All strains are grown to mid-log.
Figure 5—figure supplement 3
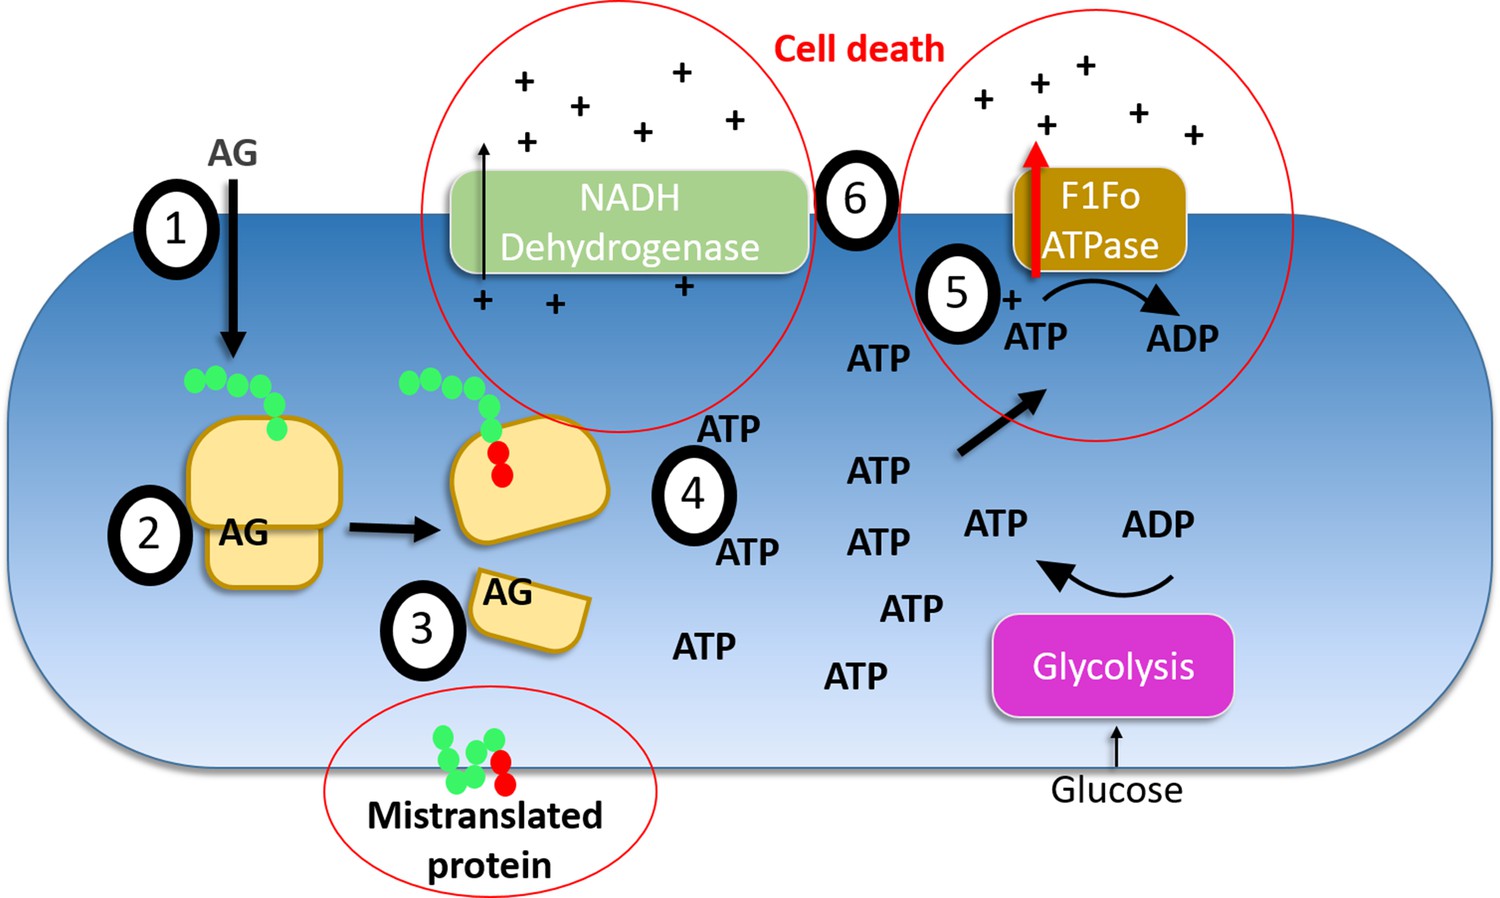
Proposed model of aminoglycoside-induced cell death in E. coli.
(1) Uptake of aminoglycosides has been extensively studied and is not shown in detail here, although our data indicates that aminoglycoside uptake can occur in the absence of membrane potential. (2) Aminoglycosides bind to ribosomes and (3) in the process create mistranslated protein and inhibit translation for a majority of translating ribosomes. These mistranslated proteins are implicated in creating pores in the inner membrane that occur regardless of polarization. Pore formation appears to be an essential step in aminoglycoside-mediated bactericide that distinguishes it from other translation inhibitors. With the loss of translation, (4) ATP is more readily available to other cellular processes. This in turn causes (5) ATPases (including the F1Fo ATPase) to increase their activity given the greater accessibility of ATP, causing the F1Fo ATPase to hyperpolarize cells. This hyperpolarization is required for the (6) bactericidal activity to occur in our observations. Cellular processes including the electron transport chain’s dehydrogenase activity, as well as the energetic state of the cell help determine the degree to which this bactericidal activity occurs. Specifically, higher respiration and carbon sources that contribute the most ATP to the cell (glucose) are the most detrimental prior states E. coli can experience before aminoglycoside treatment. Red circles indicate processes that have data supporting their essentiality in mediating aminoglycoside cell death that do not involve the direct binding of ribosomes.
Videos
Video 1
Video of E. coli expressing GCaMP6f-mScarlet upon treatment with 100 µg/mL kanamycin.
The movie was taken using 488 nm excitation and a 40x air objective imaged onto an sCMOS camera. The movie was taken at a sampling rate of 1 image per minute for 16 hr. This movie has been corrected for uneven illumination, XY drift, and background as mentioned in the Materials and methods. The time indicated represents HH:MM.
Video 2
Video of E. coli expressing GCaMP6f-mScarlet with no kanamycin addition.
The video was taken using 488 nm excitation and a 40x air objective imaged onto an sCMOS camera. The movie was taken at a sampling rate of 1 image per minute for 16 hr. This movie has been corrected for uneven illumination, XY drift, and background as mentioned in the Materials and methods. The time indicated represents HH:MM.
Video 3
Video of E. coli expressing GCaMP6f-mScarlet switching the medium from PMM (0–5 hr), PMM + 10 µg/mL kanamycin (5–9 hr), PMM (9–35 hr).
The movie was taken at a sampling rate of 1 image per minute for 29 hr. This movie has been corrected for uneven illumination, XY drift, and background as mentioned in the Materials and methods. The time indicated represents HH:MM.
Tables
Table 1
Measurements of basal membrane voltage for protective strains
| Strain + treatment | Fluorescent dye | Mean emission (AU) | SD of emission (AU) | p-value (T-test) | Voltage estimates (mV) | Voltage estimate variance |
|---|---|---|---|---|---|---|
| BW+CCCP | TMRM | 399.86 | 104.09 | 0.02 | −133.66 | −34.79 |
| BW+None | TMRM | 716.67 | 47.76 | 1 | −150 | −10 |
| DK8+None | TMRM | 1123.41 | 218.67 | 0.08 | −162.59 | −31.65 |
| mgtC118+None | TMRM | 1062.52 | 202.43 | 0.09 | −161.03 | −30.68 |
| BW+CCCP | TMRM | 380.74 | 23.37 | <0.01 | −130.17 | −7.99 |
| BW+pH6.0 | TMRM | 535.72 | 24.2 | <0.01 | −139.73 | −6.31 |
| BW+pH7.5 | TMRM | 773.04 | 18.5 | 1 | −150 | −3.59 |
| DK8+pH7.5 | TMRM | 1674.41 | 8.67 | <0.01 | −171.64 | −0.89 |
| BW+CCCP | DiOC6 | 17.43 | 2.55 | 0.01 | −57.69 | −8.45 |
| BW+None | DiOC6 | 471.07 | 62.41 | 1 | −150 | −19.87 |
| DK8+None | DiOC6 | 724.67 | 162.21 | 0.1 | −162.06 | −36.27 |
Key resources table
| Reagent type (species) or resource | Designation | Source or reference | Identifiers | Additional information |
|---|---|---|---|---|
| Strain, strain background (Escherichia coli) | E. coli K-12 BW25113 | Yale Coli Genetic Stock Center | CGSC#: 7636 | |
| Strain, strain background (Escherichia coli) | BW25113 ΔnuoA | Dharmacon Keio | OEC4987-213603796 | |
| Strain, strain background (Escherichia coli) | BW25113 ΔnuoB | Dharmacon Keio | OEC4987-213603795 | |
| Strain, strain background (Escherichia coli) | BW25113 ΔnuoH | Dharmacon Keio | OEC4987-213603791 | |
| Strain, strain background (Escherichia coli) | BW25113 ΔnuoI | Dharmacon Keio | OEC4987-213603790 | |
| Strain, strain background (Escherichia coli) | BW25113 ΔatpA | Dharmacon Keio | OEC4987-213606163 | |
| Strain, strain background (Escherichia coli) | BW25113 ΔatpB | Dharmacon Keio | OEC4987-213606167 | |
| Strain, strain background (Escherichia coli) | BW25113 ΔatpC | Dharmacon Keio | OEC4987-213605824 | |
| Strain, strain background (Escherichia coli) | BW25113 ΔatpD | Dharmacon Keio | OEC4987-213605825 | |
| Strain, strain background (Escherichia coli) | BW25113 ΔatpE | Dharmacon Keio | OEC4987-213606166 | |
| Strain, strain background (Escherichia coli) | BW25113 ΔatpF | Dharmacon Keio | OEC4987-213606165 | |
| Strain, strain background (Escherichia coli) | BW25113 ΔatpG | Dharmacon Keio | OEC4987-213607977 | |
| Strain, strain background (Escherichia coli) | BW25113 ΔatpH | Dharmacon Keio | OEC4987-213606164 | |
| Strain, strain background (Escherichia coli) | E. coli DK8 1100∆(uncB-uncC)ilv::TnlO | Rubinstein lab (created in Guo et al., 2019) | DK8 | |
| Strain, strain background (Escherichia coli) | BL21(DE3) | Sigma-Aldrich | CMC0016 | Electrocompetent cells |
| Transfected construct (bacterial) | Plasmid: pKL09-GCaMP6f-mScarlet bb118 | This paper | Addgene #pending | GCaMP6-mScarlet |
| Transfected construct (bacterial) | Plasmid: pKL10-mRuby-iATPSnFR1.0 bb118 | This paper | Addgene # pending | mRuby-ATPSnfr |
| Transfected construct (bacterial) | Plasmid: pKL12-GCaMP pHuji bb118 | This paper | Addgene # pending | GCaMP6-pHuji |
| Transfected construct (bacterial) | Plasmid: pKL13-MgtC bb118 | This paper | Addgene # pending | S. typhimurium mgtC expression plasmid |
| Transfected construct (bacterial) | Plasmid: pKL11-GCaMP6f bb100 | This paper | Addgene # pending | GCaAMP6 |
| Chemical compound, drug | Glucose | Sigma | G7528-1KG | |
| Chemical compound, drug | M9 salts | Sigma | M6030 | |
| Chemical compound, drug | MEM amino acid | Gibco | 11130–051 | |
| Chemical compound, drug | Glutamate | Sigma | G1251 | |
| Chemical compound, drug | Hydrochloric acid | Sigma | 320331 | |
| Chemical compound, drug | Low melt agarose | VWR | 97064–134 | |
| Chemical compound, drug | Sodium hydroxide | Sigma | 795429 | |
| Chemical compound, drug | Kanamycin sulfate | Sigma | 60615–5G | |
| Chemical compound, drug | Gentamicin sulfate | Sigma | 345814 | |
| Chemical compound, drug | Apramycin | Sigma | A2024-1G | |
| Chemical compound, drug | Streptomycin sulfate | Sigma | S9137 | |
| Chemical compound, drug | Tobramycin | Sigma | 614005 | |
| Chemical compound, drug | Trimethoprim | Sigma | T7883 | |
| Chemical compound, drug | Cyclohexamide | Sigma | C7698 | |
| Chemical compound, drug | Chloramphenicol | Sigma | C1919 | |
| Chemical compound, drug | Erythromycin | Sigma | E5389 | |
| Chemical compound, drug | Potassium chloride | Sigma | P9333 | |
| Chemical compound, drug | Magnesium chloride | Sigma | 63068 | |
| Chemical compound, drug | CCCP | Sigma | C2759 | |
| Chemical compound, drug | Oxyrase for broth | Sigma | SAE0013 | |
| Chemical compound, drug | Texas Red-X, Succinimidyl Ester | Thermo-Fischer | T20175 | |
| Chemical compound, drug | N,N-Dimethylformamide | Sigma | 227056 | |
| Chemical compound, drug | Glutathione | Sigma | G4251 | |
| Chemical compound, drug | Ascorbic acid | Sigma | A7506 | |
| Chemical compound, drug | Propidium iodide | Life-tech | P3566 | |
| Chemical compound, drug | Tetramethylrhodamine, methyl ester | Molecular Probes | T668 | |
| Chemical compound, drug | DL-Dithiothreitol | Sigma | D9779 | |
| Chemical compound, drug | Lysozyme from chicken egg white | Sigma | 62971–10 G-F | |
| Chemical compound, drug | Magnesium chloride hexahydrate | Sigma | 63068–250G | |
| Chemical compound, drug | Sucrose | Sigma | 84097–1 KG | |
| Chemical compound, drug | Water, Sterile. WFI Quality | Sigma | 4.86505.1000 | |
| Chemical compound, drug | Sodium deoxycholate | Sigma | 30970–25G | |
| Chemical compound, drug | Ammonium chloride | Sigma | 09718–250G | |
| Chemical compound, drug | DiOC6(3) | Sigma | 318426–250 MG | |
| Software, algorithm | MATLAB | https://www.mathworks.com/products/matlab.html | RRID:SCR_001622 | |
| Software, algorithm | NIS Elements | https://www.microscope.healthcare.nikon.com/products/software/nis-elements | RRID:SCR_002776 |
Additional files
Download links
A two-part list of links to download the article, or parts of the article, in various formats.
Downloads (link to download the article as PDF)
Open citations (links to open the citations from this article in various online reference manager services)
Cite this article (links to download the citations from this article in formats compatible with various reference manager tools)
Membrane voltage dysregulation driven by metabolic dysfunction underlies bactericidal activity of aminoglycosides
eLife 9:e58706.
https://doi.org/10.7554/eLife.58706


