Does the human placenta express the canonical cell entry mediators for SARS-CoV-2?
- Perinatology Research Branch, Divisionof Obstetrics and Maternal-Fetal Medicine, Division of Intramural Research, Eunice Kennedy Shriver National Institute of Child Health and Human Development, National Institutes of Health, U.S. Department of Health and Human Services, United States
- Center for MolecularMedicine and Genetics, Wayne State University School of Medicine, United States
- Department ofObstetrics and Gynecology, Wayne State University School of Medicine, United States
- Department of Obstetrics and Gynecology, University of Michigan, United States
- Department of Epidemiology and Biostatistics, Michigan State University, United States
- Detroit Medical Center, United States
- Department of Obstetrics and Gynecology, Florida International University, United States
- Department of Computer Science, Wayne State University College of Engineering, United States
- Department of Physiology, Wayne State University School of Medicine, United States
- Department of Biochemistry, Microbiology and Immunology, Wayne State University School of Medicine, United States
Figures
Figure 1 with 1 supplement
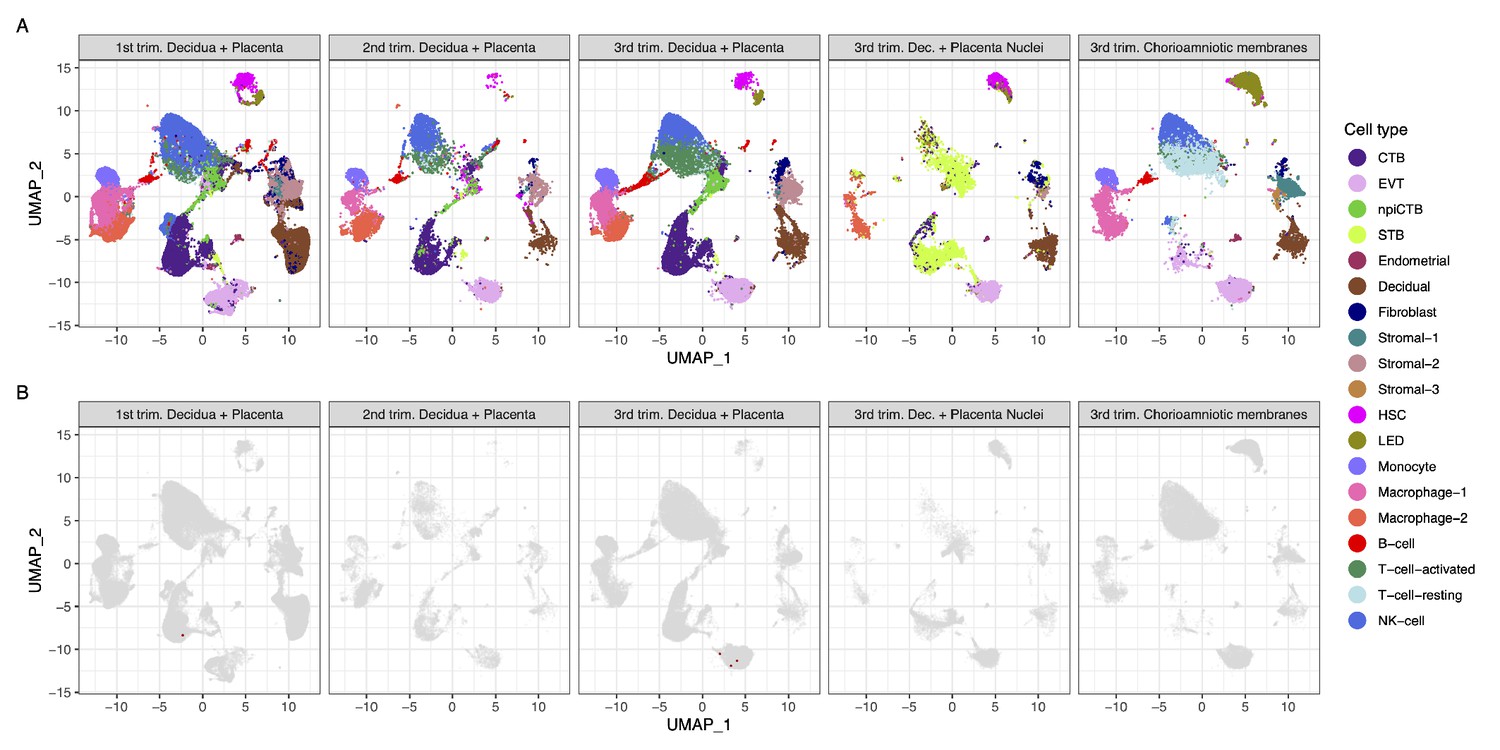
Transcriptional map of the human placenta, including the decidua, in the three trimesters of pregnancy.
(A) Uniform Manifold Approximation Plot (UMAP), where dots represent single cells/nuclei and are colored by cell type (abbreviations used are: STB, Syncytiotrophoblast; EVT, Extravillous trophoblast; CTB, cytotrophoblast; HSC, hematopoietic stem cell; npiCTB, non-proliferative interstitial cytotrophoblast; LED, lymphoid endothelial decidual cell) (B) UMAP plot with cells/nuclei co-expressing one or more transcripts for ACE2 and TMPRSS2, genes that are necessary for SARS-CoV-2 viral infection and spreading, in red.
Figure 1—figure supplement 1
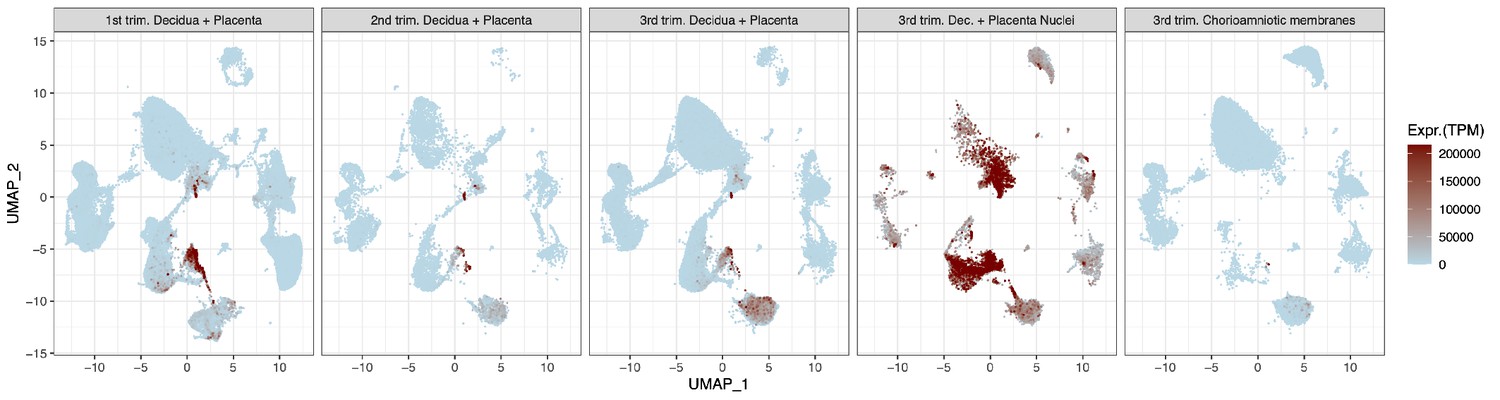
UMAP highlighting cells expressing syncytiotrophoblast genes CGA + CSH1 + GH2 that are more efficiently captured when isolating nuclei in snRNA-seq.
Uniform Manifold Approximation Plot (UMAP), where dots represent single cells/nuclei and are colored the combined gene expression of CGA + CSH1 + GH2 and normalized to transcripts per million per cell.
Figure 2 with 2 supplements
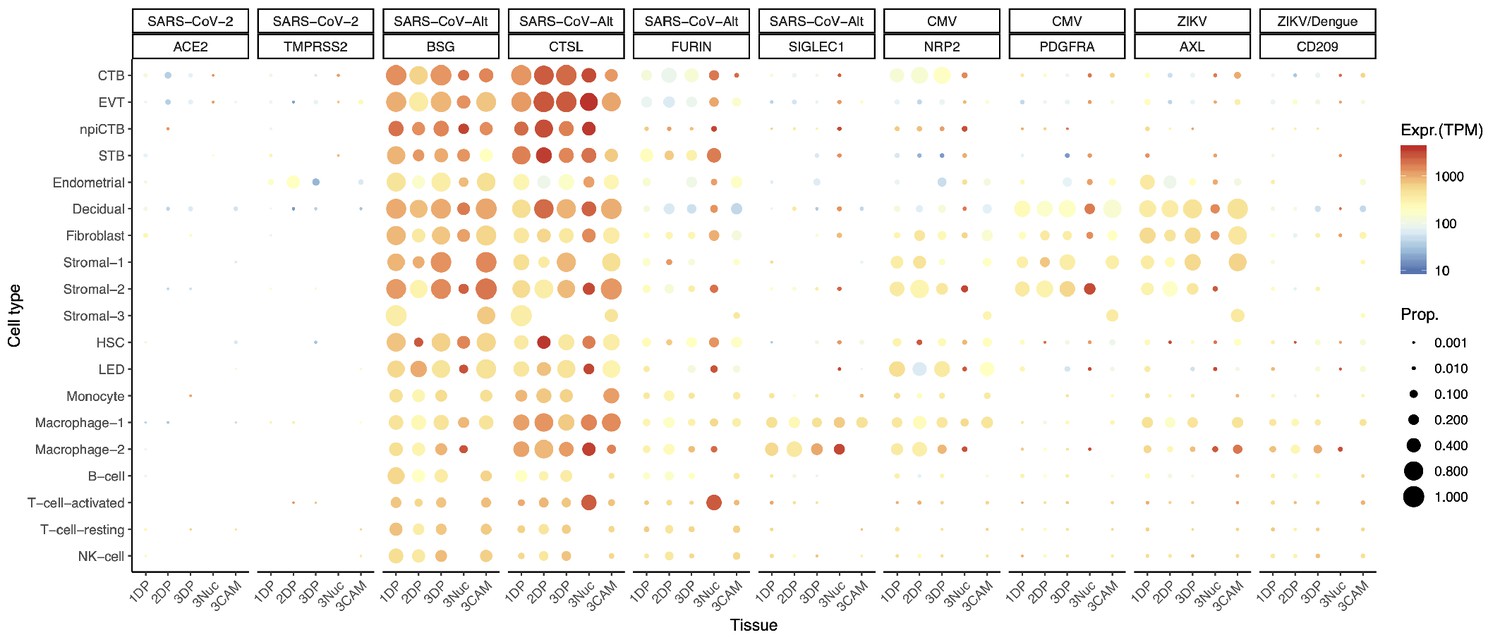
Dot plot depicting the expression of different viral receptors/molecules used by SARS-CoV-2, CMV, and ZIKV.
Each row represents a different cell type, and columns are grouped first by virus type, receptor/molecule gene, and placental tissue/time-of sampling (1DP, 2DP and 3DP represent the first, second, and third trimester, 3Nuc represents the third trimester nuclei, and 3CAM represents the third trimester chorioamniotic membranes). The size of the dot represents the proportion of cells that express the receptor with more than zero transcripts, and the color represents the average gene expression for the subset of cells expressing that gene in transcripts per million (TPM). Cell type abbreviations used are: STB, Syncytiotrophoblast; EVT, Extravillous trophoblast; CTB, cytotrophoblast; HSC, hematopoietic stem cell; npiCTB, non-proliferative interstitial cytotrophoblast; LED, lymphoid endothelial decidual cell.
Figure 2—figure supplement 1
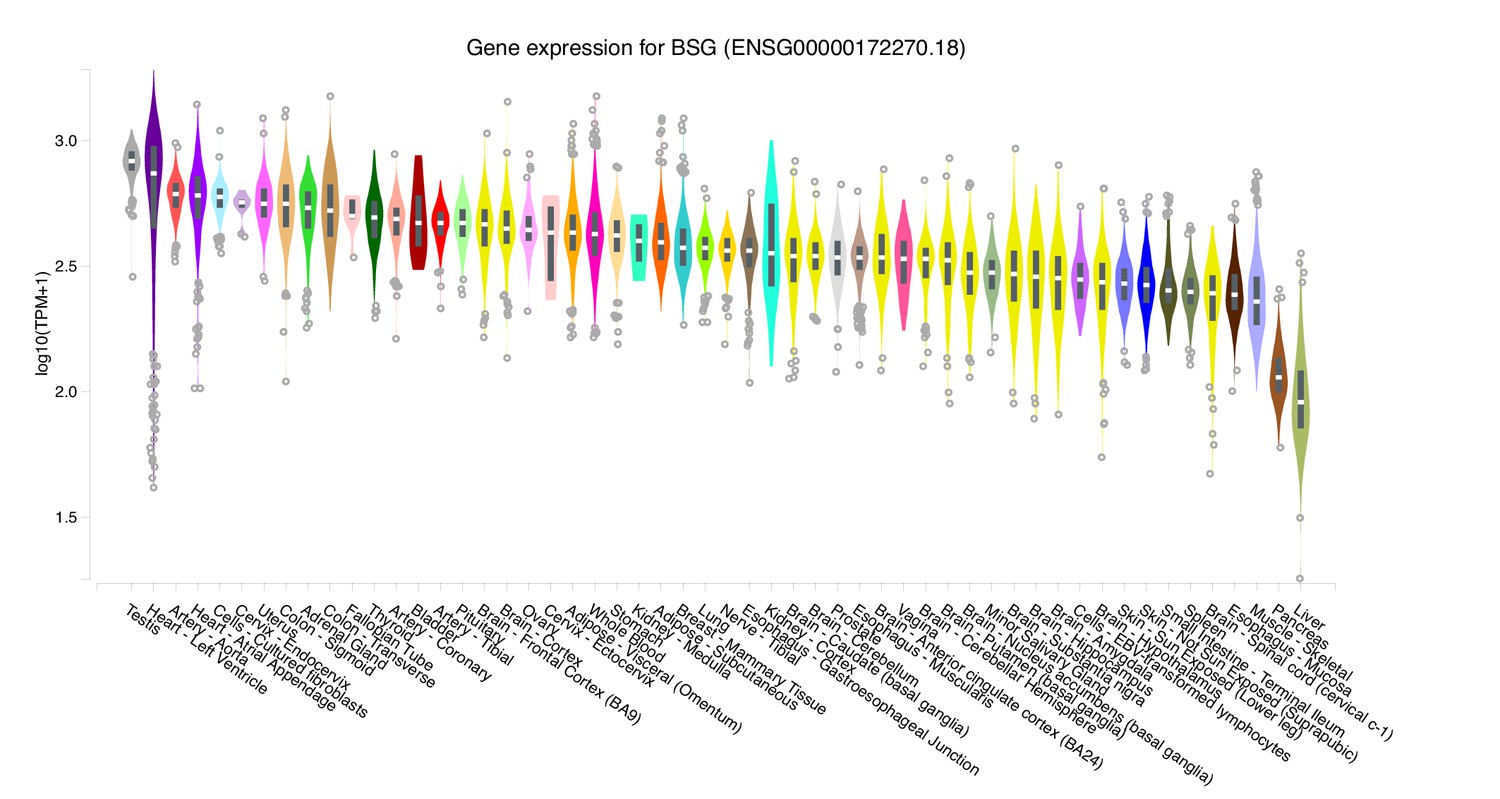
Gene expression values for BSG across tissues collected by the GTEx project.
For each tissue, a violin plot and a boxplot describe the variation in gene expression levels for BSG across all of the samples collected by the project sorted left to right by median gene expression (plot generated through the GTEx portal).
Figure 2—figure supplement 2
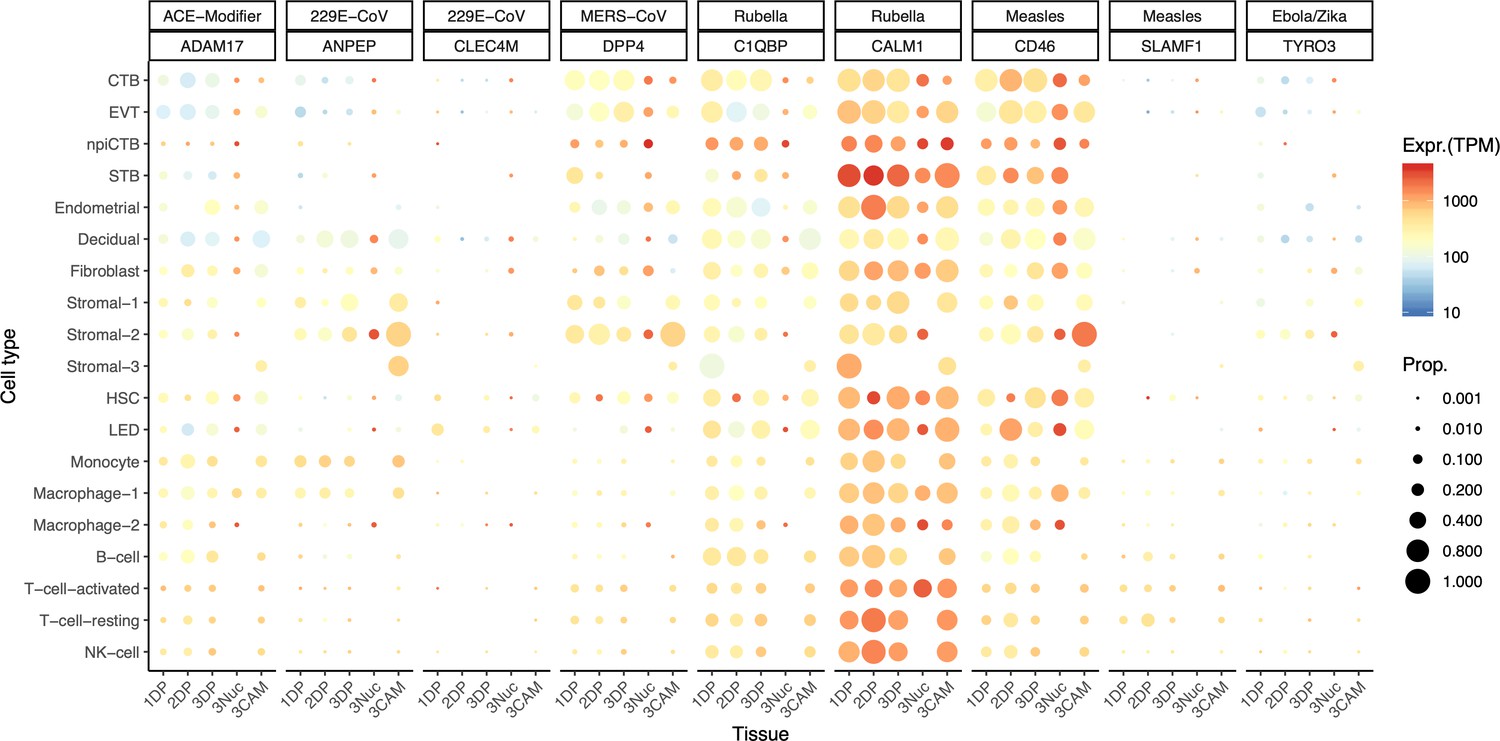
Dot plot depicting the expression of different viral receptors/molecules used by virus that caused congenital infection.
Each row represents a different cell type, and columns are grouped first by virus type, receptor/molecule gene, and placental tissue/time-of sampling (1DP, 2DP and 3DP represent the first, second and third trimester, 3Nuc represents the third trimester nuclei, and 3CAM represents the third trimester chorioamniotic membranes). The size of the dot represents the proportion of cells that express the receptor with more than zero transcripts, and the color represents the average gene expression for the subset of cells expressing that gene in transcripts per million (TPM). Cell type abbreviations used are: STB, Syncytiotrophoblast; EVT, Extravillous trophoblast; CTB, cytotrophoblast; HSC, hematopoietic stem cell; npiCTB, non-proliferative interstitial cytotrophoblast; LED, lymphoid endothelial decidual cell.
Additional files
-
Supplementary file 1
Summary of all the single cell resources analyzed using existing and new data.
- https://cdn.elifesciences.org/articles/58716/elife-58716-supp1-v2.xls
-
Supplementary file 2
Clinical and demographic characteristics of the study population from which placental samples were collected for snRNAseq studies.
- https://cdn.elifesciences.org/articles/58716/elife-58716-supp2-v2.docx
-
Supplementary file 3
Bulk gene expression data analysis of ACE2 and TMPRSS2 in the placental tissues.
- https://cdn.elifesciences.org/articles/58716/elife-58716-supp3-v2.docx
-
Transparent reporting form
- https://cdn.elifesciences.org/articles/58716/elife-58716-transrepform-v2.docx
Download links
A two-part list of links to download the article, or parts of the article, in various formats.
Downloads (link to download the article as PDF)
Open citations (links to open the citations from this article in various online reference manager services)
Cite this article (links to download the citations from this article in formats compatible with various reference manager tools)
Does the human placenta express the canonical cell entry mediators for SARS-CoV-2?
eLife 9:e58716.
https://doi.org/10.7554/eLife.58716


