Social dominance mediates behavioral adaptation to chronic stress in a sex-specific manner
- Department of Stress Neurobiology and Neurogenetics, Max Planck Institute of Psychiatry, Germany
- International Max Planck Research School for Translational Psychiatry (IMPRS-TP), Germany
- Department of Neurobiology, Weizmann Institute of Science, Israel
Figures
Figure 1 with 2 supplements
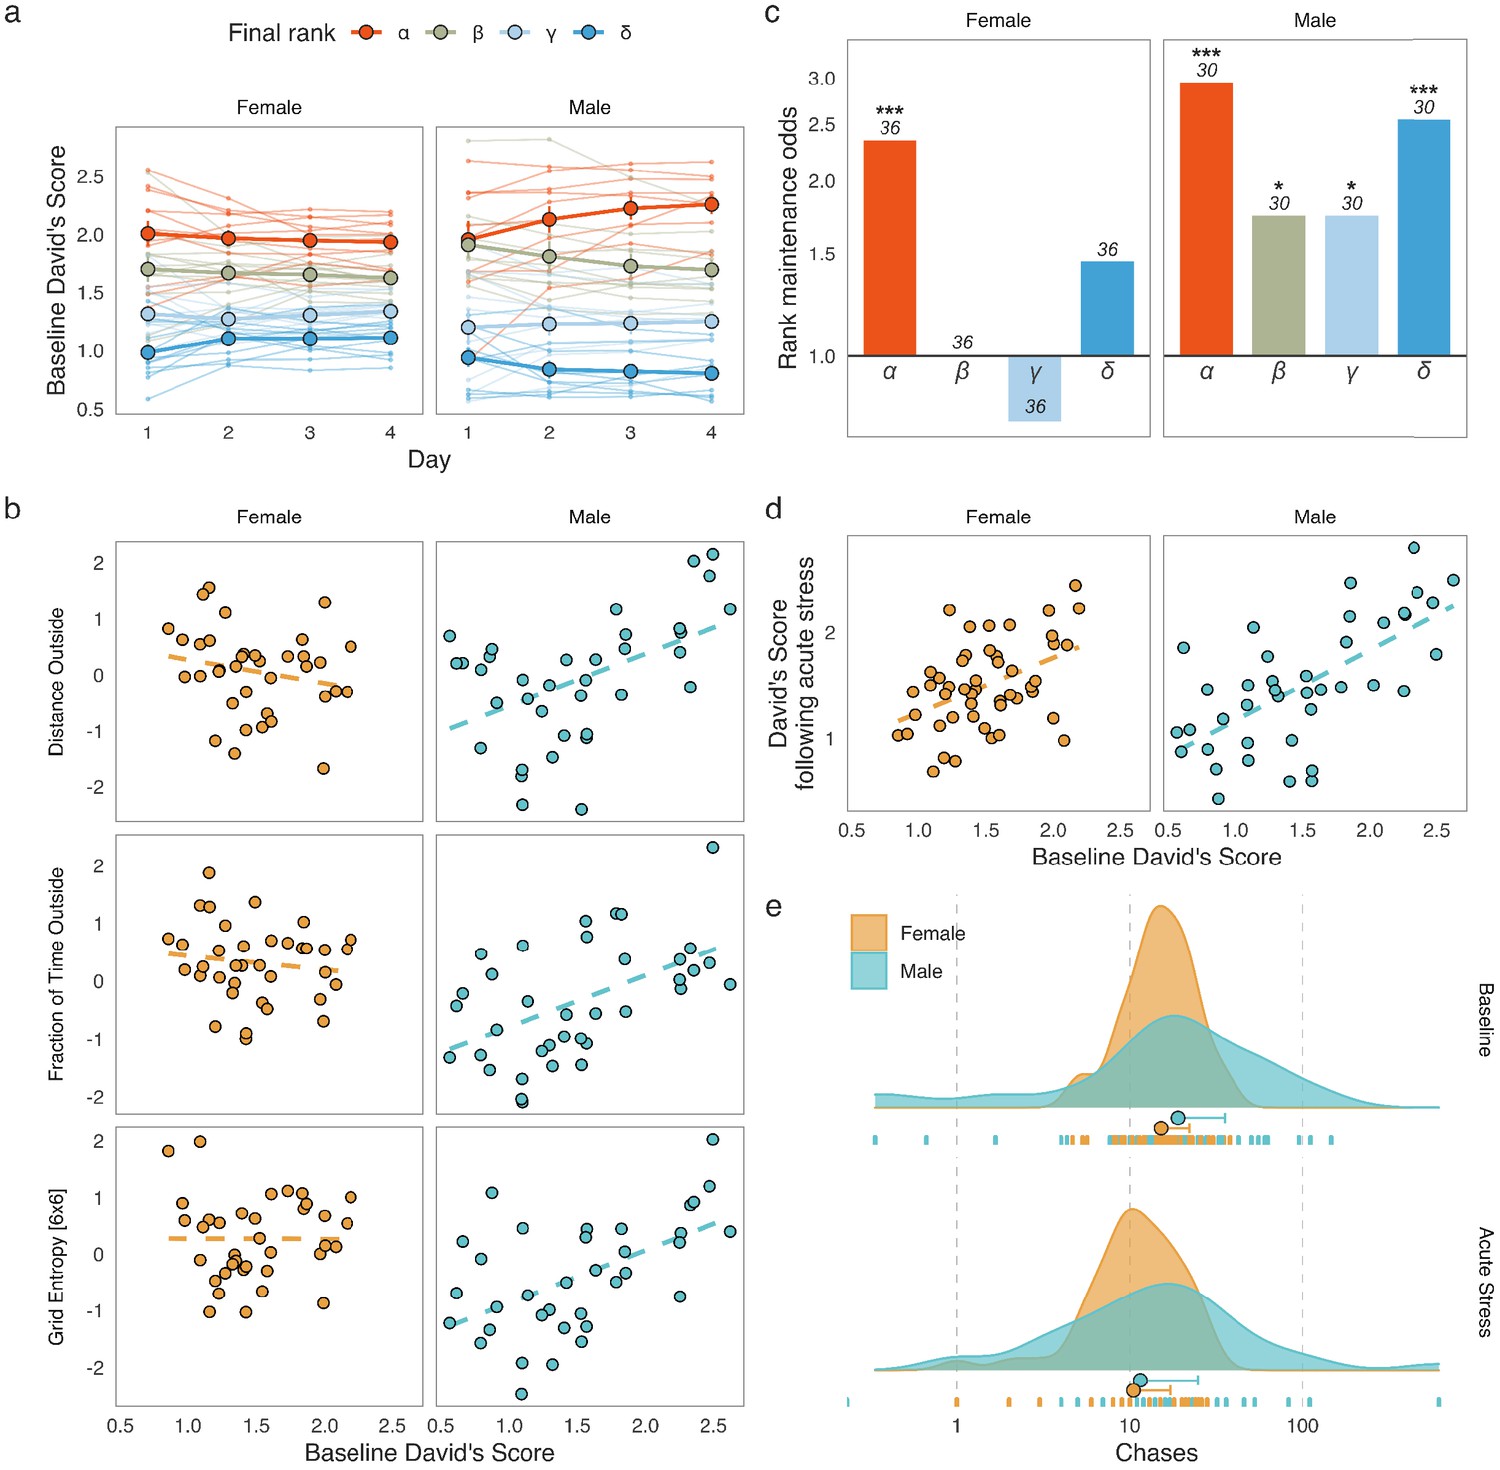
Social dominance hierarchies in males and females.
(a) David’s Scores (DS) based on chases during the four baseline days of Social Box (SB) assessment show relatively stable social hierarchies in both male and female groups (each line represents an individual, colors represent the cumulative social rank on day 4, points are mean values for each rank ± standard error of the mean). (b) Male-specific associations between social dominance scores and behaviors related to locomotion and exploration. Dominant males had increased overall locomotion, spend more time outside the nest, and moved through the SB environment in a more unpredictable manner. These associations were not found in females. (c) Rank maintenance odds over the four-day baseline period. Depicted are odds of maintaining the same rank between consecutive days relative to chance-level (25%). Data is summarized according to the cumulative social rank on day 4; numbers indicate the number of individuals per rank. (d) Baseline DS predicts DS following acute restraint stress in both sexes, indicating that social dominance hierarchies may be relatively robust against acute stress. (e) Numbers of chases in male and female groups at baseline as well as following acute restraint stress. Both sexes display significantly fewer chases following an acute physiological stressor. The x-axis shows the absolute number of chases between pairs of mice. Dot: median, whisker: 1.5 x IQR.
Figure 1—figure supplement 1
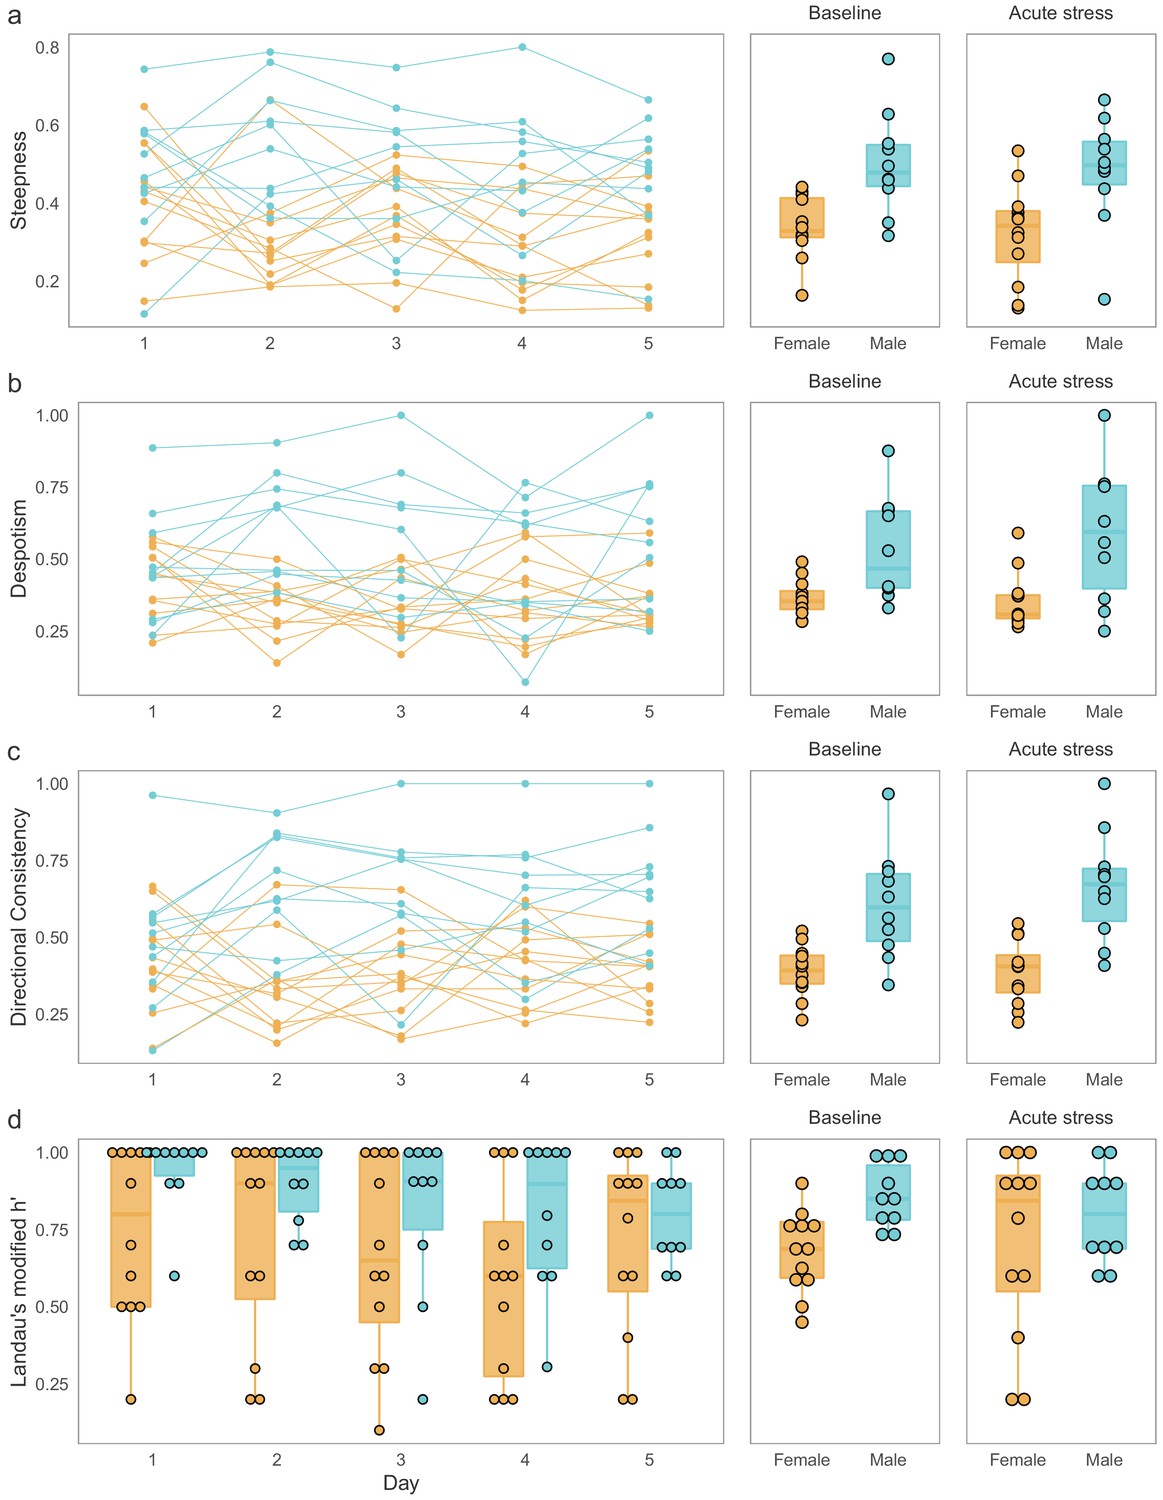
Social hierarchy properties in male and female groups.
(a–d) The following properties of social hierarchies were computed for each group of mice: steepness, despotism, directional consistency, and Landau’s modified h’. Male groups had overall higher scores for steepness (F(1, 20) = 12.6, p = 0.00201), despotism (F(1, 20) = 10.84, p = 0.00364, note: variances were heterogenous between conditions), and directional consistency (F(1, 20) = 21.16, p = 1.73×10⁻⁴). Means of Landau’s modified h’ over the baseline days also differed between the sexes (KW test: χ2(1) = 8.2458, p = 0.0041). None of the measures showed evidence of a sex x acute stress interaction. All tests are based on n = 22 groups (10 males, 12 females).
Figure 1—figure supplement 2

Associations between David’s Scores (DS) and other behaviors measured in the Social Box (SB).
Depicted are cumulative baseline David’s Score correlations with batch-adjusted inverse rank-transformed readouts from the SB (averages of each behavioral readout for SB days 2–4). Only behaviors that are not used for building the DS directly and only correlations with a q-value < 0.05 following multiple testing correction are displayed (Benjamini-Hochberg adjustment within each sex, for a full list of the behavioral readouts tested here, see Materials and methods). DS show relatively similar correlation patterns with other behaviors between the sexes, indicating that social dominance status may have largely similar effects on overall behavior for each sex. Nevertheless, several behavioral readouts, including Distance Outside, Entropy/Grid Entropy [6 × 6], and Fraction of Time Outside show associations with David’s Scores in males that are conspicuously absent in females (Figure 1c).
Figure 2
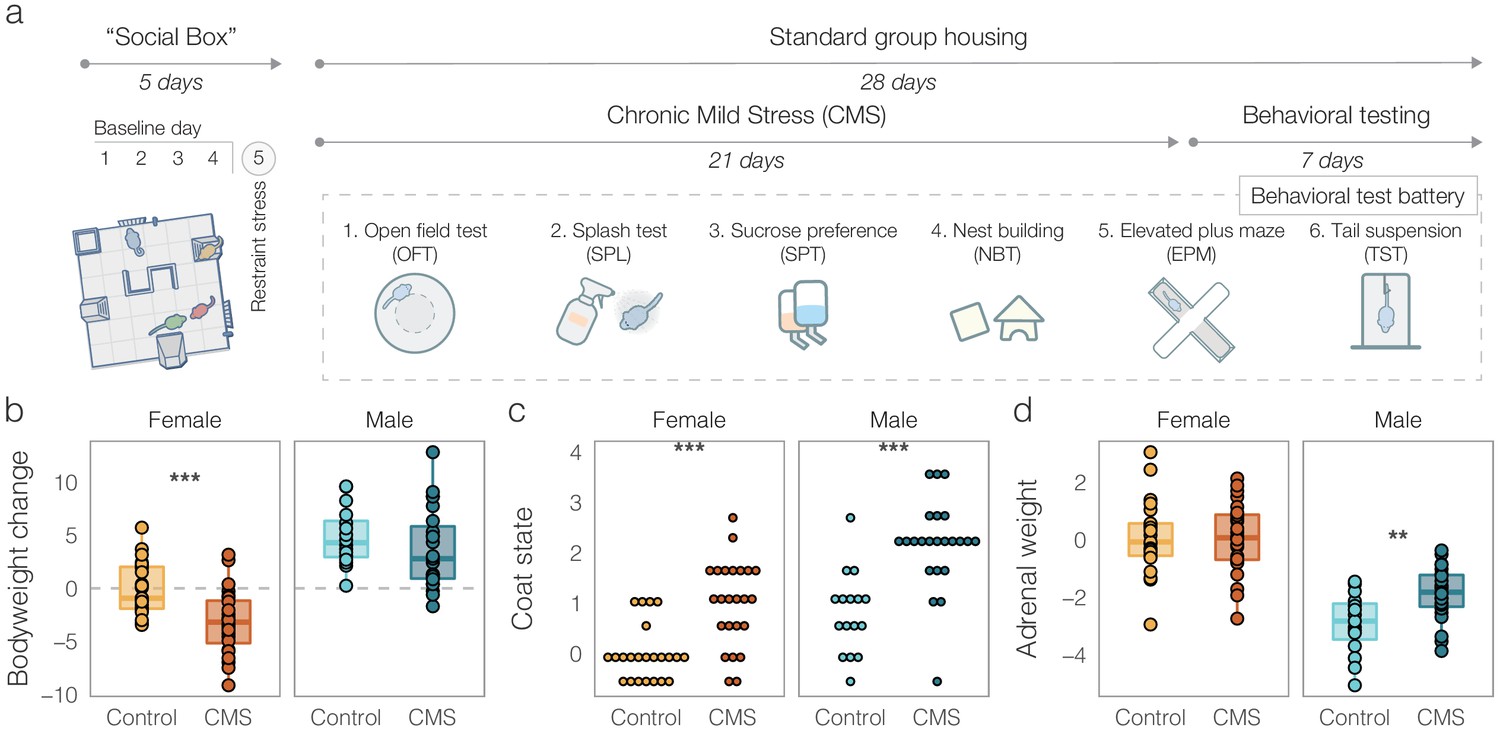
Outcomes of chronic mild stress (CMS) in males and females.
(a) Experimental timeline. All groups underwent five days of Social Box (SB) monitoring. This consisted of four days of baseline monitoring followed by a 15-min acute restraint stress for all individuals prior to being re-introduced into the SB for a final 12-h dark phase monitoring period (day 5). After the SB, groups received three weeks of either control treatment (bodyweight and fur quality assessments two times a week) or CMS (see Materials and methods for details). The following week, all groups underwent a behavioral test battery in the order depicted. (b) Batch-adjusted bodyweight change following three weeks of CMS. Both male and female CMS mice showed significantly reduced weight compared to controls. (c) Batch-adjusted coat state scores (higher means poorer fur quality) following CMS. Male and female CMS groups showed significant deterioration of their coat. (d) Batch- and initial bodyweight-adjusted adrenal weights. CMS increased adrenal size in males, but not in females. Boxplots: line – median, box limits – 1st and 3rd quartile, whiskers – 1.5 x IQR. Data is presented relative to female controls. Number of mice per condition: Female Control = 23, Female CMS = 24, Male Control = 16, Male CMS = 23. (*p < 0.05, **p < 0.01, ***p < 0.001).
Figure 3 with 2 supplements
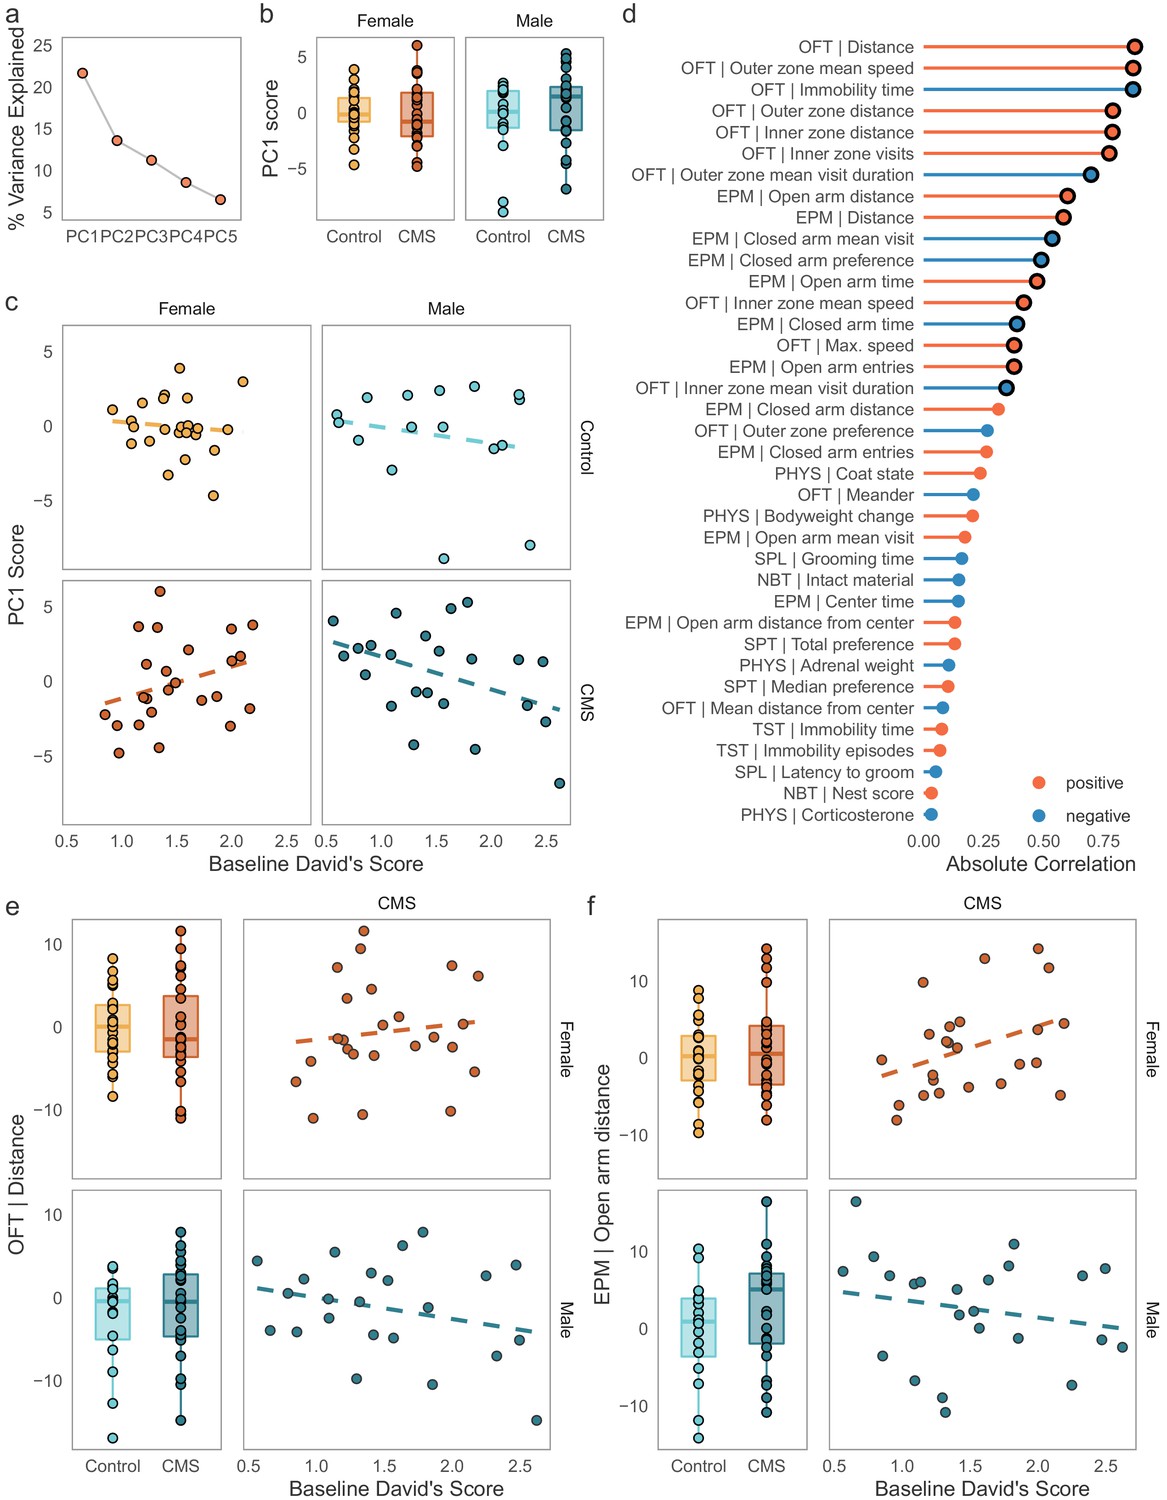
Opposing effects of baseline social dominance scores on behavioral outcomes following CMS.
(a) Percentage of variance explained by the first five components of a principal components analysis conducted on the batch-adjusted behavioral and physiological outcome data. PC1 explains ca. 21% of the variance in this dataset. (b) PC1 is not significantly different between sexes or conditions, indicating that this component did not capture variance associated with either variable. (c) Association between baseline David’s Scores and PC1 in control and CMS individuals. Baseline dominance predicted scores on PC1, the major source of variance in the outcome data, in a sex-specific manner in the CMS group, but not in the control group. (d) Spearman’s rank correlations between PC1 and the physiological and behavioral outcome variables. The strongest associations for PC1 are variables derived from the open field test (OFT) and elevated plus maze (EPM). Black circles around points identify associations significant at p < 0.05 after adjustment for multiple testing (Bonferroni correction). (e-f) Examples of interactions between baseline dominance and sex on CMS behavioral outcomes. Males and females show significant opposite correlations between dominance and example of locomotion and anxiety-like behavior. (Boxplots: line – median, box limits – 1st and 3rd quartile, whiskers – 1.5 x IQR. Scales for behavioral outcomes are relative to female controls).
Figure 3—figure supplement 1
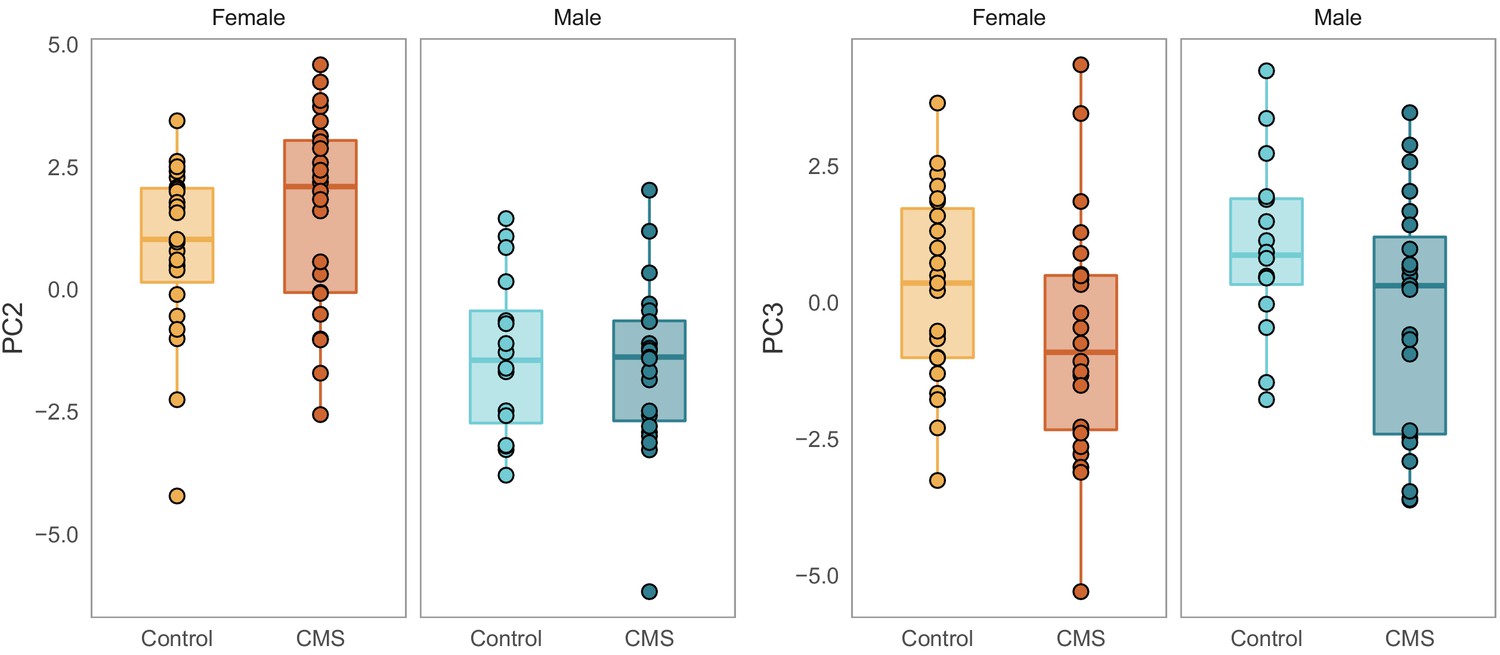
PC2 and PC3 capture variance associated with sex and condition.
Depicted are scores for two further principal components from the analysis described in Figure 3. Individual scores on PC2 (13.6% variance explained) differ between the sexes (F(1, 82) = 48.269, p = 8.1×10⁻¹⁰), while PC3 (11.2% variance explained) captures the effect of chronic mild stress (CMS, F(1, 82) = 5.92, p = 0.0171).
Figure 3—figure supplement 2
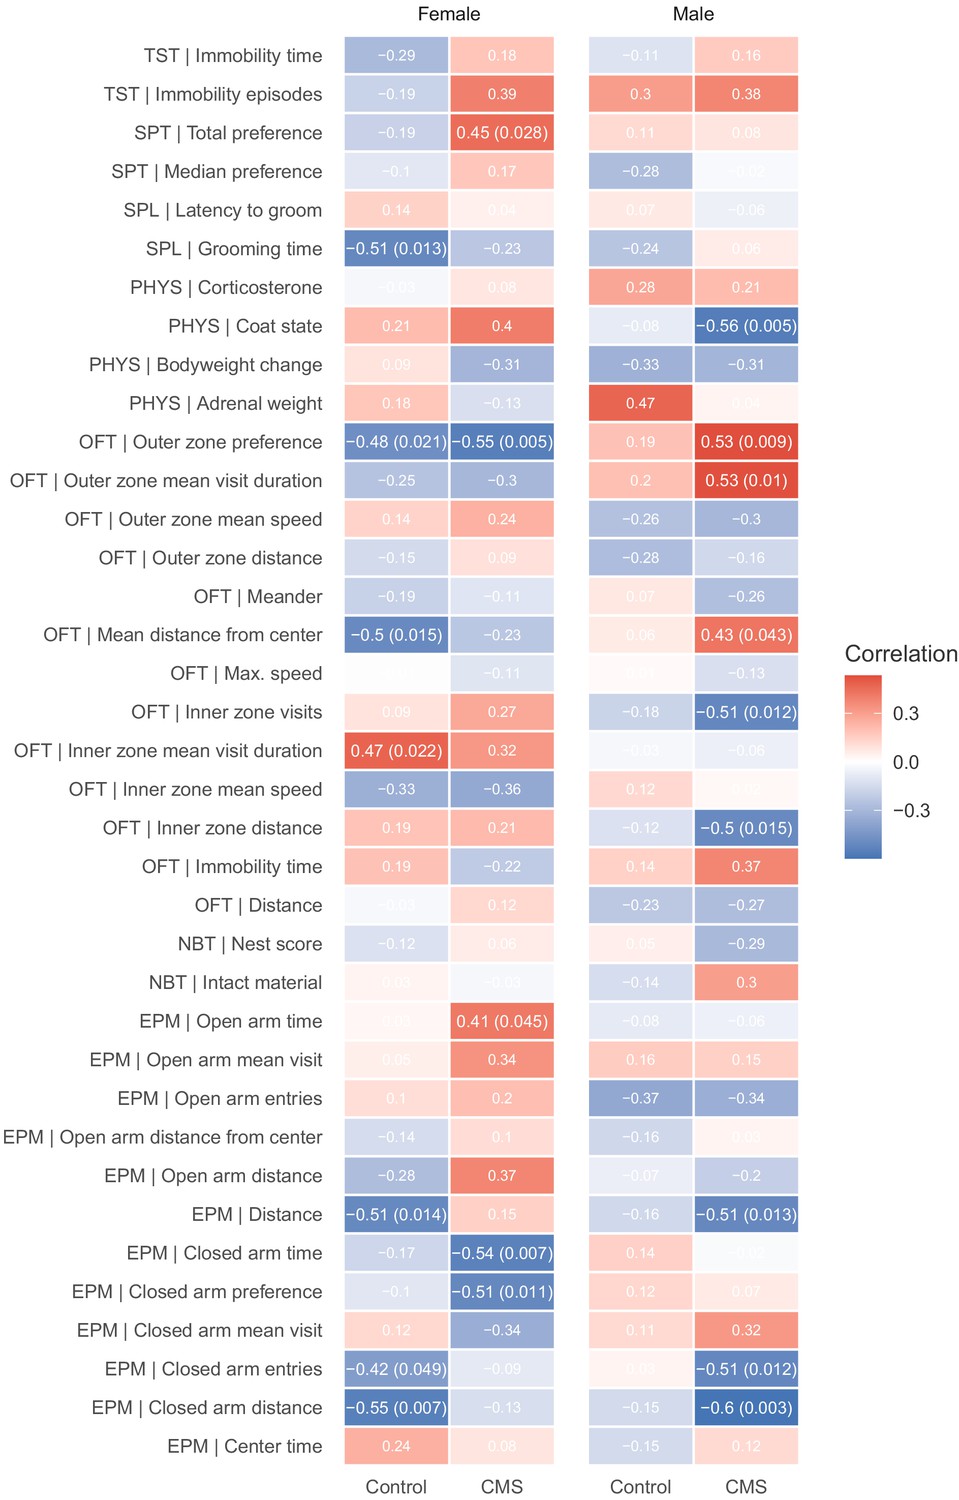
Correlations between behaviors and baseline dominance scores.
Pearson’s product-moment correlations between David’s Scores and behavioral outcomes within each sex and condition. Each cell contains the correlation estimate with p-values for nominally significant correlations (p-value < 0.05) shown in parentheses.
Tables
Key resources table
| Reagent type (species) or resource | Designation | Source or reference | Identifiers | Additional information |
|---|---|---|---|---|
| Commercial assay or kit | Corticosterone Double Antibody RIA Kit | MP Biomedicals | SKU 0712010-CF | |
| Software, algorithm | Tidyverse, ecosystem of packages | R Core Development Team, 2013 doi:10.21105/joss.01686 | R version 4.0.2 | |
| Software, algorithm | ‘RNOmni R package | McCaw, 2019 | v 0.7.1 | R version 4.0.2 |
| Software, algorithm | ‘cowplot’ R package | Wilke, 2019 | v 1.0.0 | R version 4.0.2 |
| Software, algorithm | ‘compete’ R package | Curley et al., 2015 | v 0.1 | R version 4.0.2 |
| Software, algorithm | ‘steepness’ R package | Leiva and de Vries, 2014 | v 0.2–2 | R version 4.0.2 |
Additional files
Download links
A two-part list of links to download the article, or parts of the article, in various formats.
Downloads (link to download the article as PDF)
Open citations (links to open the citations from this article in various online reference manager services)
Cite this article (links to download the citations from this article in formats compatible with various reference manager tools)
Social dominance mediates behavioral adaptation to chronic stress in a sex-specific manner
eLife 9:e58723.
https://doi.org/10.7554/eLife.58723


