Alterations of specific cortical GABAergic circuits underlie abnormal network activity in a mouse model of Down syndrome
- Institut du Cerveau (ICM), CNRS UMR 7225 – Inserm U1127, Sorbonne Université, France
Figures
Figure 1 with 3 supplements
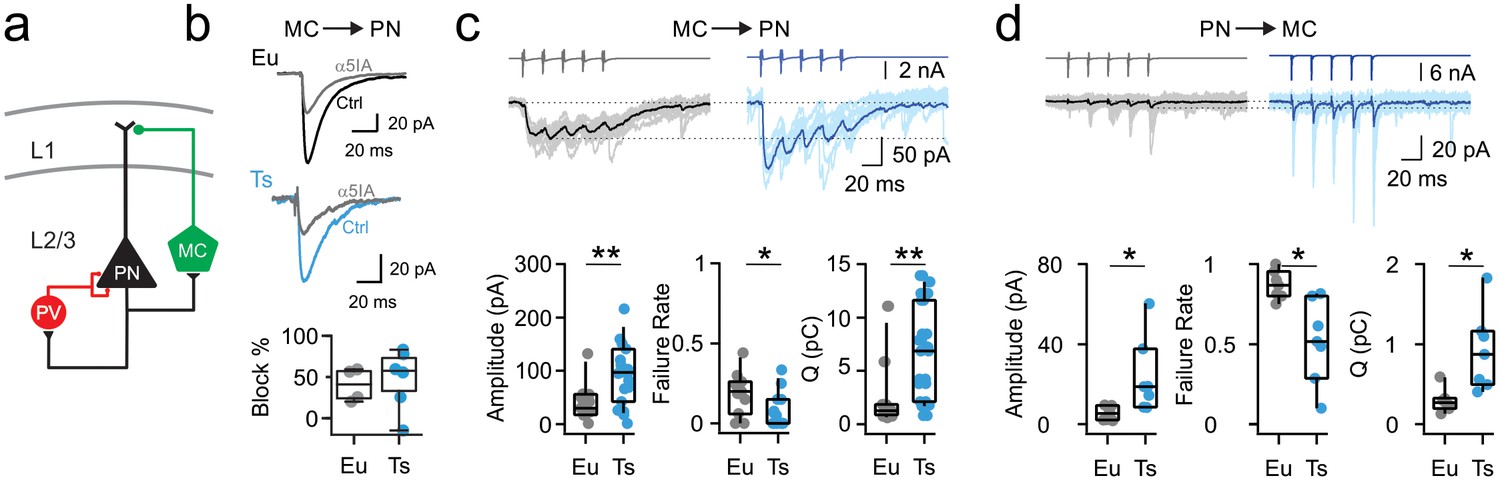
Synaptic enhancement of dendritic inhibition in DS.
(a) Schematic of cortical inhibitory circuits involving PV interneurons, MCs and PNs. (b) Representative voltage-clamp current traces of uIPSCs recorded in MC-PN connected pair in a Eu (top) and a Ts (bottom) mouse, before (Ctrl) and after (α5IA) application of the α5-GABAAR inverse agonist α5IA (100 nM). Shown are averages of 50 traces. Right, bottom: population data of uIPSC amplitude block by α5IA in Eu and Ts mice. (c) Top: Representative traces of uIPSCs (lower traces) elicited by a train of 5 presynaptic action currents (50 Hz) in the MC (upper traces). Eu: individual (gray) and average (black) traces; Ts: individual (light blue) and average (blue) traces. Bottom panels: population data of uIPSC amplitude (p=0.0094, Mann-Whitney U-test), failure rate of the postsynaptic response evoked by the first action potential of the train (p=0.0201, Mann-Whitney U-test) and total charge, transferred during the 5 APs train (Q, p=0.006, Mann-Whitney U-test; n = 11 and 15 pairs for Eu and Ts, respectively). (d) Same as in c, but for glutamatergic uEPSCs triggered by action currents in presynaptic PNs and recorded in postsynaptic MCs (Amplitude: p=0.0398, Mann-Whitney U-test; Failure Rate: p=0.0107, Mann-Whitney U-test; Q: p=0.0157, Students T-test; n = 7 for both, Eu and Ts).
-
Figure 1—source data 1
Synaptic properties of the dendritic inhibitory loop.
- https://cdn.elifesciences.org/articles/58731/elife-58731-fig1-data1-v2.xlsx
Figure 1—figure supplement 1
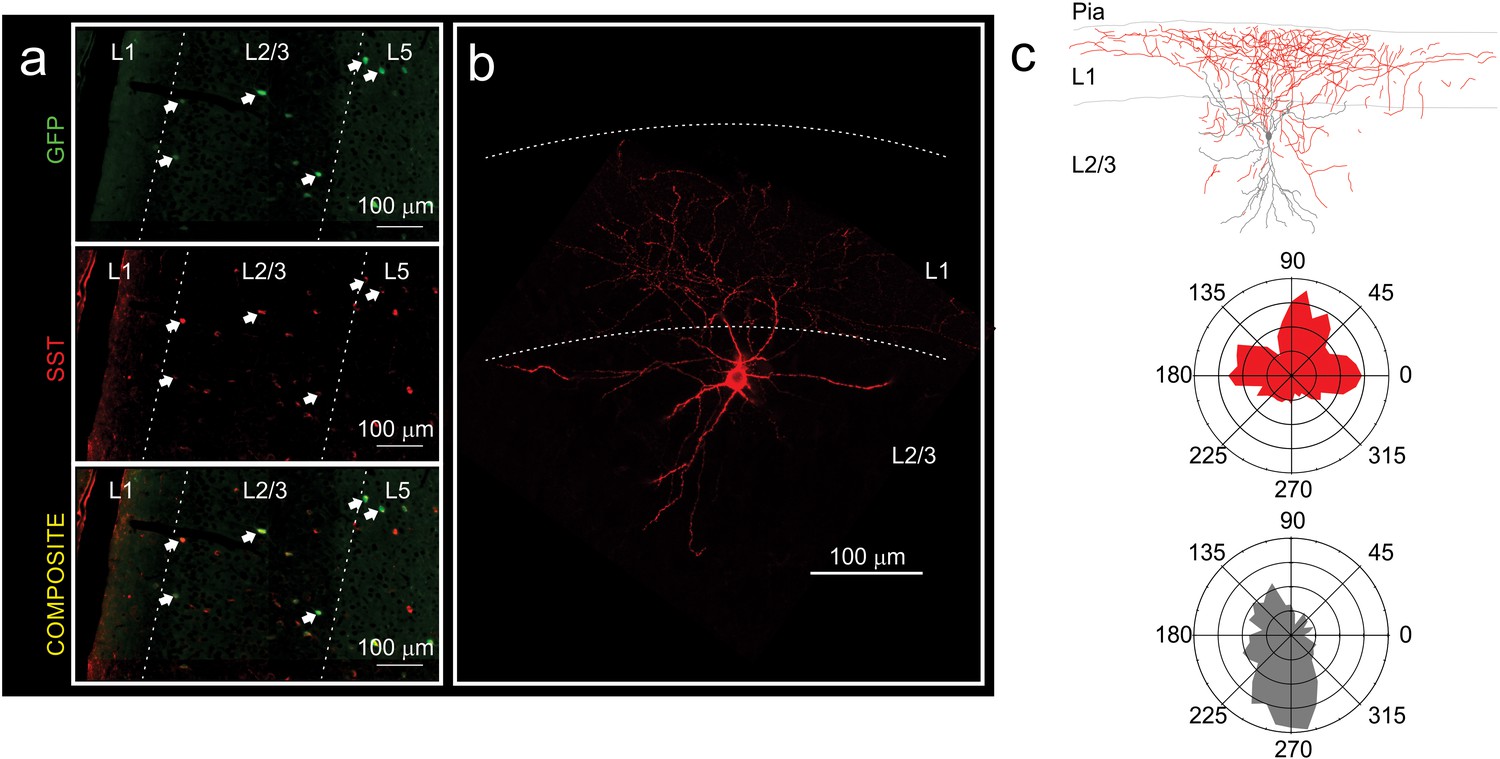
GFP positive interneurons in the prefrontal cortex of Ts::X98 mice are Martinotti cells.
(a) Immunostaining using anti-GFP (green) and anti-SST (red) antibodies in the mPFC. Note the co-localization of both markers. Arrows point to GFP and SST. (b) Biocytin-filled GFP-positive interneuron revealed with Texas-red coupled to streptavidin. Note the wide extension of the axonal plexus of Ts::X98 GFP-positive neurons in layer 1, typical of Martinotti cells. (c) Top: Reconstructed morphology of the biocytin-filled cell of b and bottom: the polar histograms of its axonal (blue) and dendritic (pink) densities.
Figure 1—figure supplement 2
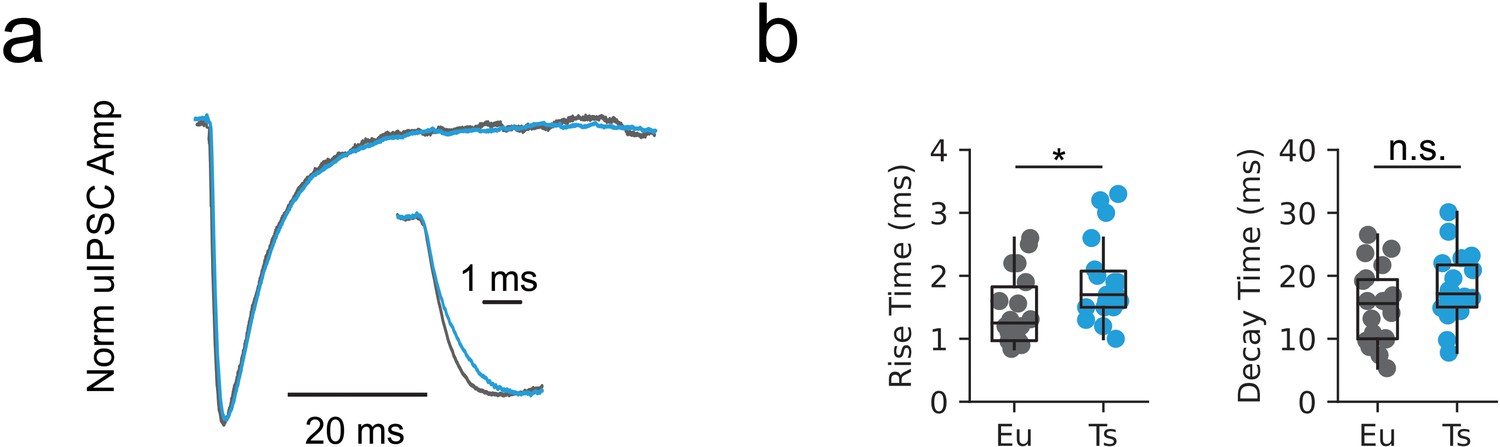
Abnormal IPSC kinetics in DS.
(a) Representative unitary inhibitory synaptic currents recorded at the MC to PN synapse. Inset: detail of the rise phase. (b) Population data of the rise time (left, p=0.02448, Mann-Whitney U test) and decay time (right, p=0.1488, Mann-Whitney U test, n = 18 and 18 for Eu and Ts, respectively).
-
Figure 1—figure supplement 2—source data 1
MC to PN synapse kinetics.
- https://cdn.elifesciences.org/articles/58731/elife-58731-fig1-figsupp2-data1-v2.xlsx
Figure 1—figure supplement 3
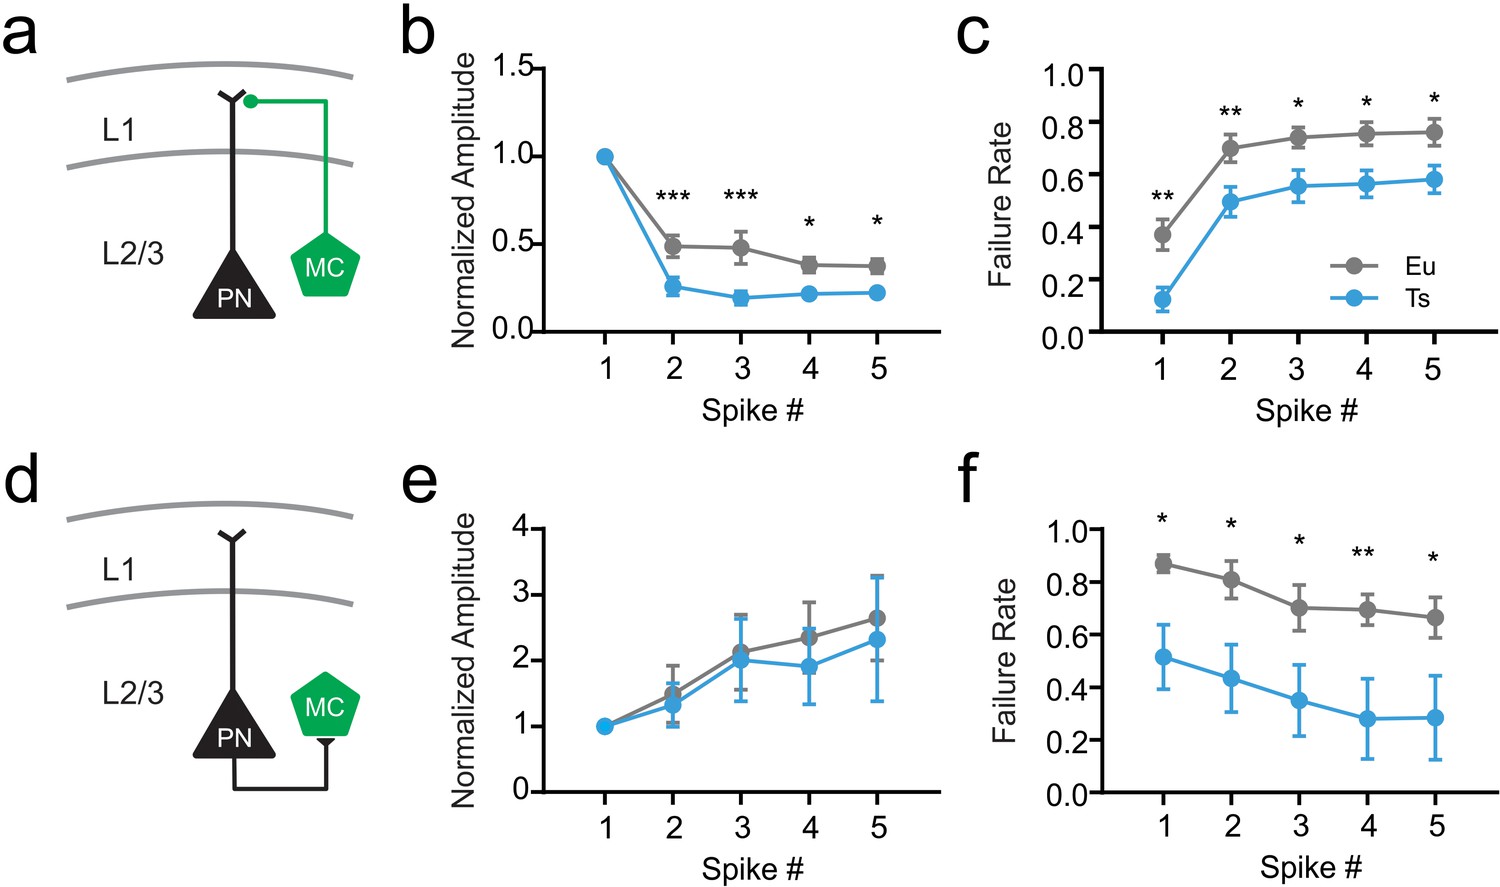
Short term plasticity of the dendritic inhibitory loop in Ts.
(a) Schematic representation of the inhibitory synapse of the cortical dendritic inhibitory loop mediated by MCs. (b) Normalized amplitude of IPSCs evoked by a 5-AP train applied at 50 Hz to the presynaptic MC (Two-Way ANOVA genotype factor: F(1, 150)=4.298, p=0.0399). (c) Failure rate of synaptic responses evoked by each AP of the train (Two-Way ANOVA genotype factor: F(1,140)=35.28, p<0.0001, n = 13 and 17 pairs for Eu and Ts, respectively). (d) Schematic representation of the excitatory synapse between PN and MCs. (e) Normalized amplitude of EPSCs evoked by a 5-AP train applied at 50 Hz to the presynaptic PN (Two-Way ANOVA genotype factor: F(1,11)=0.1205, p=0.7350). (f) Failure rate of synaptic responses evoked by each AP of the train (Two-Way ANOVA genotype factor: F(1,11)=7.396, p=0.0200, n = 7 and 6 pairs for Eu and Ts, respectively).
-
Figure 1—figure supplement 3—source data 1
Short term plasticity of the dendritic inhibitory loop.
- https://cdn.elifesciences.org/articles/58731/elife-58731-fig1-figsupp3-data1-v2.xlsx
Figure 2 with 3 supplements
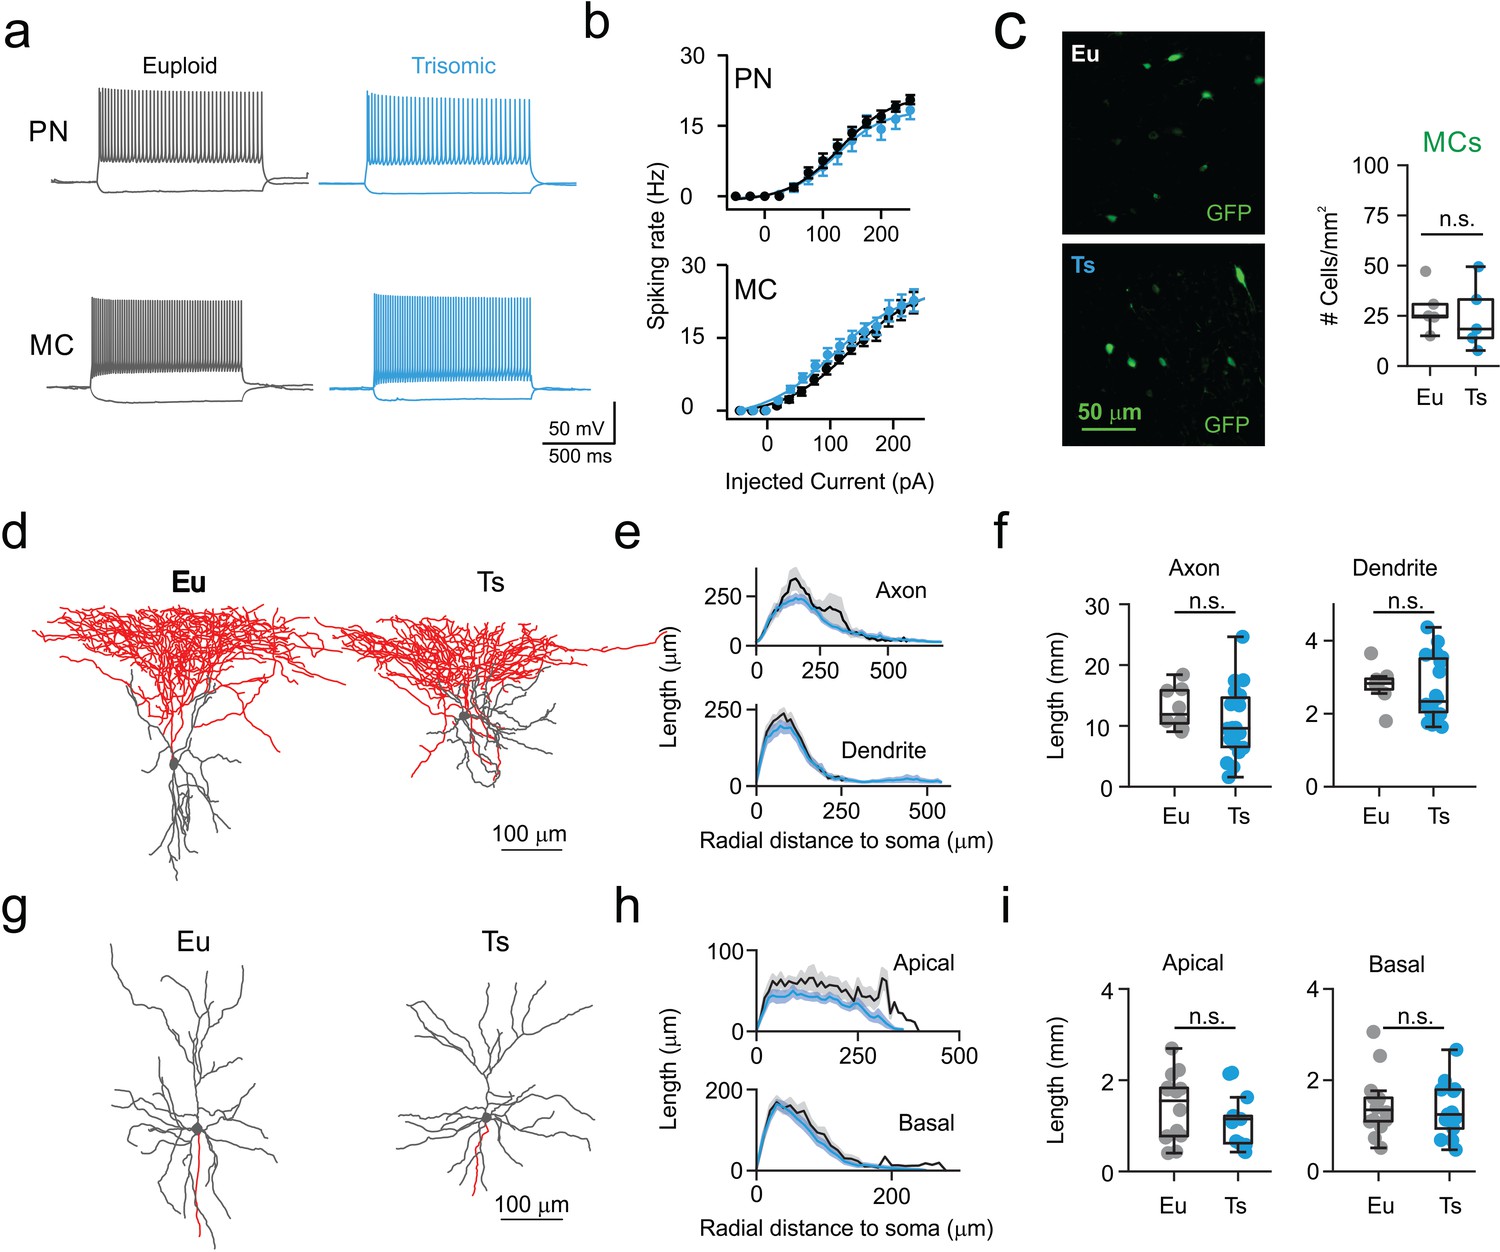
Normal excitability and morphology of PNs and MCs in Ts mice.
(a) Representative current-clamp traces of membrane potential responses to injections of current steps of increasing amplitude applied to PNs (above) and MCs (below) from Eu (gray) and Ts (blue) mice. (b) Spiking frequency as function of injected current. Population data from PNs (left, genotype factor F(1, 598)=3.444, p=0.064, two-way ANOVA; n = 25 and 23 cells for Eu and Ts, respectively) and MCs (right, genotype factor F(1, 660)=0.004960, p=0.9439, two-way ANOVA; n = 26 and 20 cells for Eu and Ts, respectively). (c) Count of MC somas in the mPFC of Eu and Ts mice. Left: epifluorescence images of immuno-labeled GFP-expressing MCs in Ts::X98 coronal slices. Right: population data for both Eu and Ts. (d) Representative reconstruction of biocytin filled L2/3 MCs from Eu and Ts mice. Gray: somatodendritic region, red: axon. (e) Scholl analysis of MC axonal and dendritic length between concentric circles of increasing radial steps of 10 µm. (f) Population data of total axonal (left) and dendritic (right) length. (e,f) n = 18 and 8 neurons for Eu and Ts, respectively. (g) Representative reconstruction of biocytin filled PNs from Eu and Ts mice. Gray: somatodendritic region (including apical and basal dendrites), red: axon. (h–i) same as in e-f, but for apical and basal dendrites of PNs (F (1, 25)=2.487, p=0.1273 2-way ANOVA for apical dendrites; F (1, 25)=0.3521, p=0.5583 2-way ANOVA for basal dendrites). (h,i) n = 14 and 13 neurons for Eu and Ts, respectively. (c,f,i) Boxplots represent median, percentiles 25 and 75 and whiskers are percentiles 5 and 95. Points represent values from individual synapses (b,c), mice (f), neurons (i,l). *: p<0.05; **: p<0.01.
-
Figure 2—source data 1
Excitability and morphology of PNs and MCs.
- https://cdn.elifesciences.org/articles/58731/elife-58731-fig2-data1-v2.xlsx
Figure 2—figure supplement 1
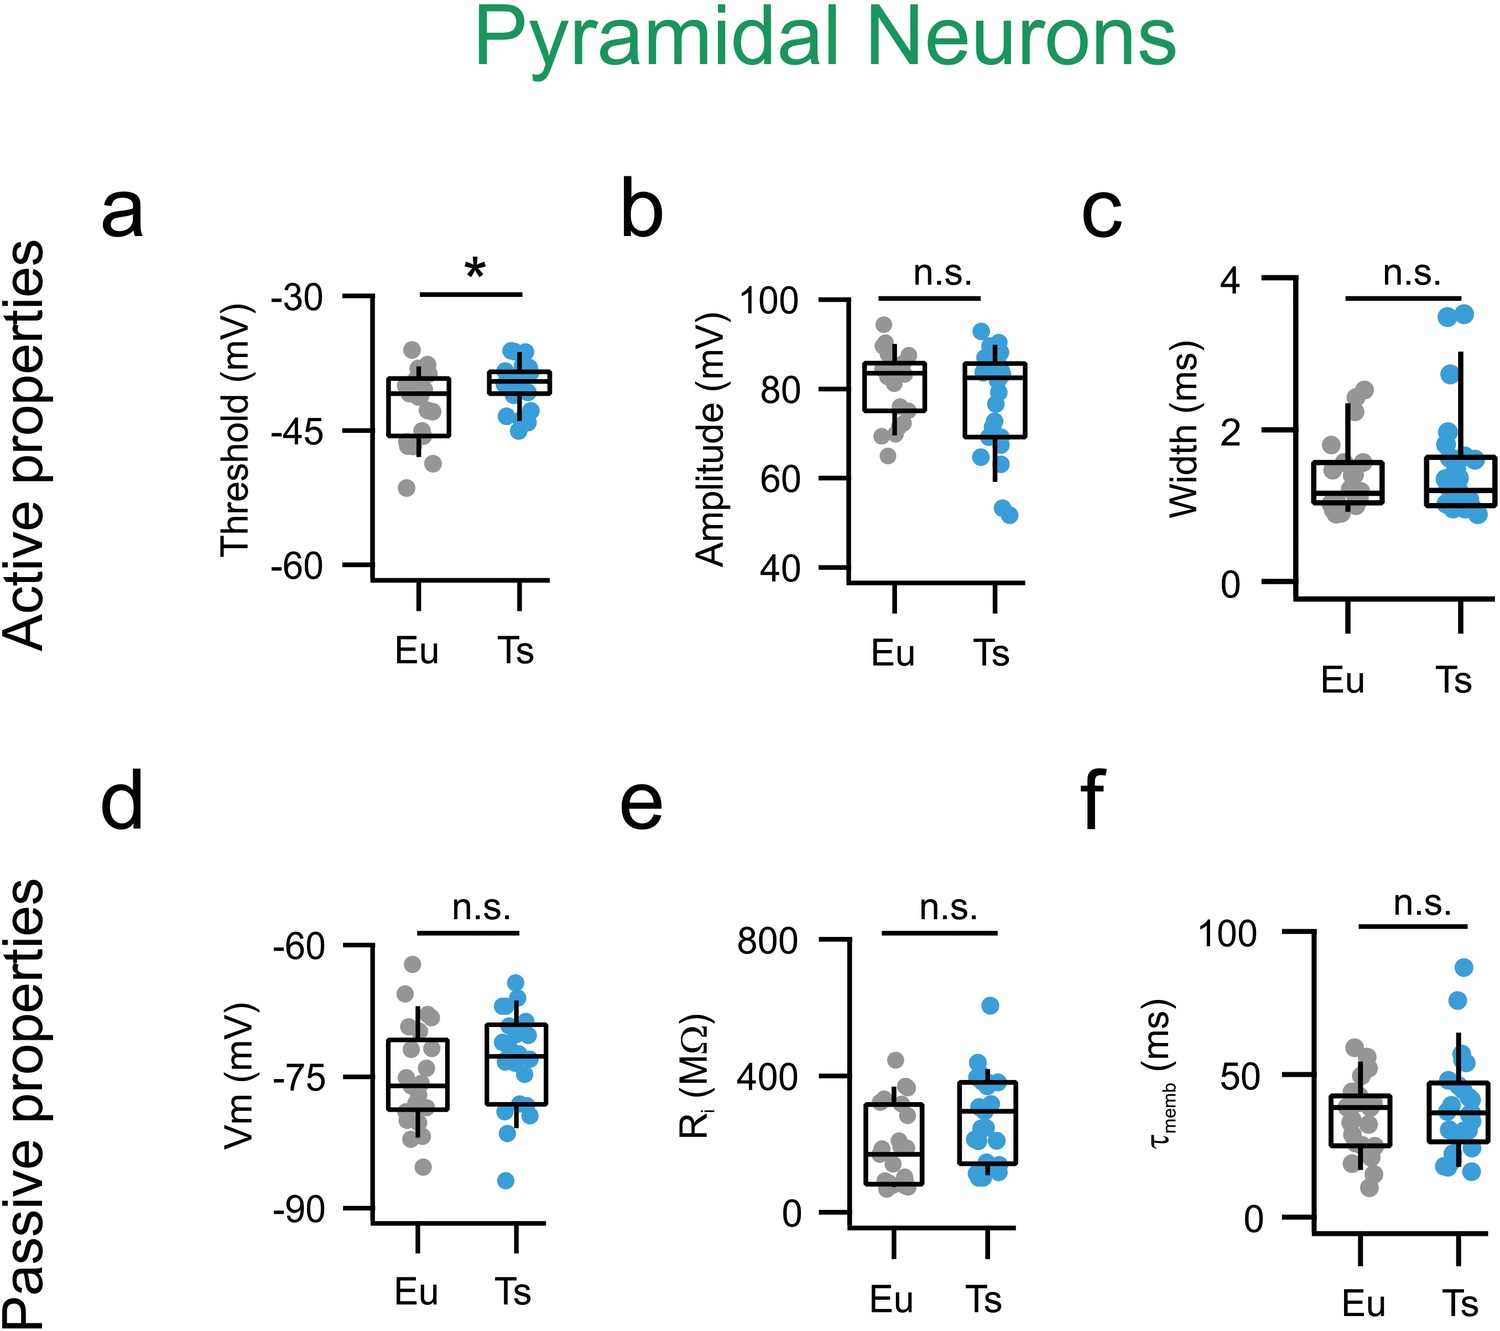
Single action potential and passive properties are normal Ts mPFC PNs.
(a) AP thresholds estimated as the voltage at which the derivative of Vm as function of time (dV/dt) reaches the limit of 10 mV/ms. Eu: −41 mV, −45–39 mV (n = 23 cells) and Ts: −40, −41–39 mV mV (n = 25 cells; Mann-Whitney U-test, p=0.0453). (b) AP amplitude measured as the difference between Vm at threshold and Vm at peak Eu: 84, 75–86 mV (n = 23 cells) and Ts: 82, 69–85 mV (n = 25 cells; Mann-Whitney U-test, p=0.37486). (c) AP width. Eu: 1.2, 1–1.6 ms (n = 23 cells) and Ts: 1.2, 1–1.6 ms (n = 25 cells; p=0.74125, Mann-Whitney U-test). (d) Resting membrane potential was also not significantly different between genotypes. Eu: −76, −79–72 mV (n = 23 cells) and Ts: −73, −78–69 mV (n = 25 cells; p=0.74125, Mann-Whitney U-test). (e) Input resistance, Eu: 255, 139–378 MΩ (n = 23 cells), Ts: 178, 86–316 MΩ (n = 25 cells, p=0.05918, Mann-Whitney U-test). (f) Decay tau of the membrane Eu: 37, 28–48 (n = 23 cells), Ts: 40, 27–47 (n = 25 cells, p=0.90665, Mann-Whitney U-test). Boxplots: represent median, percentiles 25 and 75 and whiskers are percentiles 5 and 95. Individual points represent average values from individual cells.
-
Figure 2—figure supplement 1—source data 1
Singleaction potentialand passive properties of mPFC PNs.
- https://cdn.elifesciences.org/articles/58731/elife-58731-fig2-figsupp1-data1-v2.xlsx
Figure 2—figure supplement 2
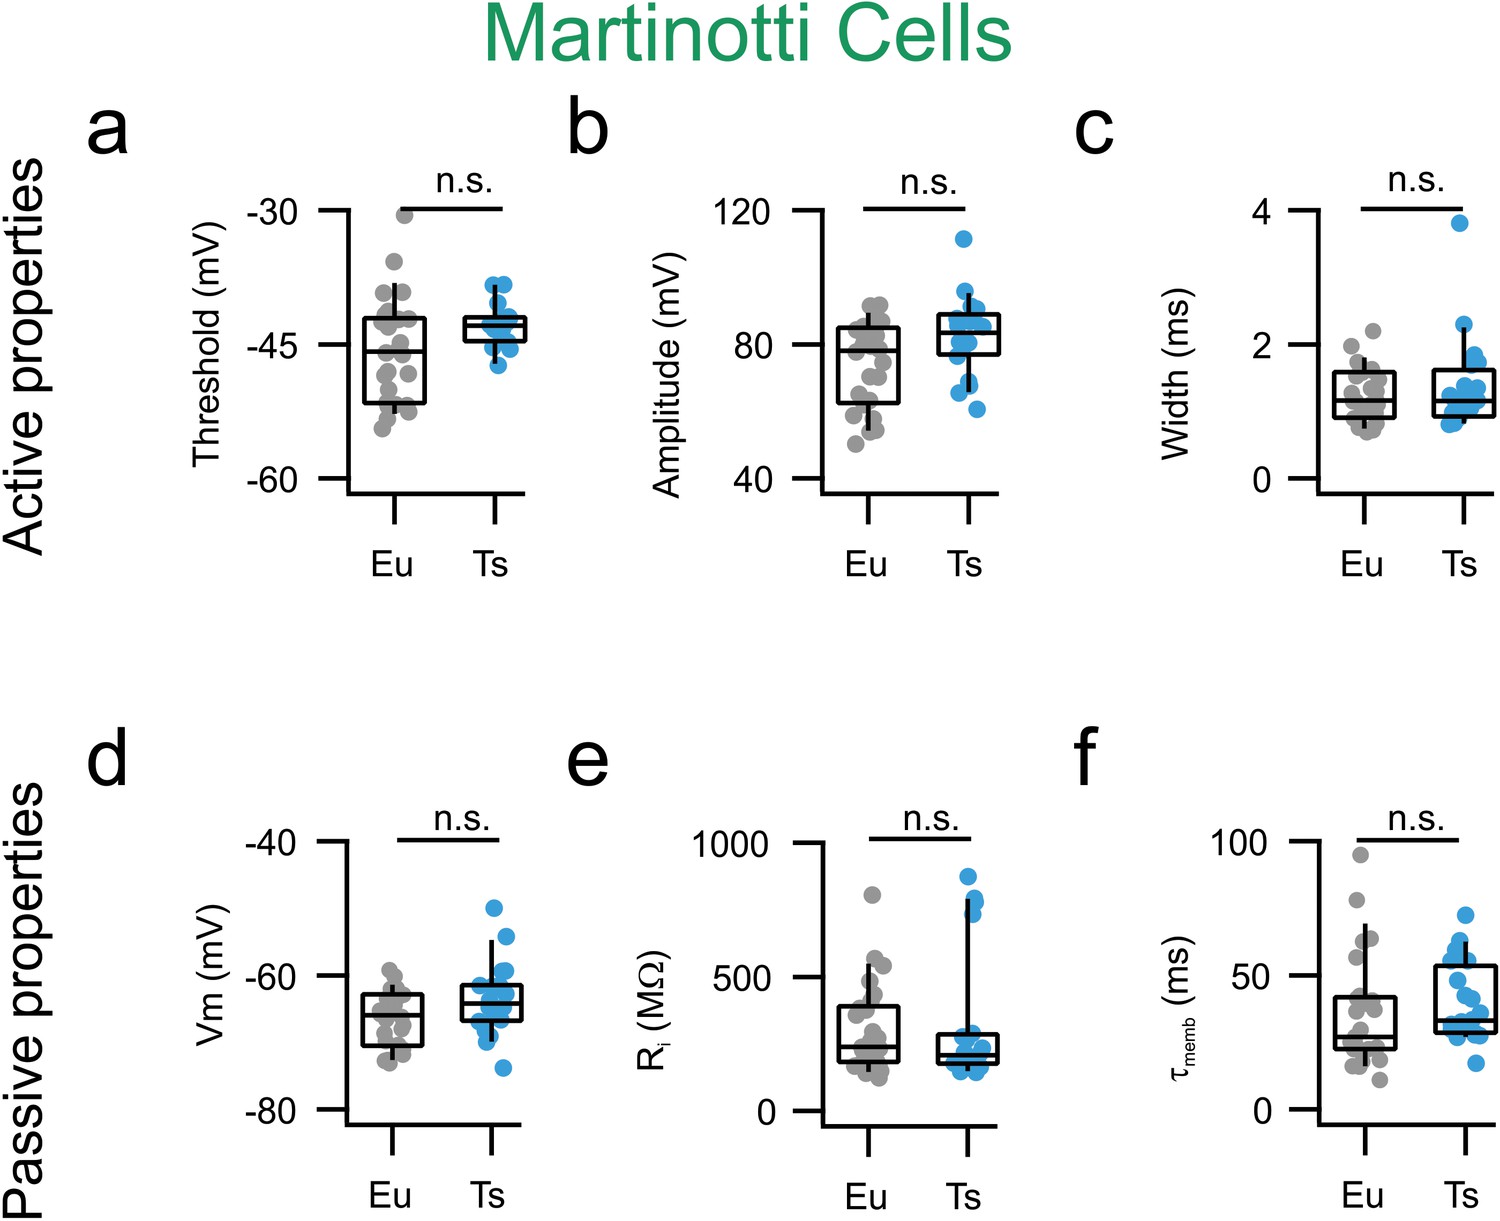
Active and passive properties are normal in mPFC MCs from Ts65Dn mice.
(a) AP thresholds estimated as the voltage at which the derivative of Vm as function of time (dV/dt) reaches the limit of 10 mV/ms. Eu: −46, −52–42 (n = 23 cells); Ts: −43, −45–42 (n = 25 cells, p=0.09877, Mann-Whitney U-test). (b) AP amplitude measured as the difference between Vm at threshold and Vm at peak Eu: 79, 63–85 mV (n = 26 cells), Ts: 82, 69–85 mV (n = 20, p=0.07267, Mann-Whitney U-test). (c) AP width. Eu: 1.2, 0.9–1.6 ms (n = 26 cells), Ts: 1.2, 0.9–1.6 ms (n = 20 cells, p=0.8680, Mann-Whitney U-test). (d) Resting membrane potential. Eu: −66, −70–63 (n = 26 cells), Ts: −64, −67–62 (n = 20 cells, p=0.0566, Mann-Whitney U-test). (e) Input resistance, Eu: 238, 183–382 MΩ (n = 26 cells), Ts: 207, 176–282 MΩ (n = 20 cells, p=0.57205, Mann-Whitney U-test). (f) Decay tau of the membrane Eu: 27, 22–41 (n = 26 cells), Ts: 33, 29–52 (n = 20 cells, p=0.14067, Mann-Whitney U-test). Boxplots: represent median, percentiles 25 and 75 and whiskers are percentiles 5 and 95. Individual points represent average values from each recorded synaptic connection.
-
Figure 2—figure supplement 2—source data 1
Singleaction potentialand passive properties of mPFC MCs.
- https://cdn.elifesciences.org/articles/58731/elife-58731-fig2-figsupp2-data1-v2.xlsx
Figure 2—figure supplement 3
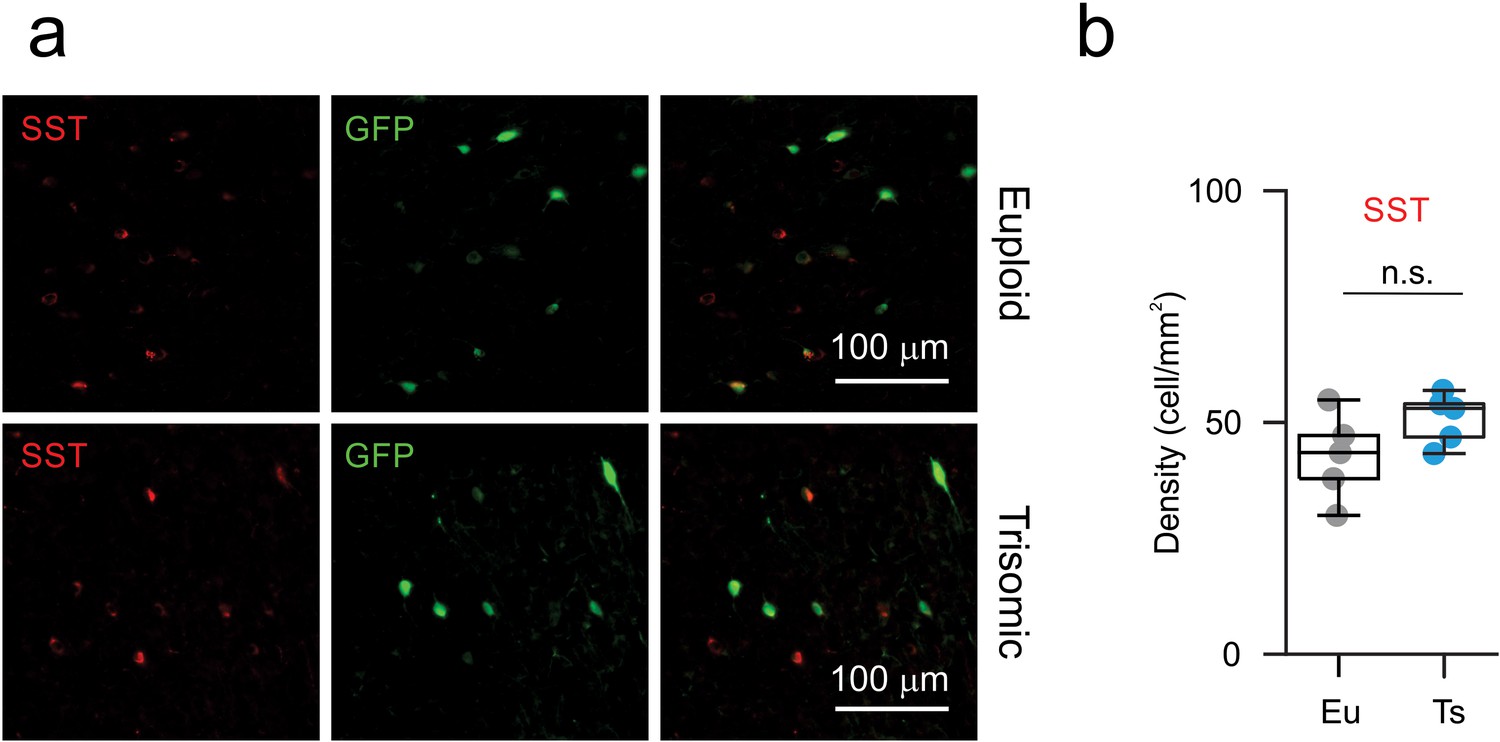
Normal SST-positive interneurons density in the mPFC of Ts mice.
(a) Representative fluorescence micrographs illustrating SST (red, left) and GFP (green, middle) immunostaining in Eu and Ts mice. Right column: merge of red and green channel (b) Quantification of SST-positive cells density in mPFC L2/3 from Eu and Ts Ts::X98 mice.
Figure 3 with 1 supplement
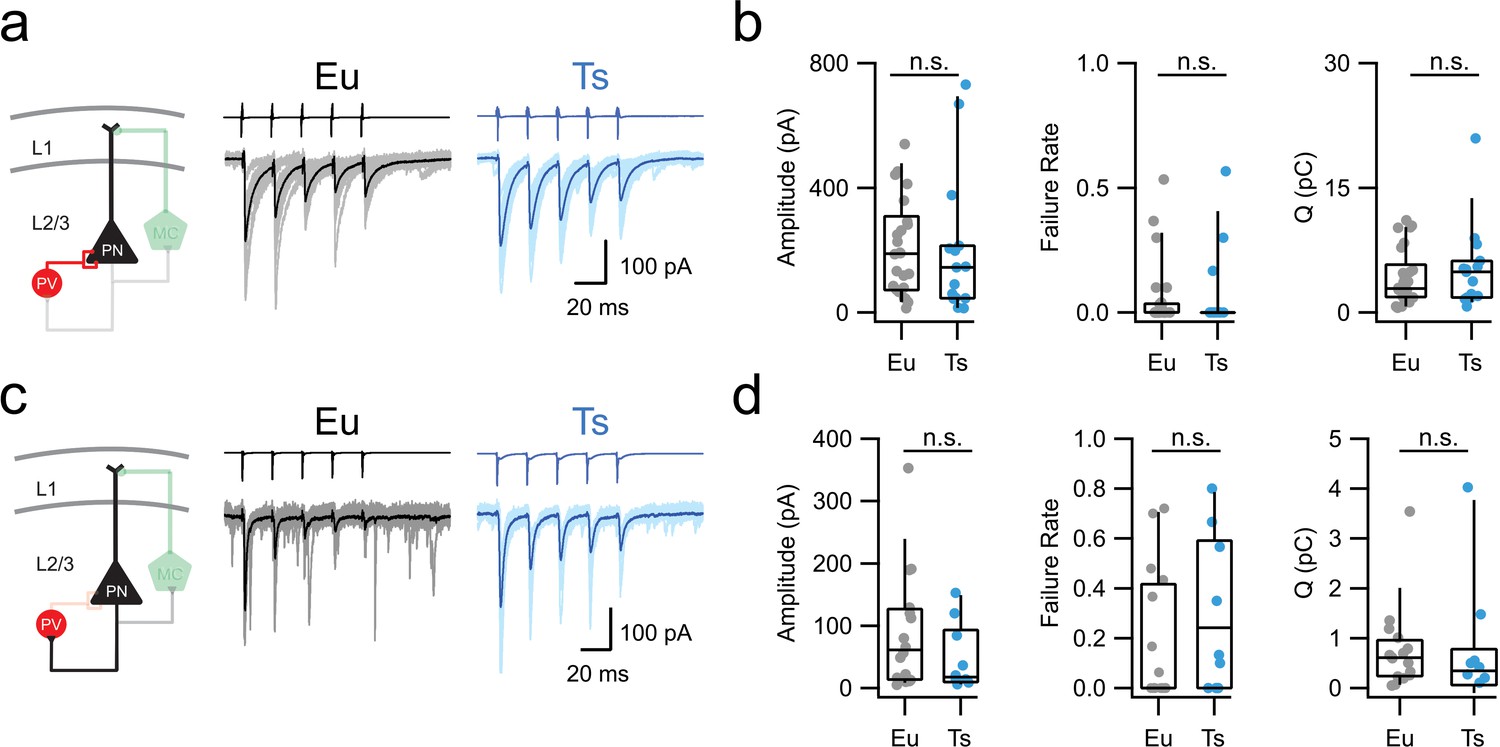
Perisomatic inhibition by PV-INs is normal in Ts mice.
(a) Left: scheme of the PV-PN perisomatic inhibitory circuit assessed using dual whole-cell patch-clamp recordings. Right: representative voltage-clamp traces corresponding to uIPSCs evoked upon application of 5 action currents (50 Hz) to the presynaptic PV-IN. Eu: individual (gray) and average (black); Ts: individual (light blue) and average (blue) traces are superimposed. (b) Population data of uIPSC amplitude (p=0.4901, Mann-Whitney U-test), failure rate of the postsynaptic response evoked by the first action potential of the train (p=0.7185, Mann-Whitney U-test) and total charge transferred during the 5 APs train (Q, p=0.579, Mann-Whitney U-test, n = 26 and 15 pairs for Eu and Ts, respectively). (c–d) Same as in a-b, but for glutamatergic uEPSCs triggered in the presynaptic PN and recorded in the postsynaptic PV IN in both genotypes (Amplitude: p=0.233, Mann-Whitney U-test; Failure Rate: p=0.214, Mann-Whitney U-test; Q: p=0. 3711, Mann-Whitney U-test; n = 15 and 9 pairs for Eu and Ts, respectively).
-
Figure 3—source data 1
Synaptic properties of the perisomatic inhibitory loop.
- https://cdn.elifesciences.org/articles/58731/elife-58731-fig3-data1-v2.xlsx
Figure 3—figure supplement 1
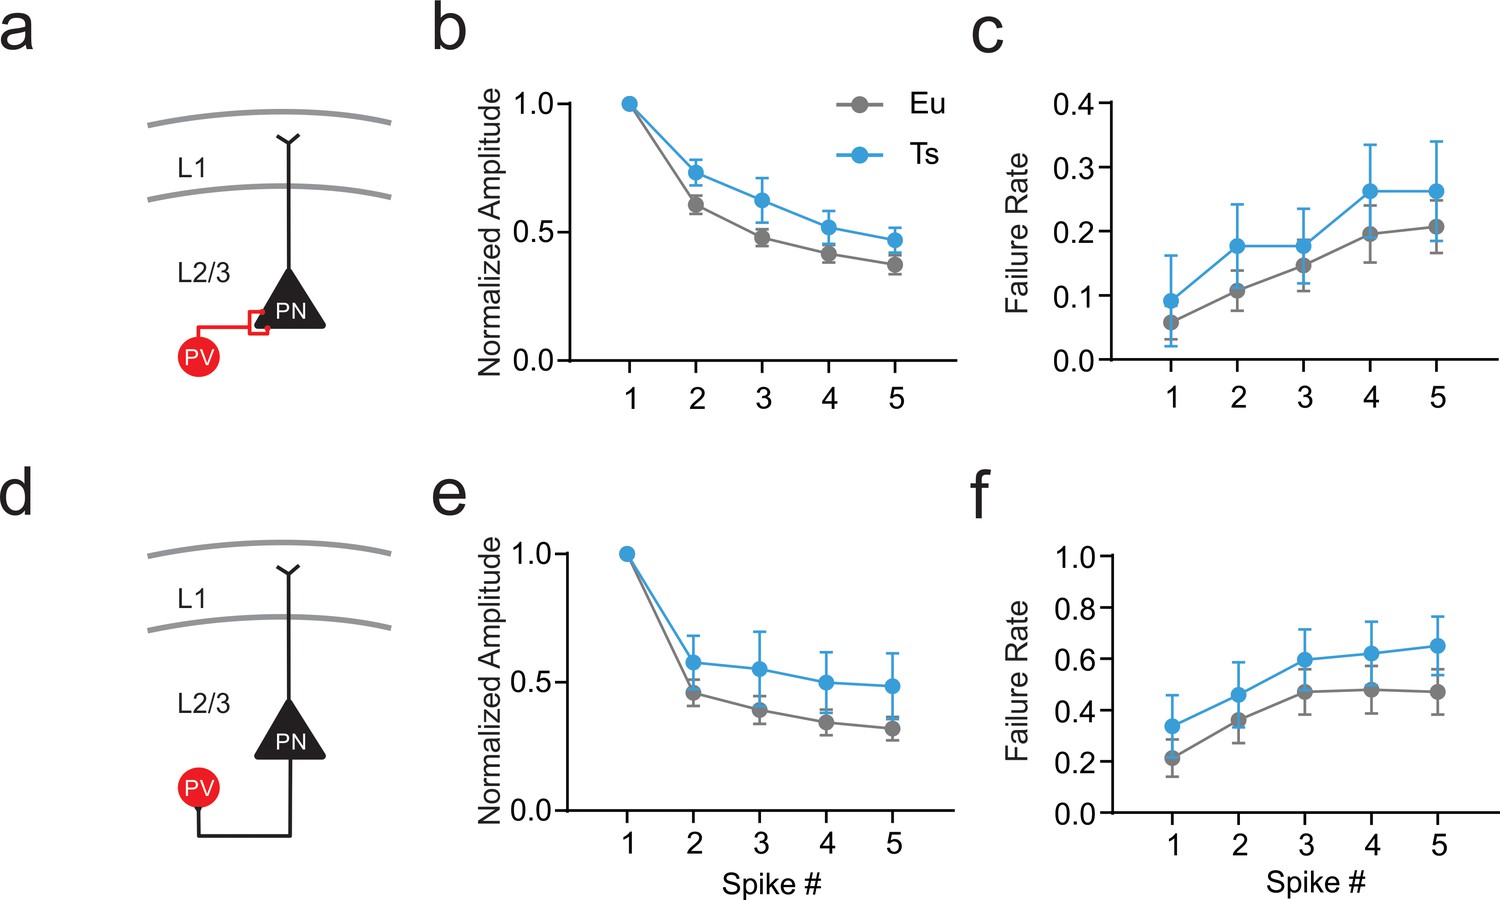
Short term plasticity of the perisomatic inhibitory loop in Ts.
(a) Schematic representation of the inhibitory synapse of the cortical dendritic inhibitory loop mediated by MCs. (b) Normalized amplitude of IPSCs evoked by a 5-AP train applied at 50 Hz to the presynaptic MC (Two-Way ANOVA genotype factor: F(1,32)=3.127, p=0.0865). (c) Failure rate of synaptic responses evoked by each AP of the train (Two-Way ANOVA genotype factor: F(1,32)=0.5324, p=0.4709, n = 26 and 8 pairs for Eu and Ts, respectively). (d) Schematic representation of the excitatory synapse between PN and MCs. (e) Normalized amplitude of EPSCs evoked by a 5-AP train applied at 50 Hz to the presynaptic PN (Two-Way ANOVA genotype factor: F(1,22)=2.022, p=0.1755). (f) Failure rate of synaptic responses evoked by each AP of the train (Two-Way ANOVA genotype factor: F (1,22)=0.7742, p=0.3928, n = 15 and 9 pairs for Eu and Ts, respectively).
-
Figure 3—figure supplement 1—source data 1
Short term plasticity of the perisomatic inhibitory loop in Ts.
- https://cdn.elifesciences.org/articles/58731/elife-58731-fig3-figsupp1-data1-v2.xlsx
Figure 4 with 2 supplements

Altered excitability of PV cells in Ts mice.
(a) Representative voltage traces in response to current steps of increased amplitudes applied to to PV-INs from Eu (gray) and Ts (blue). (b) Representative F-I curves recorded from Eu (top) and Ts (bottom) individual interneurons. Continuous lines represent logarithmic fit used to estimate Rheobase and Gain in each recorded cell. (c) Left: Rheobase population data for Eu (194.9 ± 22.4 pA) and Ts mice (85.0 ± 15.3 pA; p=0.00038, Mann-Whitney U-test). Middle: Gain population data for Eu (150.8 ± 22.6 Hz) and Ts mice (47.2 ± 9.4 Hz; p=0.00035, Mann-Whitney U-test). Right: Maximal spiking rate reached upon current injection (p=0.04, Mann-Whitney U-test, n = 28 and 26 cells for Eu and Ts, respectively). (d) Left: representative action-potential traces, scaled to the peak, from Eu (black) and Ts (blue) mice. Right: population data of AP width in the two genotypes. (e) Population data of input resistance measured in Eu and Ts PV-INs. (f) Quantification of PV-INs somas in the mPFC of Eu and Ts mice. Left: Epifluorescence images of immunolabeled PV cells in coronal slices from Ts::PV mice. Right: density of PV cells Eu and Ts (n = 6 and 7 mice for Eu and Ts, respectively; p=0.2602, Mann-Whitney test). *: p<0.05; **: p<0.01.
-
Figure 4—source data 1
Excitability of PV cells.
- https://cdn.elifesciences.org/articles/58731/elife-58731-fig4-data1-v2.xlsx
Figure 4—figure supplement 1
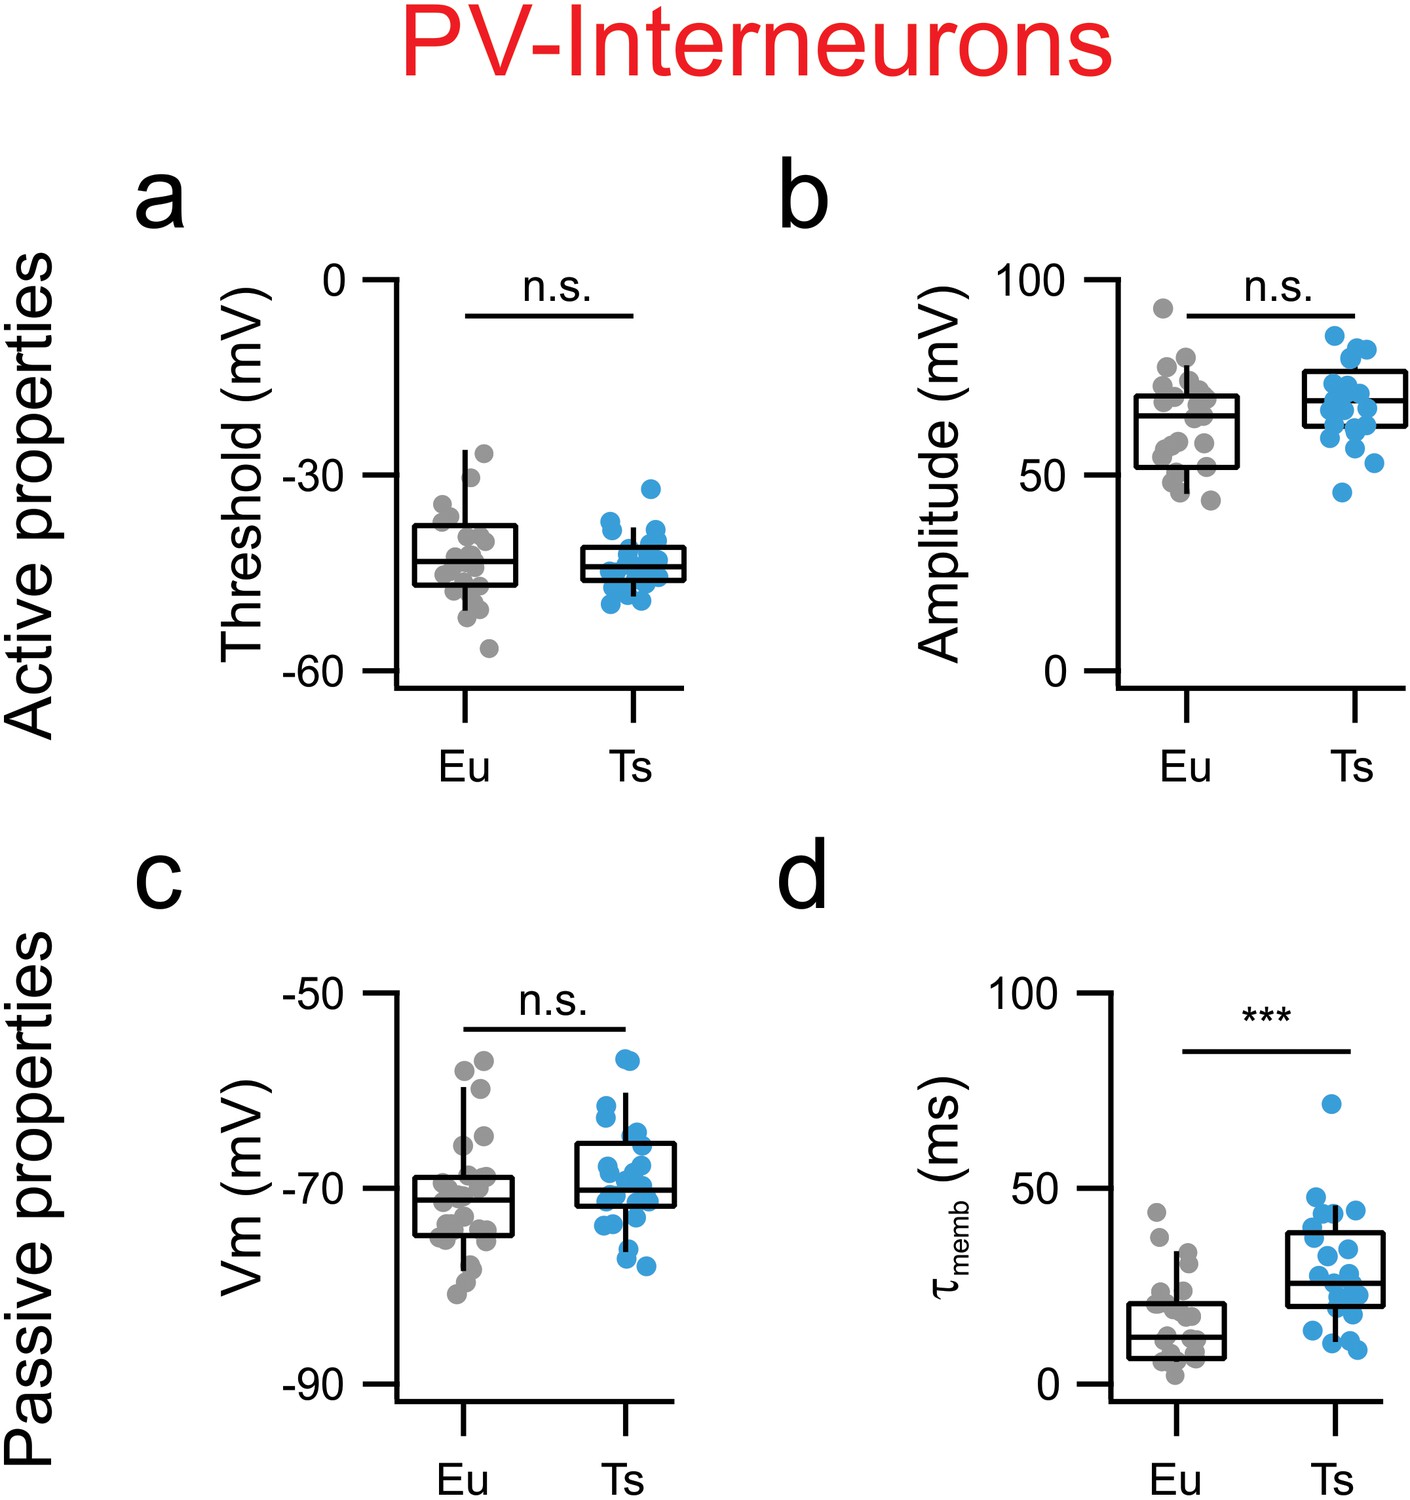
Specific alteration of mPFC PV-INs electrical properties in Ts65Dn mice.
(a) AP thresholds estimated as the voltage at which the derivative of Vm as function of time (dV/dt) reaches the limit of 10 mV/ms. Eu: −43 mV −47-−39 (n = 26 cells), Ts: −44 mV −46-−41 (n = 26 cells; p=0.0988 Student’s T test). (b) AP amplitude measured as the difference between Vm at threshold and Vm at peak Eu: 79, 63–85 mV (n = 26 cells), Ts: 69, 63–73 mV (n = 26, p=0.8680, Mann-Whitney U-test). (c) Resting membrane potential. Eu: −71,–75-−69 (n = 26 cells), Ts: −69,–71-−66 (n = 26 cells, p=0.0566, Student’s T test). (d) Decay tau of the membrane Eu: 12, 7–21 ms (n = 26 cells), Ts: 26, 20–37 ms (n = 25 cells, p=0.14067, Mann-Whitney U-test). Boxplots: represent median, percentiles 25 and 75 and whiskers are percentiles 5 and 95. Individual points represent average values from each recorded synaptic connection.
-
Figure 4—figure supplement 1—source data 1
Singleaction potentialand passive properties of mPFC PV cells.
- https://cdn.elifesciences.org/articles/58731/elife-58731-fig4-figsupp1-data1-v2.xlsx
Figure 4—figure supplement 2
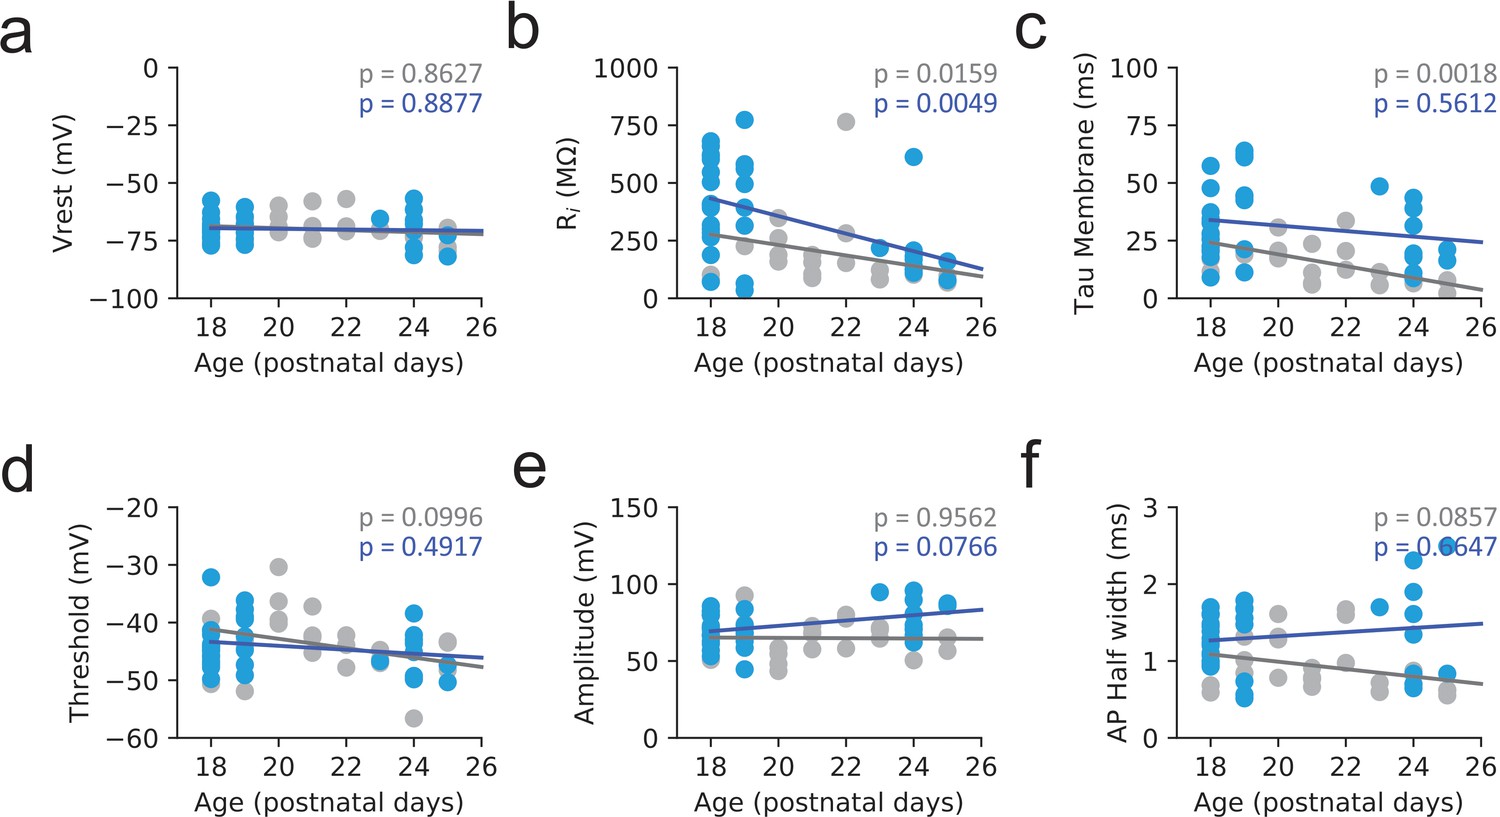
PV cells passive and active properties as function of Age.
Passive properties plotted as a function of age during the developmental period under study. (a) Resting membrane potential (Vrest). (b) Input Resistance (Ri). (c) Membrane time constant (Tau membrane). (d) Action potential threshold. (e) Action potential amplitude. (f) Action potential half width (n = 28 and 26 cells for Eu and Ts, respectively). In all panels continuous lines represent the linear fit to each data set (Eu: gray, Ts: blue). Spearman correlation test p value is indicated in all panels for Eu (gray) and Ts (blue).
Figure 5 with 1 supplement

Reduced spiking activity in vivo and increased tuning with network oscillations in anesthetized Ts65Dn mPFC.
(a) Left: scheme depicting simultaneous local field potential (LFP) and juxtacellular recordings in layer 2/3 of the mPFC. Right: representative juxtacellular (top trace), LFP (middle trace) and spectrogram (bottom) recorded in Eu (black traces) and Ts (blue traces) mice. (b) Average spiking rate from individual cells. Population data (n = 28 cells, 5 mice and 23 cells, six mice for Eu and Ts, respectively; p=0.03, Mann-Whitney U-test). (c) Normalized Power Spectral Density (PSD) from Eu and Ts mice. Shaded green areas correspond to β-γ-frequency ranges. (d) Representative portions of averaged LFP around aligned spike (spike-triggered LFP or stLFP). Top: Average traces of aligned spikes from a putative layer 2/3 PN recorded in a Eu (black) and Ts (blue) mouse. Bottom: average of the corresponding stLFPs. Light line: raw averaged trace, thick dark line: low pass filtered trace (cutoff: 100 Hz). (e) Average plots of stLFP peak-to-peak amplitude in Eu and Ts mice. (f) Normalized Power spectral density of stLFPs. Shaded green areas correspond to β-γ-frequency ranges. (g) Pairwise Phase Consistency (PPC) calculated for specific frequency bands (4–10 Hz: p=0.427, 10–20 Hz: p=0.02145, 20–40 Hz: p=0.0418, 40–60 Hz: p=0.01638, 60–80 Hz: p=0.2308, 80–100 Hz: p=0.3161, Mann-Whitney U-test). e-g,: n = 23 cells, 5 mice and 11 cells, six mice for Eu and Ts, respectively. Boxplots represent median, percentiles 25 and 75 and whiskers are percentiles 5 and 95. *: p<0.05; **: p<0.01.
-
Figure 5—source data 1
In vivo spiking activity and phase locking.
- https://cdn.elifesciences.org/articles/58731/elife-58731-fig5-data1-v2.xlsx
Figure 5—figure supplement 1
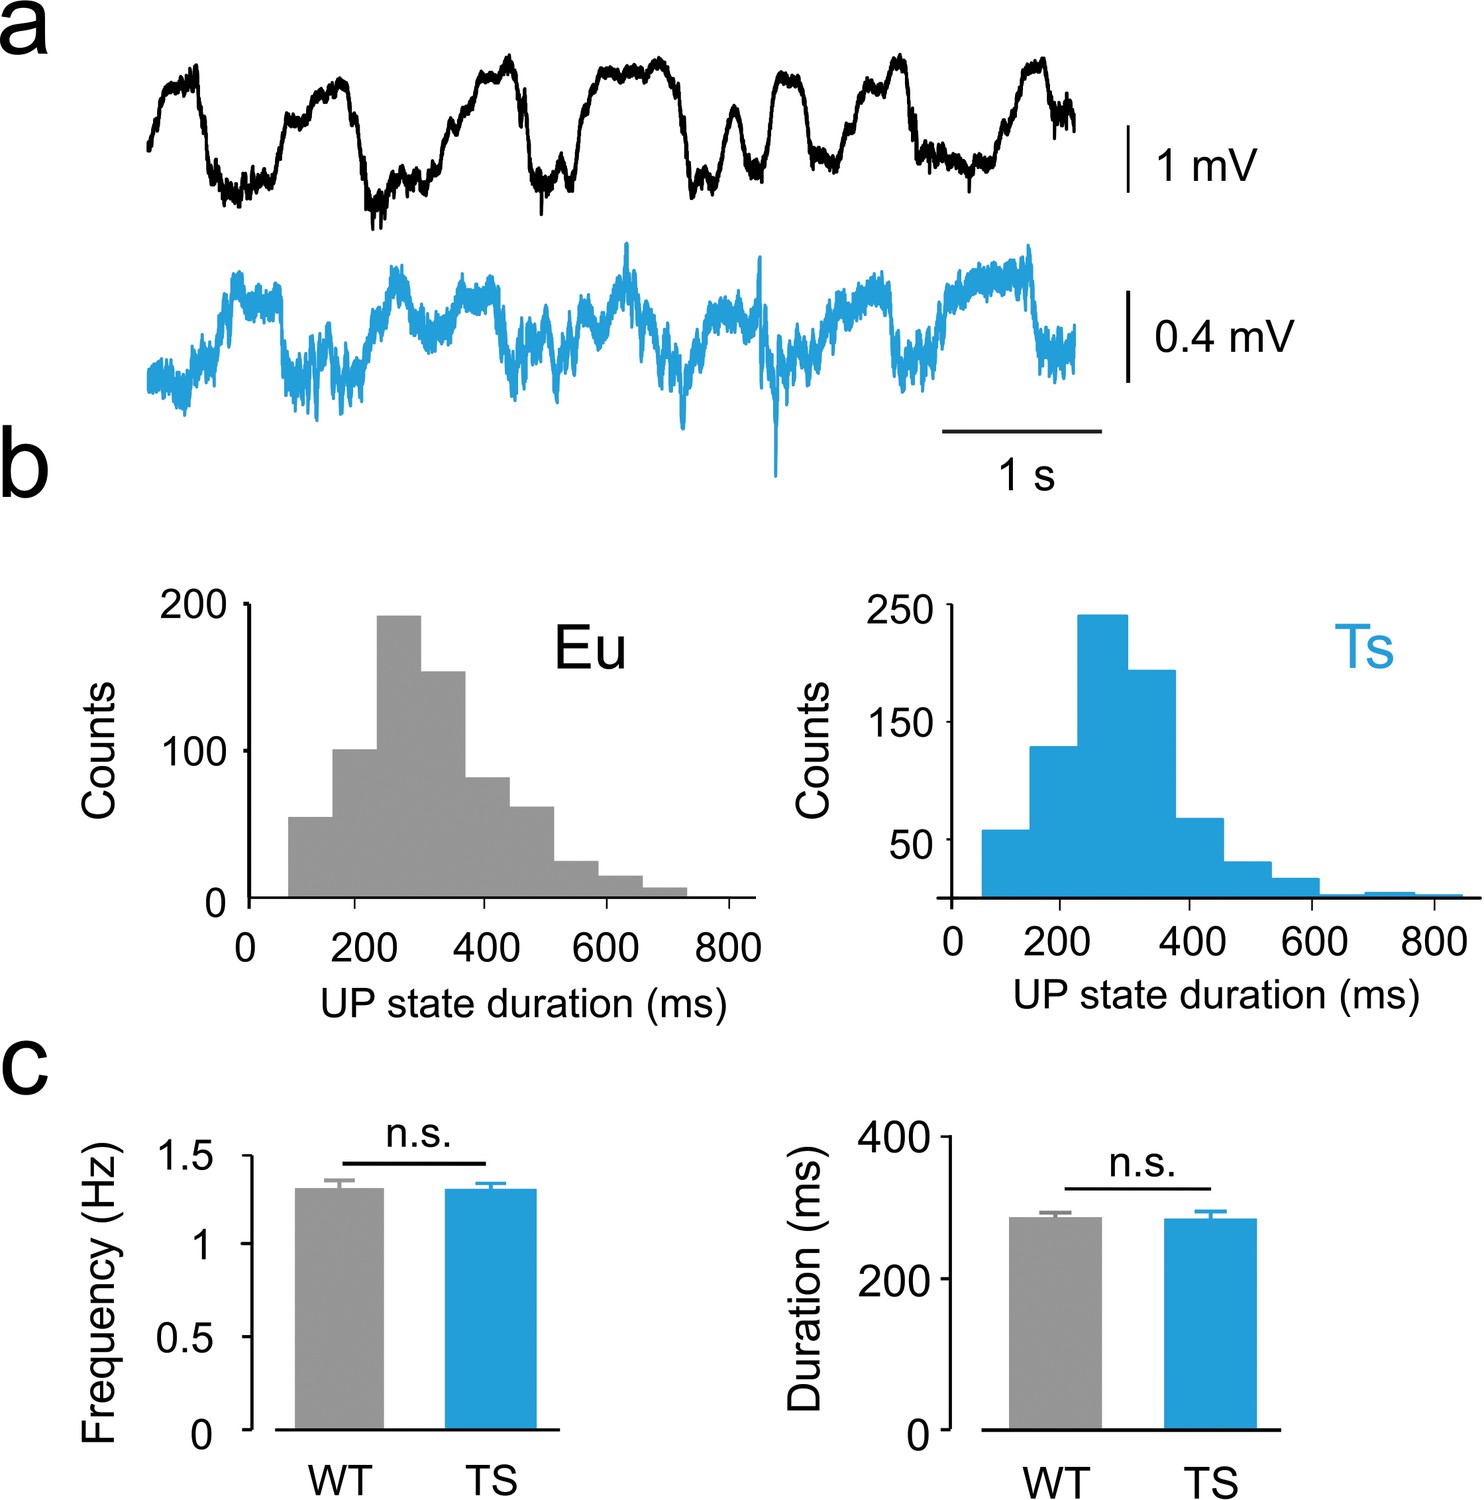
Characterization of slow wave oscillatory activity of LFP in anesthetized Eu and Ts mice.
(a) Representative LFP traces of anesthetized Eu (black, top) and Ts (bottom, blue) mice. (b) Histograms of UP states duration from the examples shown in (a) Eu (gray bars) and Ts (blue bars) examples. (c) Average frequency, population data (left panel; Eu: 1.32 ± 0.02 Hz, Ts: 1.33 ± 0.02 Hz; Student’s T test, p=0.86952) and average duration (right panel; Eu: 305.0 ± 3.3 ms, Ts: 310.9 ± 4.1 ms; Student’s T test, p=0.6352) of UP state did not significantly differed between genotypes (n = 6 and 7 mice, respectively).
Author response image 1

Author response image 2

Tables
Table 1
MC to PN synaptic efficiency evaluation.
| Dendritic Inhibition | |||||||||||
|---|---|---|---|---|---|---|---|---|---|---|---|
| Euploid | Ts65Dn | ||||||||||
| median | Q1 | Q3 | n | median | Q1 | Q3 | n | test | p value | ||
| MC-PN IPSC | Amplitude (pA) | 29.89 | 20.24 | 52.98 | 11 | 97.09 | 54.49 | 135.86 | 15 | MW-test | 0.0095 |
| Failure Rate | 0.20 | 0.11 | 0.25 | 11 | 0.00 | 0.00 | 0.13 | 15 | MW-test | 0.0201 | |
| Charge (pC) | 1.28 | 0.96 | 1.84 | 11 | 6.86 | 2.96 | 8.32 | 15 | MW-test | 0.00595 | |
| α5IA % block | 41 | 24.20 | 57.20 | 4 | 57.4 | 33.10 | 73.10 | 6 | MW-test | 0.2278 | |
| Rise Time (ms) | 1.20 | 1.00 | 1.80 | 18 | 1.70 | 1.50 | 2.10 | 18 | MW-test | 0.02448 | |
| Decay Time (ms) | 15.60 | 10.00 | 19.40 | 18 | 17.10 | 15.00 | 21.70 | 18 | MW-test | 0.1488 | |
-
Median: quantile 50; Q1: quantile 25; Q3: quantile 75; n: number of cells; IPSC: Inhibitory postsynaptic current.
Table 2
PN to MC synaptic efficiency evaluation.
| Dendritic Inhibition | |||||||||||
|---|---|---|---|---|---|---|---|---|---|---|---|
| Euploid | Ts65Dn | ||||||||||
| median | Q1 | Q3 | n | median | Q1 | Q3 | n | test | p value | ||
| PN-MC EPSC | Amplitude (pA) | 5.36 | 2.13 | 7.46 | 7 | 18.66 | 11.44 | 28.21 | 7 | T-test | 0.0106 |
| Failure Rate | 0.87 | 0.81 | 0.93 | 7 | 0.52 | 0.39 | 0.71 | 7 | MW-test | 0.0126 | |
| Charge (pC) | 0.27 | 0.22 | 0.31 | 7 | 0.87 | 0.53 | 1.13 | 7 | MW-test | 0.0073 | |
-
Median: quantile 50; Q1: quantile 25; Q3: quantile 75; n: number of cells; EPSC: Excitatory postsynaptic current.
Table 3
PNs excitability.
| Euploid | Ts65Dn | ||||||||||
|---|---|---|---|---|---|---|---|---|---|---|---|
| median | Q1 | Q3 | n | median | Q1 | Q3 | n | test | p value | ||
| Excitability | InjCurr50 (pA) | 21.6 | 19.5 | 24.4 | 12 | 18.9 | 15.9 | 24.6 | 11 | T-test | 0.6081 |
| Max Spiking Rate (Hz) | 112.4 | 91.9 | 155.0 | 12 | 124.5 | 101.0 | 178.2 | 11 | T-test | 0.4500 | |
-
Median: quantile 50; Q1: quantile 25; Q3: quantile 75; n: number of cells; InjCurr50: amount of current injected to reach 50% of the maximal spiking rate.
Table 4
MCs excitability.
| Euploid | Ts65Dn | ||||||||||
|---|---|---|---|---|---|---|---|---|---|---|---|
| median | Q1 | Q3 | n | median | Q1 | Q3 | n | test | p value | ||
| Excitability | InjCurr50 (pA) | 40.9 | 26.9 | 50.4 | 25 | 48.9 | 25.4 | 70.2 | 20 | MW-test | 0.6073 |
| Max Spiking Rate (Hz) | 101.8 | 68.3 | 124.0 | 25 | 86.5 | 63.2 | 109.7 | 20 | T-test | 0.4436 | |
-
Median: quantile 50; Q1: quantile 25; Q3: quantile 75; n: number of cells; InjCurr50: amount of current injected to reach 50% of the maximal spiking rate.
Table 5
PNs passive and action potential (AP) properties.
| Euploid | Ts65Dn | ||||||||||
|---|---|---|---|---|---|---|---|---|---|---|---|
| median | Q1 | Q3 | n | median | Q1 | Q3 | n | test | p value | ||
| Passive properties | Vrest (mV) | -76 | -79 | -72 | 25 | -73 | -78 | -69 | 22 | T-test | 0.2473 |
| Ri (MΩ) | 255 | 139 | 378 | 25 | 178 | 86 | 316 | 22 | T-test | 0.7185 | |
| Tau memb (ms) | 36.5 | 28.1 | 47.9 | 25 | 39.7 | 26.8 | 46.9 | 22 | T-test | 0.5790 | |
| AP properties | Threshold (mV) | -40.9 | -45.6 | -39.2 | 25 | -39.6 | -40.8 | -38.5 | 22 | MW-test | 0.0453 |
| Amplitude (mV) | 83.6 | 75.1 | 85.8 | 25 | 82.5 | 69.2 | 85.5 | 22 | MW-test | 0.3749 | |
| Width (ms) | 1.2 | 1.0 | 1.6 | 25 | 1.2 | 1.0 | 1.6 | 22 | MW-test | 0.7413 | |
-
Median: quantile 50; Q1: quantile 25; Q3: quantile 75; n: number of cells; Vrest: Resting membrane potential; Ri : input resistance.
Table 6
MCs passive and action potential (AP) properties.
| Euploid | Ts65Dn | ||||||||||
|---|---|---|---|---|---|---|---|---|---|---|---|
| median | Q1 | Q3 | n | median | Q1 | Q3 | n | test | p value | ||
| Passive properties | Vrest (mV) | -66 | -70 | -63 | 26 | -64 | -67 | -62 | 20 | T-test | 0.0566 |
| Ri (MΩ) | 238 | 183 | 382 | 26 | 207 | 176 | 282 | 20 | MW-test | 0.5721 | |
| Tau memb (ms) | 27.0 | 22.4 | 41.4 | 25 | 33.0 | 28.7 | 51.7 | 20 | MW-test | 0.1407 | |
| AP properties | Threshold (mV) | 79.0 | 63.2 | 85.1 | 26 | 83.4 | 77.3 | 88.5 | 20 | MW-test | 0.0988 |
| Amplitude (mV) | -45.8 | -51.5 | -42.2 | 26 | -42.9 | -44.6 | -42.0 | 20 | MW-test | 0.0727 | |
| Width (ms) | 1.2 | 0.9 | 1.6 | 26 | 1.2 | 0.9 | 1.5 | 20 | MW-test | 0.8680 | |
-
Median: quantile 50; Q1: quantile 25; Q3: quantile 75; n: number of cells; Vrest: Resting membrane potential ; Ri : input resistance.
Table 7
Direct perisomatic inhibition.
PV to PN synaptic efficiency evaluation.
| Perisomatic inhibition | |||||||||||
|---|---|---|---|---|---|---|---|---|---|---|---|
| Euploid | Ts65Dn | ||||||||||
| median | Q1 | Q3 | n | median | Q1 | Q3 | n | test | p value | ||
| PV-PN IPSC | Amplitude (pA) | 188.43 | 74.87 | 289.03 | 26 | 144.52 | 46.10 | 209.78 | 15 | MW-test | 0.49 |
| Failure Rate | 0.00 | 0.00 | 0.03 | 26 | 0.00 | 0.00 | 0.00 | 15 | MW-test | 0.7185 | |
| Charge (pC) | 2.88 | 1.92 | 5.02 | 26 | 4.89 | 1.89 | 5.85 | 15 | MW-test | 0.579 | |
-
PV to PN synaptic efficiency evaluation. Median: quantile 50; Q1: quantile 25; Q3: quantile 75; n: number of cells; IPSC: Inhibitory postsynaptic current.
Table 8
Recruitment of PV-INs by PNs.
PN to PV synaptic efficiency evaluation.
| Perisomatic inhibition | |||||||||||
|---|---|---|---|---|---|---|---|---|---|---|---|
| Euploid | Ts65Dn | ||||||||||
| median | Q1 | Q3 | n | median | Q1 | Q3 | n | test | p value | ||
| PN-PVEPSC | Amplitude (pA) | 65.66 | 19.28 | 124.50 | 15 | 20.41 | 14.10 | 84.25 | 9 | MW-test | 0.23304 |
| Failure Rate | 0.00 | 0.00 | 0.27 | 15 | 0.13 | 0.00 | 0.57 | 9 | MW-test | 0.21402 | |
| Charge (pC) | 0.62 | 0.29 | 0.90 | 15 | 0.42 | 0.20 | 0.55 | 9 | MW-test | 0.3711 | |
-
Median: quantile 50; Q1: quantile 25; Q3: quantile 75; n: number of cells; EPSC: Excitatory postsynaptic current.
Table 9
PV-INs excitability.
| Euploid | Ts65Dn | ||||||||||
|---|---|---|---|---|---|---|---|---|---|---|---|
| median | Q1 | Q3 | n | median | Q1 | Q3 | n | test | p value | ||
| Excitability | Rheobase (pA) | 198.7 | 104.1 | 276.7 | 19 | 54.4 | 34.6 | 98.7 | 26 | MW | 0.0004 |
| Gain (Hz) | 163.2 | 34.6 | 233.8 | 19 | 28.2 | 20.2 | 44.2 | 26 | MW | 0.0004 | |
| Max Spiking Rate (Hz) | 99.5 | 45.2 | 142.3 | 19 | 47.9 | 45.3 | 63.3 | 26 | MW | 0.0001 | |
-
Median: quantile 50; Q1: quantile 25; Q3: quantile 75; n: number of cells; InjCurr50: amount of current injected to reach 50% of the maximal spiking rate.
Table 10
PV-INs passive and action potential (AP) properties.
| Euploid | Ts65Dn | ||||||||||
|---|---|---|---|---|---|---|---|---|---|---|---|
| median | Q1 | Q3 | n | median | Q1 | Q3 | n | test | p value | ||
| Passive properties | Vrest (mV) | -71 | -75 | -69 | 28 | -70 | -71 | -66 | 26 | T-test | 0.1808 |
| Ri (MΩ) | 154 | 93 | 271 | 28 | 406 | 264 | 581 | 26 | MW-test | 0.0001 | |
| Tau memb (ms) | 12.0 | 6.5 | 20.6 | 28 | 25.8 | 20.2 | 37.3 | 25 | MW-test | 0.0003 | |
| AP properties | Threshold (mV) | -43.4 | -47.0 | -39.5 | 26 | -44.0 | -46.0 | -41.3 | 26 | T-test | 0.7891 |
| Amplitude (mV) | 65.2 | 54.6 | 70.3 | 25 | 69.0 | 62.8 | 73.4 | 25 | T-test | 0.1019 | |
| Width (ms) | 0.8 | 0.7 | 1.3 | 26 | 1.3 | 1.0 | 1.6 | 26 | MW-test | 0.0012 | |
-
Median: quantile 50; Q1: quantile 25; Q3: quantile 75; n: number of cells; Vrest: Resting membrane potential; Ri : input resistance.
Table 11
LFP and single cell spiking recorded in vivo.
| Euploid | Ts65Dn | ||||||||||||
|---|---|---|---|---|---|---|---|---|---|---|---|---|---|
| median | Q1 | Q3 | N cells | N mice | median | Q1 | Q3 | N cells | N mice | test | p value | ||
| Spiking Rate (Hz) | 0.81 | 0.56 | 1.24 | 28 | 6 | 0.42 | 0.22 | 0.92 | 23 | 5 | MW-test | 0.0348 | |
| stLFP | peak-to-peak Amp (µV) | 7.3 | 6.0 | 8.6 | 22 | 6 | 13.3 | 12.3 | 17.1 | 11 | 5 | MW-test | 0.0011 |
-
Median: quantile 50; Q1: quantile 25; Q3: quantile 75; n: number of cells.
Table 12
Pairwise Phase Consistency (PPC) descriptive statistics and hypothesis tests between genotypes for each frequency band analyzed.
| Euploid | Ts65Dn | ||||||||||||
|---|---|---|---|---|---|---|---|---|---|---|---|---|---|
| Freq. band | median | Q1 | Q3 | N cells | N mice | median | Q1 | Q3 | N cells | N mice | test | p value | |
| PPC | 4-10 Hz | 0.0085 | 0.0053 | 0.0242 | 22 | 6 | 0.0106 | 0.0064 | 0.0164 | 11 | 5 | MW-test | 0.4270 |
| 10-20 Hz | 0.0046 | 0.0011 | 0.0237 | 22 | 6 | 0.0213 | 0.0163 | 0.0379 | 11 | 5 | MW-test | 0.0215 | |
| 20-40 Hz | 0.0024 | -0.0002 | 0.0085 | 22 | 6 | 0.0066 | 0.0059 | 0.0193 | 11 | 5 | MW-test | 0.0418 | |
| 40-60 Hz | 0.0009 | -0.0009 | 0.0025 | 22 | 6 | 0.0052 | 0.0019 | 0.0079 | 11 | 5 | MW-test | 0.0164 | |
| 60-80 Hz | -0.0003 | -0.0007 | 0.0004 | 22 | 6 | 0.0001 | -0.0005 | 0.0009 | 11 | 5 | MW-test | 0.2308 | |
| 80-100 Hz | -0.0002 | -0.0009 | 0.0013 | 22 | 6 | -0.0004 | -0.0008 | 0.0002 | 11 | 5 | MW-test | 0.3161 | |
-
Median: quantile 50; Q1: quantile 25; Q3: quantile 75; n: number of cells. We considered only cells from which we recorded at least 250 action potentials in order to obtain reliable PPC values.
Key resources table
| Reagent type (species) or resource | Designation | Source or reference | Identifiers | Additional information |
|---|---|---|---|---|
| Genetic reagent (M. musculus) | C57BL/6-Tg(Pvalb-tdTomato)15Gfng/J (PValb-Tomato) | Jackson Laboratory | Stock #: 27395 RRID:MGI:5629295 | |
| Genetic reagent (M. musculus) | Tg(Gad1-EGFP)98Agmo/J, GAD67-GFP (X98) | Jackson Laboratory | Stock #: 6340 RRID:MGI:3715263 | |
| Genetic reagent (M. musculus) | B6EiC3Sn.BLiA-Ts(1716)65Dn/DnJ (Ts65Dn) | Jackson Laboratory | Stock #: 005252 RRID:MGI:2178111 |
Author response table 1
| Eu (n = 8) P23-25 | Ts (n = 10) P23-25 | P value* | Kaiser et al. 2016§ P45-90 | |
|---|---|---|---|---|
| Ri (MΩ) | 94.6 ± 6.7 | 200.3 ± 45.3 | p = 0.0034 | 119 ± 4.0 |
| τm (ms) | 6.9 ± 0.9 | 25.7 ± 4.2 | p = 0.0004 | 7.2 ± 0.2 |
| AP width (ms) | 0.66 ± 0.03 | 1.44 ± 0.20 | p = 0.0026 | 0.5 ± 0.01 |
Additional files
Download links
A two-part list of links to download the article, or parts of the article, in various formats.
Downloads (link to download the article as PDF)
Open citations (links to open the citations from this article in various online reference manager services)
Cite this article (links to download the citations from this article in formats compatible with various reference manager tools)
Alterations of specific cortical GABAergic circuits underlie abnormal network activity in a mouse model of Down syndrome
eLife 9:e58731.
https://doi.org/10.7554/eLife.58731


