mTOR signaling regulates the morphology and migration of outer radial glia in developing human cortex
- Department of Neurology, University of California, San Francisco (UCSF), United States
- The Eli and Edythe Broad Center of Regeneration Medicine and Stem Cell Research, UCSF, United States
Figures
Figure 1
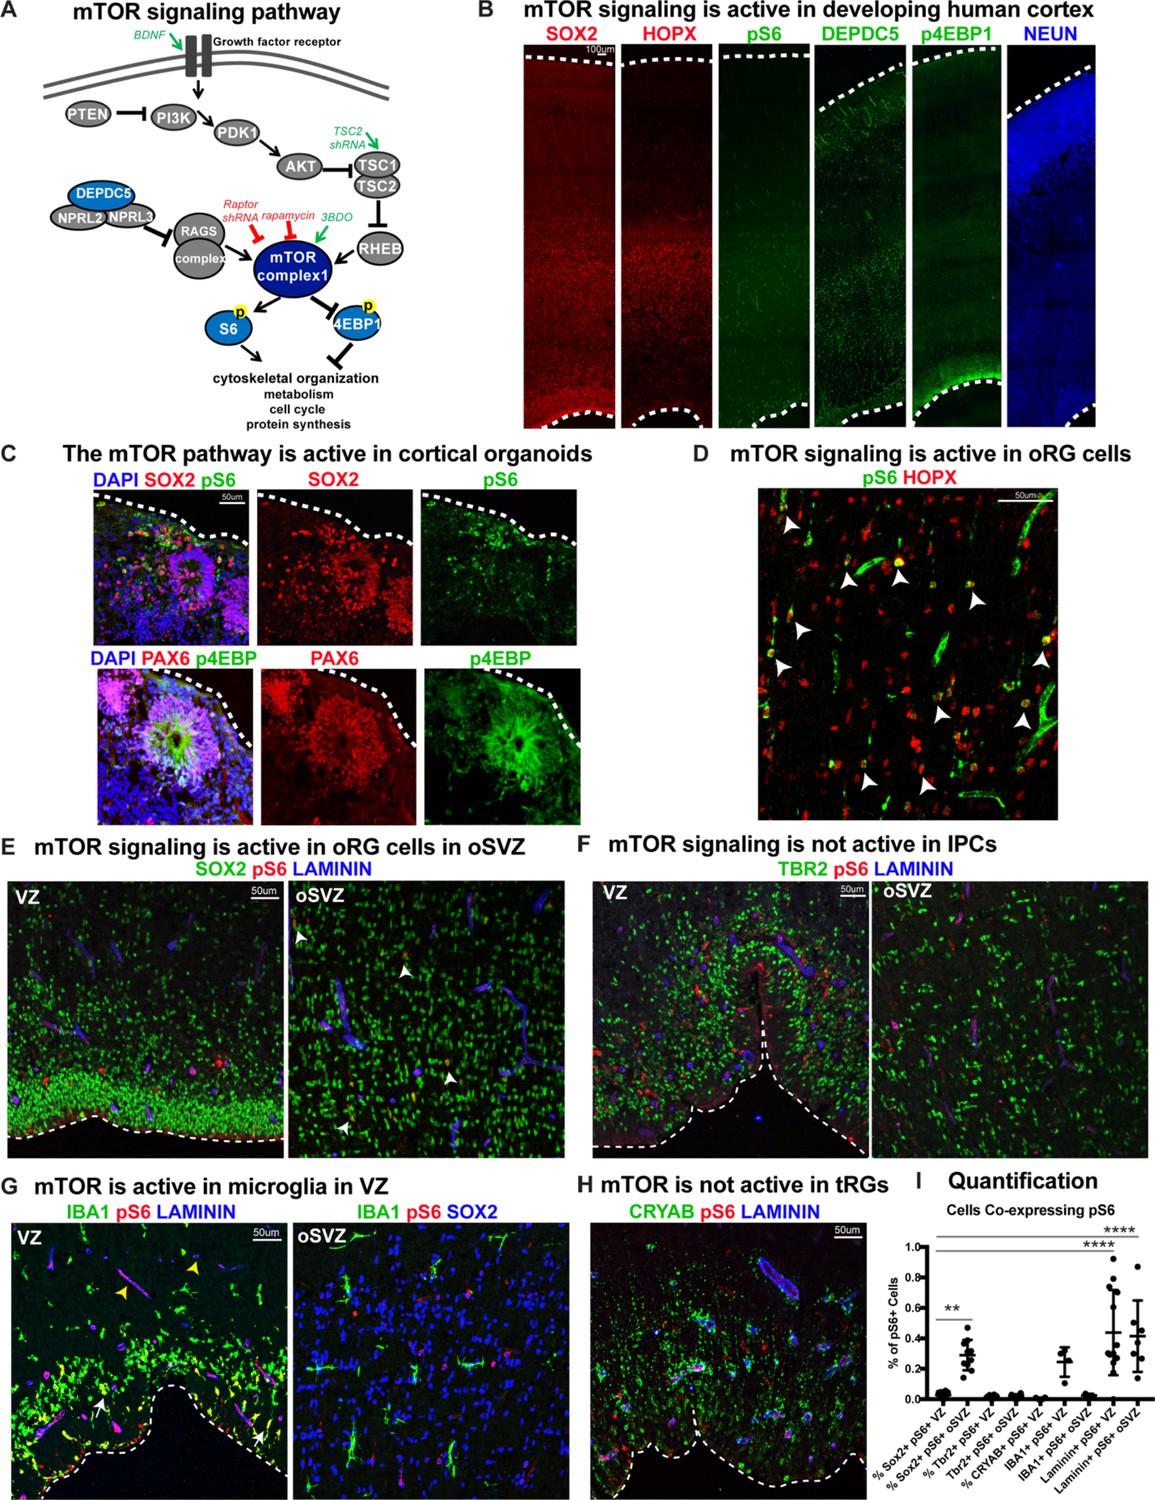
mTOR signaling is active in outer radial glial cells, but not other neural progenitor types, during human cortical development.
(A) Simplified schematic of the mTORC1 signaling pathway. mTOR signaling has many mediators and regulates diverse processes throughout development. Experimental approaches to mTOR manipulation are included in the diagram. Green text indicates activation and red indicates inhibition. (B) Radial glia expressing SOX2, oRG cells expressing HOPX and neurons expressing NEUN are present during human corticogenesis at GW17-19. mTOR signaling is active in the cortex at this time, indicated by the presence of phosphorylated S6 (pS6) protein. Other mTOR pathway proteins like DEPDC5 and p4EBP1 are also expressed during this period. (C) mTOR pathway proteins are also expressed and active in the radial glia of eight week old cortical organoids. (D) pS6 is present in many, but not all, oRG cells in the oSVZ of the developing human cortex, indicating active mTOR signaling. White arrowheads indicate oRG cells co-expressing pS6 and HOPX. (E) pS6 is absent in SOX2+ vRGs in the VZ but present in laminin-expressing blood vessels. Of the neural progenitor populations, only SOX2+ oRG cells in the oSVZ co-express pS6 (white arrowheads). (F) pS6 is absent in TBR2+ IPCs in both the VZ and the oSVZ. (G) mTOR signaling is active in IBA1+ microglia (white arrows) and laminin+ blood vessels at the VZ (yellow arrowheads). However, in the oSVZ there is little mTOR activity in the microglia, but extensive co-labeling of SOX2+ oRG cells. (H) CRYAB+ tRGs do not express pS6. (I) Quantification of pS6+ cells co-labeled with each marker, SOX2, TBR2, CRYAB, LAMININ and IBA1, at the VZ or oSVZ expressed as a percentage of the total number of pS6+ cells. Significant mTOR activity is present only in the SOX2+ oRG cells in the oSVZ and in the laminin+ blood vessels in the VZ and oSVZ. (n = 28 sections from 3 individuals across eight independent experiments; D’Agostino-Pearson normality test: normally distributed; one way ANOVA with multiple comparisons: SOX2+ VZ vs SOX2+ oSVZ: **p<0.0031; SOX2 VZ vs Laminin VZ, Laminin oSVZ: ****p<0.0001; Scatter plot with individual data points, error bars indicate SD and the middle line is the mean).
Figure 2 with 5 supplements
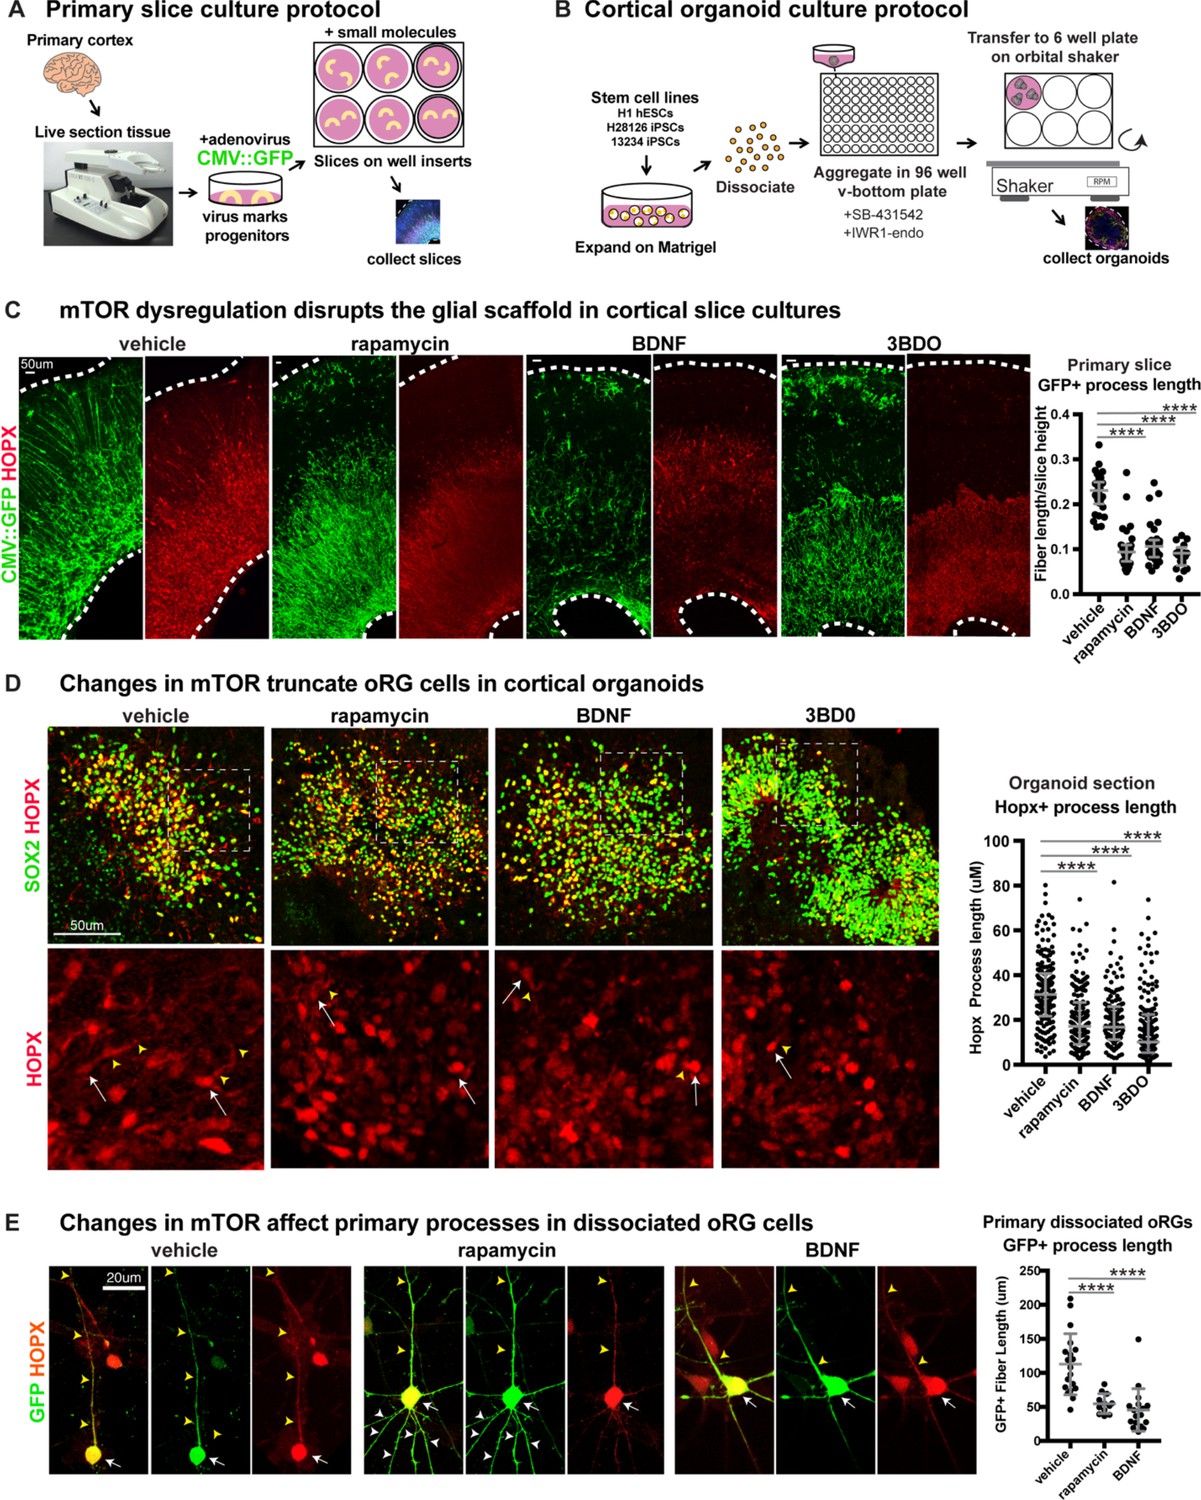
Manipulating mTOR signaling disrupts the glial scaffold in primary cortical cultures and organoids.
(A) Primary cortical tissue was acutely sectioned and cultured at the air-liquid interface. Small molecules were added the next day and cultured tissue slices were collected six days later. (B) Human pluripotent stem cells were dissociated and aggregated in medium inhibiting Smad and Wnt signaling to promote forebrain induction of cortical organoids. Small molecules were added at five weeks and organoids collected at 10 weeks. (C) Changes to mTOR signaling result in GFP+ HOPX+ glial scaffold disruption in primary cultures. Following mTOR manipulation with rapamycin, 3BD0 and BDNF, the length of GFP+ radial fibers in the oSVZ is significantly reduced (n = 10 vehicle, n = 9 rapamycin, n = 9 BDNF, n = 5 3BDO treated slices from >5 independent experiments; D’Agostino Pearson Normality Test: not normally distributed; Kruskal-Wallis Test: rapamycin: ****p<0.0001, BDNF: ****p<0.0001, ****3BD0: p<0.0001, median with interquartile range shown). (D) Manipulations of mTOR signaling result in HOPX+ oRG fiber truncation and changes to morphology in week 10 cortical organoids. White arrows indicate the cell body and yellow arrowheads illustrate process length. The length of the basal process is significantly smaller in HOPX expressing oRG cells (n = 171 control, n = 156 rapamycin, n = 141 BDNF and n = 162 3BD0 HOPX+ cells each from six organoids/group from three PSC lines; D’Agostino Pearson Normality Test: not normally distributed; Kruskal-Wallis Test: rapamycin: ****p<0.0001, BDNF: ****p<0.0001, ****3BD0: p<0.0001, median with interquartile range shown). (E) Primary dissociated oRG cells treated with mTOR modulators have shorter HOPX+ primary fibers and protrusion of other inappropriate processes. White arrows indicate cell body, yellow arrowheads indicate primary process and white arrowheads other processes (n = 19 vehicle, 12 rapamycin and 18 BDNF treated progenitor cells from three independent experiments; D’Agostino Pearson Normality Test: normally distributed; one-way ANOVA: rapamycin: ****p<0.0001, BDNF: ****p<0.0001; error bars represent SD).
Figure 2—figure supplement 1
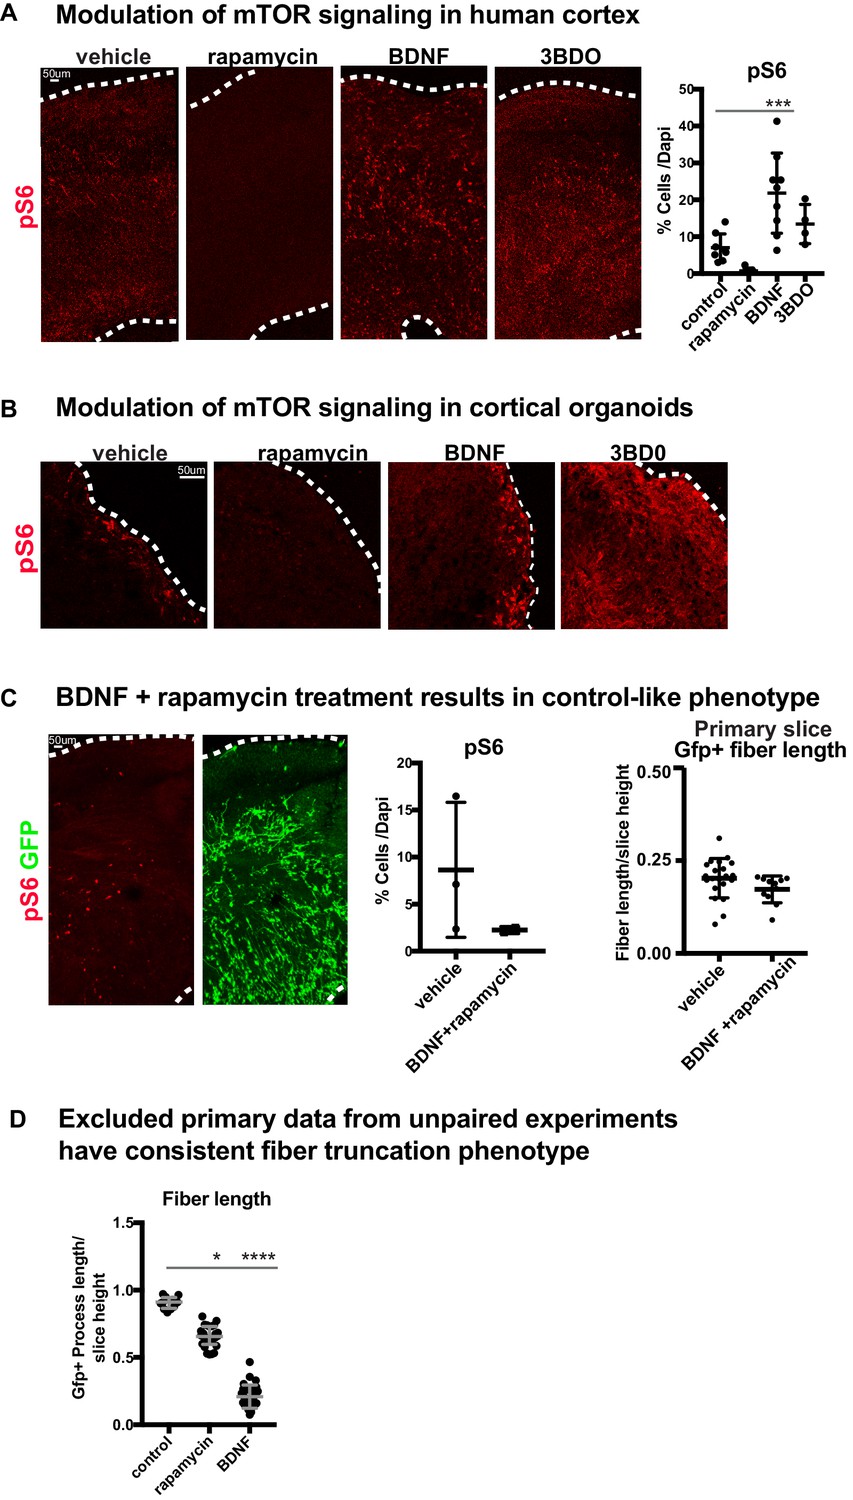
Manipulations of mTOR can be monitored through changes to pS6.
(A) pS6 is detected in the oSVZ in primary human slice cultures. After rapamycin treatment, there is very little pS6 detected. BDNF or 3BDO treatments increase pS6 levels throughout the culture (n = 8 control, n = 7 rapamycin, n = 8 BDNF and n = 4 3 BDO-treated slices from four independent experiments; one-way ANOVA: p=0.314 rapamycin, ***p<0.0001 BDNF, p=0.438 3BD0, error bars represent SD). (B) In week 10 organoids, pS6 is present at the edge of the organoid and rapamycin treatment results in complete loss of pS6. BDNF modestly increases pS6 levels, while 3BDO treatment increases pS6 throughout the organoid (n = 6 control, rapamycin, BDNF and 3BDO-treated organoids from three PSC lines). (C) When organotypic primary slice cultures are treated with BDNF and rapamycin together, pS6 expression returns to control-like levels (n = 3 slices control, n = 2 slices BDNF+rapamycin across two independent experiments; unpaired student’s t-test: p=0.22, error bars represent SD). GFP+ fiber organization improves compared to either mTOR manipulation alone (n = 21 control cells, n = 11 BDNF+rapamycin cells; unpaired student's t-test: p=0.102, error bars represent SD). (D) Due to limited access to primary human tissue, some experimental data in human slices did not include paired-controls or were missing some treatment conditions. These data were excluded from the main study. Nonetheless, these experiments demonstrated the same phenotype; GFP+ basal process length was reduced after mTOR manipulation (n = 12 control cells from two slices, n = 26 rapamycin cells from three slices and n = 28 BDNF cells across four slices; D’Agostino Pearson Normality Test: not normally distributed; Kruskal-Wallis Test: rapamycin: *p<0.0137, BDNF: ****p<0.0001, median with interquartile range shown).
-
Figure 2—figure supplement 1—source data 1
- https://cdn.elifesciences.org/articles/58737/elife-58737-fig2-figsupp1-data1-v1.xlsx
Figure 2—figure supplement 2
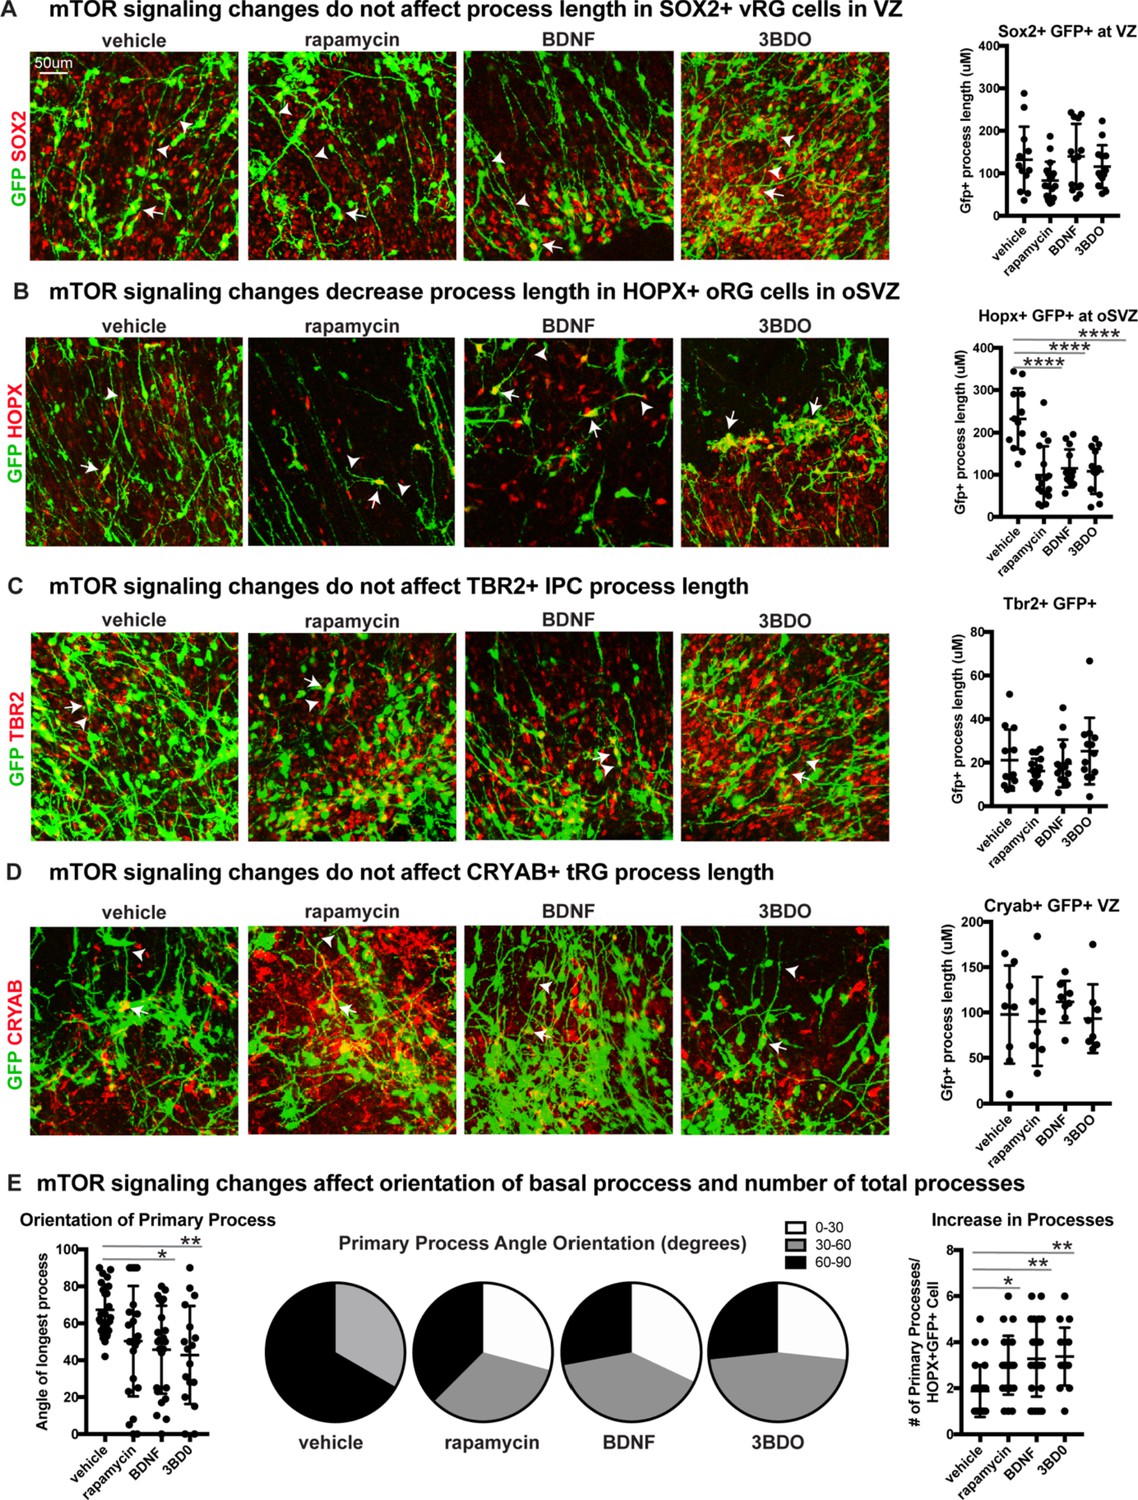
mTOR signaling has functional effects only on oRG progenitor cells.
(A) mTOR signaling was manipulated using rapamycin, BDNF or 3BD0 in primary organotypic slice cultures infected with a CMV::GFP adenovirus to label the glial scaffold. There is no significant change to the GFP+ process length of SOX2+ GFP+ ventricular radial glia in the VZ (n = 12 vehicle, n = 17 rapamycin, n = 13 BDNF, n = 13 3BD0 cells across three independent experiments; D’Agostino Pearson Normality Test: normally distributed; one-way ANOVA with multiple comparisons: rapamycin: p=0.172, BDNF: p=0.990, p=0.912, error bars represent SD). White arrows indicate GFP+SOX2+ cell body and white arrowheads indicate process length. (B) There is a significant reduction in the length of HOPX+GFP+ basal processes in oRG cells in the oSVZ, in all mTOR treatment groups (n = 12 vehicle, n = 17 rapamycin, n = 13 BDNF, n = 13 3BD0 cells across three independent experiments; D’Agostino Pearson Normality Test: normally distributed; one-way ANOVA with multiple comparisons, rapamycin: ****p<0.0001; BDNF: ****p<0.0001; 3BD0: ****p<0.0001, error bars represent SD). White arrows indicate GFP+HOPX+ cell body and white arrowheads indicate process length. (C) Manipulation of mTOR signaling does not affect process length in TBR2+GFP+ intermediate progenitor cells (n = 12 vehicle, n = 17 rapamycin, n = 13 BDNF, n = 13 3BD0 cells n > 4 cells/slice across three independent experiments; D’Agostino Pearson Normality Test: not normally distributed; Kruskal-Wallis test with multiple comparisons: rapamycin: p>0.999, BDNF: p>0.999, 3BD0: p>0.999, error bars indicate SD). White arrows indicate GFP+TBR2+ cell body and white arrowheads indicate process length. (D) Changes to mTOR signaling do not affect fiber length in CRYAB+ GFP+ truncated radial glia (n = 8 vehicle, n = 7 rapamycin, n = 8 BDNF, n = 8 3BD0 across three independent experiments; D’Agostino Pearson Normality Test: not normally distributed; Kruskal-Wallis test with multiple comparisons: rapamycin: p>0.999, BDNF: p>0.999, 3BD0: p>0.999, error bars indicate SD). White arrows indicate GFP+CRYAB+ cell body and white arrowheads indicate process length. (E) Angle of primary process compared to the ventricular surface (0–90 degrees). mTOR manipulations affect the orientation of the basal fiber and decrease the average angle orientation (n = 24 vehicle, n = 23 rapamycin, n = 24 BDNF, n = 17 3BD0 cells across three independent experiments; D’Agostino Pearson Normality Test: normally distributed; one-way ANOVA with multiple comparisons: rapamycin: p=0.08, BDNF: *p<0.0116, 3BD0: **p<0.0096, error bars represent SD). Data also represented in proportions of cells from 0 to 30, 30–60, or 60–90 degrees per treatment group in pie charts. mTOR manipulations increase the number of processes (n = 24 vehicle, n = 23 rapamycin, n = 24 BDNF, n = 17 3BD0 cells; D’Agostino Pearson Normality Test: not normally distributed; Kruskal-Wallis test with multiple comparisons: rapamycin: *p<0.0318, BDNF: **p<0.0037, 3BD0: **p<0.0053, error bars represent SD).
-
Figure 2—figure supplement 2—source data 1
- https://cdn.elifesciences.org/articles/58737/elife-58737-fig2-figsupp2-data1-v1.xlsx
Figure 2—figure supplement 3

Manipulating mTOR signaling does not affect progenitor or neuronal numbers in slice cultures.
(A) Activating or inhibiting mTOR in primary slice cultures has no effect on progenitor numbers There is no significant change in the numbers of SOX2+ progenitors, HOPX+ oRGs, or TBR2+ IPCs (SOX2: n = 7 vehicle, n = 10 rapamycin, n = 3 BDNF, n = 3 3BD0 slices across three independent experiments, one-way ANOVA with multiple comparisons: p=0.999 rapamycin, p=0.747 BDNF, p=0.299 3BD0; TBR2: n = 11 vehicle, n = 12 rapamycin, n = 5 BDNF, n = 3 3BD0 slices across >three independent experiments, one-way ANOVA with multiple comparisons: p=0.999 rapamycin, p=0.927 BDNF, p=0.649 3BD0; HOPX: n = 13 vehicle, 13 rapamycin, n = 4 BDNF, n = 3 3BD0 across >three independent experiments, one-way ANOVA with multiple comparisons: p=0.932 rapamycin, p>0.999 BDNF, p=0.9981 3BD0, error bars represent SD). (B) Activating or inhibiting mTOR in primary slice cultures has no effect on SATB2+ upper layer neurons (one-way ANOVA with multiple comparisons: p=0.932 rapamycin, p>0.999 BDNF, p=0.9981 3BD0; SATB2: n = 3 slices/group, one-way ANOVA with multiple comparisons: p=0.950 rapamycin, p=0.908 BDNF, p=0.993 3BD0, error bars represent SD).
-
Figure 2—figure supplement 3—source data 1
- https://cdn.elifesciences.org/articles/58737/elife-58737-fig2-figsupp3-data1-v1.xlsx
Figure 2—figure supplement 4

Effects of mTOR manipulations are variable across PSC lines and conditions resulting in little overall effect on progenitor and neuron numbers.
(A) Three PSC lines were used for organoid studies: 13234, H2826 (iPSCs) and H1 (hESC). The number of cells positive for each marker was counted and then normalized to organoid size. Hyperactivating mTOR signaling has modest effects on progenitor numbers in week 10 organoids, but these effects were not consistent across all iPSC lines or conditions. There was no change to SOX2+ progenitors, except for a small increase in the 3BD0 condition derived from the 13234 iPSC line (SOX2: n = 17 13234 control, n = 26 H1-control, n = 14 H28126-control, n = 14 13234 rapamycin, n = 26 H1 rapamycin, n = 12 H28126 rapamycin, n = 11 13234 BDNF, n = 22 H1 BDNF, n = 14 H28126 BDNF, n = 22 13234 3BD0, n = 18 H1 3BD0, n = 14 H28126 3BD0 sections from >2 organoids/line across three independent experiments; one-way ANOVA with multiple comparisons: 13234 line: control vs rapamycin p=0.386, control vs BDNF p=0.189, control vs 3BD0 **p<0.0027; H1 line: control vs rapamycin p=0.999, control vs BDNF: p=0.630, control vs 3BD0: p=0.627; H28126 line: control vs rapamycin: p=0.927, control vs BDNF: p=0.999, control vs 3BD0: p=0.417, error bars represent SD). There was an inconsistent change to TBR2+ IPCs in the gain of function conditions in two iPSC lines, where both increase, decrease, and no change in numbers were observed (TBR2: n = 17 13234 control, n = 26 H1-control, n = 14 H28126-control, n = 14 13234 rapamycin, n = 26 H1 rapamycin, n = 12 H28126 rapamycin, n = 11 13234 BDNF, n = 22 H1 BDNF, n = 14 H28126 BDNF, n = 22 13234 3BD0, n = 18 H1 3BD0, n = 14 H28126 3BD0 sections; one-way ANOVA with multiple comparisons: 13234 line: control vs rapamycin p=0.433, control vs BDNF **p>0.004, control vs 3BD0 ***p<0.0001; H1 line: control vs rapamycin p=0.913, control vs BDNF p=0.404, control vs 3BD0 p=0.070; H28126 line: control vs rapamycin p=0.05, control vs BDNF **p<0.004, control vs 3BD0 *p<0.018, error bars represent SD). Overall, there was little effect on HOPX+ oRG number, but a small decrease was observed in mTOR activation conditions in two lines (n = 17 13234 control, n = 26 H1-control, n = 14 H28126-control, n = 14 13234 rapamycin, n = 26 H1 rapamycin, n = 12 H28126 rapamycin, n = 11 13234 BDNF, n = 22 H1 BDNF, n = 14 H28126 BDNF, n = 22 13234 3BD0, n = 18 H1 3BD0, n = 14 H28126 3BD0 sections from >2 organoids/line across three independent experiments; one-way ANOVA with multiple comparisons: 13234 line: control vs rapamycin: p=0.599, control vs BDNF p=0.579, control vs 3BD0 **p<0.004; H1 line: control vs rapamycin p=0.9950, control vs BDNF p=0.956, control vs 3BD0 p=0.726; H28126 line: control vs rapamycin p=0.717, control vs BDNF **p<0.007, control vs 3BD0 *p<0.022, error bars represent SD). Organoid images shown are derived from the 13234 iPSC line. (B) There are modest and inconsistent changes to neuronal populations in organoids. There is a small increase in CTIP2+ cells in the rapamycin treatment group of the H1 stem cell line and the 3BD0 group in the 13234 line, while there is a decrease in the H28126 line in all mTOR manipulation groups. (CTIP2: n = 15 13234 control, n = 8 H1-control, n = 16 H28126-control, n = 6 13234 rapamycin, n = 17 H1 rapamycin, n = 11 H28126 rapamycin, n = 11 13234 BDNF, n = 25 H1 BDNF, n = 17 H28126 BDNF, n = 7 13234 3BD0, n = 24 H1 3BD0, n = 8 H28126 3BD0 sections from >2 organoids/line across three independent experiments; one-way ANOVA with multiple comparisons: 13234 line: control vs rapamycin p=0.959, control vs BDNF p=0.733, control vs 3BD0 **p<0.004; H1 line: control vs rapamycin ***p<0.0006, control vs BDNF p=0.130, control vs 3BD0 p=0.291, H28126 line: control vs rapamycin, BDNF, 3BD0 ****p<0.0001, error bars represent SD). There is a decrease in CUX1+ neurons across mTOR manipulations in the H28126 line, but no change in organoid derived from other lines (CUX1: n = 15 13234 control, n = 8 H1-control, n = 16 H28126-control, n = 6 13234 rapamycin, n = 17 H1 rapamycin, n = 11 H28126 rapamycin, n = 11 13234 BDNF, n = 25 H1 BDNF, n = 17 H28126 BDNF, n = 7 13234 3BD0, n = 24 H1 3BD0, n = 8 H28126 3BD0 sections from >2 organoids/line across three independent experiments; one-way ANOVA with multiple comparisons: 13234 line: control vs rapamycin p=0.052, control vs BDNF p=0.617, control vs 3BD0 p=0.988; H1 line: control vs rapamycin p=0.130, control vs BDNF p=0.439, control vs 3BD0 p=0.763; H28126 line: control vs rapamycin: ***p<0.0005, control vs BDNF, 3BD0 ****p<0.0001, error bars represent SD). Organoid images shown are derived from the H1 ESC line.
-
Figure 2—figure supplement 4—source data 1
- https://cdn.elifesciences.org/articles/58737/elife-58737-fig2-figsupp4-data1-v1.xlsx
Figure 2—figure supplement 5
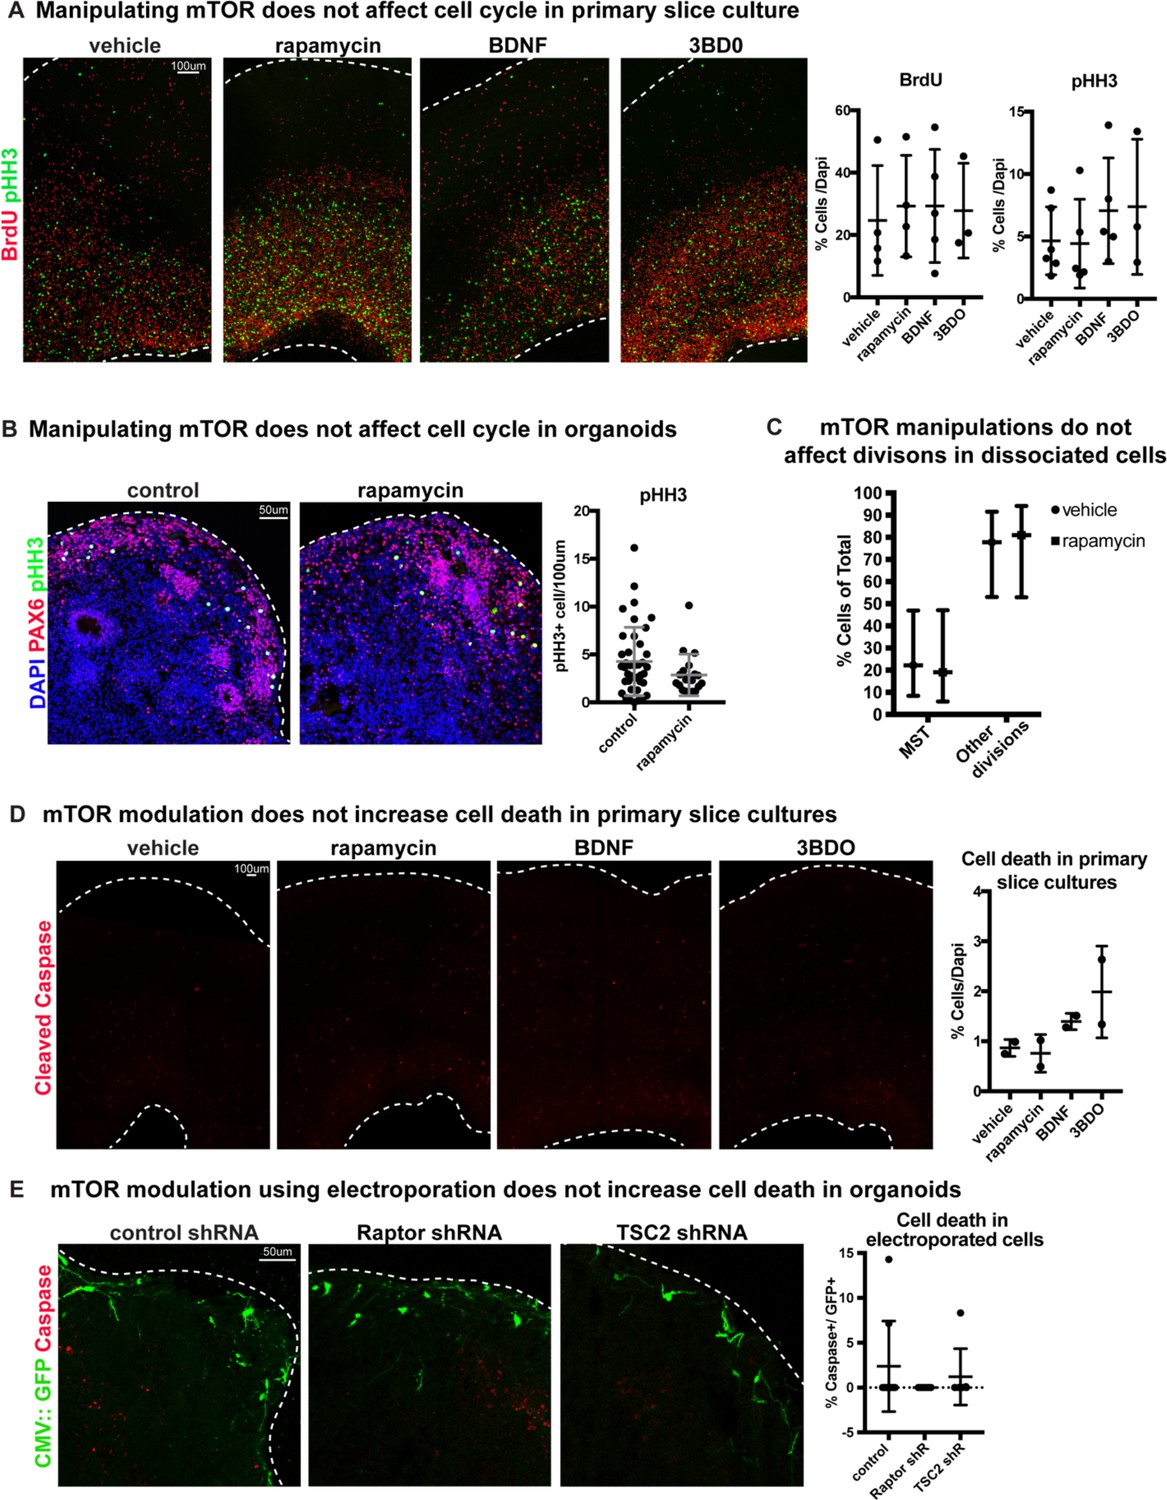
Changes to mTOR signaling do not affect cell cycle or cell death.
(A) Manipulating mTOR signaling has no effect on BrdU+ progenitor cells during synthesis (S-phase) or pHH3+ mitotic (M-phase) cells in primary slice cultures (BrdU: n = 4 vehicle, n = 4 rapamycin, n = 5 BDNF, n = 3 3BD0 slices, across >three independent experiments; one-way ANOVA: p=0.908 rapamycin, p=0.977 BDNF, p=0.995 3BD0; pHH3: n = 6 vehicle, n = 5 rapamycin, n = 5 BDNF, n = 3 3BD0 across >three independent experiments, one-way ANOVA: p=0.997 rapamycin, p=0.726 BDNF, p=0.745 3BD0, error bars represent SD). (B) Inhibiting mTOR signaling has no effect on the number of mitotic pHH3+ cells in week 10 organoids. Counts were normalized to organoid size (n = 40 control and n = 19 sections from four organoids; unpaired student’s t-test p=0.118, error bars represent SD). (C) Rapamycin treatment has no effect on the ability of cells to divide and does not change the frequency of oRG MST in dynamically imaged primary radial glia (n = 27 vehicle, n = 21 rapamycin cells across two independent experiments, two-tailed student’s t-test: p=0.99, error bars SD). (D) Manipulating mTOR signaling pharmacologically does not increase the prevalence of cleaved caspase-3 in any condition (n = 2 slices/group, one-way ANOVA: p=0.996 rapamycin, p=0.741 BDNF, p=0.2664 3BD0, error bars represent SD). (E) Electroporation of mTOR shRNA constructs does not increase the number of GFP+ cleaved caspase+ cells compared to control electroporations in week 10 organoids (n = 9 control, n = 7 Raptor shRNA, n = 7 TSC2 shRNA sections from four organoids/group, one-way ANOVA: p=0.415 Raptor, p=0.798 TSC2, error bars represent SD).
-
Figure 2—figure supplement 5—source data 1
- https://cdn.elifesciences.org/articles/58737/elife-58737-fig2-figsupp5-data1-v1.xlsx
Figure 3 with 1 supplement
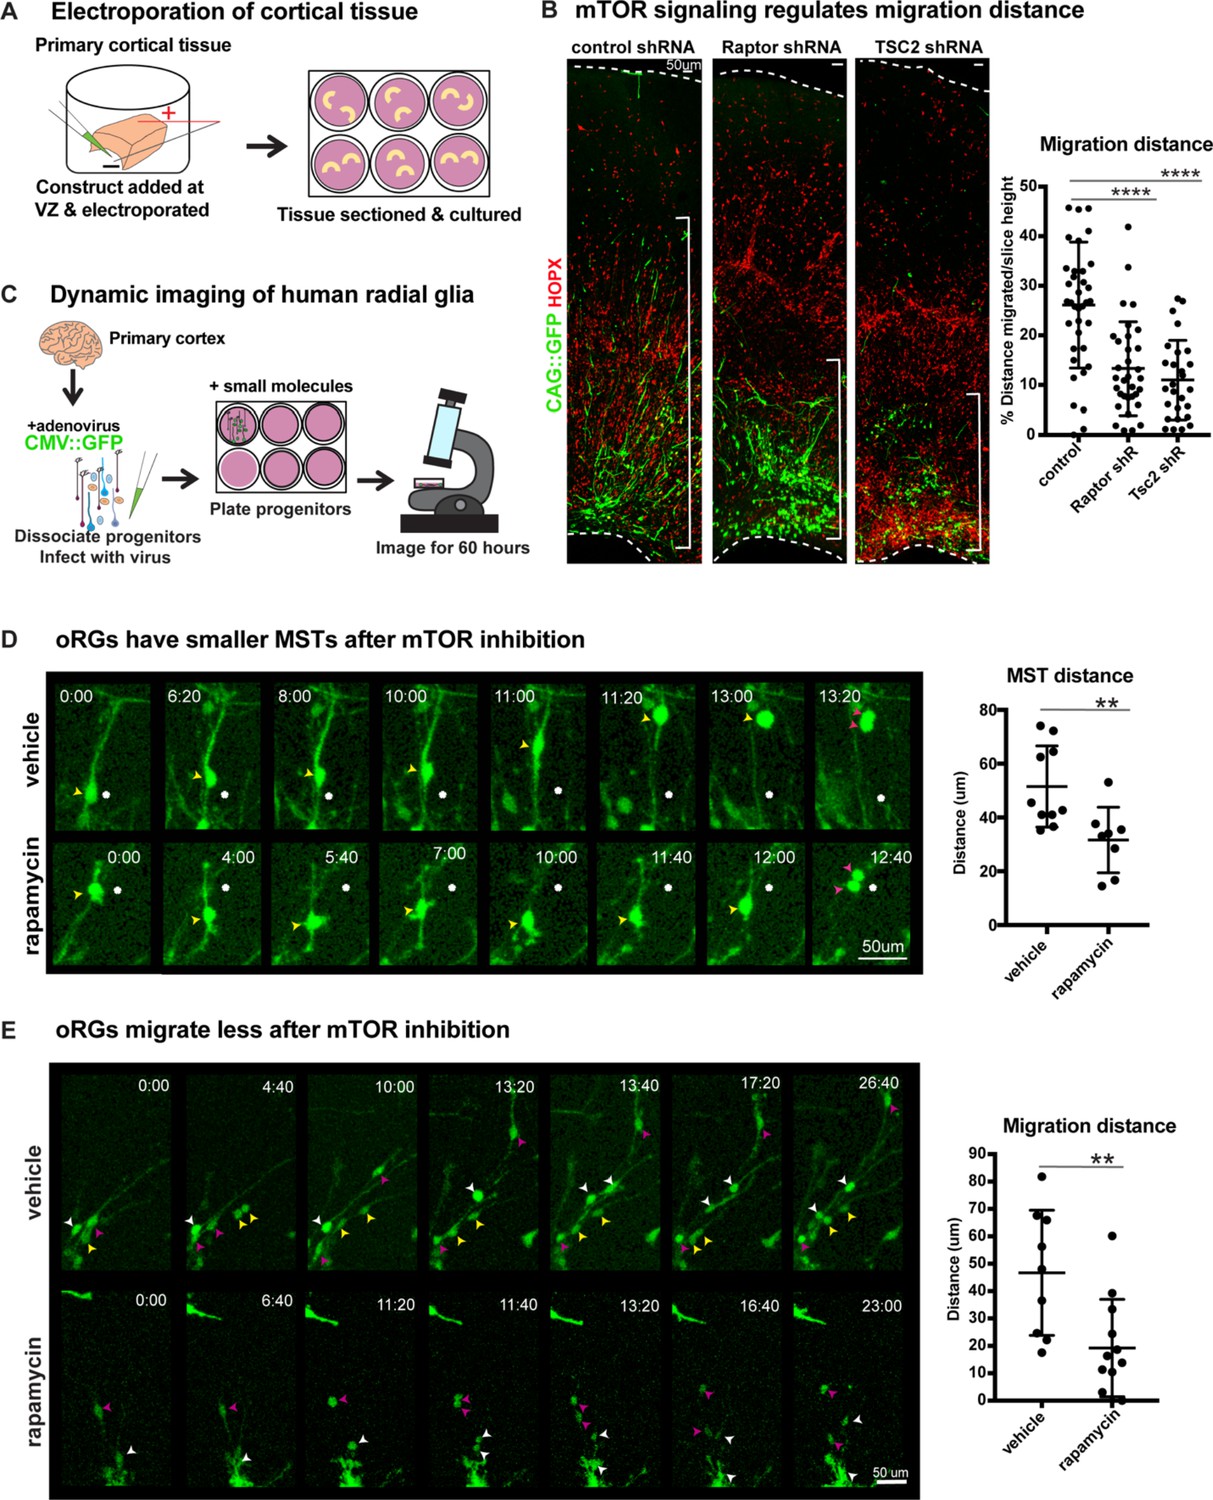
Manipulation of mTOR signaling results in migration defects.
(A) shRNAs were delivered along and electroporated onto the ventricular surface of primary cortical tissue which was then acutely sectioned and cultured for six days prior to collection. (B) After electroporation of RPTOR or TSC2 shRNAs, GFP+ HOPX+ oRGs migrate less from the ventricular edge (n = 37 control, n = 33 Raptor and n = 27 TSC2-shRNA electroporated GFP+Hopx+ cells from three independent experiments; D’Agostino Pearson Normality Test: normally distributed; one-way ANOVA with multiple comparisons: Raptor shRNA: ****p<0.0001, TSC2 shRNA: ****p<0.0001, error bars represent SD). The distance of each HOPX+ GFP+ cell away from the VZ edge was measured as indicated by white brackets. (C) For dynamic imaging studies, primary cortical tissue was collected, dissociated, infected with a CMV::GFP adenovirus, and plated on glass-bottom 12 well plates. Small molecules were added one day later, two hours before the start of dynamic imaging. (D) GFP+ oRG cells undergo division via MST. Yellow arrowheads indicate cell body, white dot indicates initial position of cell body and pink arrowheads indicate two cell bodies after division. After inhibition of mTOR signaling oRG cells have shorter MSTs (n = 10 control and n = 8 rapamycin cells across two independent experiments; D’Agostino Pearson Normality Test: normally distributed; unpaired two-tailed student’s t-tests: **p<0.0082, error bars represent SD). (E) oRGs migrate less from their original position after mTOR inhibition (n = 9 vehicle treated and n = 12 rapamycin treated cells from two independent experiments; D’Agostino Pearson Normality Test: normally distributed; unpaired two-tailed student’s t-tests: **p<0.0058 error bars represent SD). White, yellow, and pink arrowheads indicate cell bodies at starting time-point. Multiple arrowheads of the same color over time indicate daughter cells from the same parent cell.
Figure 3—figure supplement 1
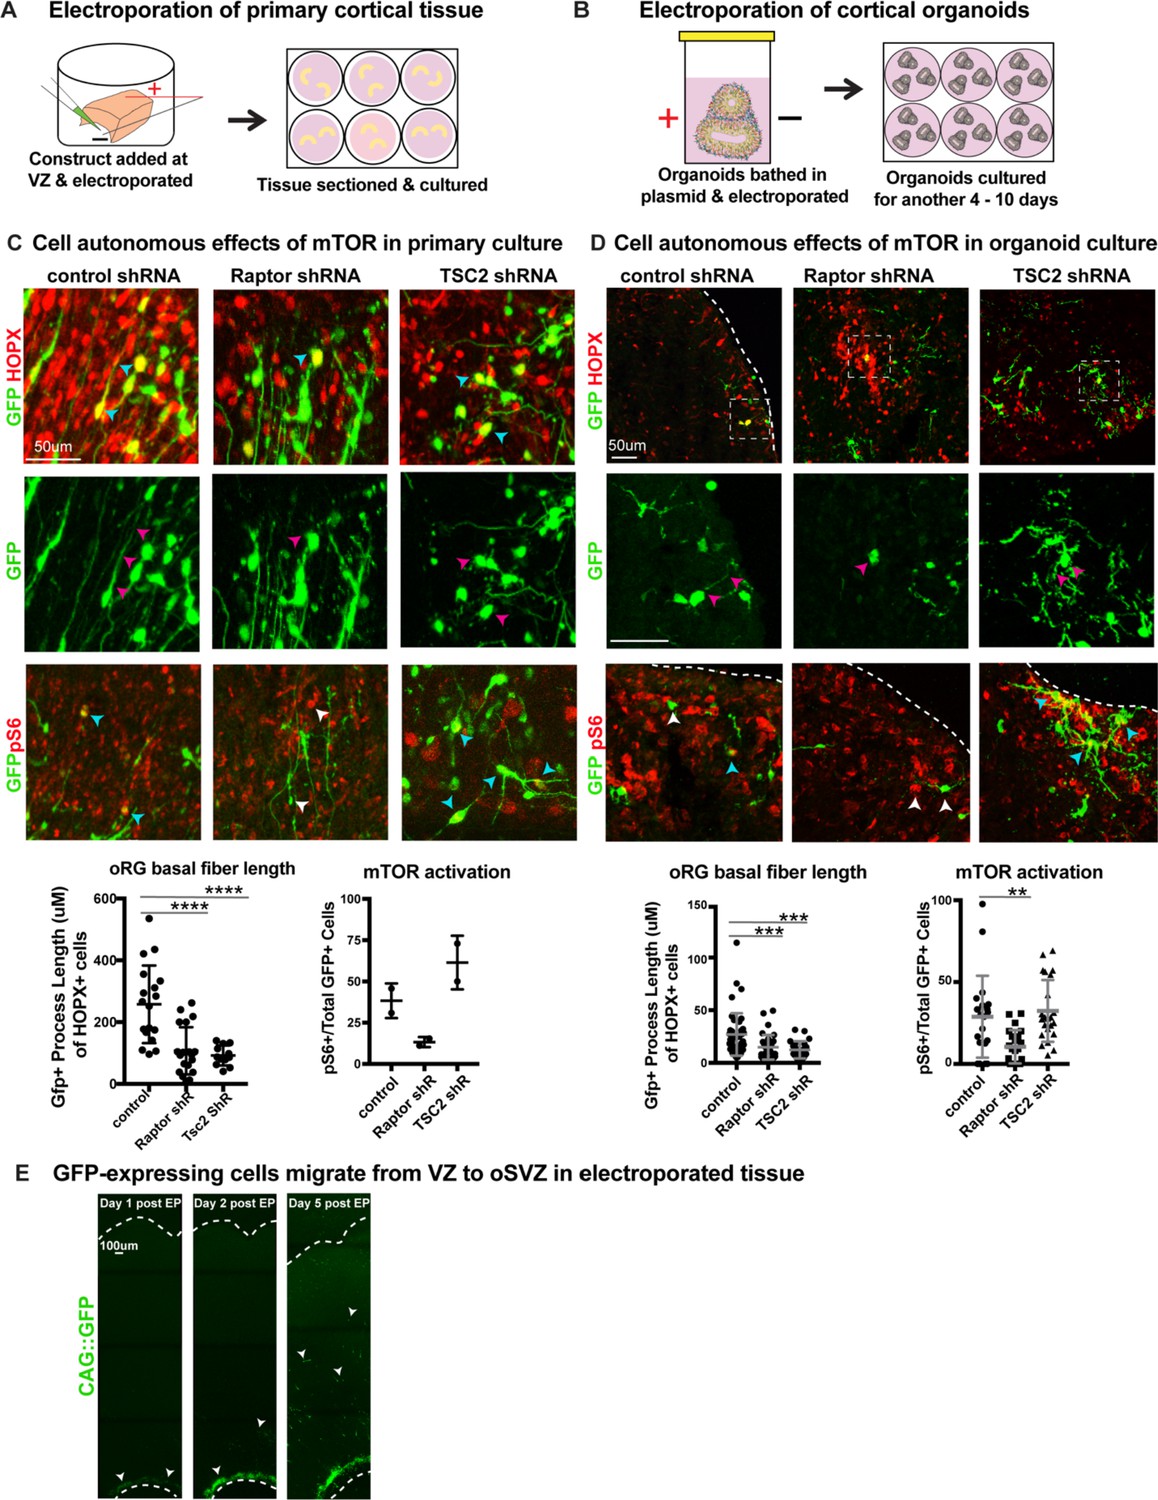
shRNAs against mTOR pathway components cell autonomously regulate oRG process length.
(A) shRNAs were delivered along the ventricle of primary cortical tissue which was acutely sectioned and cultured for six days prior to collection. (B) Organoids were bathed in medium containing shRNAs, electroporated inside a cuvette and then cultured for 4–10 days prior to collection. (C) Electroporation of either RPTOR or TSC2 shRNAs resulted in a decrease in the length of the GFP+ basal process in HOPX positive cells (n = 19 control, 20 Raptor and 12 TSC2-shRNA electroporated GFP+Hopx+ cells from three independent experiments, one-way ANOVA: ****p<0.0001 Raptor, ****p<0.0001 TSC2, error bars represent SD). RPTOR electroporation resulted in a decrease in mTOR signaling indicated by fewer pS6+GFP+ cells, while TSC2 electroporation resulted in an increase in pS6+GFP+ cells (n = 2 tissue slices from two independent experiments; error bars represent SD). Cyan arrowheads indicate GFP+HOPX+ or GFP+pS6+ cells and white arrowheads indicate cells that express either GFP or pS6. Magenta arrowheads indicate the basal processes of GFP+ cells. (D) Electroporation of RPTOR and TSC2 shRNAs in week 8–10 cortical organoids. RPTOR and TSC2 shRNA electroporation decreased the GFP+ primary process length in oRG cells (n = 49 control, n = 39 Raptor, n = 27 TSC2 electroporated GFP+HOPX+ cells from nine organoids per condition across four independent experiments, one-way ANOVA: ***p<0.0009 Raptor, ***p<0.0003 TSC2, error bars represent SD). There were fewer pS6+ GFP+ cells after RPTOR shRNA electroporation, while TSC2 electroporation did not significantly affect the number of pS6+GFP+ cells in the organoid (n = 21 control, n = 22 Raptor, n = 23 TSC2 sections from nine organoids per condition across four independent experiments; one-way ANOVA: **p<0.0065 Raptor, p=0.8 TSC2, error bars represent SD). Cyan arrowheads indicate GFP+HOPX+ or GFP+pS6+ cells and white arrowheads indicate cells that express either GFP or pS6. Magenta arrowheads indicate the basal processes of GFP+ cells. (E) Constructs are dropped along the ventricular edge of intact primary tissue and pulsed with electricity before sectioning and culturing. GFP+ electroporated cells (white arrowheads) are initially restricted to the ventricular edge demonstrated by their position one and two days post- electroporation. By five days post-electroporation GFP+ cells from the ventricular edge have migrated to the oSVZ (n > 2 slices/group across two independent experiments).
-
Figure 3—figure supplement 1—source data 1
- https://cdn.elifesciences.org/articles/58737/elife-58737-fig3-figsupp1-data1-v1.xlsx
Figure 4 with 1 supplement
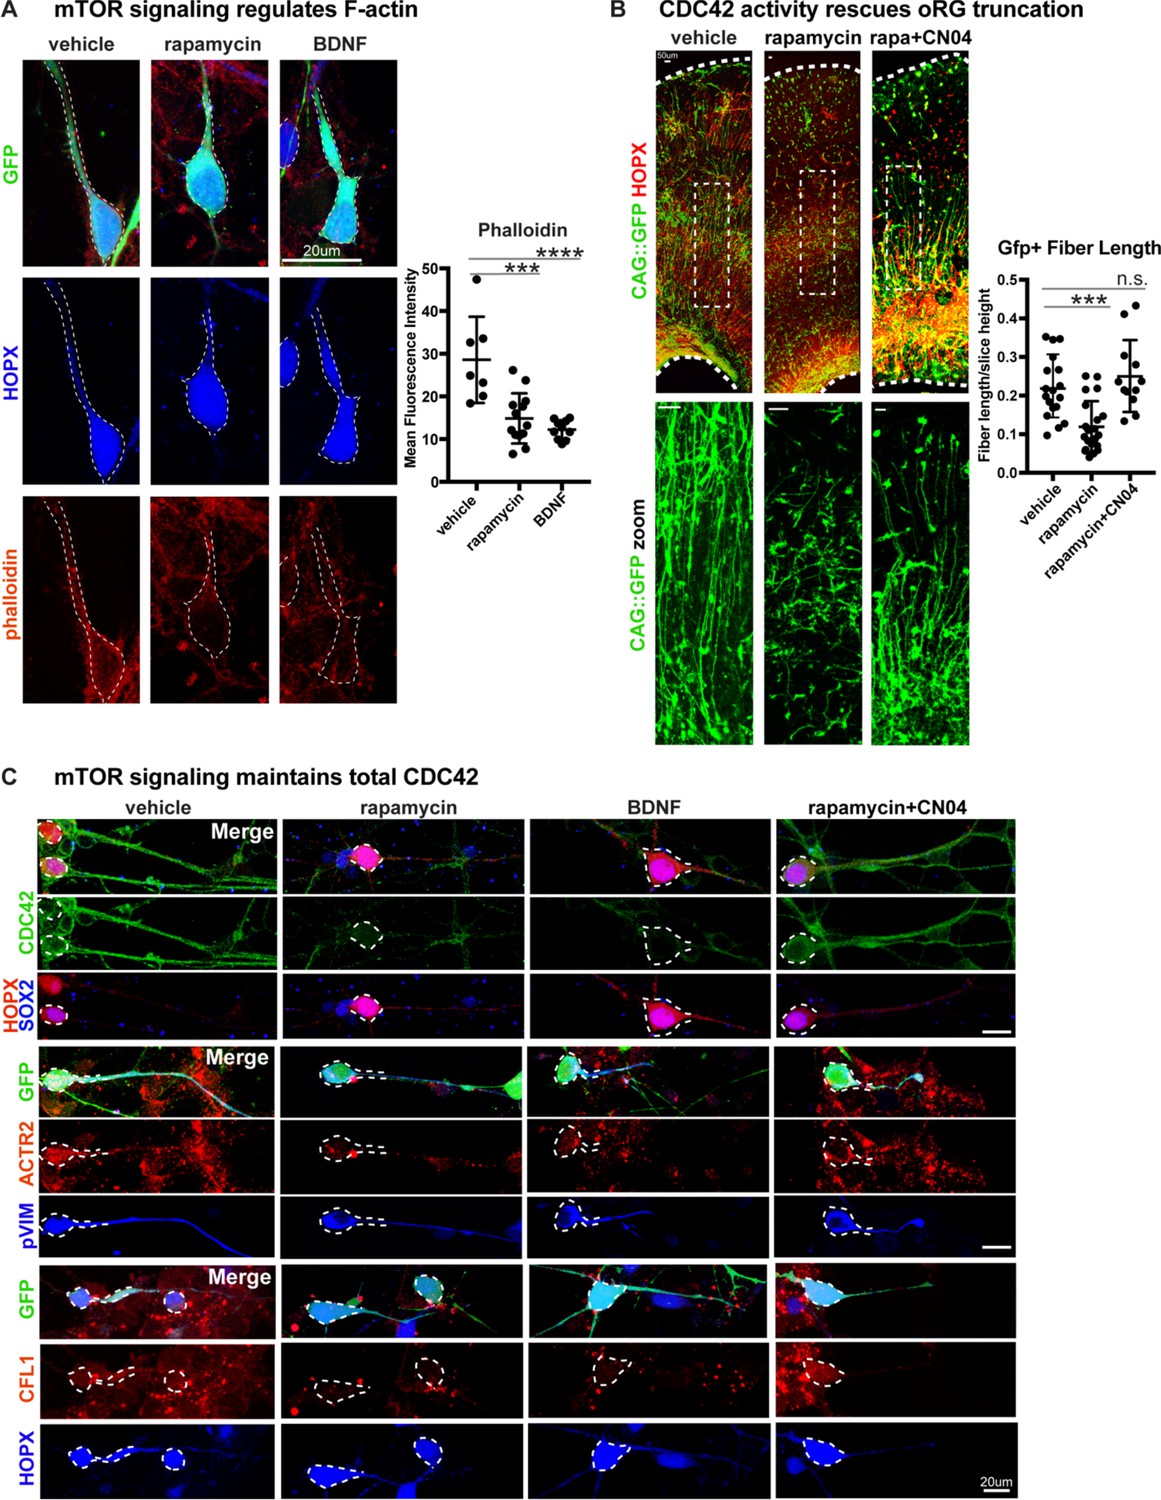
Radial fiber truncation from mTOR dysregulation is mediated by actin and rescued by CDC42/RAC1 activation.
(A) Changes in mTOR signaling decrease the - F-actin in oRG cells as indicated by the reduced intensity of phalloidin-rhodamine staining (n = 7 control, n = 13 rapamycin, n = 10 BDNF cells from three independent experiments; D’Agostino Pearson Normality Test: normally distributed; one-way ANOVA with multiple comparisons: rapamycin: ***p<0.0002, BDNF: ****p<0.0001, error bars represent SD). (B) mTOR loss disrupts oRG fiber length, which can be rescued by Rho-GTPase activation using CN04 (slice culture GFP+ fiber length: n = 18 control, n = 21 rapamycin and n = 12 CN04+rapamycin-treated cells from n > 4 slices/group across three independent experiments; D’Agostino Pearson Normality Test: normally distributed; one-way ANOVA with multiple comparisons: rapamycin: ***p<0.0007, rapamycin+CN04: p=0.5097, error bars represent SD). (C) The Rho-GTPase CDC42 is expressed in primary dissociated oRG cells, but protein abundance decreases after manipulation of mTOR signaling. Mediators of CDC42 activity, including ACTR2 and CFL1, are also present in dissociated oRG cells. Levels of ACTR2 and CFL1 protein decrease after mTOR manipulation, but can be restored after activation of Rho-GTPases with CN04 (five independent experiments).
Figure 4—figure supplement 1

mTOR signaling modulation changes CDC42 and RAC1 activity.
(A) The VZ to oSZV progenitor domain from primary slice cultures, treated with rapamycin, BDNF, CN04 or CN04+rapamycin, were microdissected, isolated and protein extracted. Rho-GTPase activation assays demonstrate little baseline change to any Rho-GTPase after mTOR manipulation (CDC42: n = 7 vehicle, n = 7 rapamycin, n = 5 BDNF slice cultures across five independent experiments, one-way ANOVA: p=0.969 rapamycin, p=0.975 BDNF; RAC1: n = 4 slices/condition across four independent experiments, one-way ANOVA: p=0.43 rapamycin, p=0.51 BDNF; RHO A: n = 6 vehicle, n = 6 rapamycin, n = 2 BDNF slices, across four experiments, one-way ANOVA: p=0.67 rapamycin, p=0.979 BDNF, error bars represent SD). CN04 activates both CDC42 and RAC1. Co-treatment of slices with CN04 and rapamycin results in an intermediate level of activity of CDC42 showing interaction between the two pathways (CDC42: n = 6 slices/condition across five independent experiments, one-way ANOVA: ****p<0.0001 vehicle vs. CN04, *p<0.0268 CN04 vs CN04+rapamycin; RAC1: n = 4 slices/condition across four independent experiments, one-way ANOVA: ***p<0.0005 vehicle vs. CN04; p=0.056 CN04 vs CN04+rapamycin; RHO A: n = 6 vehicle, n = 4 CN04, n = 4 CN04+rapamycin; one-way ANOVA: p=0.302 vehicle vs. CN04, p=0.833 CN04 vs CN04+rapamycin, error bars represent SD). (B) Inhibiting mTOR signaling results in a reduction of downstream pS6. CN04 stabilizes CDC42 and rescues oRG morphology in mTOR inhibited slices. However, CN04 does not restore pS6 in rapamycin-treated slices, nor does CN04 treatment alone change pS6 levels (three slices/group across three independent experiments).
-
Figure 4—figure supplement 1—source data 1
- https://cdn.elifesciences.org/articles/58737/elife-58737-fig4-figsupp1-data1-v1.xlsx
Figure 5

Model of mTOR regulation of oRG morphology.
(A) Simplified model of mTOR signaling pathway activating the GTPases, CDC42 and RAC1 to regulate actin dynamics. (B) During normal development appropriate levels of mTOR signaling regulate oRG morphology, basal process length and migration behavior through activation of CDC42 and its targets, CFL1 and ACTR2. (C) When mTOR signaling is dysregulated the basal process is truncated and oRG cells have decreased levels of F-actin, CDC42, CFL1, and ACTR2. The oRG cells are mispositioned, the basal process does not reach the pial surface, and the glial scaffold is disrupted.
Tables
Key resources table
| Reagent type (species) or resource | Designation | Source or reference | Identifiers | Additional information |
|---|---|---|---|---|
| Cell line (Homo sapiens) | H1/WA01 embryonic stem cell line | WiCell | RRID:CVCL_9771 | Male |
| Cell line (Homo sapiens) | H28126 induced pluripotent stem cell line | Pollen et al., 2019 | Male | |
| Cell line (Homo sapiens) | 13234 induced pluripotent stem cell line | Bhaduri et al., 2020 | RRID:CVCL_0G84 | Female |
| Transfected construct (Homo sapiens) | CMV::GFP Adenovirus | Vector Biolabs, 1060 | 1:200 dilution | |
| Transfected construct (Aequorea victoria) | pCAG-EGFP | Subramanian et al., 2011 | Electroporation | |
| Transfected construct (Homo sapiens) | Scramble shRNA | Addgene plasmid # 1864 | RRID:Addgene_1864 | Electroporation (1 µg/ul) |
| Transfected construct (Homo sapiens) | Raptor_1 shRNA | Addgene plasmid # 1857 | RRID:Addgene_1857 | Electroporation (1 µg/ul) |
| Transfected construct (Homo sapiens) | pLKO.1-TSC2 | Addgene plasmid # 15478 | RRID:Addgene_15478 | Electroporation (1 µg/ul) |
| Biological sample (Homo sapiens) | Primary Cortex Tissue Samples | UCSF Gamete, Embryo and Stem Cell Research Committee (GESCR) approval | GW16-19 | |
| Antibody | anti-Sox2 (Mouse monoclonal) | Santa Cruz | RRID:AB_10842165; Cat# sc-365823 | (1:500) |
| Antibody | anti-Hopx (Mouse monoclonal) | Santa Cruz | RRID:AB_2687966; Cat# sc-398703 | (1:250) |
| Antibody | anti-Cofilin (Mouse monoclonal) | Santa Cruz | RRID:AB_11150468; Cat# sc-376476 | (1:100) |
| Antibody | anti-Cdc42 (Mouse monoclonal) | Santa Cruz | RRID:AB_627233; Cat#, sc-8401 | (1:200) |
| Antibody | anti-Cux1 (Mouse monoclonal) | Abcam | RRID:AB_941209; Cat#AB54583 | (1:500) |
| Antibody | anti-pVim (Mouse monoclonal) | MBL International | RRID:AB_592969; Cat# D095-3 | (1:500) |
| Antibody | anti-pHistone H3 (Mouse monoclonal) | Abcam | RRID:AB_443110; Cat# ab14955 | (1:500) |
| Antibody | anti-Cryab (Mouse monoclonal) | Abcam | RRID:AB_300400; Cat# ab13496 | (1:500) |
| Antibody | anti-Hopx (Rabbit polyclonal) | Proteintech | RRID:AB_10693525; Cat# 11419–1-AP | (1:500) |
| Antibody | anti-pS6 (Rabbit polyclonal) | Cell Signaling | RRID:AB_331679; Cat# 2211S | (1:500) |
| Antibody | anti-p4EBP1 (Rabbit monoclonal) | Cell Signaling Technology | RRID:AB_560835; Cat# 2855S | (1:500) |
| Antibody | anti-DEPDC5 (Rabbit polyclonal) | Sigma | RRID:AB_2682655; Cat# HPA054969 | (1:500) |
| Antibody | anti-Arp2 (Rabbit polyclonal) | Proteintech | RRID:AB_2221854; Cat#10922–1-AP | (1:100) |
| Antibody | anti-Cleaved Caspase-3 (Rabbit polyclonal) | Cell Signaling Technology | RRID:AB_2341188; Cat#9661S | (1:200) |
| Antibody | anti-Ctip2 (Rat monoclonal) | Abcam | RRID:AB_2064130; Cat# ab18465 | (1:500) |
| Antibody | anti-BrdU (Rat monoclonal) | Abcam | RRID:AB_305426; Cat# ab6326 | (1:500) |
| Antibody | anti-Eomes (Sheep polyclonal) | R and D | RRID:AB_10569705; Cat# AF6166 | (1:200) |
| Antibody | anti-Sox2 (Goat polyclonal) | Santa Cruz | RRID:AB_2286684; Cat# sc-17320 | (1:250) |
| Antibody | anti-NeuN (Guinea pig polyclonal) | Millipore | RRID:AB_11205592; Cat# ABN90 | (1:500) |
| Antibody | anti-Gfp (Chicken polyclonal) | Aves | RRID:AB_10000240; Cat#, GFP-1020 | (1:500) |
| Commercial assay or kit | G-LISA Activation Assay | Cytoskeleton, Inc, | catalog# BK124, BK127, BK128 | |
| Peptide, recombinant protein | BDNF | Peprotech | Cat# 450–02 | 100 ng/mL |
| Chemical compound, drug | Rapamycin | Sigma | Cat# R8781-200UL | 250 nM |
| Chemical compound, drug | 3BD0 | Sigma | Cat# SML1687 | 1 µM |
| Chemical compound, drug | CN04 | Cytoskeleton inc, | Cat# CN04 | 500 ng/mL |
| Software, algorithm | Imaris | Oxford Instruments | Imaris, RRID:SCR_007370 V9.5 |
Additional files
Download links
A two-part list of links to download the article, or parts of the article, in various formats.
Downloads (link to download the article as PDF)
Open citations (links to open the citations from this article in various online reference manager services)
Cite this article (links to download the citations from this article in formats compatible with various reference manager tools)
mTOR signaling regulates the morphology and migration of outer radial glia in developing human cortex
eLife 9:e58737.
https://doi.org/10.7554/eLife.58737


