REV-ERBα mediates complement expression and diurnal regulation of microglial synaptic phagocytosis
- Department of Neurology, Washington University School of Medicine in St. Louis, United States
- Department of Pharmacological and Physiological Science, Saint Louis University School of Medicine, United States
- Hope Center for Neurological Disorders, Washington University School of Medicine in St. Louis, United States
Figures
Figure 1 with 2 supplements
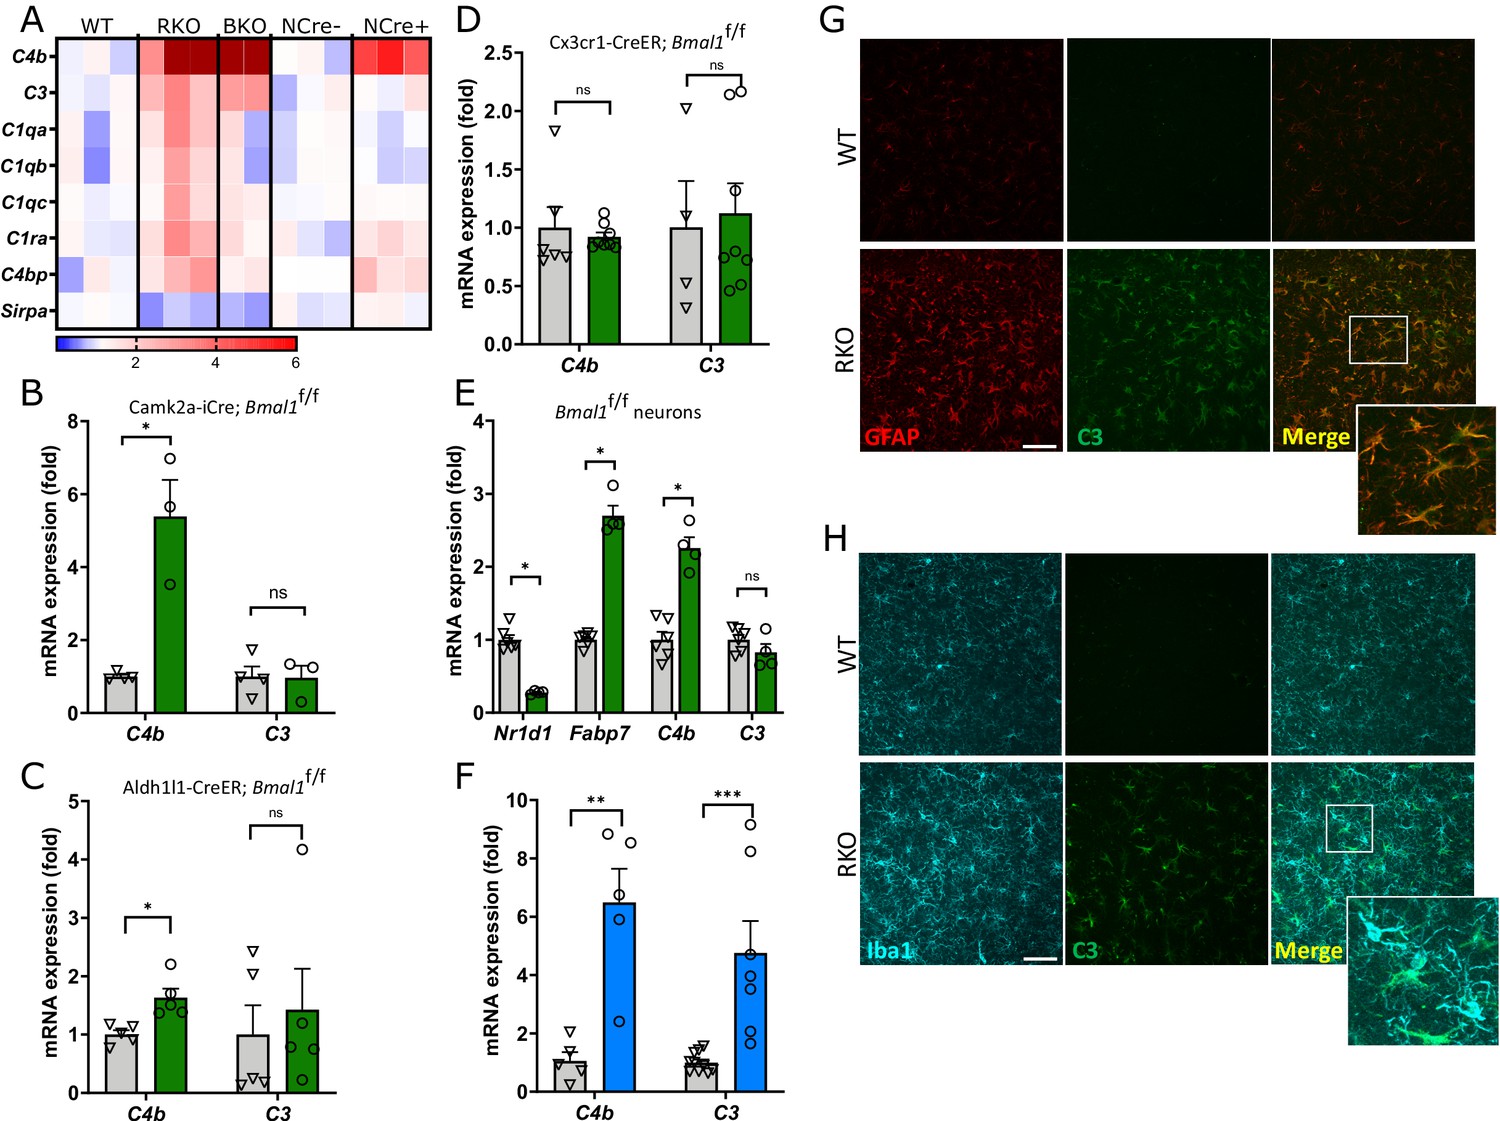
REV-ERBα regulates complement expression in multiple cell types downstream of BMAL1.
(A) Relative expression of complement-related transcripts taken from microarray analysis performed on hippocampus from 5mo REV-ERBα KO (RKO) and littermate WT mice (N = 3/genotype), global BMAL1 KO mice (BKO, N = 2), or 12mo Nestin-Cre;Bmal1f/f mice (NCre+), and littermate Cre- controls (NCre-, N = 3/group). Colors indicate fold change versus control. (B) qPCR analysis of 11 month old control (Cre-) and neuron-specific Bmal1 KO mice (Camk2a-iCre+;Bmal1fl/fl) for complement genes (N = 3–4/group). (C) qPCR analysis of control (Cre-) and astrocyte-specific Bmal1 KO mice (Aldh1l1-CreERT2+;Bmal1fl/fl) for complement genes (N = 5 mice/group). (D) qPCR analysis of control (Cre-) and microglia-specific Bmal1 KO mice (Cx3cr1- CreERT2+;Bmal1fl/fl) for complement genes (N = 4–8/group). For C and D, all mice (Cre- or +) were treated with tamoxifen at 2mo and harvested at 4mo, mixed sexes, Cre- littermates were used as controls. (E) qPCR analysis of mRNA from primary cortical neurons isolated from Bmal1fl/fl mice, treated with AAV8-GFP (control) or AAV8-Cre (n = 4–5 wells/group). (F) qPCR analysis of WT or RKO mouse hippocampal tissue for complement genes (N = 5–10 mice/group). (G) Representative 40X maximum intensity projections of GFAP and C3 staining as well as the merged channel in the hippocampus of 5mo WT or RKO mice and the associated normalized volumes for C3-GFAP staining (n = 8 mice, N = 4/group). (H) Representative 40X maximum intensity projections of Iba1 and C3 staining as well as the merged channel in the hippocampus of 5mo WT or RKO mice. Scale bar = 100 µm. *p<0.05 **p<0.01 ***p<0.001, ns = not significant, by two-tailed T-test with Welch’s correction.
-
Figure 1—source data 1
Data from the graphs depicted in Figure 1.
- https://cdn.elifesciences.org/articles/58765/elife-58765-fig1-data1-v2.xlsx
Figure 1—figure supplement 1

Brain-specific or post-natal Bmal1 deletion cause early induction of C4b.
(A) qPCR analysis for complement genes in hippocampal tissue from global inducible Bmal1 KO mice (CAG-CreERT2;Bmal1f/f) and Cre- littermate controls. N = 5–6/group. Mice were all treated with tamoxifen at 2mo and harvested at 4mo. (B) Nr1d1 transcript levels in 12mo Cre- and Nestin-Cre+;Bmal1f/f mouse cortex, taken from microarray dataset (ArrayExpress E-MTAB-7151) presented in Figure 1A. N = 3 mice/genotype. ***p<0.0001 by two-tailed T-test with Welch’s correction.
Figure 1—figure supplement 2
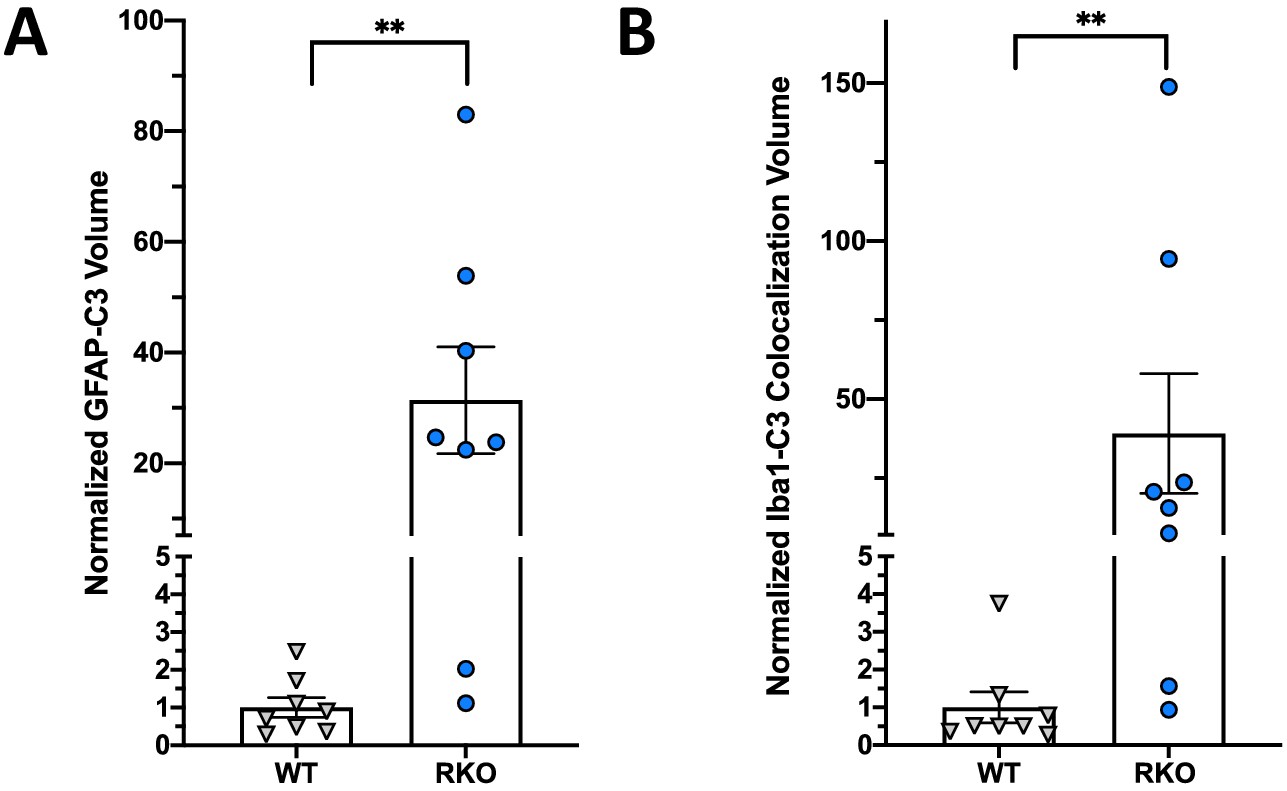
C3 colocalization with astrocytes and microglia in RKO brain.
Figure 2 with 1 supplement

REV-ERBα deletion increases synaptic phagocytosis in the CA3 region of the hippocampus.
(A-C) Image of synaptophysin (A), colocalized synaptophysin/CD68 (B), and colocalized synaptophysin/CD68/Iba1 (C) within microglia in the CA3 region of 4–6mo WT or RKO mice sacrificed at 11AM. D. Representative 3D surface rendering of microglia showing engulfed presynaptic material in lysosomes. (E) Magnified inset from WT (Ei) and RKO (Eii, iiii) microglia showing synaptophysin within CD68+ phagosomes. (F) Quantification of the normalized Iba1-CD68-Synaptophysin volumes from microglia in the CA3 region of the hippocampus of 4–6mo WT and RKO mice. Each point is the average of 3 sections from one mouse, N = 15 WT and 12 RKO mice. (G-H) Annotated, representative scanning electron micrographs of microglia in the CA3 of WT (G, pseudocolored Cyan) or RKO (H, pseudocolored Royal blue) mice sacrificed at 11AM with magnified inset pictures of engulfed presynaptic terminals (pseudocolored orange) in Hi and presynaptic terminals in contact with microglia (pseudocolored green) in Hii, Hiii, and Hiv. (I) Quantification of presynaptic terminals in contact with or engulfed by microglia in the CA3 of WT or RKO mice. Each point represents averaged data from a single mouse, N = 4 mice/genotype. In I, 3–15 microglia were counted per mouse. Scale bar for A–D = 5 µm. **p<0.01,***p<0.001 by two-tailed T-test with Welch’s correction.
-
Figure 2—source data 1
Data from the graphs depicted in Figure 2.
- https://cdn.elifesciences.org/articles/58765/elife-58765-fig2-data1-v2.xlsx
Figure 2—figure supplement 1
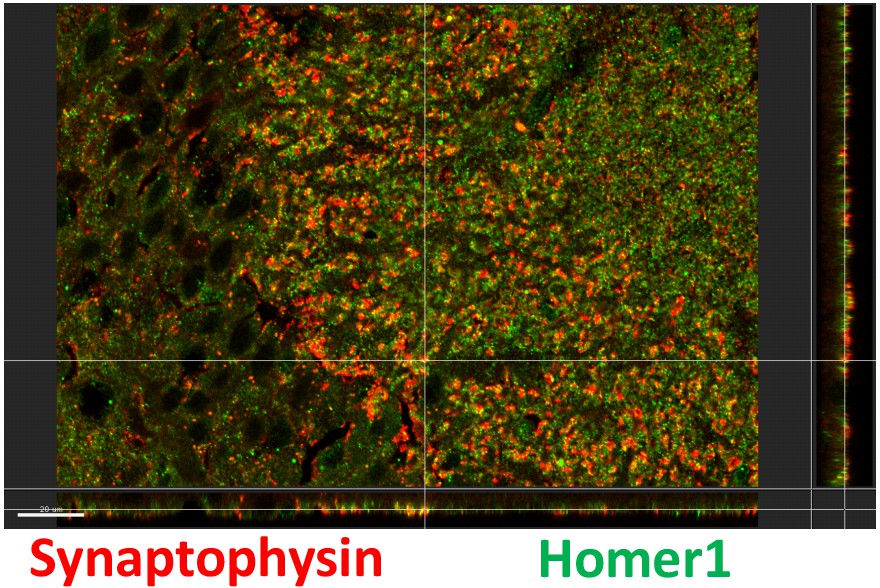
Confirmation of antibody colocalization with orthogonal view.
Representative image from Imaris showing colocalization of synaptophysin and homer1 with the orthogonal views (YZ on the right and XZ on the bottom).
Figure 3 with 3 supplements

REV-ERBα deletion induces synapse loss in the CA3 region.
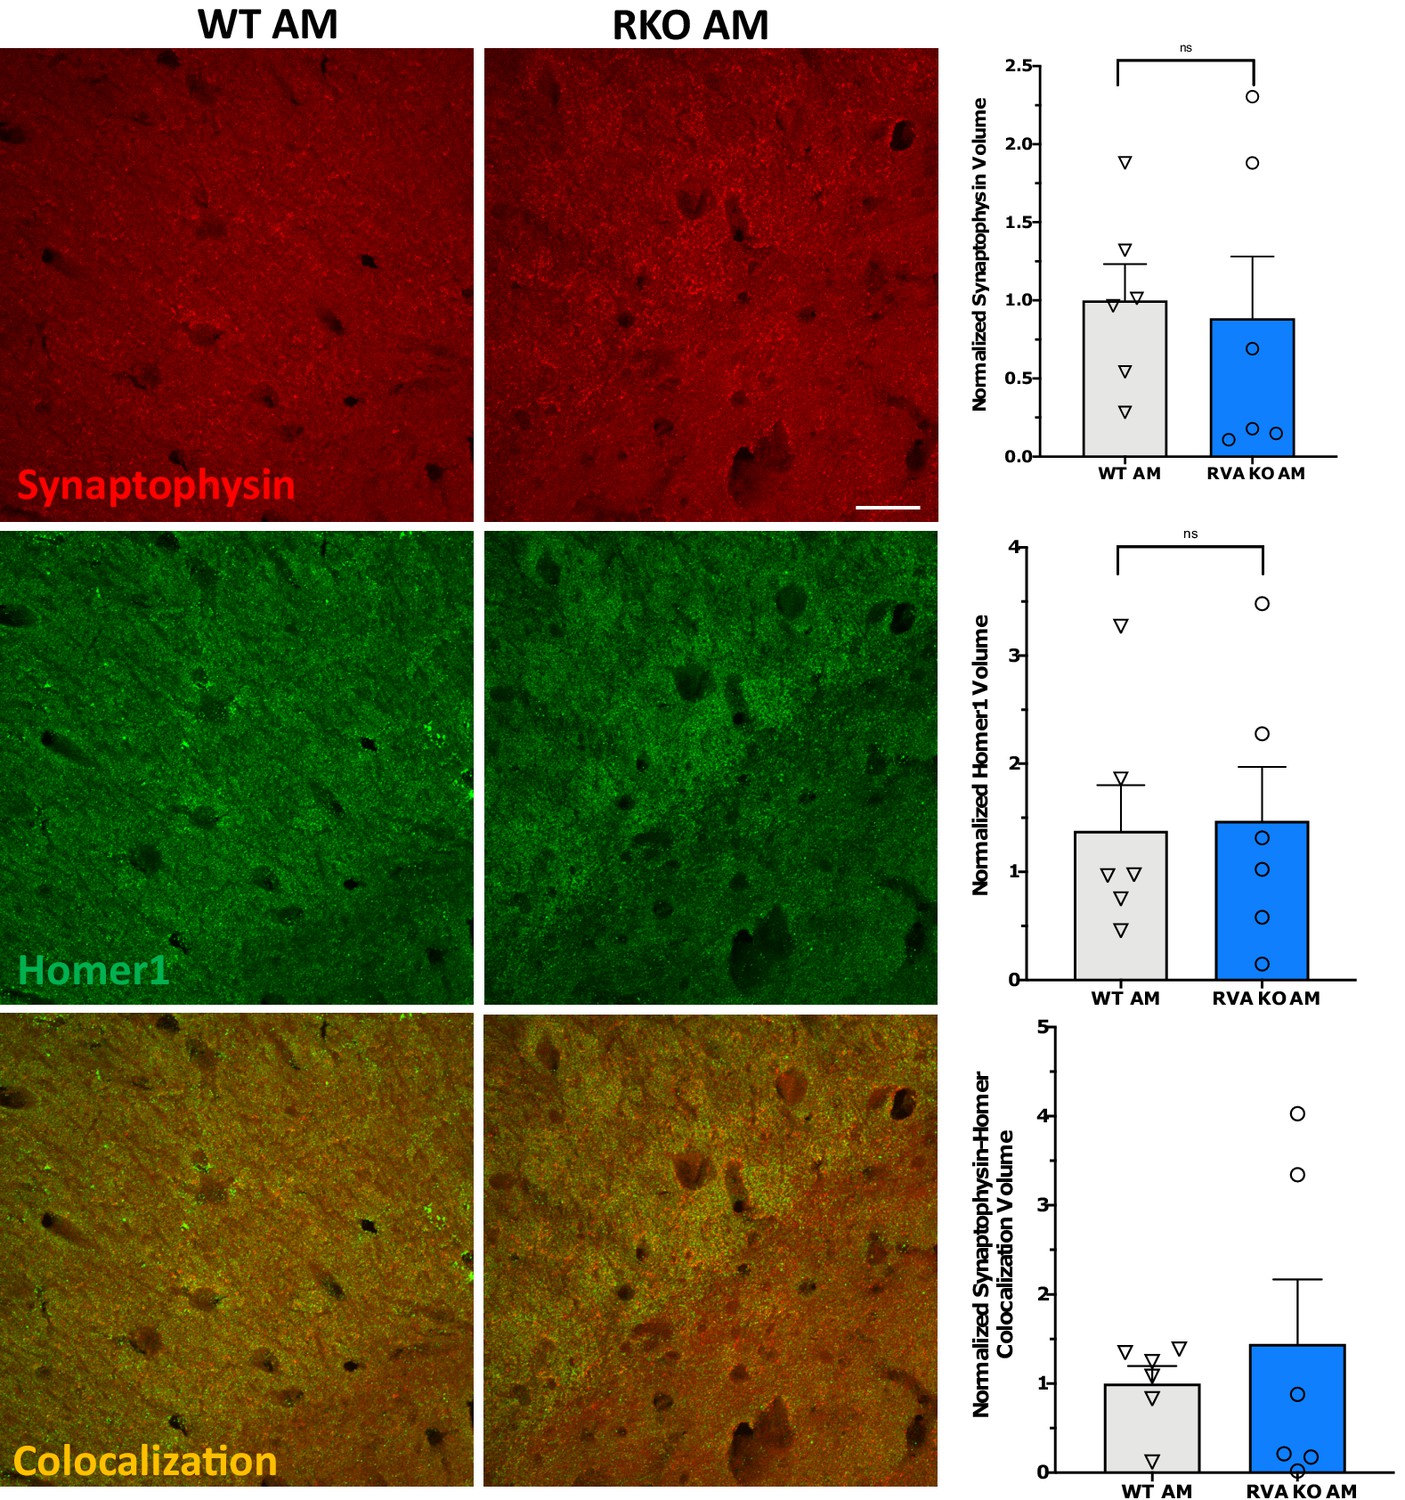
(A) 60X representative maximum intensity projections showing synaptophysin staining in the CA3 of 4–6mo WT and RKO mice harvested at 11AM with the associated normalized volume quantification (N = 15 WT and 12 RKO mice). (B) 60X representative maximum intensity projections showing homer1 staining in CA3 of 4–6mo WT and RKO mice with the associated normalized volume quantification. (C) 60X representative maximum intensity projections showing colocalized synaptophysin and homer1 staining in CA3 of 4–6mo WT and RKO mice with the associated normalized volume quantification. (D) Representative scanning electron micrographs of synapses (presynaptic terminal pseudocolored in red, postsynaptic terminal in green), as well as the associated synapse counts for 4–6mo WT and RKO mice. N = 4 mice/genotype, with each point representing the average of 32–56 images counted per mouse. (E) 60X representative maximum intensity projections showing synaptoporin staining in the CA3 of 4–6mo WT and RKO mice. Colocalization with nuclei (DAPI) shown in lower images. (F) High-magnification images of synaptoporin staining of CA3 synapses from WT and RKO mice to show detail. (G). Normalized volume quantification of CA3 synaptoporin signal (N = 6 mice/genotype). *p<0.05, **p<0.01, ****p<0.0001 by two-tailed T-test with Welch’s correction. In all panels, each point represent the average of three sections from a single mouse. Scale bar = 50 µm in all panels except D.
-
Figure 3—source data 1
Data from the graphs depicted in Figure 3.
- https://cdn.elifesciences.org/articles/58765/elife-58765-fig3-data1-v2.xlsx
Figure 3—figure supplement 1
REV-ERBα deletion does not induce synapse loss in CA1.
Representative 60X maximum intensity projects of synaptophysin and homer1 staining in the CA1 region of WT or RKO mice as well as the associated normalized volume quantifications (N = 5/group).
Figure 3—figure supplement 2
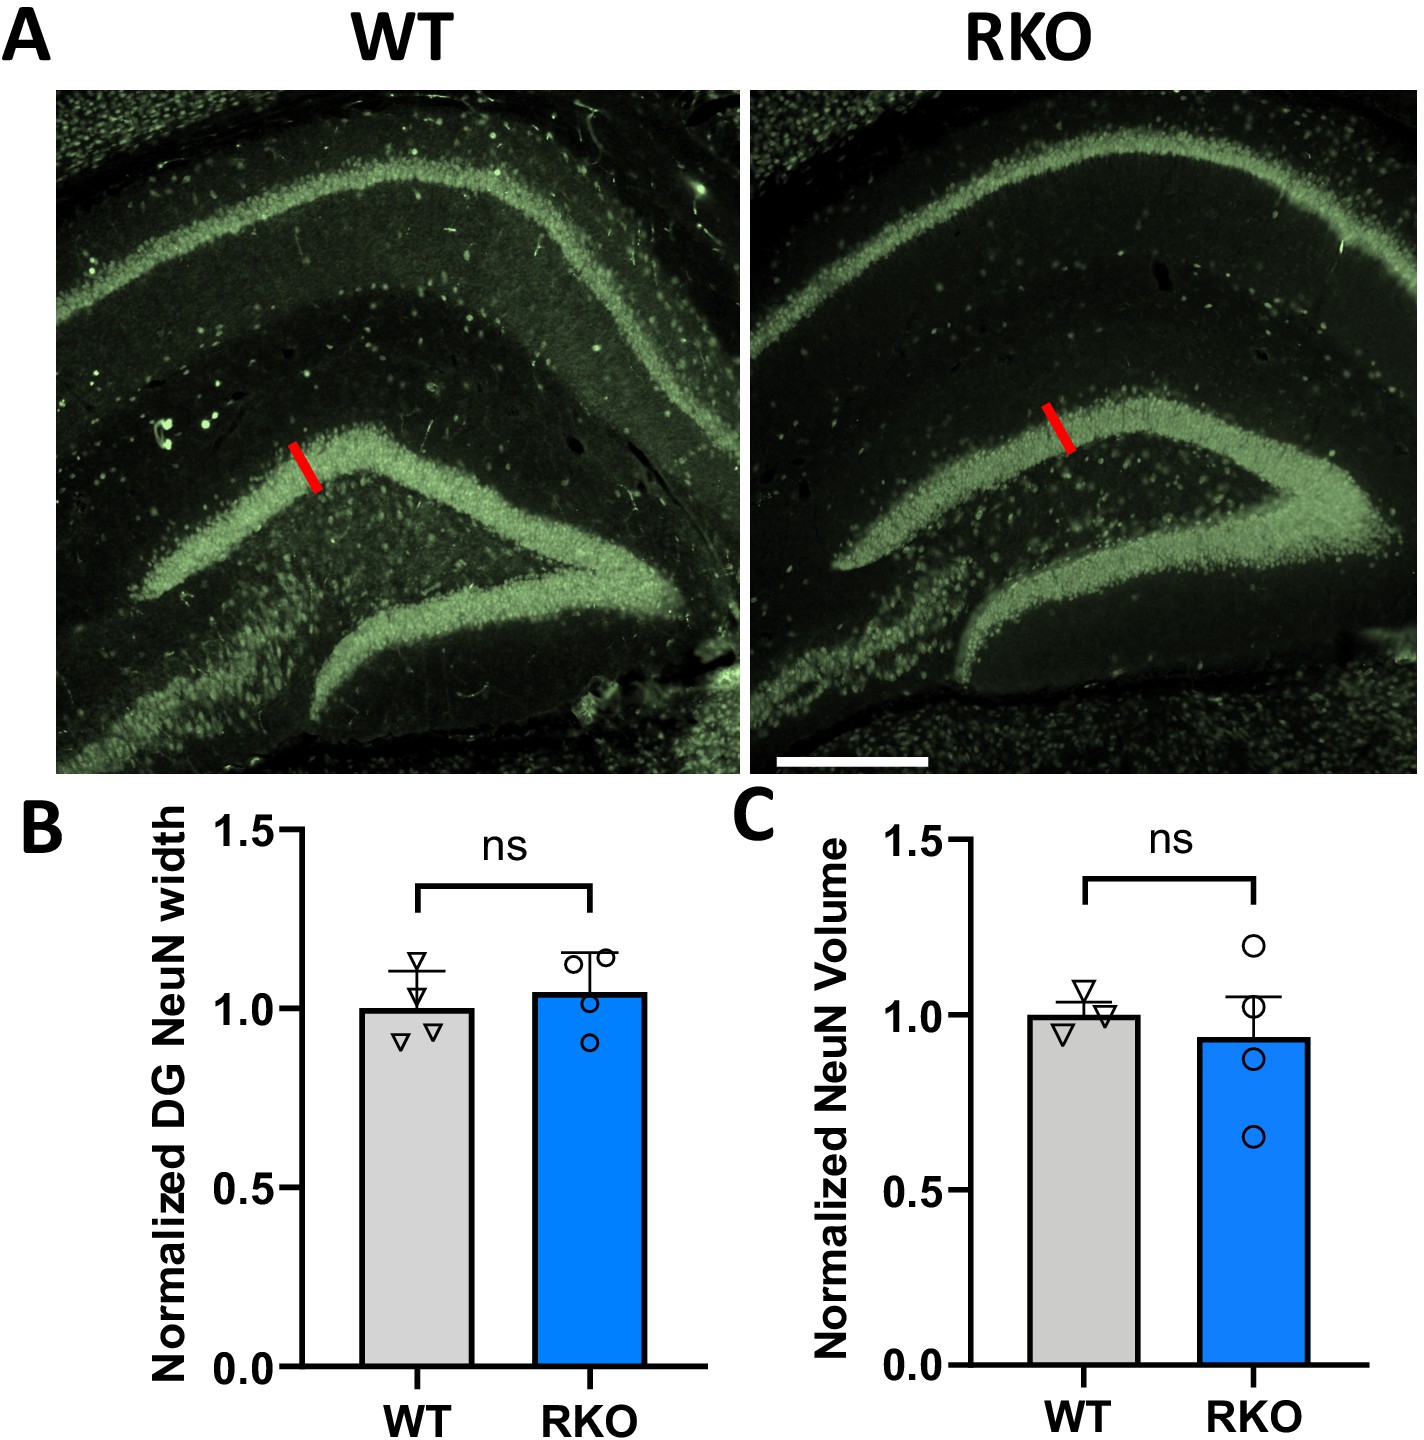
No change in dentate gyrus neuronal layer volume or width in RKO mice.
(A) Representative image of NeuN immunoreactivity in the dentate gyrus of a 6mo WT and RKO mice. (B) Average thickness of NeuN+ neuronal nuclei layer in WT and RKO mice. Red line in A indicates how measurements were taken; six measurements/section along the DG were averaged, N = 4 mice/genotype. (C) Volume of DG NeuN signal was quantified in 10 µm section z-stacks from N = 4 mice/genotype. Normalized NeuN volumes are shown. In B and C, each point represents a single mouse. Ns = not significant. Scale bar = 100 µm.
Figure 3—figure supplement 3
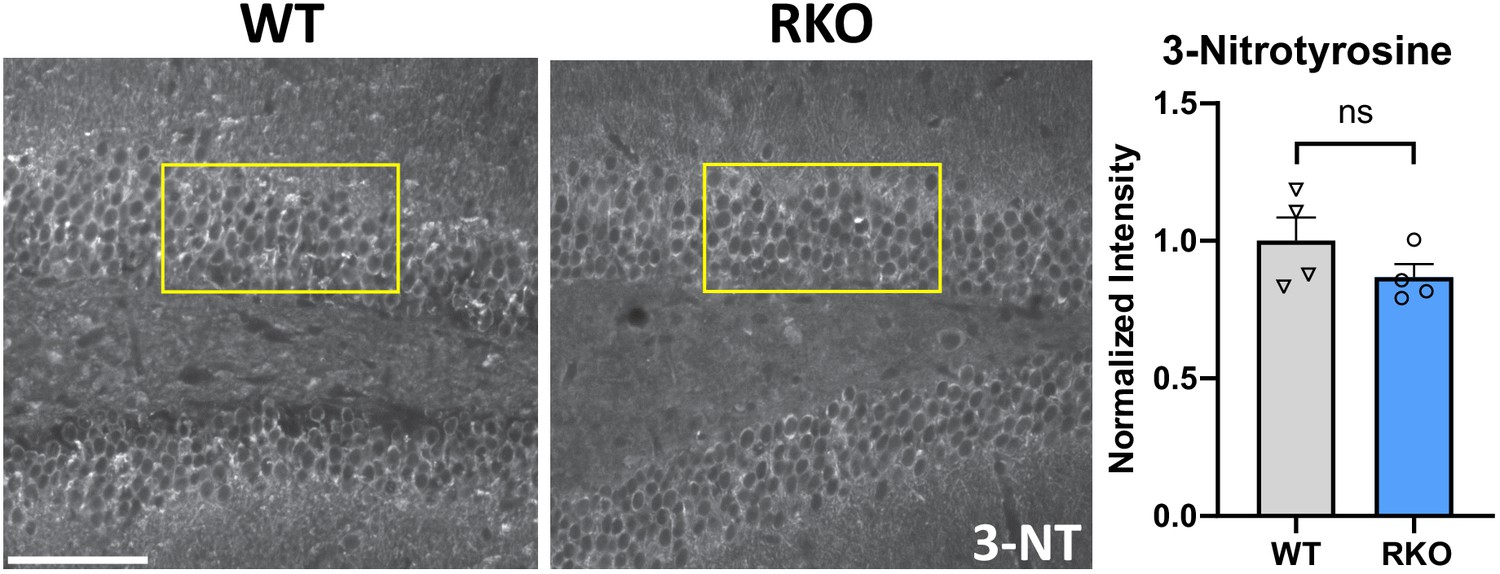
No change in dentate gyrus neuronal 3-nitrotyrosine in RKO mice.
Representative images of 3-nitrotyrosine staining in DG of WT and RKO mice. Yellow boxes indicate the typical area of intensity quantification. N = 4 mice/genotype, two sections/mouse averaged. Scale bar = 50 µm. p>0.01 by two-tailed T-test.
Figure 4 with 2 supplements
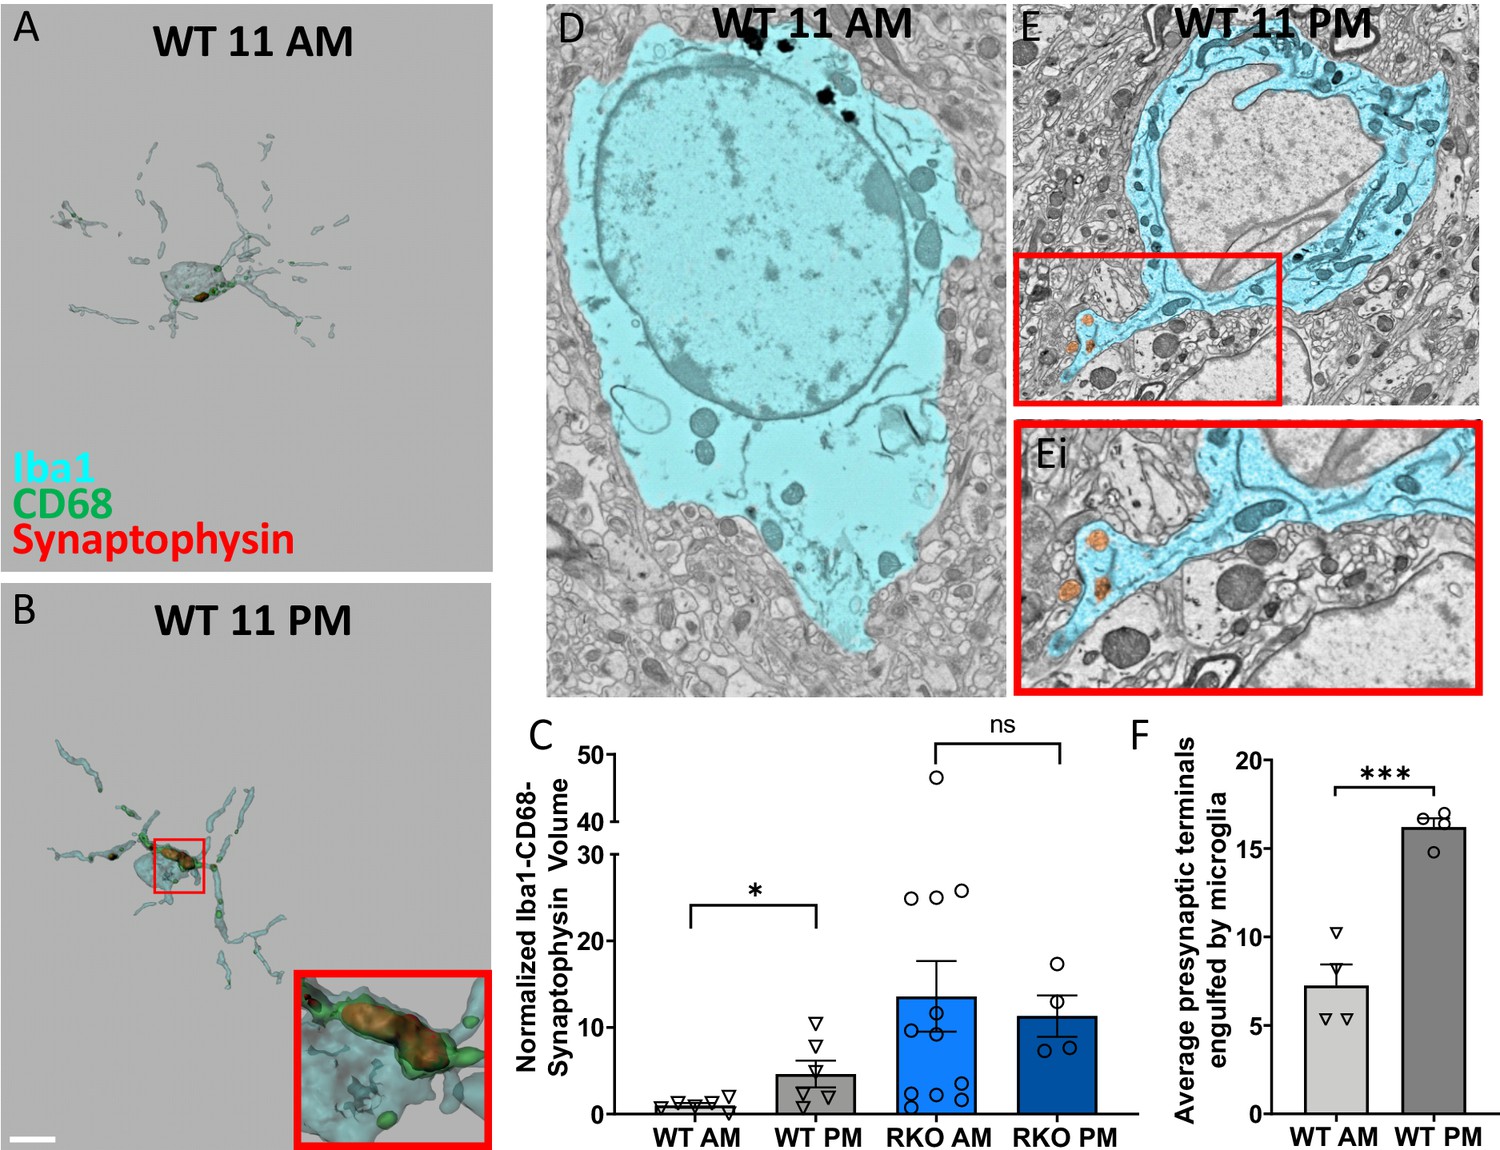
Time-of-day oscillation in microglial phagocytosis.
Representative 3D surface rendering of Iba1, CD68 and synaptophysin in Iba1+ microglia from 6mo WT mice sacrificed at (A) 11AM or (B) 11PM with inset. Scale bar = 5 µm. (C) The normalized volume quantification of Iba1-CD68-Synaptophysin showing microglial phagocytosis of synapses in WT and RKO mice harvested at 11AM or 11PM (N = 4–12 mice/group). Note that the data from the WT AM and RKO AM groups was shown in Figure 2F. (D-F) Representative scanning electron micrographs of microglia in the CA3 of WT mice sacrificed at 11AM (D) or 11PM (E) as well as a high-magnification inset of presynaptic terminals within the microglia (Ei). (F) Quantification of presynaptic terminals in contact with or engulfed by microglia in WT mice sacrificed at 11AM or 11PM. N = 4 mice/timepoint, 4–10 fields of view each. Note that the WT AM group was shown in Figure 2I. *p<0.05, ***p<0.001 by two-tailed T-test with Welch’s correction.
-
Figure 4—source data 1
Data from the graphs depicted in Figure 4.
- https://cdn.elifesciences.org/articles/58765/elife-58765-fig4-data1-v2.xlsx
Figure 4—figure supplement 1
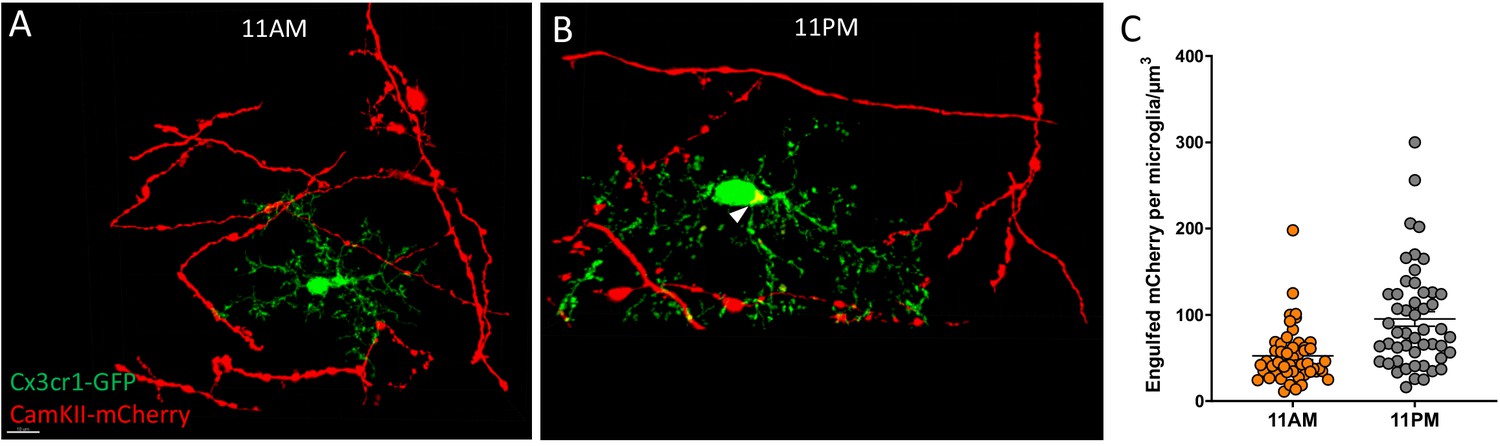
Viral injection approach for diurnal variation in synaptic pruning.
Representative 100X images of microglia and neuronal axons from 6 to 8mo Cx3cr1GFP mice injected with an AAV2-Camk2a-mCherry and sacrificed at (A) 11AM or (B) 11PM as well as the (C) associated quantification of the engulfed mCherry volume per microglia. The white arrowhead shows an area of mCherry-GFP colocalization (indicated engulfed neuronal material). N = 50 microglia counted/mouse, N = 2 mice/group. Scale bar = 10 µm.
Figure 4—figure supplement 2
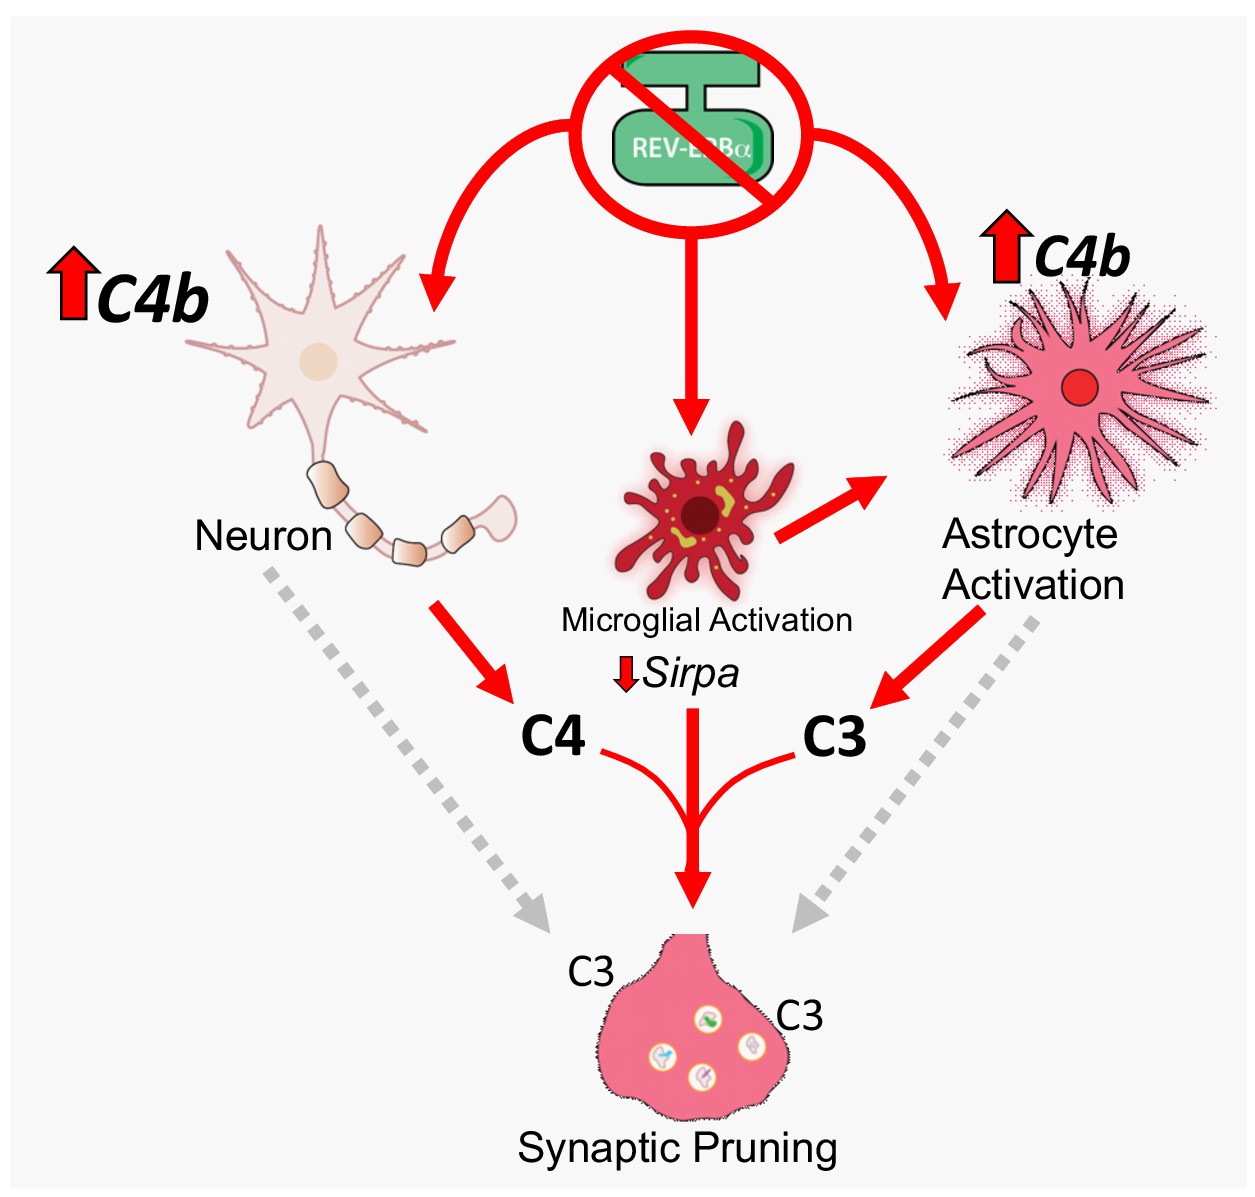
Diagram depicting multicellular contribution to synaptic phagocytosis by REV-ERBα.
Deletion of REV-ERBα causes pronounced C4b upregulation in the brain. Based on results from tissue-specific Bmal1 KO mice, this presumably occurs primarily in neurons, with modest C4b upregulation in astrocytes, but neither is sufficient to induce C3 expression. In the setting of REV-ERBα deletion in all cells (including microglia), there is glial activation and pronounced astrocyte C3 expression, as well as modest microglial C3 expression, suggesting that microglial REV-ERBα deletion is necessary for the full response and that microglia may induce C3 expression in astrocytes. This multicellular response is associated with decreased microglial Sirpa expression and increased microglial synaptic phagocytosis. Neuronal C4 production, astrocyte C3, and microglial activation (and Sirpa downregulation) likely all contribute to synaptic phagocytosis. Gray dashed arrows indicate that REV-ERBα loss in neurons could cause neuronal injury that facilitates synaptic pruning (although no neuronal cell body loss was noted), and that astrocytes might also directly phagocytose synapses, though neither of these possibilities are directly addressed herein. Ultimately, REV-ERBα deletion causes complement C4b and C3 expression, and excessive synaptic phagocytosis.
Tables
Key resources table
| Reagent type (species) or resource | Designation | Source or reference | Identifiers | Additional information |
|---|---|---|---|---|
| Antibody | Gfap (Rabbit polyclonal) | Dako/Agilent | Cat# Z0334 RRID:AB_10013382 | IF (1:2500) |
| Antibody | C3 (Rat monoclonal) | Novus | Cat# NB200-540 RRID:AB_10003444 | IF (1:500) |
| Antibody | Iba1 (Goat polyclonal) | Abcam | Cat# ab5076 RRID:AB_2224402 | IF (1:500) |
| Antibody | Synaptophysin (Mouse monoclonal) | Abcam | Cat# 8049 RRID:AB_2198854 | IF (1:100) |
| Antibody | Homer1 (Rabbit polyclonal) | Synaptic Systems | Cat# 160 003 RRID:AB_887730 | IF (1:500) |
| Antibody | CD68 (Rat monoclonal) | BioRad | Cat# MCA1957 RRID:AB_322219 | IF (1:250) |
| Antibody | NeuN (Mouse monoclonal) | EMD/Millipore | Cat# MAB377 RRID:AB_2298772 | IF (1:1000) |
| Antibody | 3-Nitrotyrosine (Rabbit polyclonal) | Millipore/ Sigma | Cat# AB5411 RRID:AB_177459 | IF (1:1000) |
| Genetic reagent (mouse) | Bmal1 (Arntl)-/- mice | Jackson Labs | Cat# 009100 - B6.129-Arntltm1Bra/J RRID:IMSR_JAX:009100 | |
| Genetic reagent (mouse) | Bmal1(flox/flox) mice | Jackson Labs | Cat# 007668-B6.129S4(Cg)Arntltm1Weit/J RRID:IMSR_JAX:007668 | |
| Genetic reagent (mouse) | Nr1d1-/- mouse | Jackson Labs | Cat# 018447- B6.Cg-Nr1d1tm1Ven/LazJ RRID:IMSR_JAX:018447 | Rev-Erbα KO mouse line |
| Genetic reagent (mouse) | Nestin-Cre mice | Jackson Labs | Cat# 003771- B6.Cg-Tg(Nes-cre)1Kln/J RRID:IMSR_JAX:003771 | Nestin-Cre line crossed to Bmal1f/f |
| Genetic reagent (mouse) | Aldh1l1-CreERT2 mice | Jackson Labs | Cat# 031008- B6N.FVB-Tg(Aldh1l1-cre/ERT2)1Khakh/J RRID:IMSR_JAX:031008 | Aldh1l1-CreER line crossed to Bmal1f/f |
| Genetic reagent (mouse) | Cx3cr1-CreERT2 mice | Jackson Labs | Cat# 021160- B6.129P2(Cg)Cx3cr1tm2.1(cre/ERT2)Litt/WganJ RRID:IMSR_JAX:021160 | Cx3cr1-CreER line crossed to Bmal1f/f |
| Genetic reagent (mouse) | CAG- CreERT2 mice | Jackson Labs | Cat# 004682-B6.Cg-Tg(CAG-cre/Esr1*)5Amc/J RRID:IMSR_JAX: 004682 | CAG-CreER line crossed to Bmal1f/f |
| Genetic reagent (mouse) | Camk2a-iCre BAC TG mice | Obtained from Dr. J. Takahashi. Created by Dr. Gunther Schutz | MGI symbol: Tg(Camk2a-cre)2Gsc RRID:MGI:4457404 | BAC Tg Camk2a-iCre mouse |
| Sequence-based reagent | Actb (mouse) | Thermo-Fisher/Life Technologies | Taqman qPCR primer Cat#: Mm02619580_g1 | |
| Sequence-based reagent | Nr1d1 (mouse) | Thermo-Fisher/Life Technologies | Taqman qPCR primer Cat#: Mm00520708_m1 | |
| Sequence-based reagent | C4b (mouse) | Thermo-Fisher/Life Technologies | Taqman qPCR primer Cat#: Mm00437893_g1 | |
| Sequence-based reagent | C3 (mouse) | Thermo-Fisher/Life Technologies | Taqman qPCR primer Cat#: Mm01232779_m1 | |
| Sequence-based reagent | Fabp7 (mouse) | Thermo-Fisher/Life Technologies | Taqman qPCR primer Cat#: Mm00437838_m1 | |
| Software, algorithm | Imaris | Bitplane, South Windsor, CT | RRID:SCR_007370 | Version 9, used for image analysis. |
| Software, algorithm | Prizm | GraphPad Software, LLC. | RRID:SCR_002798 | Version 8.3.0 |
Additional files
Download links
A two-part list of links to download the article, or parts of the article, in various formats.
Downloads (link to download the article as PDF)
Open citations (links to open the citations from this article in various online reference manager services)
Cite this article (links to download the citations from this article in formats compatible with various reference manager tools)
REV-ERBα mediates complement expression and diurnal regulation of microglial synaptic phagocytosis
eLife 9:e58765.
https://doi.org/10.7554/eLife.58765


