FLEXIQuant-LF to quantify protein modification extent in label-free proteomics data
- F.M. Kirby Neurobiology Center, Boston Children’s Hospital, United States
- Department of Neurology, Harvard Medical School, United States
- Department of Pathology, Boston Children’s Hospital, United States
- Bioinformatics Unit (MF1), Robert Koch Institute, Germany
- Department of Medical Biotechnology, Institute of Biotechnology, Technische Universität Berlin, Germany
- Department of Pathology, Harvard Medical School, United States
- Data Analytics and Computational Statistics, Hasso-Plattner-Institute, Faculty of Digital Engineering, University of Potsdam, Germany
- Precision Vaccines Program, Boston Children’s Hospital, United States
Figures
Figure 1
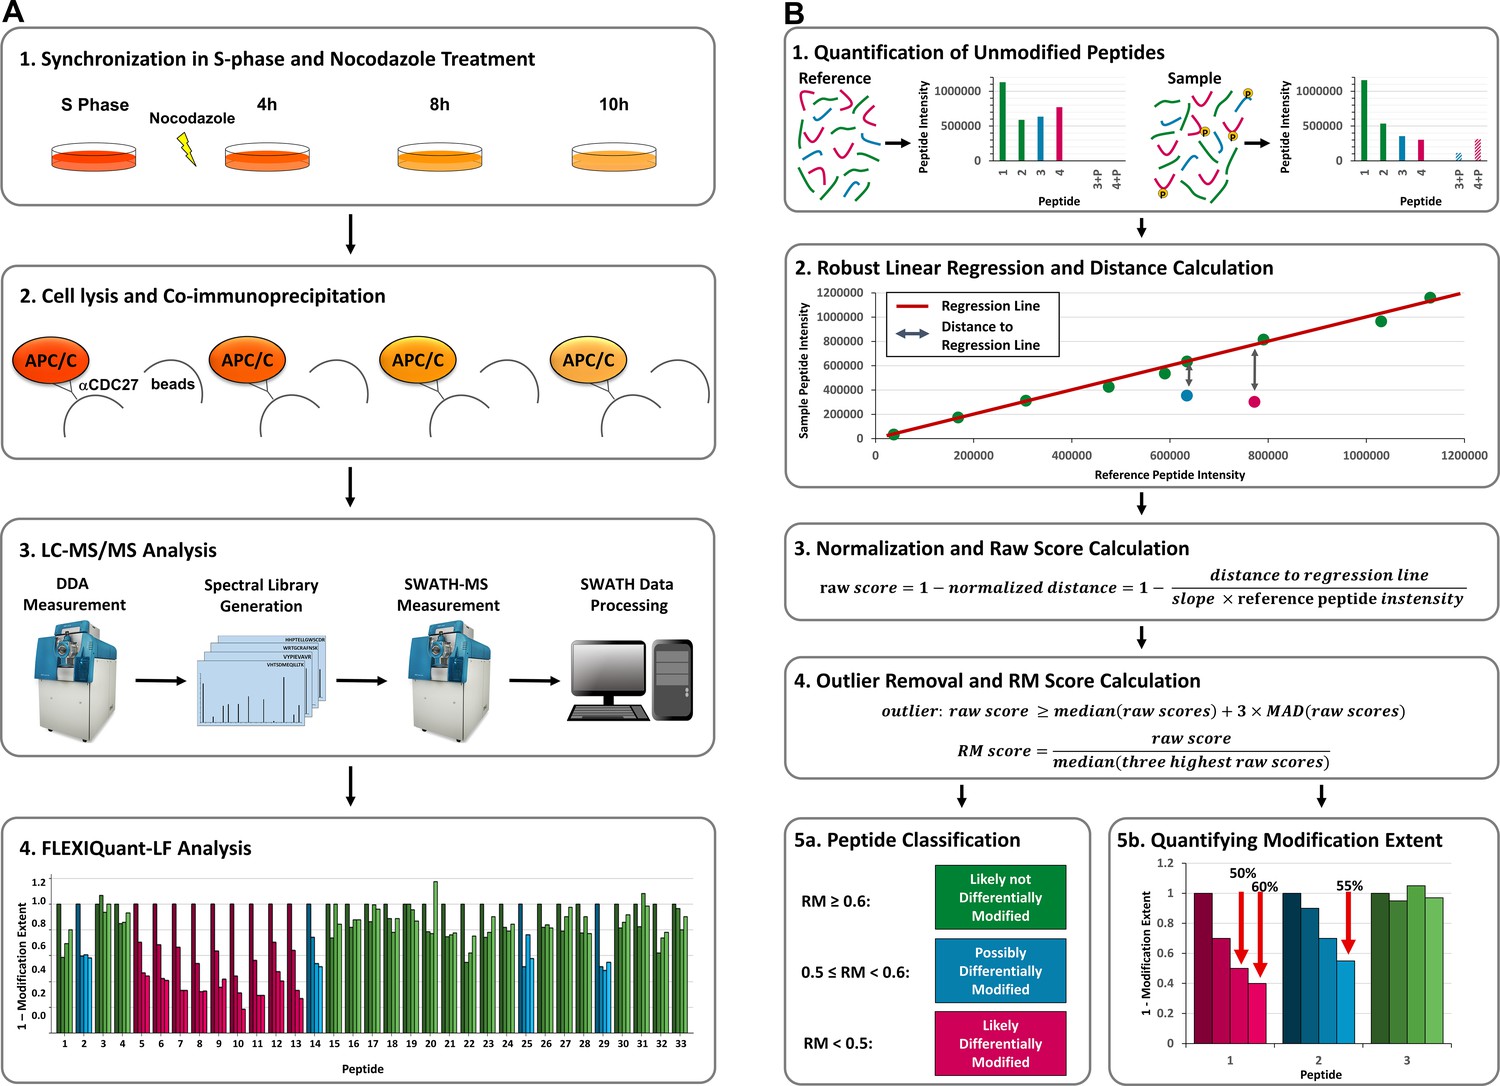
Workflow and FLEXIQuant-LF concept.
(A) Workflow. (A1) HeLa cells were synchronized in S-phase using thymidine (dark orange). Upon release from thymidine block, cells were treated with nocodazole and samples were collected after 4 hr (medium dark orange), 8 hr (orange), and 10 hr (light orange). (A2) APC/C was co-immunoprecipitated using an anti-CDC27 antibody. (A3) All samples were trypsinized separately and analyzed by LC-MS/MS in DDA mode to generate a spectral library, which was subsequently analyzed by SWATH-MS (see Supplementary file 1 for raw peptide intensities of all quantified APC/C proteins). (A4) FLEXIQuant-LF-based differential modification analysis of APC/C proteins (see Supplementary file 2 for all resulting RM scores). (B) FLEXIQuant-LF overview. (B1) Firstly, intensities of unmodified peptides are used to indirectly identify and quantify the modification extent of a protein using the following steps. (B2) A RANSAC-based robust linear regression model is fitted to the intensities of unmodified peptide species using a reference sample as independent variable and the sample of interest as dependent variable and the vertical distance to the regression line of each peptide is determined. (B3) For each peptide, the distance is then normalized by dividing by the slope of the regression line multiplied by the intensity of the peptide in the reference sample and the result is subtracted from one to yield raw scores. (B4) Peptides with a raw score above three standard deviations of the median (MAD) of all raw scores are classified as outliers and excluded from the subsequent RM score calculation. The remaining raw scores are then scaled using the median of the three highest raw scores resulting in a metric, termed RM score which is equal to one minus the extent of modification. (B5) Lastly, peptides are classified in three categories based on their RM scores and the extent of modification is visualized: (i) RM score <0.5: peptide is likely differentially modified (magenta bars), (ii) 0.5 ≤ RM score<0.6: peptide is possibly differentially modified (blue bars), and (iii) RM score ≥0.6: peptide is likely not differentially modified (green bars).
Figure 2
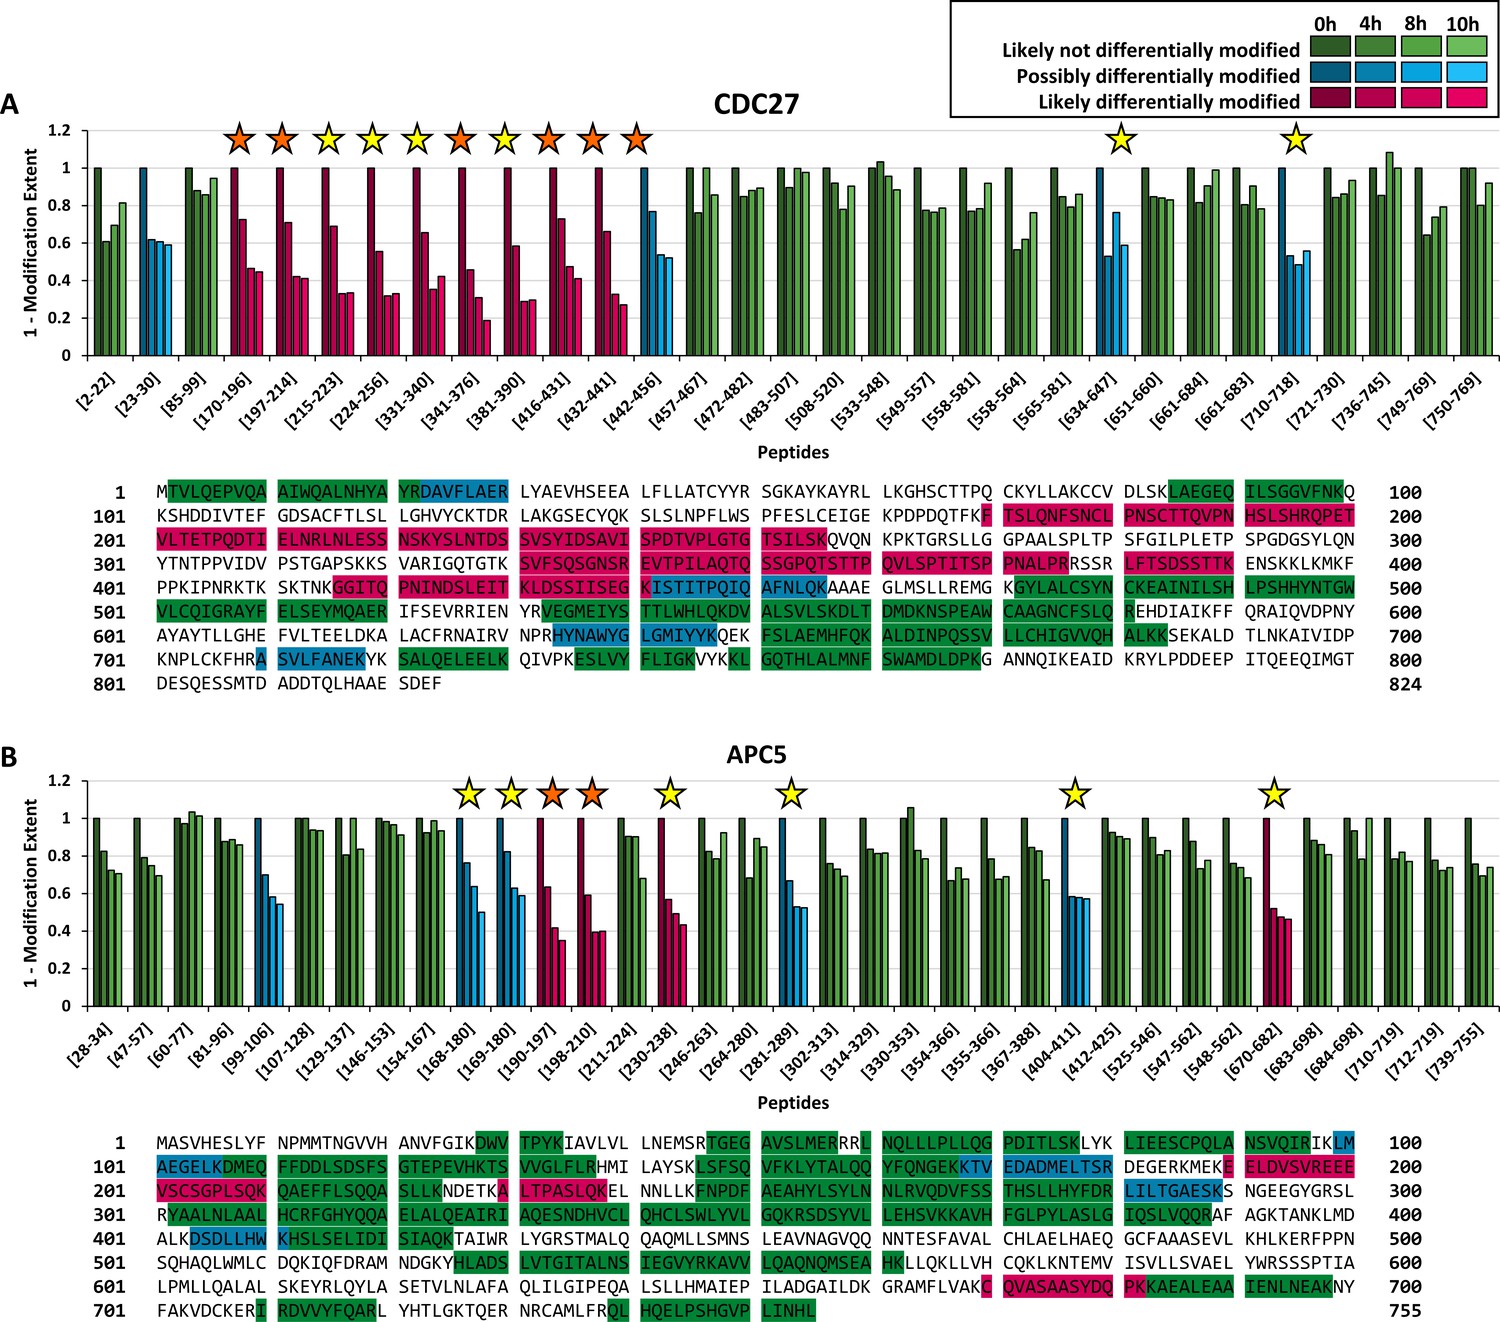
Benchmarking FLEXIQuant-LF with CDC27 and APC5.
Peptide classification and extent of modification quantification of CDC27 peptides (A) and APC5 peptides (B) with protein sequences and measured peptides highlighted underneath. Green bars indicate peptides that were classified as likely not differentially modified (RM score ≥0.6), blue bars indicate peptides classified as possibly differentially modified (0.5 ≤ RM score<0.6) and magenta bars indicate peptides that were classified as likely differentially modified (RM score ≤0.5). Shading indicates timepoints from 0 hr (S phase; darkest shade) to 10 hr (brightest shade). Positions of peptides within the protein are given from the N- to C-terminus. Orange stars indicate modifications identified in the DDA dataset while yellow stars indicate modifications described in the literature. (A) FLEXIQuant-LF analysis of 32 CDC27 peptides after filtering classified nine and four peptides as likely and possibly differentially modified over the course of the experiment. We found PTM evidence for all peptides classified as likely differentially modified (for five in our DDA data and for all peptides online [see also Table 1]) as well as for three out of four peptides classified as possibly differentially modified (for one in our DDA data and all except of peptide [23-30] described online). (B) Out of 35 quantified peptides of APC5, four and five peptides were classified as likely and possibly differentially modified. We found evidence for the likely differentially modified peptides in our DDA data or as previously reported. Additionally, we found evidence for four out of five possibly differentially modified peptides online. Only for [99-106], we could not find any evidence for modification.
Figure 3 with 2 supplements
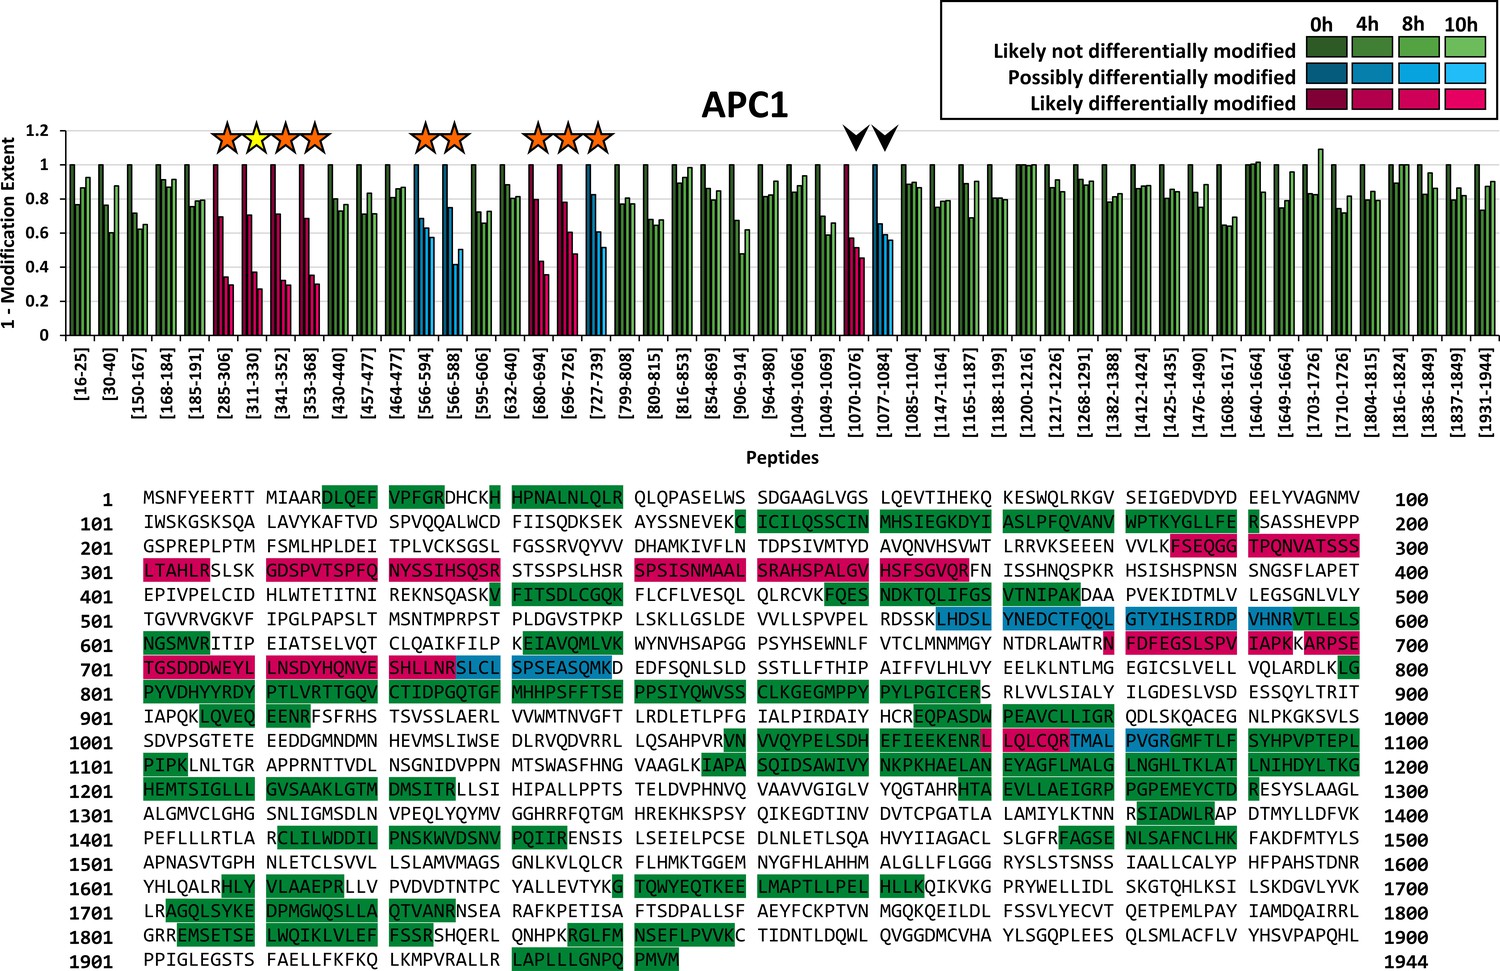
Application of FLEXIQuant-LF to remaining APC/C core components.
Peptide classification and extent of modification of APC1. Seven out of 50 quantified peptides were classified as likely differentially modified and four peptides as possibly differentially modified. We found evidence of modification for six out of seven peptides classified as likely differentially modified (five in our DDA data and six described in the literature) as well as for three out of four peptides classified as possibly differentially modified in our DDA data (see also Table 1). Additionally, two peptides were classified as likely differentially modified and possibly differentially modified (indicated by arrow heads) but no evidence of modification was found in literature. Interestingly, these two peptides are consecutive, and the second peptide starts with threonine (AA 1077). An as of now undiscovered threonine modification such as a phosphorylation would likely lead to a highly increased missed cleavage rate and could explain the reduction of the signal intensities of both peptides. Classification and extent of modification of the remaining APC/C core components is shown in Figure 3—figure supplements 1 and 2.
Figure 3—figure supplement 1

FLEXIQuant-LF analysis of remaining APC/C components analyzed as superprotein.
Peptide classification and extent of modification of (A) APC4, (B) APC7, (C) APC10, (D) CDC20, (E) CDC16, (F) CDC23 analyzed with FLEXIQuant-LF. APC15 and APC16 were analyzed using the ‘superprotein’ approach, the remaining proteins were analyzed individually. Green bars indicate peptides that were classified as likely not differentially modified at 10 hr (RM score ≥0.6), blue bars indicate peptides classified as possibly differentially modified (0.5 ≤ RM score<0.6) and magenta bars indicate peptides that classified as likely differentially modified (RM score ≤0.5). For each class, the four time points are shown in different color shades, from time point 0 hr (S phase; darkest shade) to time point 10 hr (brightest shade). Positions of peptides within the protein are given from the N- to C-terminus. Peptides labeled with an orange star indicate that a modification was identified on this peptide in the DDA dataset and peptides labeled with a yellow star indicate a modification that was described in the literature.
Figure 3—figure supplement 2
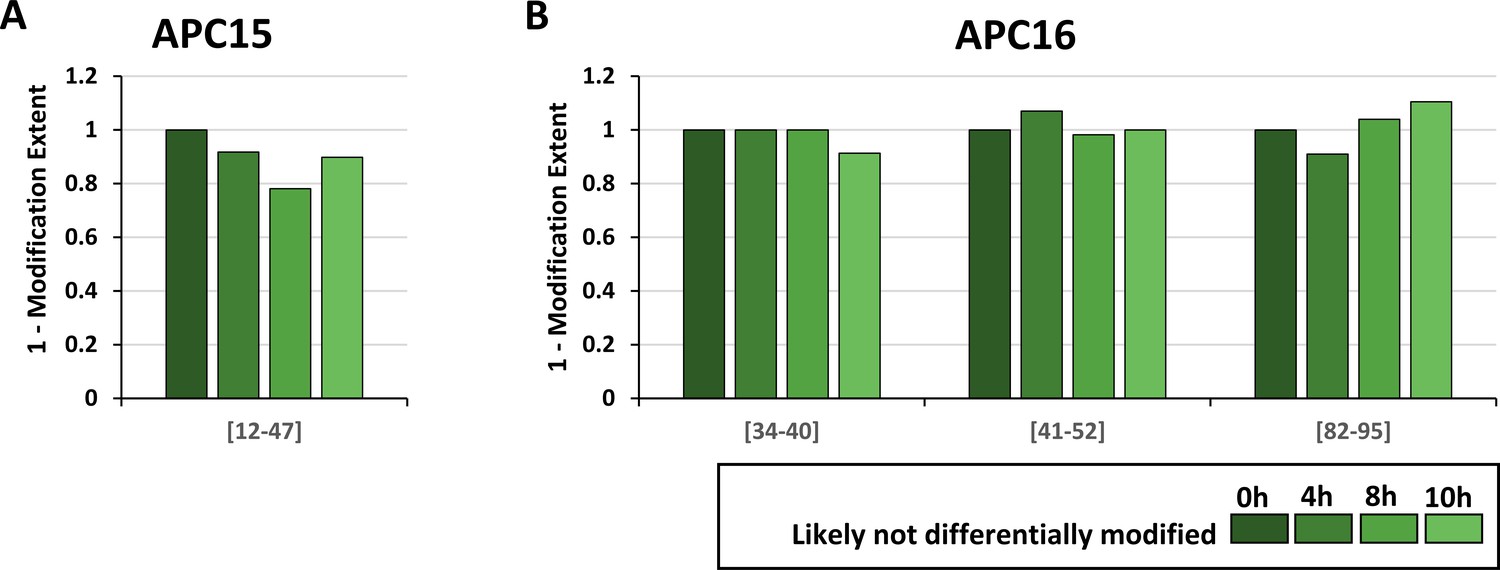
FLEXIQuant-LF analysis of APC/C components as superprotein.
Peptide classification and extent of modification of (A) APC15 and (B) APC16 analyzed with FLEXIQuant-LF using the ‘superprotein’ approach as number of peptides per protein was below threshold of five peptides. Green bars indicate peptides that were classified as likely not differentially modified at 10 hr (RM score ≥0.6). Positions of peptides within the protein are given from the N- to C-terminus.
Figure 4
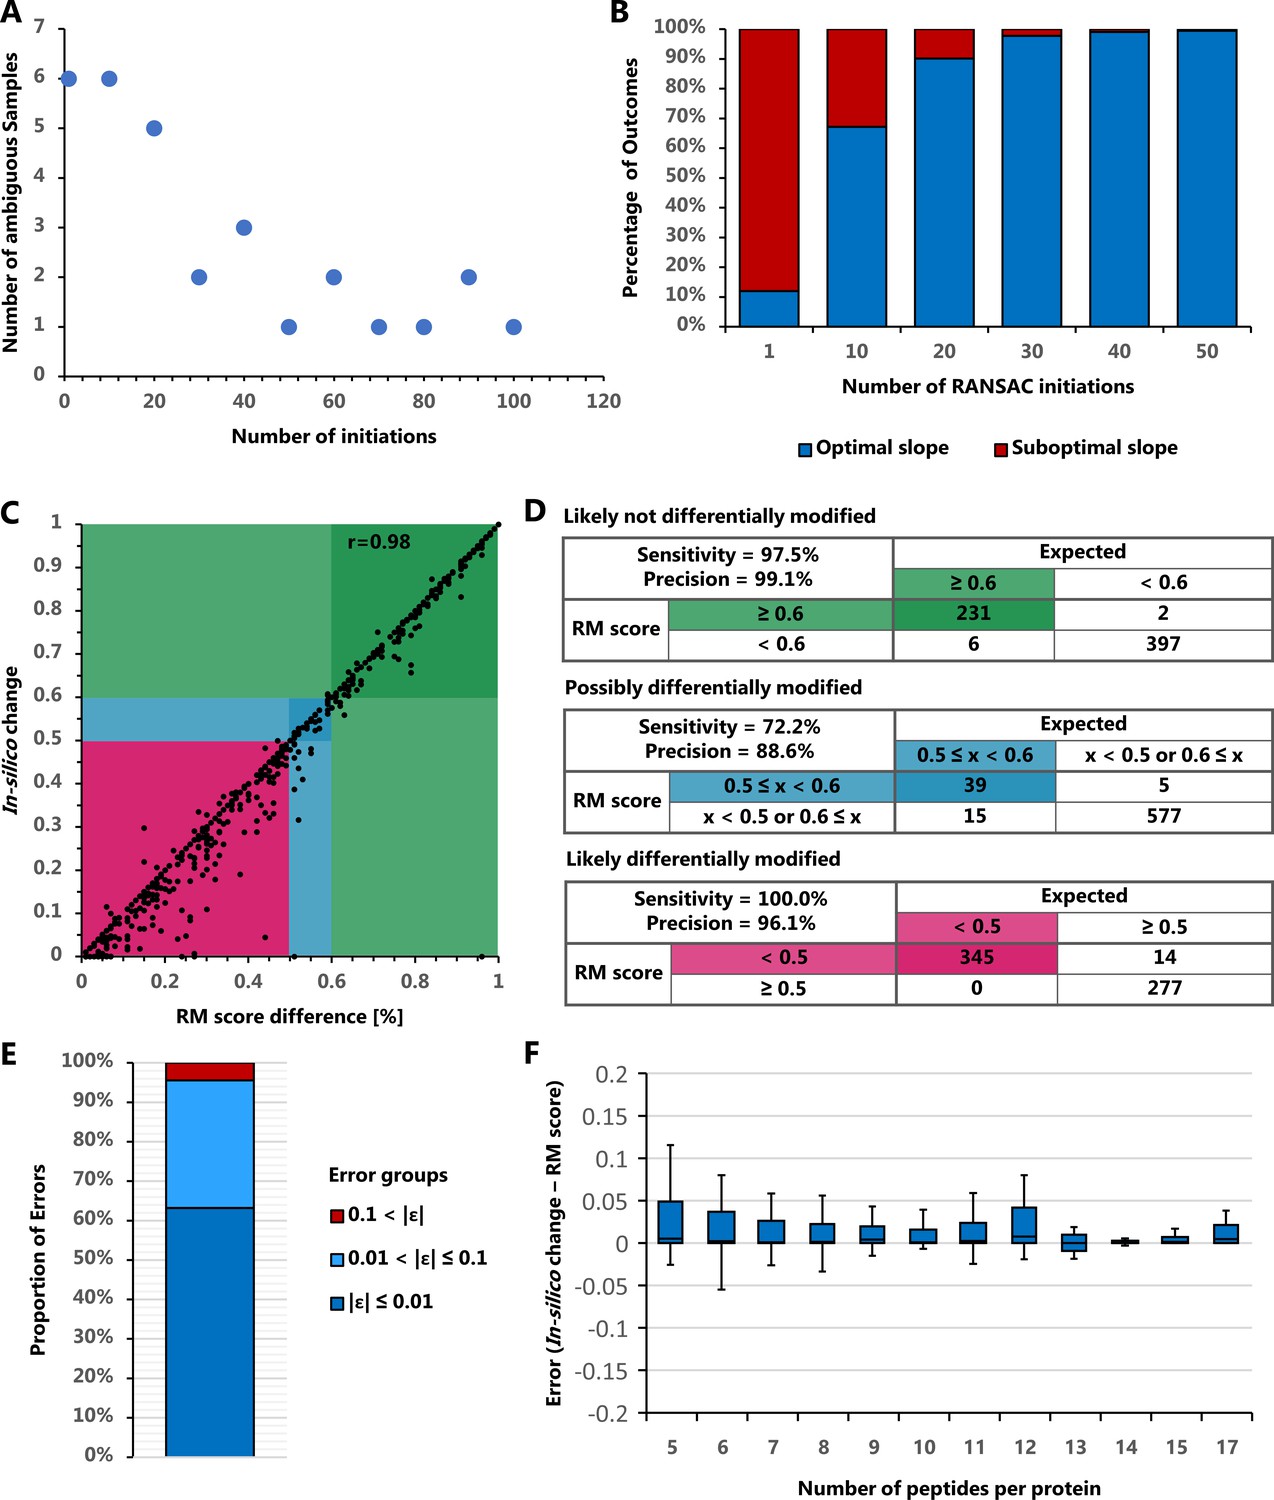
FLEXIQuant-LF reproducibility and error estimation.
(A) Number of ambiguous samples with different number of RANSAC initiations. The number of samples with ambiguous results over 1000 runs decreases with increasing number of RANSAC initiations but starts to oscillate between one and two ambiguous samples from 50 initiations upwards. (B) Fraction of optimal and suboptimal outcomes of PMF with sample 30. The frequency of a suboptimal outcome decreases with increasing number of RANSAC initiations. (C) Correlation of the expected/in silico created change with the RM score difference before and after the in silico change. Expected and measured changes highly correlate (Pearson r = 0.98). (D) Classification error estimation using definitions of likely not, possibly, and likely differentially modified as described in Figure 1B. With a sensitivity and precision of 72.2% and 88.6%, respectively, the transition area of possibly differentially modified evaluates expectedly worse than the likely not and likely differentially modified classifications (both with sensitivity and precision >96%). (E) Cumulative quantification error frequencies show 94.7% of cases below 0.1. (F) Quantification error associated with number of peptides used per protein (boxes indicated 2nd and 3rd quartiles while whiskers indicate data 1.5 times the inter quartile range above and below these quartiles). Overall quantification errors are very low and further improve with the number of peptides used for FLEXIQuant-LF analysis.
Tables
Key resources table
| Reagent type (species) or resource | Designation | Source or reference | Identifiers | Additional information |
|---|---|---|---|---|
| Cell line (Homo sapiens) | HeLa S3 | ATCC | Cat# CCL-2.2, RRID:CVCL_0058 | |
| Antibody | Mouse monoclonal CDC27 antibody (AF3.1) | Santa Cruz | Cat# sc-9972 | IP (1:3) |
| Antibody | Mouse polyclonal Normal mouse IgG | Santa Cruz | Cat# sc-2025 | IP (1:6) |
| Peptide, recombinant protein | HRM calibration peptides (iRT peptides) | Biognosys | Cat# Ki-3002 | |
| Peptide, Recombinant protein | Trypsin (sequencing grade modified trypsin) | Promega | V517 | |
| Chemical compound, drug | Nacodazole | Sigma Aldrich | Cat# M1404 | 100 ng/ml |
| Chemical compound, drug | Penicillin and streptomycin mix | Invitrogen | Cat# 15140–122 | 100 μg/ml |
| Chemical compound, drug | Halt Protease and Phosphatase Inhibitor | Thermo Fisher | Cat# 78442 | |
| Software, algorithm | FLEXIQuant-LF | This paper | See Abstract, Materials and methods, Data and Software Availability | |
| Software, algorithm | MaxQuant v1.5.2.8 | Cox lab, Max Planck Institute of Biochemistry | https://www.maxquant.org | |
| Software, algorithm | ProteinPilot v4.5.1 | Sciex | https://sciex.com/ | |
| Software, algorithm | Spectronaut v7.0 | Biognosys | https://biognosys.com | |
| Other | DMEM media | Invitrogen | Cat# 11965 | |
| Other | FBS | Invitrogen | Cat# 26140–079 | |
| Other | L-glutamine | Invitrogen | ThermoFisher: Cat# 25030149 | |
| Other | 4–12% SDS-PAGE gel | Invitrogen | Cat# NP0329BOX | |
| Other | MES buffer | Invitrogen | Cat# NP0002-02 | |
| Other | Thymidine | Sigma Aldrich | Cat# T1895 | |
| Other | RIPA Lysis Buffer | Santa Cruz | Cat# sc-24948 | |
| Other | Affi-Prep Protein A beads | Biorad | Cat# 1560006 | |
| Other | Formic acid (FA) | Thermo Fisher | Cat# A117-50 | |
| Other | Acetonitrile (ACN) | Thermo fisher | Cat# A955-4 | |
| Other | Water | Thermo fisher | Cat# W6-4 | |
| Other | TripleTOF 5600 | Sciex | https://sciex.com/ | |
| Other | Nano cHiPLC trap column (200 µm x 0.5 mm Reprosil C18 3 µm 120 Å) | Eksigent | Cat# 804–00016 | |
| Other | Nano cHiPLC column (75 µm x 15 cm Reprosil C18 3 µm 120 Å) | Eksigent | Cat# 804–00011 | |
| Other | DTT | Sigma Aldrich | Cat# D9779 |
Table 1
Overview of FLEXIQuant-LF analysis for the APC/C complex components during nocodazole arrest.
Column name explanations: Quant. peptides: quantified peptides; Seq. cov.: sequence coverage; Likely diff. modified: number of peptides classified as likely differentially modified; Possibly diff. modified: number of peptides classified as possibly differentially modified; Excluded: number of peptides classified as outliers and thus excluded from RM score calculation; (DDA: number of peptides classified as differentially modified for which we found evidence in our DDA data; Lit.: number of peptides classified as differentially modified for which we found evidence for modification in the literature).
| FLEXIQuant-LF analysis | Evidence | ||||||||
|---|---|---|---|---|---|---|---|---|---|
| Protein | Quant. peptides | Seq. cov. | Likely diff. modified | Possibly diff. modified | Excluded | DDA | Lit. | No evidence | |
| APC1 | 54 | 39% | 7 | 4 | 4 | 8 | 9 | 2 | |
| APC4 | 28 | 43% | 0 | 0 | 2 | - | - | 0 | |
| APC5 | 37 | 59% | 4 | 5 | 2 | 2 | 8 | 1 | |
| APC7 | 27 | 52% | 4 | 2 | 1 | 1 | 4 | 2 | |
| APC10 | 9 | 69% | 0 | 0 | 3 | - | - | 0 | |
| APC15 | 1 | 30% | 0 | 0 | 0 | - | - | 0 | |
| APC16 | 3 | 30% | 0 | 0 | 0 | - | - | 0 | |
| CDC16 | 23 | 41% | 3 | 2 | 3 | 1 | 3 | 2 | |
| CDC20 | 7 | 22% | 1 | 0 | 1 | 0 | 1 | 0 | |
| CDC23 | 33 | 52% | 3 | 3 | 4 | 3 | 5 | 1 | |
| CDC27 | 33 | 55% | 9 | 4 | 1 | 6 | 12 | 1 | |
| in total | 248 | AVG 47% | 30 12% | 20 8% | 20 8% | 21 42% | 41 82% | 9 18% | |
Table 2
Differentially modified peptides.
Overview of peptides classified as likely or possibly differentially modified and resulting RM scores of the FLEXIQuant-LF analysis of APC/C.
| Protein | Peptide | Start | End | RM score | |||
|---|---|---|---|---|---|---|---|
| 4 hr | 8 hr | 10 hr | |||||
| APC1 | GDSPVTSPFQNYSSIHSQSR | 311 | 330 | 0.71 | 0.37 | 0.27 | |
| SPSISNMAALSR | 341 | 352 | 0.71 | 0.32 | 0.29 | ||
| FSEQGGTPQNVATSSSLTAHLR | 285 | 306 | 0.69 | 0.34 | 0.30 | ||
| AHSPALGVHSFSGVQR | 353 | 368 | 0.69 | 0.35 | 0.30 | ||
| NFDFEGSLSPVIAPK | 680 | 694 | 0.80 | 0.43 | 0.36 | ||
| LLQLCamQR | 1070 | 1076 | 0.57 | 0.51 | 0.45 | ||
| ARPSETGSDDDWEYLLNSDYHQNVESHLLNR | 696 | 726 | 0.78 | 0.61 | 0.48 | ||
| LHDSLYNEDCamTFQQLGTYIHSIR | 566 | 588 | 0.75 | 0.42 | 0.50 | ||
| SLCamLSPSEASQMK | 727 | 739 | 0.83 | 0.61 | 0.51 | ||
| TMALPVGR | 1077 | 1084 | 0.65 | 0.59 | 0.56 | ||
| LHDSLYNEDCamTFQQLGTYIHSIRDPVHNR | 566 | 594 | 0.69 | 0.63 | 0.57 | ||
| APC5 | EELDVSVR | 190 | 197 | 0.64 | 0.42 | 0.35 | |
| EEEVSCamSGPLSQK | 198 | 210 | 0.59 | 0.39 | 0.40 | ||
| ALTPASLQK | 230 | 238 | 0.57 | 0.49 | 0.43 | ||
| CamQVASAASYDQPK | 670 | 682 | 0.52 | 0.47 | 0.46 | ||
| KTVEDADMELTSR | 168 | 180 | 0.76 | 0.64 | 0.50 | ||
| LILTGAESK | 281 | 289 | 0.67 | 0.53 | 0.52 | ||
| LMAEGELK | 99 | 106 | 0.70 | 0.58 | 0.54 | ||
| DSDLLHWK | 404 | 411 | 0.58 | 0.58 | 0.57 | ||
| TVEDADMELTSR | 169 | 180 | 0.82 | 0.63 | 0.59 | ||
| APC7 | VRPSTGNSASTPQSQCamLPSEIEVK | 116 | 139 | 0.85 | 0.46 | 0.41 | |
| AYAFVHTGDNSR | 242 | 253 | 0.60 | 0.47 | 0.47 | ||
| DMAAAGLHSNVR | 43 | 54 | 0.61 | 0.52 | 0.49 | ||
| YTMALQQK | 100 | 107 | 0.70 | 0.47 | 0.54 | ||
| ALTQRPDYIK | 468 | 477 | 0.67 | 0.55 | 0.57 | ||
| CDC16 | QTAEETGLTPLETSR | 573 | 587 | 0.86 | 0.34 | 0.34 | |
| CamYDFDVHTMK | 544 | 553 | 0.60 | 0.55 | 0.45 | ||
| SSICamLLR | 130 | 136 | 0.65 | 0.60 | 0.49 | ||
| IYDALDNR | 139 | 146 | 0.71 | 0.56 | 0.52 | ||
| DPFHASCamLPVHIGTLVELNK | 261 | 280 | 0.44 | 1.00 | 0.60 | ||
| CDC20 | VLSLTMSPDGATVASAAADETLR | 446 | 468 | 0.51 | 0.32 | 0.34 | |
| CDC23 | NQGETPTTEVPAPFFLPASLSANNTPTR | 558 | 585 | 0.82 | 0.27 | 0.13 | |
| RVSPLNLSSVTP | 586 | 597 | 0.71 | 0.30 | 0.20 | ||
| VSPLNLSSVTP | 587 | 597 | 0.82 | 0.36 | 0.28 | ||
| AALYFQR | 350 | 356 | 0.67 | 0.57 | 0.52 | ||
| LWDEASTCamAQK | 525 | 535 | 0.74 | 0.62 | 0.56 | ||
| NTSAAIQAYR | 380 | 389 | 0.70 | 0.55 | 0.56 | ||
| CDC27 | EVTPILAQTQSSGPQTSTTPQVLSPTITSPPNALPR | 341 | 376 | 0.46 | 0.31 | 0.19 | |
| LDSSIISEGK | 432 | 441 | 0.66 | 0.33 | 0.27 | ||
| LFTSDSSTTK | 381 | 390 | 0.58 | 0.29 | 0.30 | ||
| YSLNTDSSVSYIDSAVISPDTVPLGTGTSILSK | 224 | 256 | 0.56 | 0.32 | 0.33 | ||
| LNLESSNSK | 215 | 223 | 0.69 | 0.33 | 0.33 | ||
| GGITQPNINDSLEITK | 416 | 431 | 0.73 | 0.47 | 0.41 | ||
| QPETVLTETPQDTIELNR | 197 | 214 | 0.71 | 0.42 | 0.41 | ||
| SVFSQSGNSR | 331 | 340 | 0.66 | 0.35 | 0.42 | ||
| FTSLQNFSNCamLPNSCamTTQVPNHSLSHR | 170 | 196 | 0.73 | 0.46 | 0.45 | ||
| ISTITPQIQAFNLQK | 442 | 456 | 0.77 | 0.54 | 0.52 | ||
| ASVLFANEK | 710 | 718 | 0.53 | 0.48 | 0.56 | ||
| HYNAWYGLGMIYYK | 634 | 647 | 0.53 | 0.76 | 0.59 | ||
| DAVFLAER | 23 | 30 | 0.62 | 0.61 | 0.59 | ||
Additional files
-
Supplementary file 1
Raw peptide intensities of all identified APC/C components.
- https://cdn.elifesciences.org/articles/58783/elife-58783-supp1-v1.xlsx
-
Supplementary file 2
Comparison RM scores proteins analyzed individually and using the ‘superprotein’ approach.
- https://cdn.elifesciences.org/articles/58783/elife-58783-supp2-v1.xlsx
-
Supplementary file 3
Comparison RM scores for simulated independent dataset.
- https://cdn.elifesciences.org/articles/58783/elife-58783-supp3-v1.xlsx
-
Transparent reporting form
- https://cdn.elifesciences.org/articles/58783/elife-58783-transrepform-v1.pdf
Download links
A two-part list of links to download the article, or parts of the article, in various formats.
Downloads (link to download the article as PDF)
Open citations (links to open the citations from this article in various online reference manager services)
Cite this article (links to download the citations from this article in formats compatible with various reference manager tools)
FLEXIQuant-LF to quantify protein modification extent in label-free proteomics data
eLife 9:e58783.
https://doi.org/10.7554/eLife.58783


