Altered N-glycan composition impacts flagella-mediated adhesion in Chlamydomonas reinhardtii
- Key Laboratory of Algal Biology, Institute of Hydrobiology, Chinese Academy of Sciences, China
- University of Chinese Academy of Sciences, China
- Institute for Plant Biology and Biotechnology, University of Münster, Germany
- Institute of Integrative Biology, University of Liverpool, United Kingdom
- State Key Laboratory of Microbial Technology, and Marine Biotechnology Research Center, Shandong University, China
- Max Planck Institute for Dynamics and Self-Organization (MPIDS), Germany
- Institute of Biology, Experimental Biophysics, Humboldt University of Berlin, Germany
- Experimental Physics V, University of Bayreuth, Germany
- College of Marine Life Sciences, and Frontiers Science Center for Deep Ocean Multispheres and Earth System, Ocean University of China, China
- Institute of Plant Science and Resources, Okayama University, Japan
Figures
Figure 1 with 7 supplements
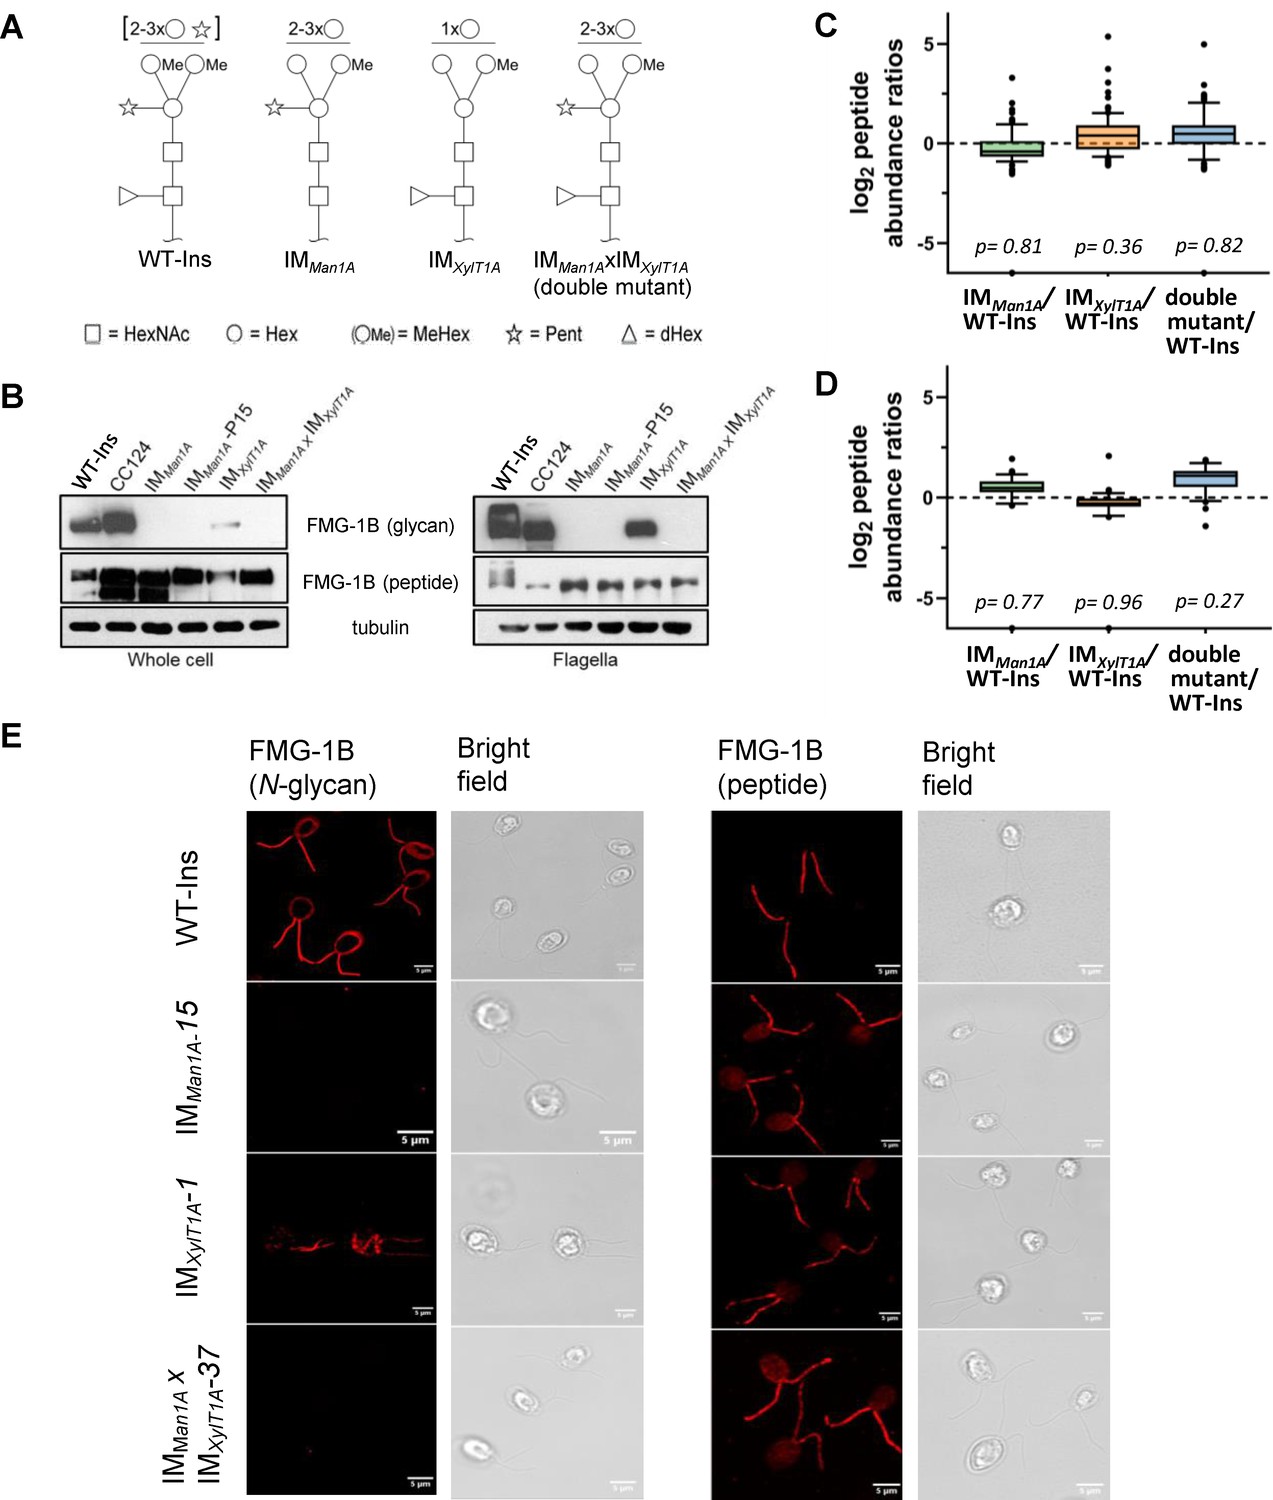
Altered N-glycosylation of FMG-1B does not change its flagellar localization.
(A) Diagram of N-linked glycan compositions of mutant strains characterized in Schulze et al., 2018 and used in the current study. While IMMan1A and the double mutant are mainly characterized by a lower degree of methylation (Me), N-glycans of IMXylT1A are decreased in length and lack the core xylose. All monosaccharides depicted above the horizontal line can be bound to any subjacent residue or to any residue at the same level. Square: (N-Acetylglucosamine, Circe: hexose, Triangle: fucose, Star: xylose). (B) Probing whole-cell and flagella samples with antibodies directed against N-glycans or the protein backbone of FMG-1B (Bloodgood et al., 1986). (C) Log2 peptide abundances of FMG-1B obtained by label-free MS analysis. (D) Log2 peptide abundances of FAP-113 obtained by label-free MS analysis. (E) Immuno-staining of WT-Ins mutant cells (IMMan1A, IMXylT1A or IMMan1AxIMXylT1A) with antibodies directed against FMG-1B. IMMan1A, IMXylT1A or IMMan1AxIMXylT1A express IFT46::YFP. To prevent YFP signal to interfere in immune staining and allow direct comparison of signal in WT-Ins and mutants, strains were crossed with WT-CC124 and progenies of IMMan1A, IMXylT1A or IMMan1AxIMXylT1A absent of IFT46::YFP (#37, #1 and #15) used for immuno-staining experiments (see Figure 1—figure supplement 5).
Figure 1—figure supplement 1
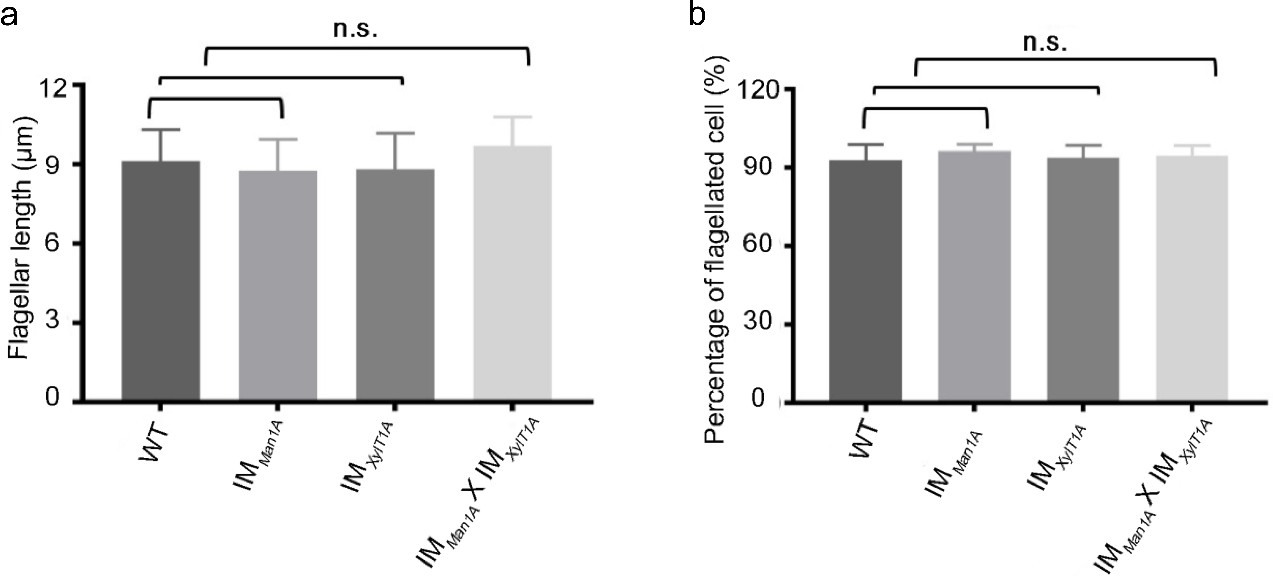
Flagellar length is not altered in N-glycosylation mutants.
(a) Measurement of the flagellar length (in µm) among WT-Ins and three mutants. 50 flagella were measured in each experiment and this experiment has three biological repeats. Error bar: mean ± SD. p>0.05. (b) Percentage of flagellated cell in WT-Ins and IM strains. The result of three biological replicates is shown. Error bar: mean ± SD. p>0.05.
Figure 1—figure supplement 2
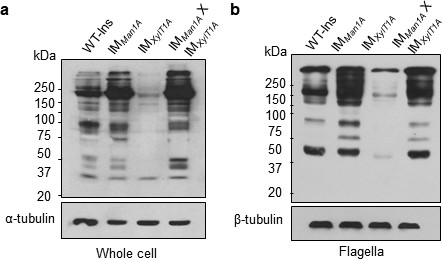
N-Glycan structures are altered in mutants as compared to WT-Ins.
Whole-cell proteins (a) and isolated flagella (b) of WT-Ins and mutants were separated on a 7% SDS-PAGE, transferred to nitrocellulose and probed with anti-HRP, which is specifically binding to β1,2-xylose and α1,3-fucose attached to the N-glycan core. α-tubulin, as loading controls.
Figure 1—figure supplement 3
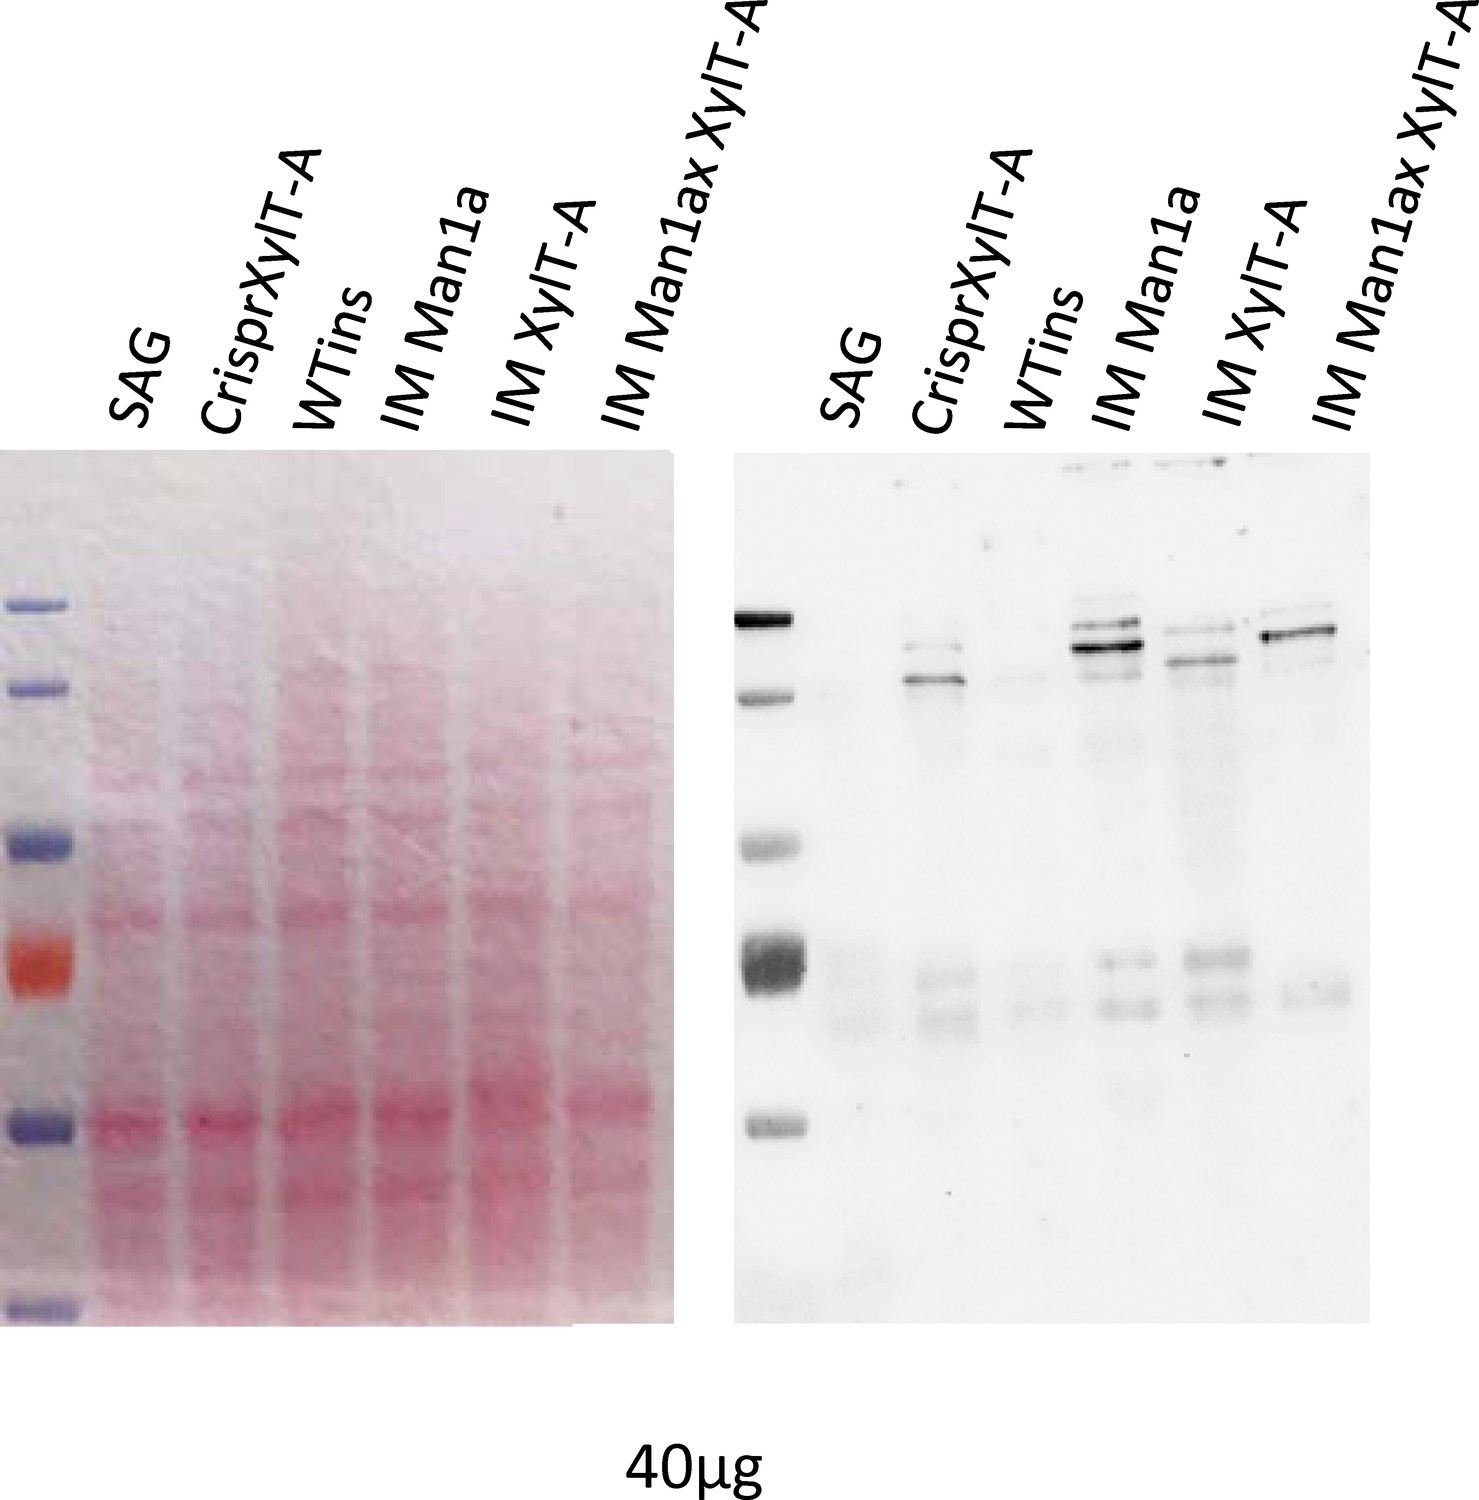
N-glycosylation mutants show increased Concanavalin-A affinity.
Whole-cell proteins of WT-SAG, WT-Ins and mutants were separated on a 7% SDS-PAGE, transferred to nitrocellulose and probed with the lectin Concanavalin A, which binds specific N-glycan epitopes. To ensure equal protein loading membrane was stained before lectin probing with ponceau red (left).
Figure 1—figure supplement 4
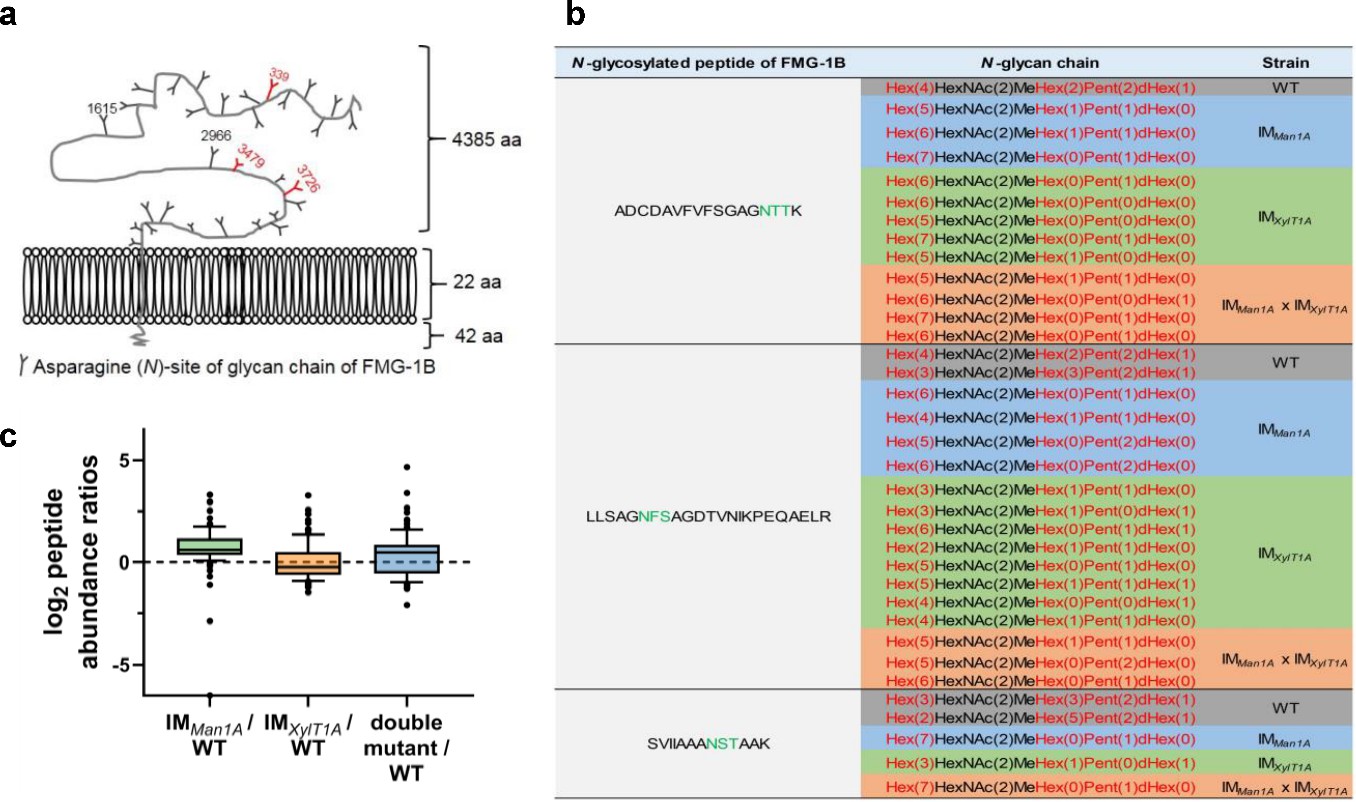
Change of N-glycan pattern of FMG-1B in IM strains as compared to WT-Ins.
(a) Diagram of the topology of FMG-1B, the major component of the glycocalyx in C. reinhardtii. The identified N-linked glycosylation sites are marked. (b) Comparison of FMG-1B proteotypic N-glycopeptides identified by IS-CID/SugarPy in WT-Ins, IMMan1A, IMXylT1A and IMMan1AxIMXylT1A. (c) The relative peptide abundances of FMG-1A in IMMan1A, IMXylT1A and IMMan1AxIMXylT1A strains compared it in WT-Ins obtained by label-free MS analysis.
Figure 1—figure supplement 5

Genetic crossing of original IM strains (mt+) with CC124 (mt-) to obtain mutants lacking IFT46::YFP.
(a) Screening the progenies of IMMan1A mutants with WT-CC-124 to obtain the mutant without IFT46::YFP background, which grew in TAP plate with Paromomycin added and died in TAP plate with Hygromycin added. (b) Determination of mRNA levels of MAN1A gene in progeny clones P14, P15, and WT-Ins. IMMan1A -P14 still can live in TAP plate with Paromomycin or Hygromycin. IMMan1A -P15 grew in TAP plate with Paromomycin and died in TAP plate added Hygromycin, which is the strain IFT46::YFP had been removed. Error bar: mean ± SD. Asterisks indicate statistically significant differences (p<0.01). (c) Comparison of mRNA level of MAN1A gene in progeny clones with CC-124. Error bar: mean ± SD. Asterisks indicate statistically significant differences (p<0.01). (d) Determination of the expression of IFT46::YFP in whole-cell of WT-Ins and IMMan1A -P15 mutant. IMMan1A -P15 is the offspring generated by crossing IMMan1A -P15 mutant (mt+) with CC124 (mt-). α-tubulin, as loading control. (e) Determination of the expression of IFT46::YFP in whole-cell of WT-Ins and IMXylT1A -P1 mutant. α-tubulin, as loading control. (f) Determination of the expression of IFT46::YFP in progenies from the crossing CC124 with IMMan1A X IMXylT1A. α-tubulin, as loading control.
Figure 1—figure supplement 6
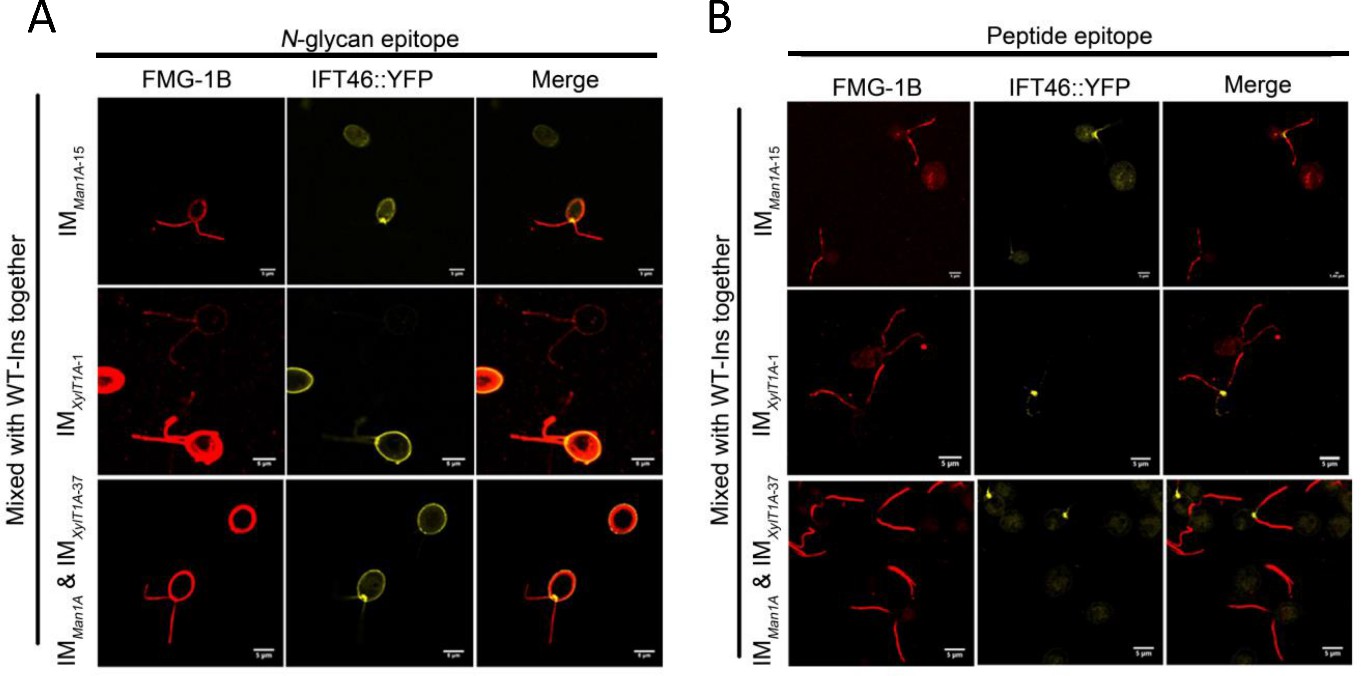
The altered N-glycan did not change the localization FMG-1B in flagella.
(A) The mutants of IMMan1A-P15, IMXylT1A -P37, IMMan1A X IMXylT1A -P37 were mixed with equal amount of WT-Ins expressing IFT46::YFP, then immune stained with an antibody against N-glycan epitope, there is at least one WT-Ins cell and one mutant cell in each picture. (B) The mutants of IMMan1A-P15, IMXylT1A -P37, IMMan1A X IMXylT1A -P37 were mixed with equal amount of WT-Ins expressing IFT46::YFP, then immune stained with a peptide antibody of FMG-1B, there are at least one WT-Ins cell and one mutant cell in each picture.
Figure 1—figure supplement 7

Quantitative mass spectrometry of isolated flagellar from WT-Ins and N-glycosylation mutants.
(a) Experimental procedures of flagella isolation and following analyses. (b) Immunoblot of isolated flagella probed with antibodies against chloroplast marker protein (Cytf, cytochrome f) and mitochondrium marker protein (COXIIB). The absence of respective marker proteins in the flagellar fraction prove the purity of flagellar samples while ponceau staining of the same membrane indicates that similar amounts of protein were loaded. (c) Proteins found significantly differential in abundance in IM strains compared to WT-Ins. Entries of proteins are given with corresponding phytozome ID protein description.
Figure 2 with 1 supplement
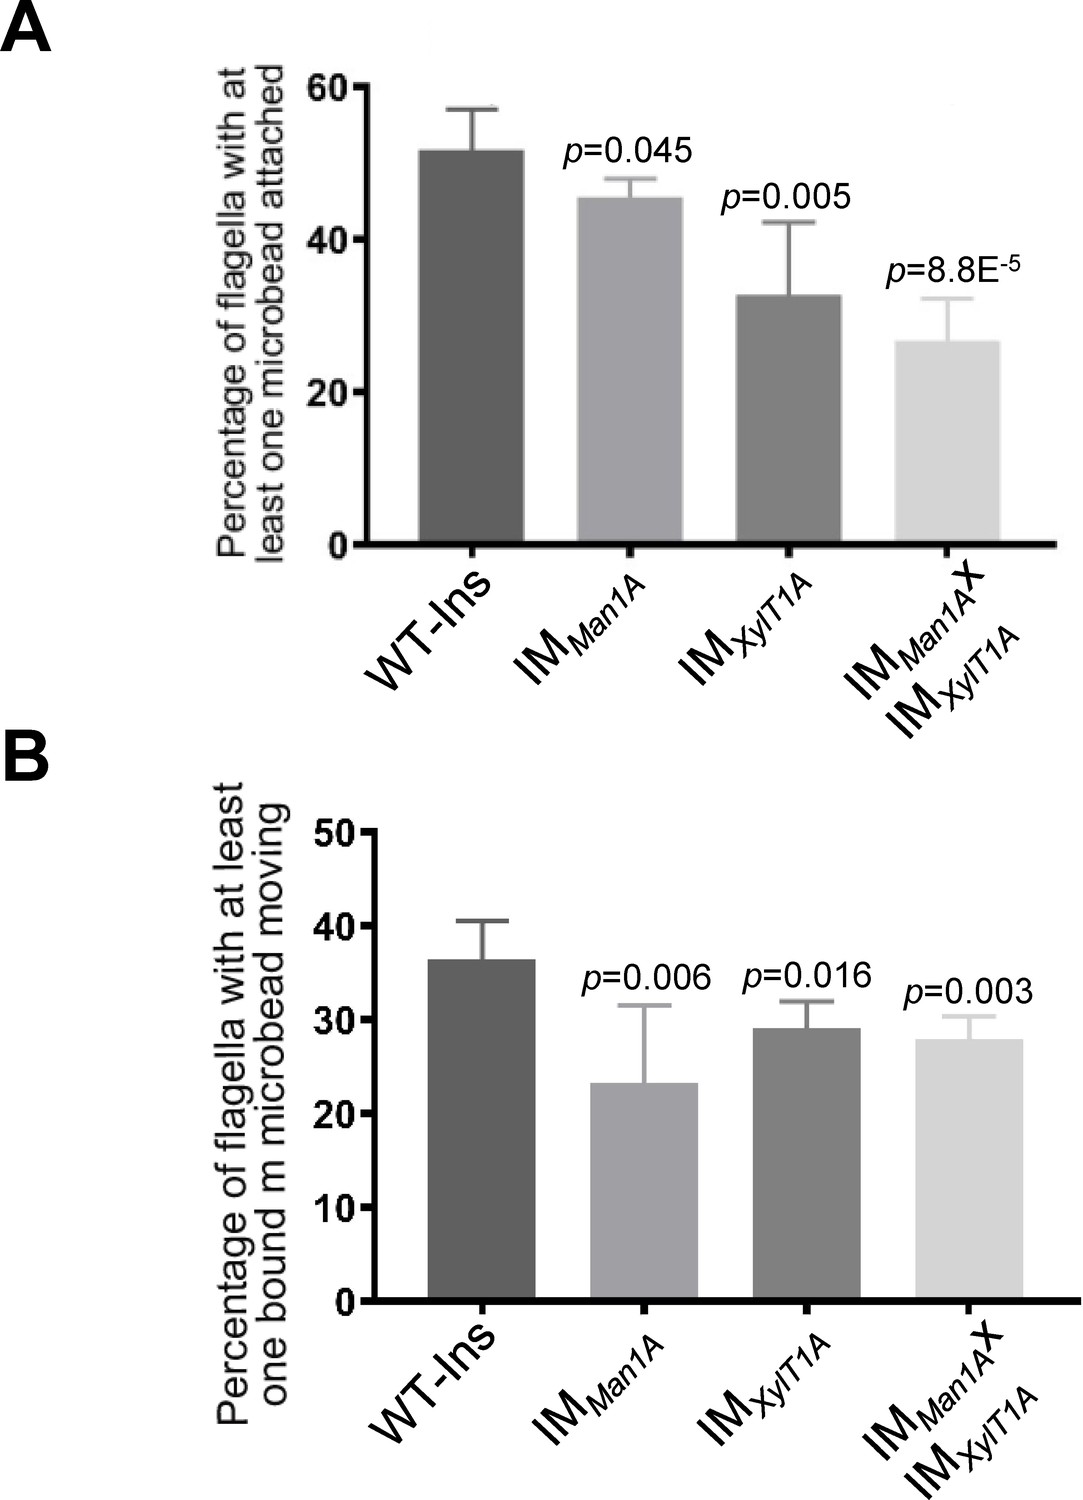
Altered N-glycosylation diminishes flagellar polystyrene bead attachment and -transport.
(A) Percentage of flagella with at least one polystyrene bead bound. Cells were incubated with polystyrene beads (0.7 µm in diameter) and subsequently analyzed by light microscopy. (B) Percentage of polystyrene beads transported along the flagellum with at least one polystyrene bead bound. Results present mean of three replicates with 50 cells analyzed per replicate. Error bars show SEM of three replicates. T-test was used for statistical analysis. Source data can be found in Figure 2—source data 1.
-
Figure 2—source data 1
Raw data of attachment and movement of microbeads to and along flagella.
- https://cdn.elifesciences.org/articles/58805/elife-58805-fig2-data1-v2.xlsx
Figure 2—video 1
Attachment and movement of a microsphere to and along flagella.
To obtain a kinetic measure of surface motility, cells were mixed with beads as above for 5 min and randomly observed under the light microscope. Each bead adhered to a flagellum was monitored for about 30 s. If beads moved along the flagella, we marked it as ‘Moved bead’ or it was ‘Adhered bead’.
Figure 3 with 2 supplements
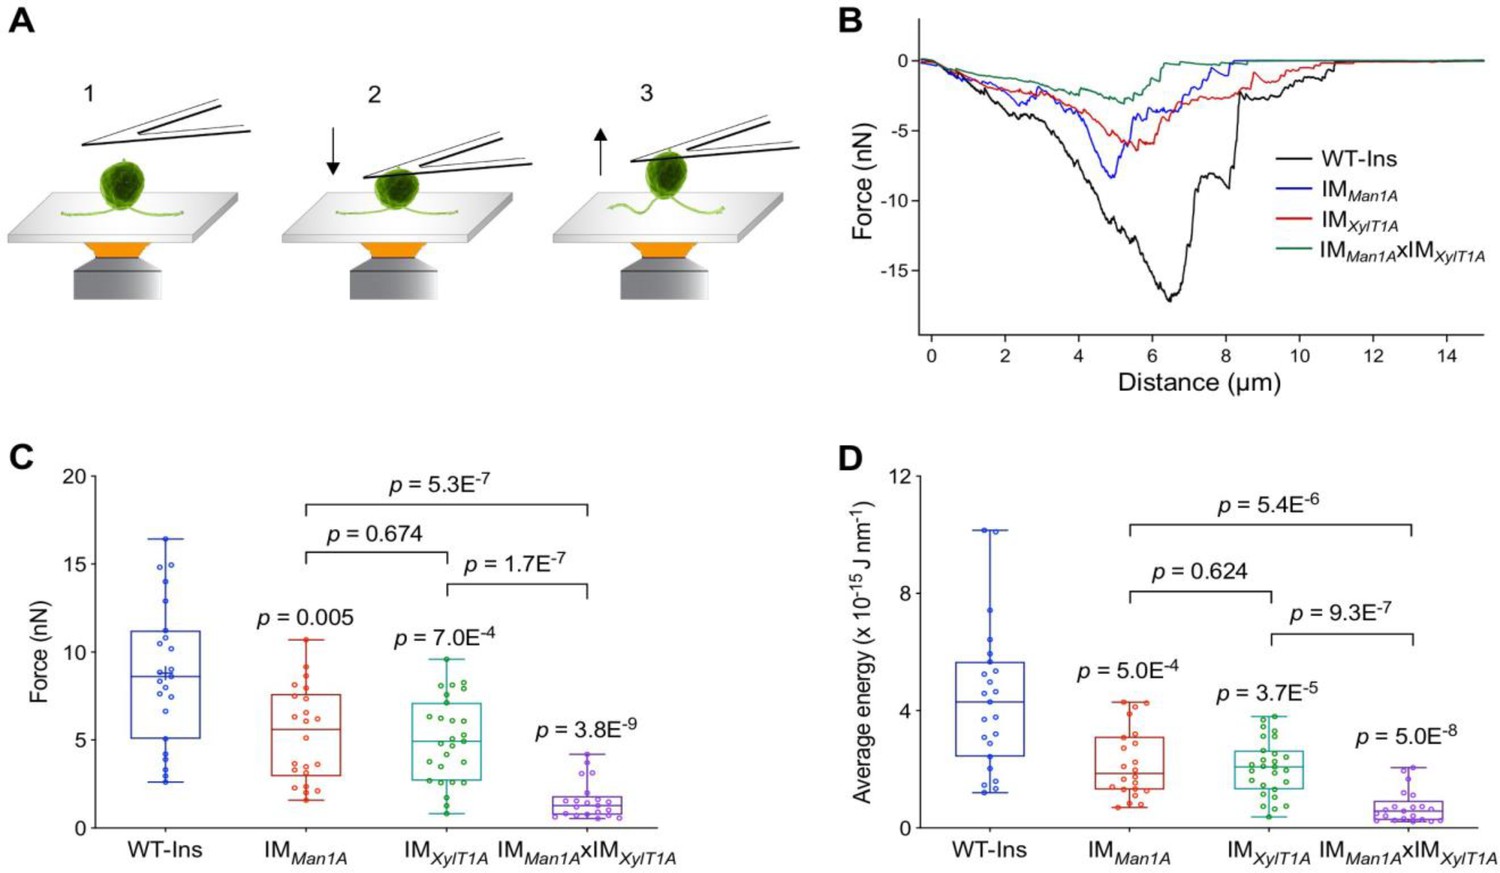
Quantification of the flagella-mediated adhesion using atomic force microscopy.
(A) Diagram of experimental procedures for force measurement: the cell adhered to the surface (1); the cell attached to the AFM cantilever (2); the cell was pulled up from the surface by AFM cantilever (3). Please note, that retrograde IFT, i.e. gliding was inhibited by ciliobrevin D during all measurements presented here. (B) Representative force curves acquired for strains including WT, IMMan1A, IMXylT1A, and IMMan1AxIMXylT1A. (C) Flagella adhesion forces of WT-Ins, IMMan1A, IMXylT1A, and IMMan1AxIMXylT1A were generated from force curves (B). (D) Average energy of flagellar adhesion of WT-Ins, IMMan1A, IMXylT1A, and IMMan1AxIMXylT1A. Three biological replicates were performed with minimum 5 cells measured per replicate. The p-values are obtained from a two-sided, two sample t-test of mean values. Source data can be seen in Figure 3—source data 1.
-
Figure 3—source data 1
Raw data of AFM mesurement (force, average energy).
- https://cdn.elifesciences.org/articles/58805/elife-58805-fig3-data1-v2.xlsx
Figure 3—figure supplement 1
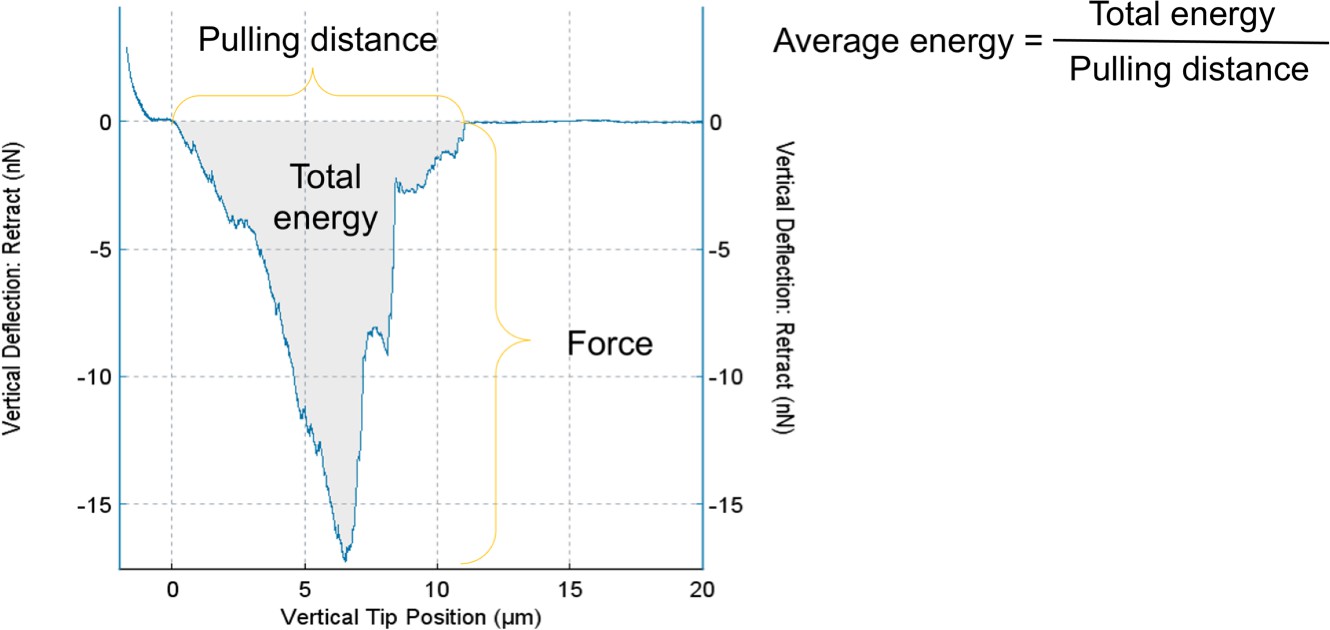
Analysis of the force and energy required to overcome the adhesion of C. reinhardtii flagella to the surface from AFM force curves.
The curve shows the relation of pulling force and pulling distance during AFM probe retracting. The lowest point of the curve represents the maximal adhesion force of flagella which was used in Figure 3C. The area of shaded region represents the total energy calculated by the JPK SPM Data Processing software for pulling up the cell. The average energy is calculated via dividing total energy by pulling distance as shown in the figure. Source data can be seen in Figure 3—figure supplement 1—source data 1.
-
Figure 3—figure supplement 1—source data 1
Exemplary data of AFM measurement.
- https://cdn.elifesciences.org/articles/58805/elife-58805-fig3-figsupp1-data1-v2.xlsx
Figure 3—figure supplement 2
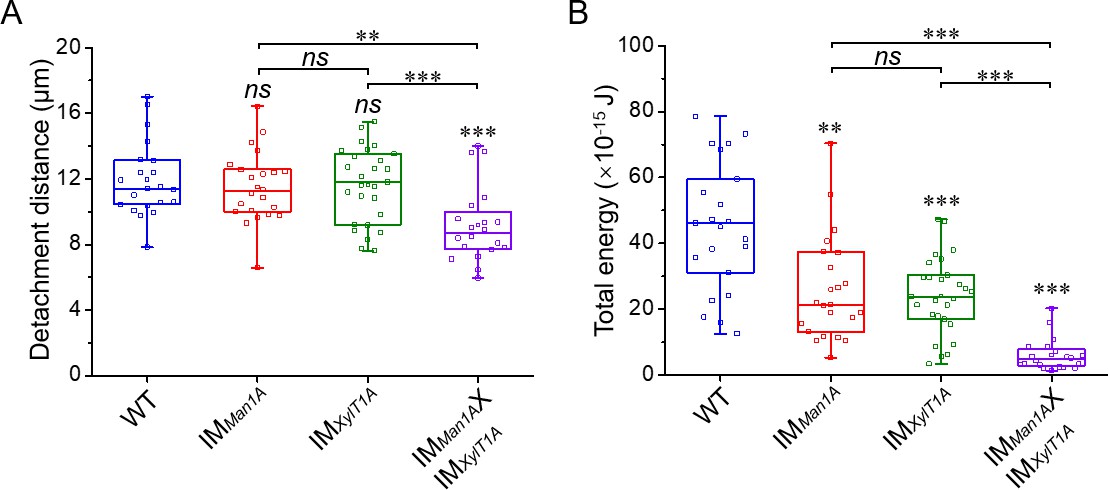
Detachment distance and total energy of the flagella adhesion quantified by atomic force microscopy.
(A) Flagella detachment distances of WT-Ins, IMMan1A, IMXylT1A, and IMMan1AxIMXylT1A were generated from force curves. (B) Total energy of flagellar adhesion of WT-Ins, IMMan1A, IMXylT1A, and IMMan1AxIMXylT1A. Three biological replicates were performed with minimum 5 cells measured per replicate. *p<0.05, **p<0.01, ***p<0.001. The p values are obtained from a two-sided, two sample t-test of mean values. Source data can be seen in Figure 3—figure supplement 2—source data 1.
-
Figure 3—figure supplement 2—source data 1
Raw data of AFM measurement (detachment distance, total energy).
- https://cdn.elifesciences.org/articles/58805/elife-58805-fig3-figsupp2-data1-v2.xlsx
Figure 4 with 3 supplements
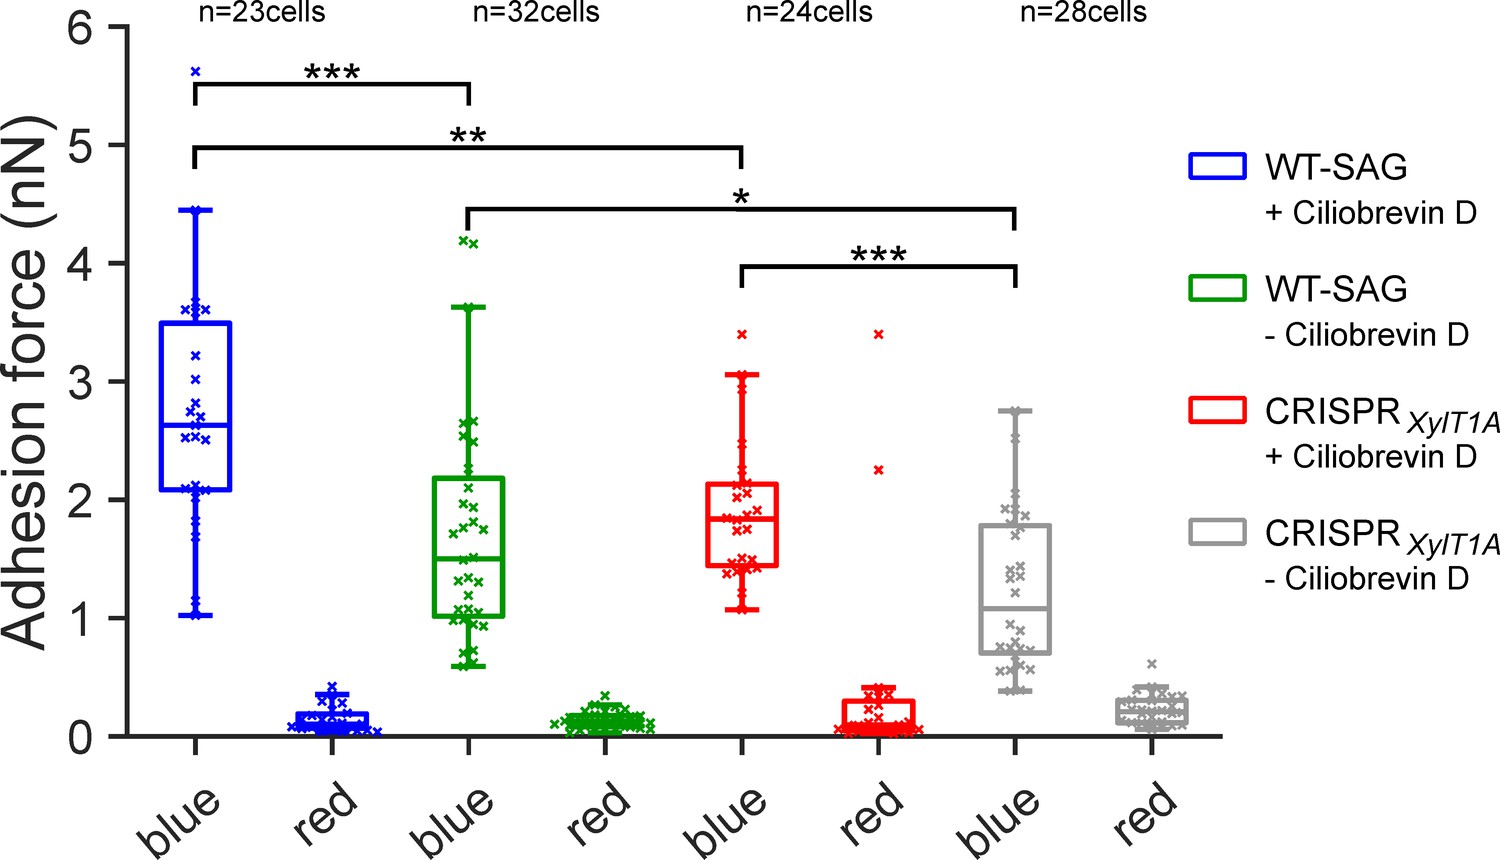
Assessing flagella adhesion forces using micropipette force microscopy.
Flagella-mediated adhesion forces acquired for WT-SAG and a xylosyltransferase 1A mutant generated in the genetic background of WT-SAG (CRISPRXylT1A_1). Micropipette force measurements of the same cells were performed for both strains under blue and red light in the (+) presence or (-) absence of ciliobrevin D. Mean values of 10 measurements per cell are depicted, statistical analysis was performed on mean values. The p-values obtained a from Kolmogorov-Smirnov test are respectively (from top to bottom): (***) p=0.0004, (**) p=0.0016, (*) p=0.0491, (***) p=0.0009. Source data can be seen in Figure 4—source data 1.
-
Figure 4—source data 1
Raw data of micropipette force measurement.
- https://cdn.elifesciences.org/articles/58805/elife-58805-fig4-data1-v2.docx
Figure 4—figure supplement 1
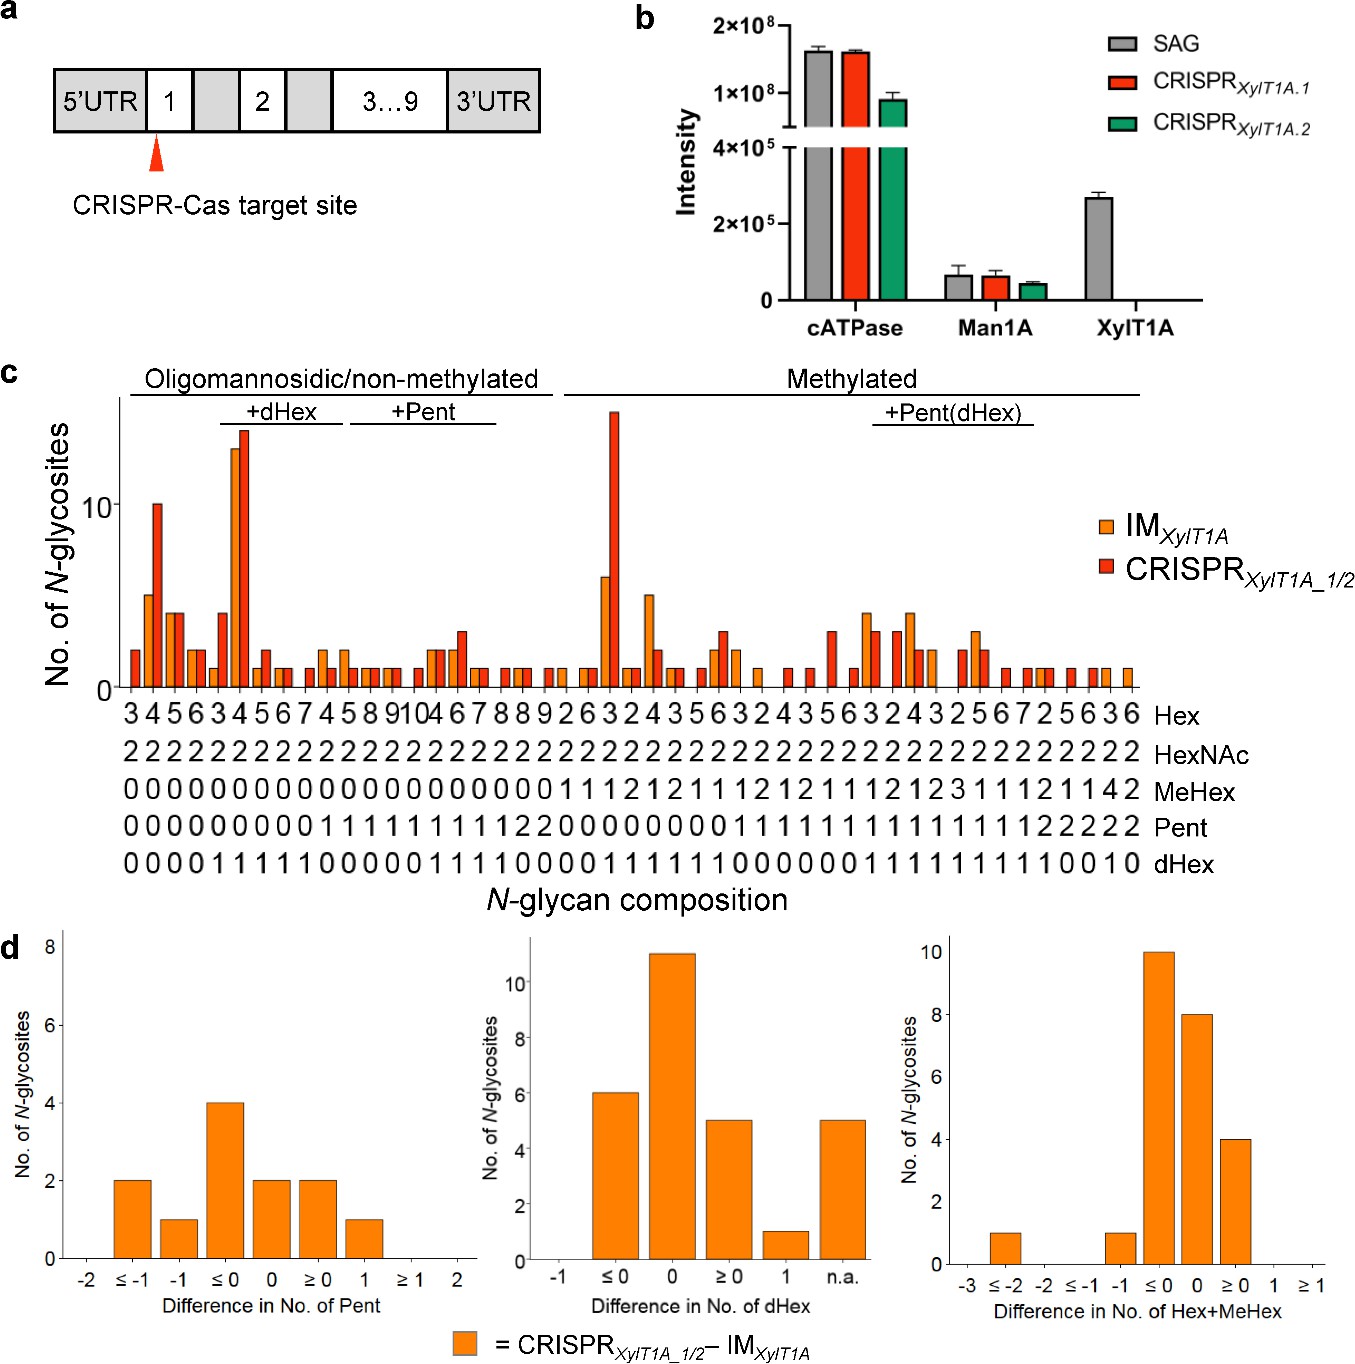
Xylosyltransferase 1A mutant generated via CRISPR/Cas9 supports findings in IMXylT1A.
(a) Schematic representation of the XylT1A gene including the site targeted by CIRSPR/Cas9. (b) Parallel reaction monitoring was employed to prove the knock out of XylT1A on proteomic level in two mutants generated by CRISPR/Cas9. (c) Comparison of N-glycan patterns between the XylT1A mutant strains in different genetic backgrounds (IM strain and CRISPR-Cas generated mutants) considering comparable N-glycosites. (d) Detailed comparison of the XylT1A strains in different genetic background looking specifically at Pent (left), dHex (middle) and N-glycan length (number of Hex+MeHex, right).
Figure 4—figure supplement 2
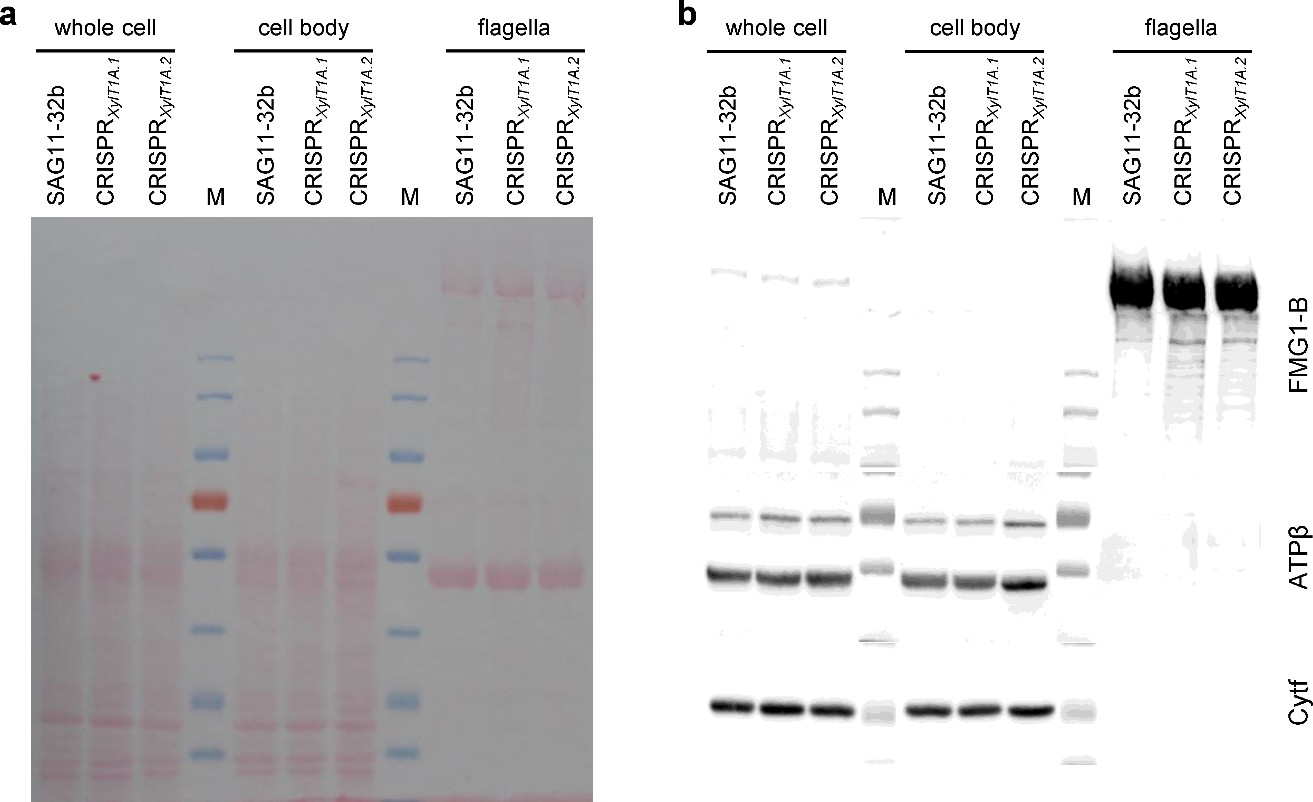
Immunoblot proving the presence of FMG-1B in flagella of CRISPRXylT1A.1 and CRISPRXylT1A.2.
30 µg of protein per sample were separated by SDS-PAGE and transferred to a nitrocellulose membrane in biological quadruplicates. (a) Ponceau staining of the membrane reveals equal loading between different strains and differential composition of different sample types. (b) On one hand, the FMG-1B protein backbone-specific antibody proves a correct targeting of FMG-1B to flagella in the mutants despite altered N-glycosylation. On the other, the application of antibodies specifically binding to a chloroplast (Cytf, cytochrome f) marker protein as well as to the ATPase beta subunit (mitochondrial and chloroplast) proves the purity of flagellar samples analyzed.
Figure 4—figure supplement 3
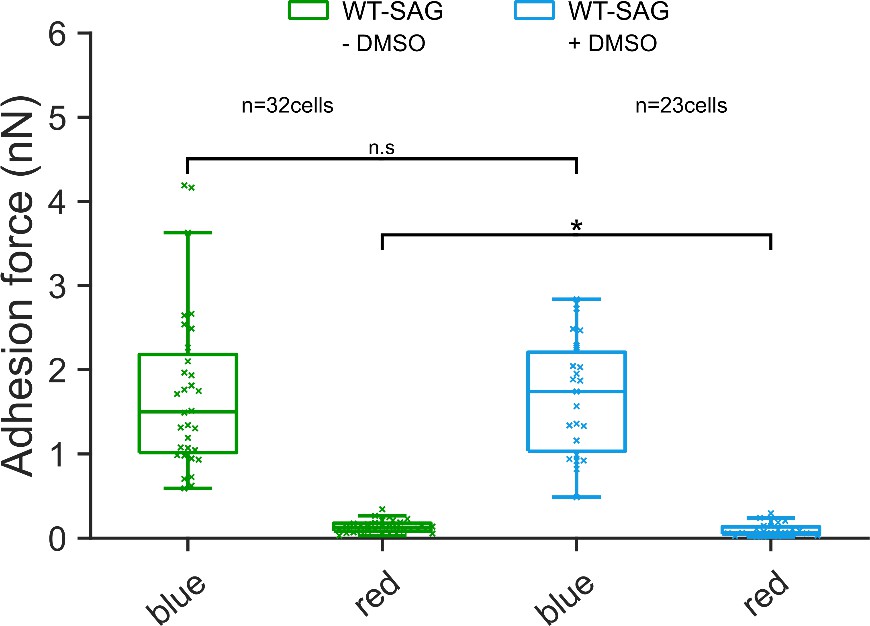
Study of the effect of DMSO on the flagella adhesion forces using micropipette force microscopy.
Micropipette force measurements of the same cells were performed for WT-SAG under blue and red light in the (+) presence or (-) absence of DMSO. The concentration of DMSO corresponds to the one used in the experiments with ciliobrevin D. Mean values of 10 measurements per cell are depicted, statistical analysis was performed on mean values. The p-values obtained a from Kolmogorov-Smirnov test are respectively (from top to bottom): (n.s.) p=0.9556, (*) p=0.0415.
Figure 5 with 1 supplement

IFT and gliding are unaffected in IMMan1AxIMXylT1A.
(A) Adhesion forces acquired for WT-Ins and the double mutant IMMan1AxIMXylT1A in the absence or presence of ciliobrevin D via AFM, respectively. Three biological replicates were performed with minimum 5 cells measured per replicate. (B) Representative kymograph of the movement of IFT46::YFP in flagella of WT-Ins acquired with TIRF microscopy used to calculate the velocity of gliding and IFT. White arrow: non-gliding event (v < 0.3 µm*s−1); green arrow: gliding event (v > 0.3 µm*s−1); red arrow: anterograde IFT track; blue: retrograde IFT track. (C) IFT and gliding are not significantly altered in the double mutant compared to WT-Ins. Proportion of gliding events (left), gliding velocity (excluding non-gliding events; middle), IFT velocities in either direction (right). Three biological replicates were performed with 10 cells evaluated per replicate corresponding to 300 IFTs/replicates/strain in case of IFT velocity. Error bars in bar plots represent SD of three replicates. Student t-test was performed comparing mean values of replicates in regard of proportion of gliding events and IFT velocity. Distribution of gliding velocities was analyzed by use of Mann-Whitney U test, n represents number of gliding events measured. Gliding and IFT analysis has been performed in absence of ciliobrevin D. Source data for can be seen in Figure 5—source data 1.
-
Figure 5—source data 1
Raw data of IFT tracking and gliding velocity by TIRF microscopy.
- https://cdn.elifesciences.org/articles/58805/elife-58805-fig5-data1-v2.xlsx
Figure 5—figure supplement 1

Adhesion force increases in temperature sensitive dhc1-b mutant at restrictive temperature.
(A) The unique inserted cassette of AphVIII in MAN1A gene was identified in the double mutant and the progenies of the cross between the IMMan1A IMXylT1A with dynein-1bts using PCR. (B) Identification of the point mutation of DHC1bts in the progenies of the cross between the IMMan1A IMXylT1A and dynein-1bts. (C) Identification of the unique inserted fragment of XylT1A gene in the progenies of the cross between theIMMan1A IMXylT1A and dynein-1bts using PCR. (D) The shortening of flagella occurs only when triple mutant was incubated at restrictive temperature. Three biological replicates were performed with 50 flagella evaluated per replicate. Error bars show SEM of three replicates. (E) The flagella were shortening when triple mutant was treated with 20 mM Nappi. Three biological replicates were performed with 50 flagella evaluated per replicate. Error bars show SEM of three replicates. (F) The distribution of adhesive force when triple mutant was incubated at restrictive temperature (- no functional DHC1b) or treated with 20 mM NaPPi (+ with functional DHC1b). These measurements were performed at a flagellar length of about 6.5 μm. Three biological replicates were performed with at least 4 cells evaluated per replicate. T-test was used for statistical analysis. Asterisks indicate statistically differences (*p<0.01). (G) The total energy of pulled up cell from the solid surface. Three biological replicates were performed with at least 4 cells evaluated per replicate. T-test was used for statistical analysis. Asterisks indicate statistically differences (*p<0.1). Source data can be seen in Figure 5—figure supplement 1—source data 1.
-
Figure 5—figure supplement 1—source data 1
Raw data of AFM measurement proving the influence of dynein -1b.
- https://cdn.elifesciences.org/articles/58805/elife-58805-fig5-figsupp1-data1-v2.xlsx
Tables
Table 1
MS parameters.
Relevant parameters used to acquire IS-CID and not fragmented TopN MS spectra as well as PRM data.
| TopN without IS-CID | In-Source CID HCD | Parallel reaction monitoring | ||
|---|---|---|---|---|
| Eluent compositions | Peptide trapping: 0.05% trifluoroacetic acid (TFA) in ultrapure water (A1), 0.05% TFA in 80% acetonitrile (B1) Peptide separation: 0.1% formic acid (FA) in ultrapure water (A2), 0.1% FA in 80% acetonitrile (B2) | LC parameters | ||
| Trap Column | C18 PepMap 100, 300 µM x 5 mm, 5 µm particle size, 100 Å pore size; Thermo Scientific | |||
| Peptide trapping (eluents A1+B1) | 2.5% B1 at 5 μL/min for 5 min | 2.5% B1 at 10 μL/min for 3 min | ||
| Flow rate | 300 nL/min | 250 nL/min | ||
| Separation Column | Acclaim PepMap C18, 75 µm x 50 cm, 2 µm particle size, 100 Å pore size; Thermo Scientific | |||
| Gradient for peptide separation (eluents A2+B2) | 2.5% B2 over 5 min, 2.5–45% B2 over 40 min, 45–99 % B2 over 5 min 99% B2 for 20 min 99–2.5% over 5 min 2.5% for 30 min | 2.5% B2 over 5 min, 2.5–35% B2 over 105 min, 35–99 % B2 over 5 min 99% B2 for 20 min 99–2.5% over 5 min 2.5% for 40 min | ||
| In-source CID | off | 80 eV | off | MS1 settings |
| Use lock masses | off | on (m/z 445.12003) | ||
| Resolution at m/z 200 (FWHM) | 70,000 | |||
| Chromatographic peak width | 15 s | |||
| AGC target | 3e6 | |||
| Maximum injection time | 100 ms | 50 ms | ||
| Scan range | 600–3000 m/z | 350–1600 m/z | ||
| Mass tags | off | on | off | |
| TopN | 12 | n/a | MS2 settings | |
| Resolution at m/z 200 (FWHM) | 17,500 | 35,000 | ||
| Isolation window | 2 m/z | 2 m/z (offset 0.5 m/z) | ||
| AGC target | 1e5 | |||
| Maximum injection time | 120 ms | |||
| Normalized collision energy (NCE) | 30 | 27 | ||
| Minimum AGC target | 1.25e3 | n/a | ||
| Intensity threshold | 1e4 | n/a | ||
| Charge exclusion | unassigned,>5 | n/a | ||
| Dynamic exclusion | 15 s | n/a | ||
Additional files
Download links
A two-part list of links to download the article, or parts of the article, in various formats.
Downloads (link to download the article as PDF)
Open citations (links to open the citations from this article in various online reference manager services)
Cite this article (links to download the citations from this article in formats compatible with various reference manager tools)
Altered N-glycan composition impacts flagella-mediated adhesion in Chlamydomonas reinhardtii
eLife 9:e58805.
https://doi.org/10.7554/eLife.58805


