Neural encoding of task-dependent errors during adaptive learning
- Department of Psychology, University of Pennsylvania, United States
- Department of Neuroscience, University of Pennsylvania, United States
Figures
Figure 1
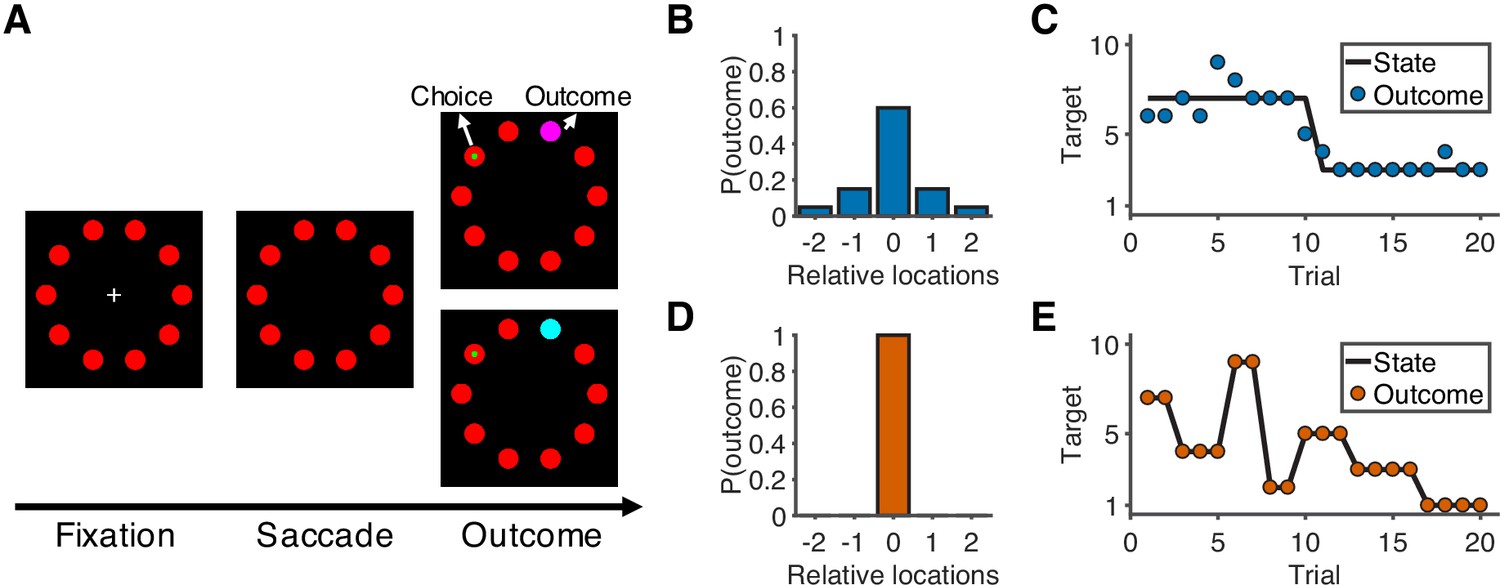
Overview of task and experimental design.
(A) Sequence of the task. At the start of the trial, participants look at a cross in the center of the screen and maintain fixation for 0.5 s to initialize the trial. After the cross disappears, participants choose one of 10 targets (red) by looking at it within 1.5 s and then holding fixation on the chosen target for 0.3 s. During the outcome phase (1 s), a green dot inside the target indicates the participants’ choice. The rewarded target is shown in purple or cyan to indicate the number of earnable points as 10 or 20, respectively. (B) Probability distribution of the rewarded target location in the noisy condition. Target location is relative to the location of the state (generative mean). The rewarded target probabilities for the relative locations of [−2,–1, 0, 1, 2] are [0.05, 0.15, 0.6, 0.15, 0.05]. (C) Example of trials in the noisy condition. The states change occasionally with a hazard rate of 0.02. (D) Probability distribution of the rewarded target location in the unstable condition. Because there is no noise in this condition, the rewarded target is always at the location of the state. (E) Example of trials in the unstable condition. The states change frequently with a hazard rate of 0.35.
Figure 2 with 4 supplements

Behavioral results.
(A) Probability of choosing the best target after change-points. Symbols and error bars are mean ± SEM across subjects (solid symbols) or simulations (open symbols). (B) Relationship between error magnitude and switch probability. Symbols and error bars are as in A. (C) The distribution of switch probabilities for small errors (magnitude of 1 or 2) in both conditions. Each data point represents one participant. Distributions for all error magnitudes are shown in Figure 2—figure supplement 1. (D) Probability of switch as a function of current error magnitude and error history in the unstable condition. Different colors represent different error histories for the past three trials. A correct trial is marked as O, and an error trial is marked as X. For example, XOO implies that trial t-1 was an error trial, and trial t-2 and trial t-3 were correct trials. Symbols and error bars are mean ± SEM across subjects. (E) Probability of switch as a function of current error magnitude and error history in the noisy condition. Symbols and error bars are as in D. (F) The distribution of the slopes of switch probability against error history for small errors (magnitude of 1 or 2) in both conditions. Each data point represents one participant. Distributions for all error magnitudes are shown in Figure 2—figure supplement 1.
Figure 2—figure supplement 1

Distributions of behavior as a function of error magnitude.
(A) Distributions of switch probability as a function of error magnitude. Each data point represents one participant. (B) Distributions of slopes of switch probability against error history as a function of error magnitude. Each data point represents one participant.
Figure 2—figure supplement 2
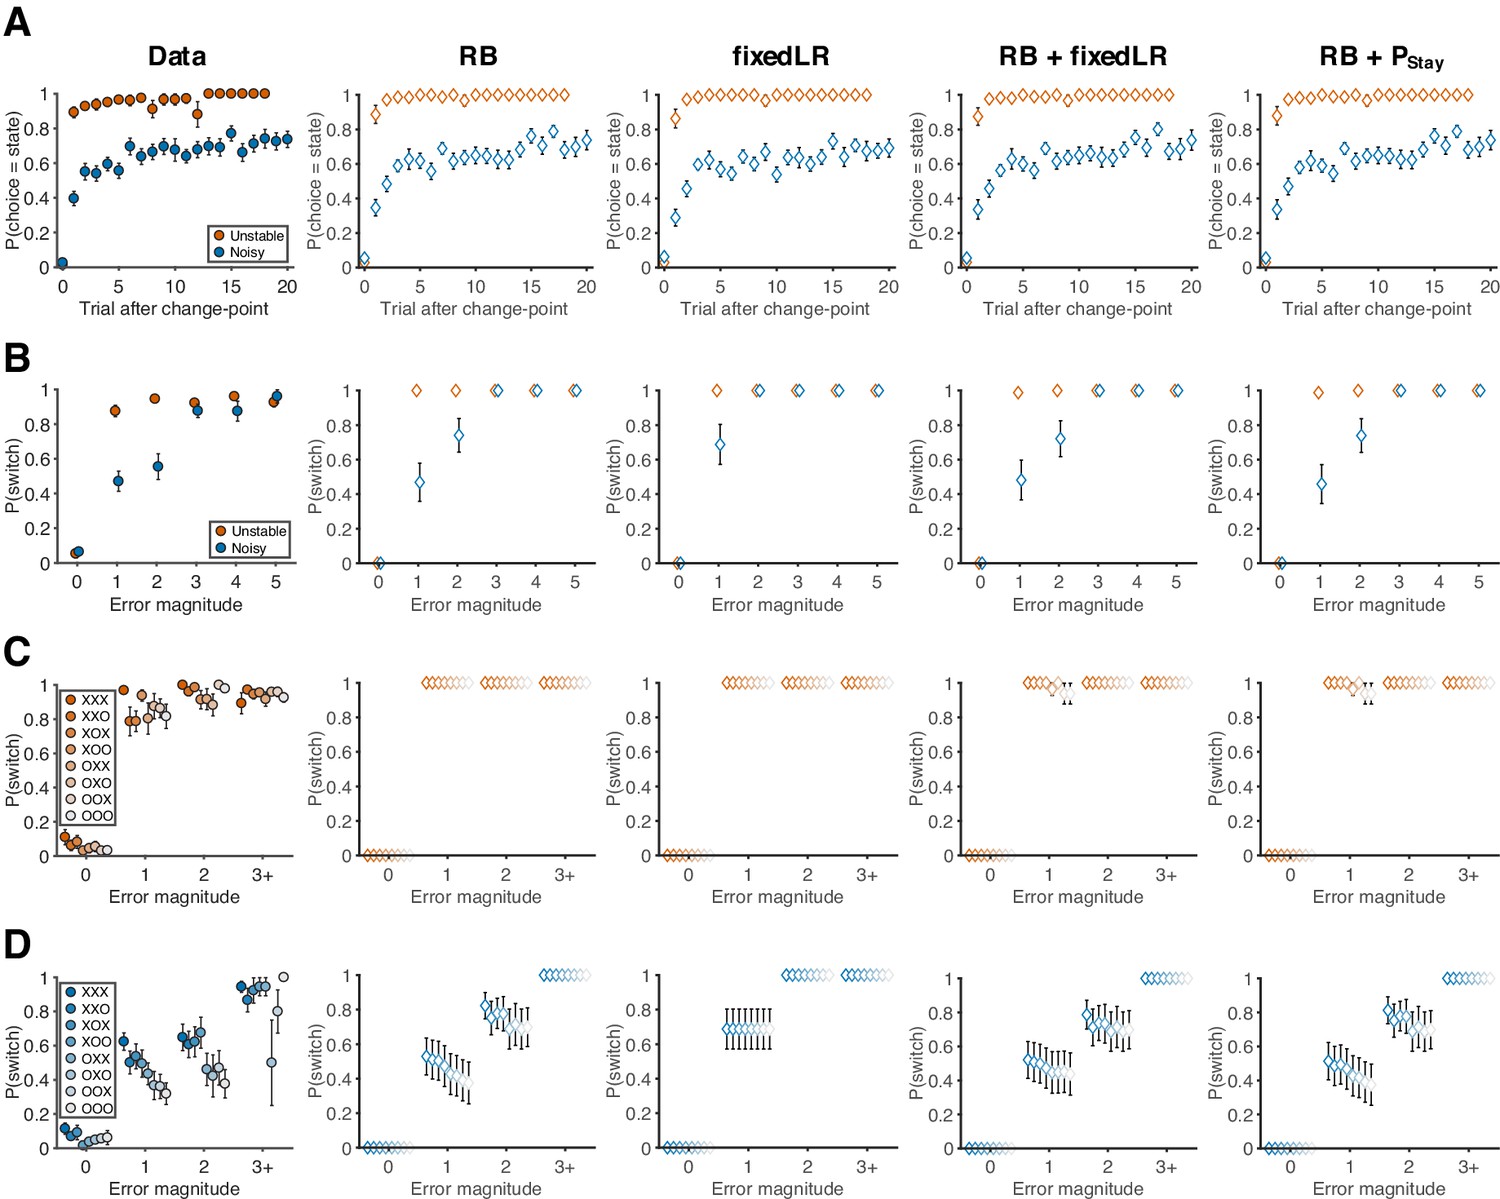
Behavioral data and predictions from different models.
(A) Probability of choosing the best target after change-points. (RB: reduced Bayesian; fixedLR: fixed learning rate; Pstay: fixed tendency to stay) (B) The relationship between error magnitude and switch probability. (C) Probability of switch as a function of current error magnitude and error history in the unstable condition. (D) Probability of switch as a function of current error magnitude and error history in the noisy condition. Symbols and colors are as in Figure 2.
Figure 2—figure supplement 3
Reduced Bayesian model applied to behavioral and imaging data.
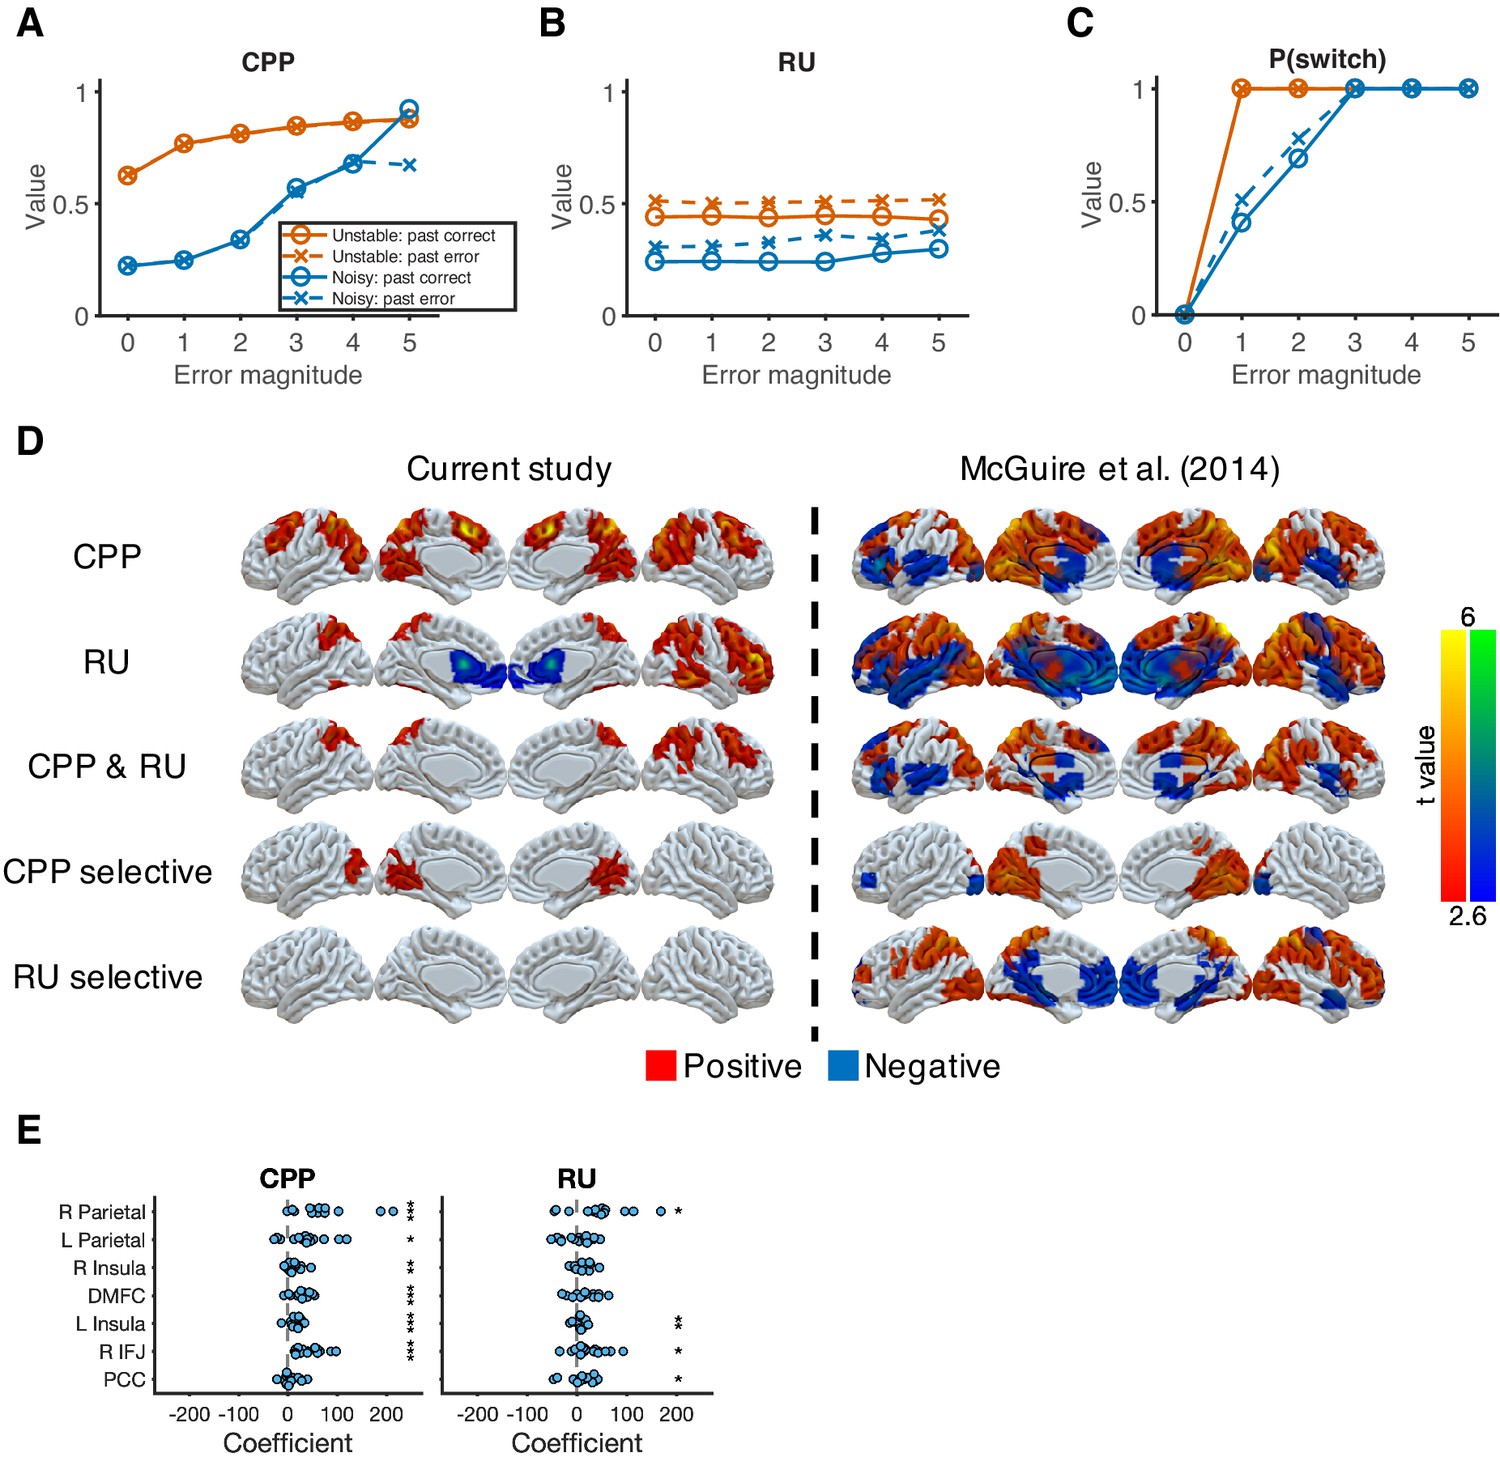
(A) Model prediction for CPP. We calculated CPP from the fitted reduced Bayesian model, which incorporates subjective estimates of hazard rate and noise for each condition. The value of CPP increases as the current error magnitude increases in both conditions, but with a stronger dependence on the outcome of the previous trial in the noisy condition. (B) Model prediction for RU. We calculated RU from the fitted reduced Bayesian model, which incorporates subjective estimates of hazard rate and noise for each condition. The value of RU is minimally affected by the current error magnitude. Instead, a past error tends to increase RU. (C) Model prediction for probability of switching choices. Increasing CPP causes the probability of switching to increase more steeply as the current error magnitude increases in the unstable condition versus in the noisy condition. For small errors (error magnitude of 1 and 2) in the noisy condition, the probability of switching is further influenced by RU, which is affected by past errors. (D) Neural representation of CPP and RU. CPP selective effect represents the conjunction of CPP > 0 and CPP > RU. RU selective effect represents the conjunction of RU > 0 and RU > CPP. The results were thresholded based on uncorrected voxel p<0.01 (t = 2.6). (E) ROI analysis for CPP and RU. These ROIs were selected based on the common regions of CPP, RU, and reward effects in McGuire et al., 2014. Significance was tested by a sign test. *p<0.05, **p<0.01, ***p<0.001.
Figure 2—figure supplement 4
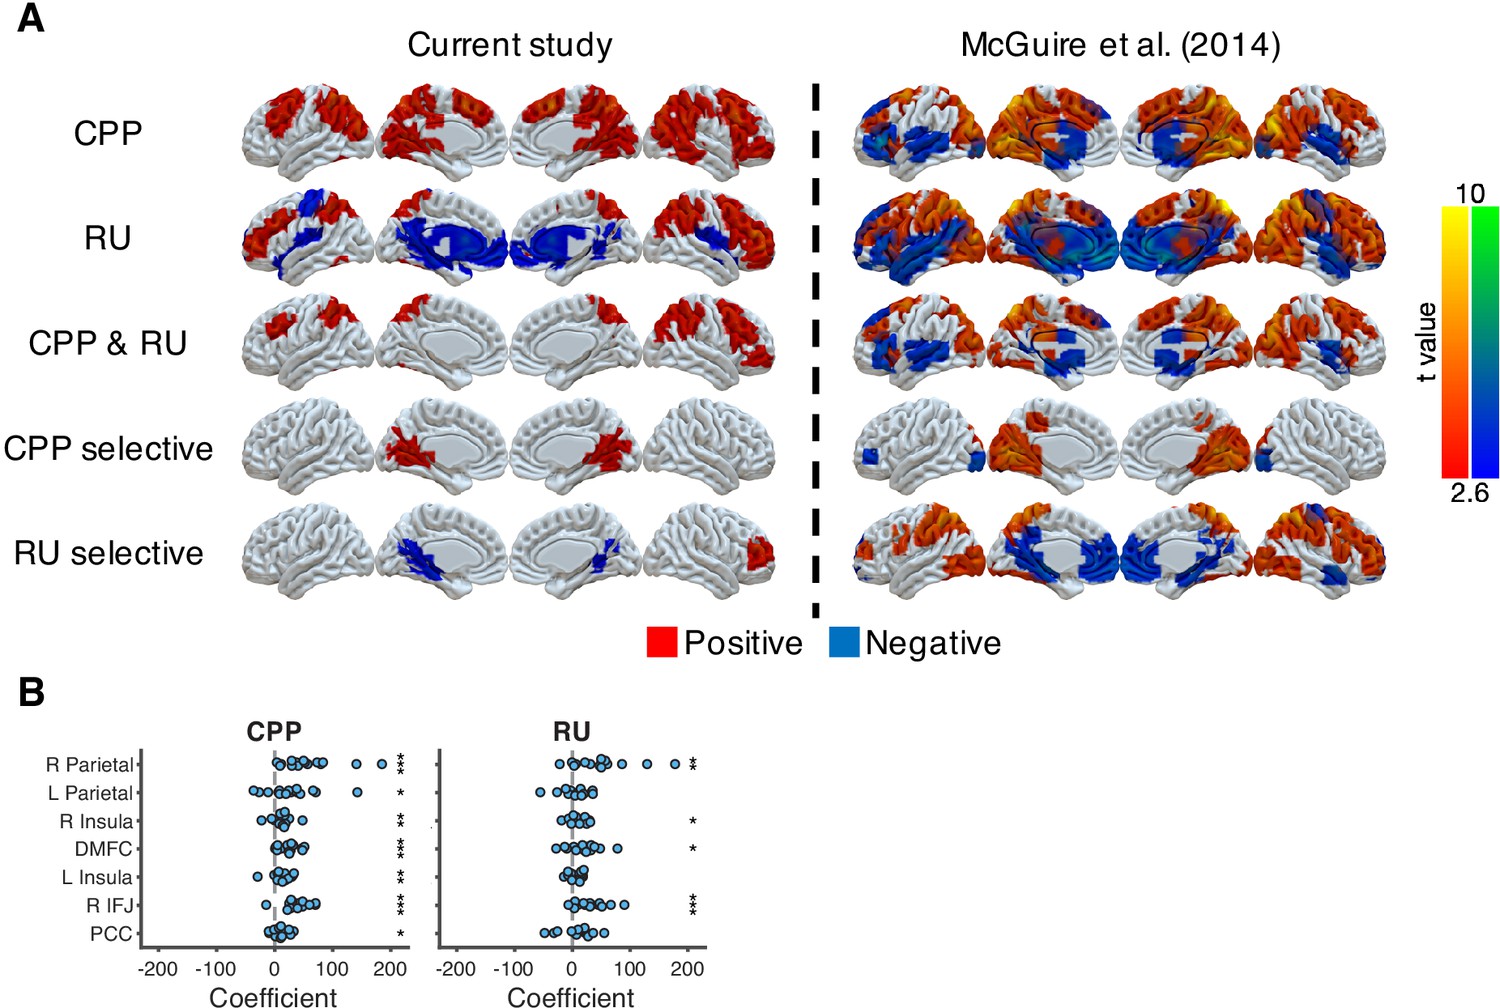
Neural representations of CPP and RU from the approximately ideal observer, which is the reduced Bayesian model with true hazard rate and noise, for direct comparison to analyses in McGuire et al., 2014, which used covariates constructed from the ideal rather than the fitted model.
(A) Neural representation of CPP and RU in the current study and in McGuire et al., 2014. CPP selective effect represents the conjunction of CPP > 0 and CPP > RU. RU selective effect represents the conjunction of RU > 0 and RU > CPP. The results were thresholded based on uncorrected voxel p<0.01 (t = 2.6). (B) ROI analysis for CPP and RU. These ROIs were selected based on the common regions of CPP, RU and reward effects in McGuire et al., 2014. Significance was tested by a sign test. *p<0.05, **p<0.01, ***p<0.001.
Figure 3 with 1 supplement
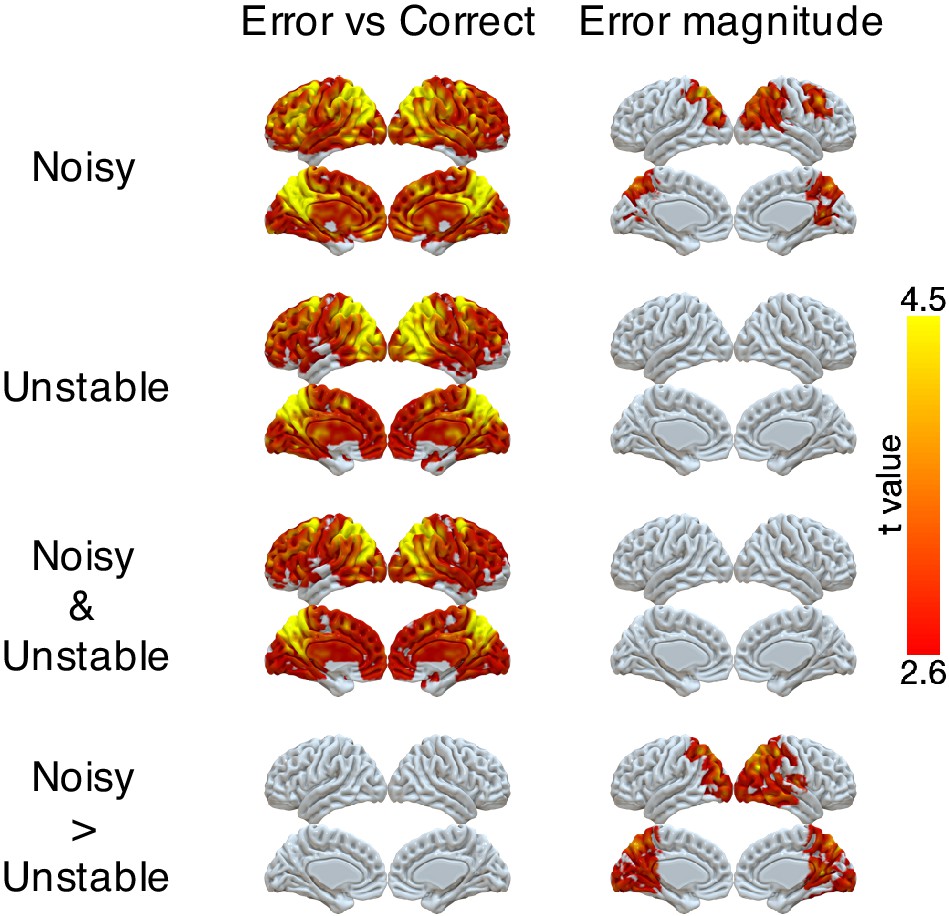
Representations of error and error magnitude.
For error versus correct analyses, multi-voxel neural patterns were used to classify whether the response on the current trial was correct or an error. For error magnitude analyses, multi-voxel neural patterns were used to classify different error magnitudes (1, 2, 3+) conditional on the current trial being an error. Accuracies were calculated and compared with the baseline accuracy within each subject and then tested at the group level. The representation of current error magnitude is stronger in parietal cortex in the noisy condition than the unstable condition. The cluster-forming threshold was an uncorrected voxel p<0.01 (t = 2.6), with cluster mass corrected for multiple comparisons using non-parametric permutation tests.
Figure 3—figure supplement 1

Univariate representations of error and error magnitude.
A GLM was implemented on the preprocessed fMRI data (smoothed with 6 mm FWHM Gaussian kernel). The trial-by-trial regressors of interest that were included in the GLM were: onset of correct trials, earnable value on correct trials, onset of error trials, error magnitude on error trials, switch or stay on error trials and earnable value on error trials. We focused on the effects of error (which is the difference between the onset of error trials and the onset of correct trials) and error magnitude. Group t-values are shown. For statistical testing, we implemented one-sample cluster-mass permutation tests with 5000 iterations. The cluster-forming threshold was uncorrected voxel p<0.01 (t = 2.6).
Figure 4 with 1 supplement
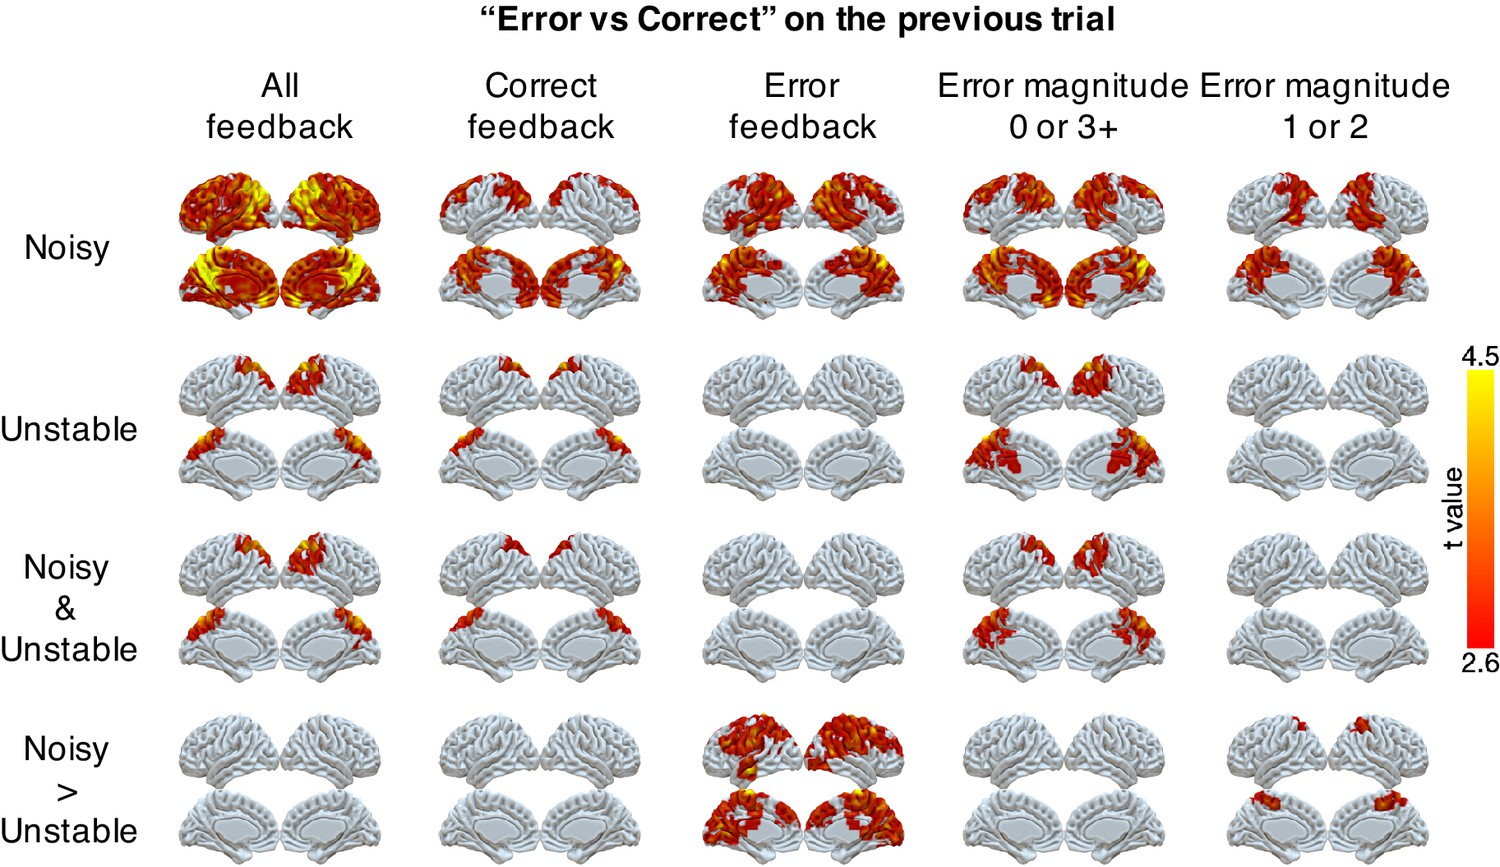
Representations of errors on the previous trial conditional on different types of current trials (columns).
Multi-voxel neural patterns were used to classify correct responses versus errors on the previous trial. This analysis was repeated for different types of current trials: all feedback, correct feedback, error feedback, error magnitude of 0 or 3+, and error magnitude of 1 or 2. The representation of past errors is stronger in parietal cortex in the noisy condition than the unstable condition when the current trial is an error or the current error magnitude is 1 or 2. The cluster-forming threshold was an uncorrected voxel p<0.01 (t = 2.6), with cluster mass corrected for multiple comparisons using non-parametric permutation tests.
Figure 4—figure supplement 1
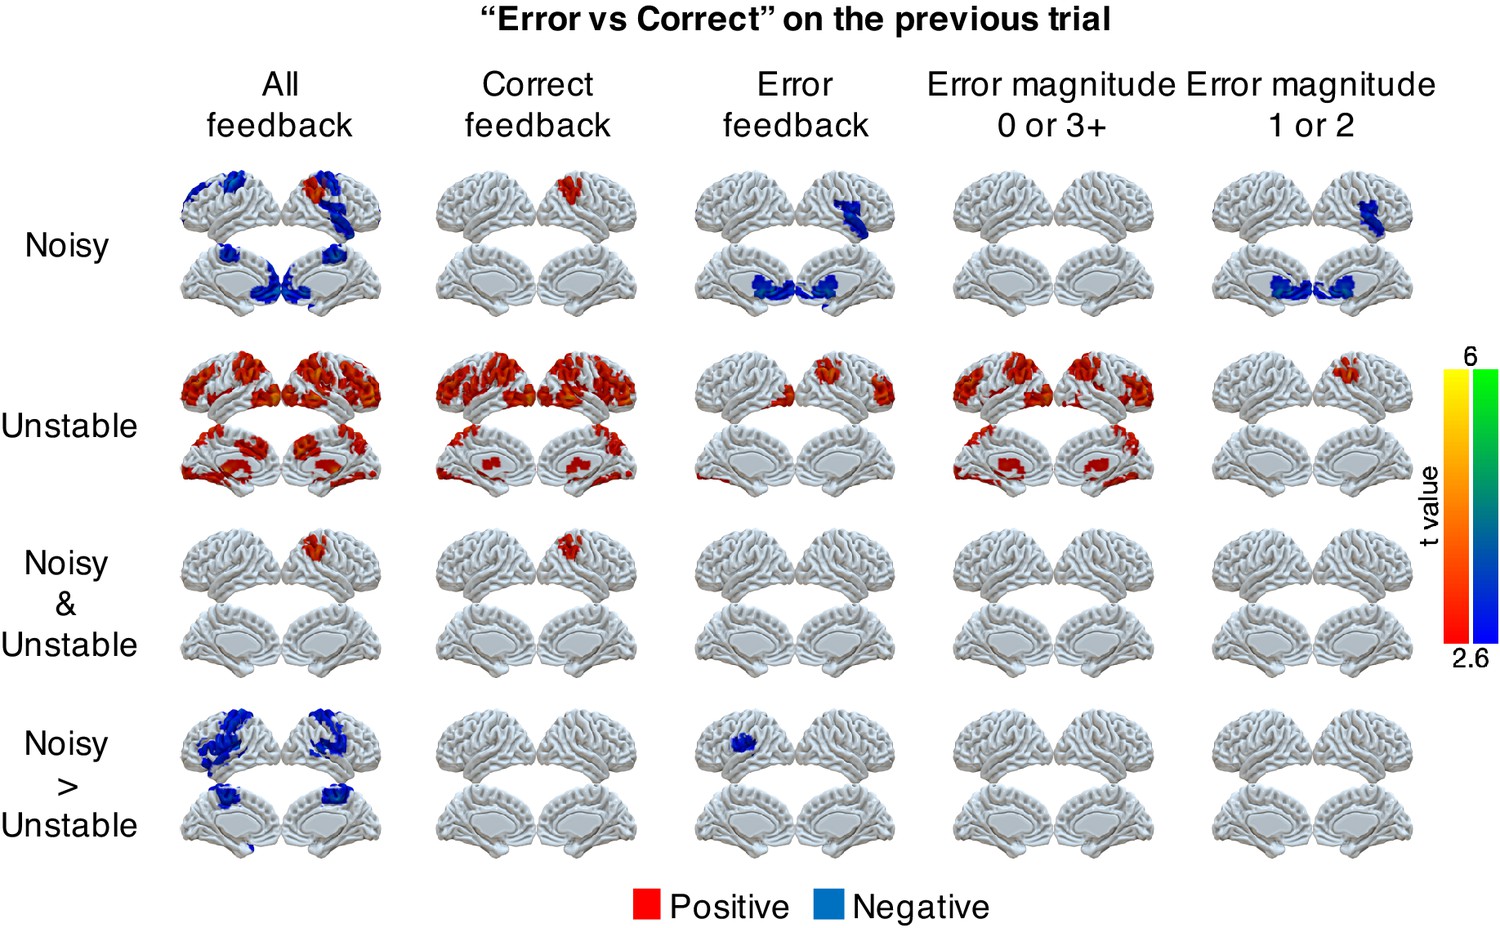
Univariate representations of error on the previous trial conditional on different types of current trials (columns).
Several GLMs were implemented on the preprocessed fMRI data (smoothed with 6 mm FWHM Gaussian kernel). First, we examined errors on the previous trial across all trials. The trial-by-trial regressors of interest that were included in the GLM were: onset of trials, error on trial t, error on trial t-1, error on trial t-2, and error on trial t-3. We focused on the effect of error on trial t-1. Second, we separated the analysis of past errors conditional on the current trial being correct or an error. The trial-by-trial regressors of interest that were included in the GLM were: onset of current correct trials, errors on trial t-1, t-2, or t-3 conditional on the current trial being correct, onset of current error trials, errors on trial t-1, t-2, or t-3 conditional on the current trial being an error. We focused on the effects of error on trial t-1 conditional on the current trial being correct or an error. Third, we separated errors conditional on error magnitudes of 0 or 3+ or error magnitudes of 1 or 2. The trial-by-trial regressors of interest that were included in the GLM were: onset of current trials with error magnitudes of 0 or 3+, errors on trial t-1, t-2 or t-3 conditional on the current trial error magnitude of 0 or 3+, onset of current trials with error magnitudes of 1 or 2, errors on trial t-1, t-2 or t-3 conditional on the current trial error magnitude of 1 or 2. We focused on the effects of errors on trial t-1 conditional on the current trials error magnitude of 0 or 3+ or error magnitude of 1 or 2. Group t-values are shown. For statistical testing, we implemented one-sample cluster-mass permutation tests with 5000 iterations. The cluster-forming threshold was uncorrected voxel p<0.01 (t = 2.6).
Figure 5 with 2 supplements
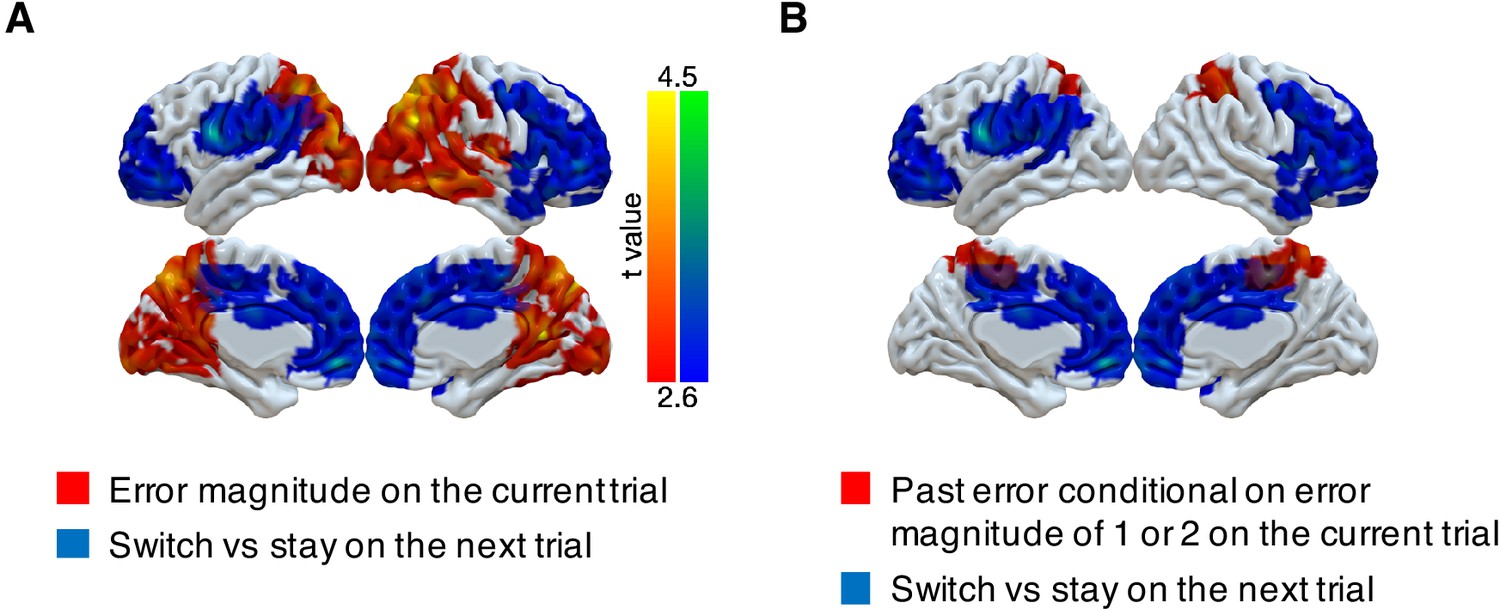
Representations of subsequent behavioral choices (switch versus stay) after ambiguous small errors in the noisy condition.
(A) Overlap of results for switch versus stay on the next trial and error magnitude on the current trial. Multi-voxel neural patterns were used to classify whether participants switch their choice to another target or stay on the same target on the next trial. We focused on the most ambiguous errors (error magnitude of 1 or two in the noisy condition). Above-chance classification performance was found in a large cluster encompassing the frontal lobe. The cluster-forming threshold was an uncorrected voxel p<0.01 (t = 2.6), with cluster mass corrected for multiple comparisons using non-parametric permutation tests. (B) Overlap of results for switch versus stay on the next trial and past error conditional on error magnitude of 1 or two on the current trial.
Figure 5—figure supplement 1
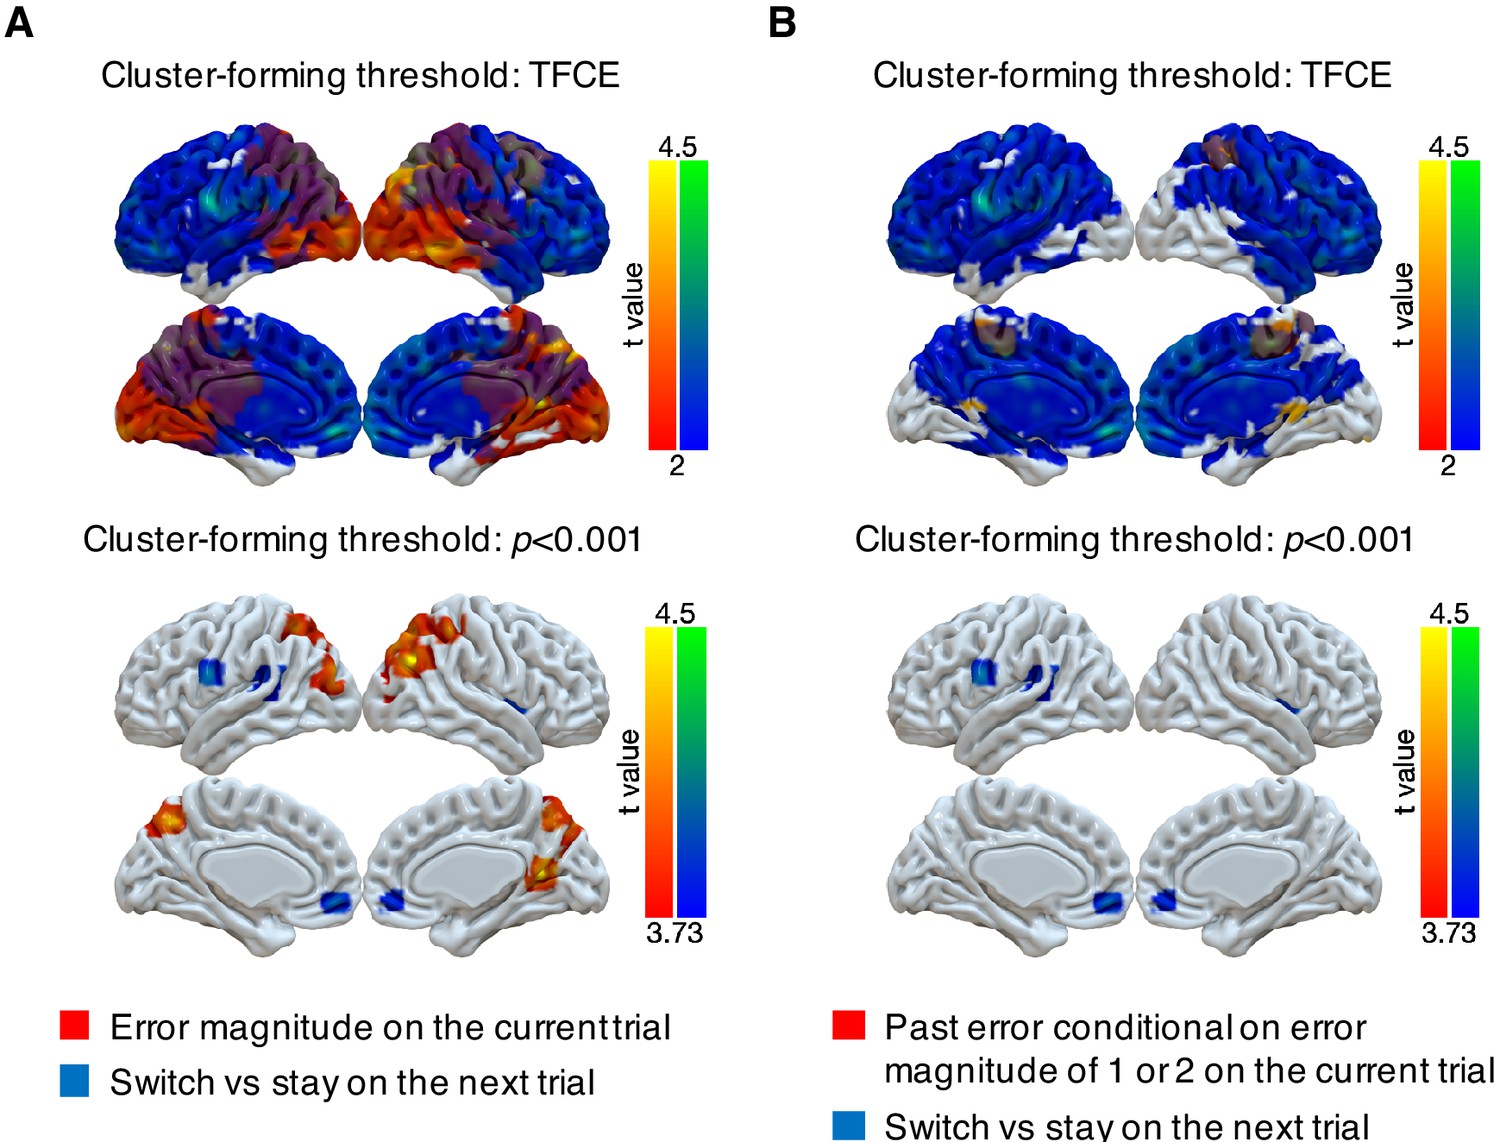
Representations of subsequent behavioral choices (switch versus stay) thresholded via threshold-free cluster enhancement (TFCE) or with a cluster-forming threshold of p<0.001.
(A) Overlap of results for switch versus stay on the next trial and error magnitude on the current trial. We implemented two types of cluster-forming approaches: TFCE and uncorrected voxel p<0.001. First, significance testing was implemented through permutation tests with threshold-free cluster enhancement (FSL’s randomize), which does not require a pre-defined cluster-forming threshold. The result of switch versus stay showed little spatial specificity. For the purpose of display, the results were thresholded based on uncorrected voxel p<0.03 (t = 2). Second, we used a cluster-forming threshold of uncorrected voxel p<0.001 (t = 3.73) and tested the significance of the formed cluster via one-sample cluster-mass permutation tests with 5000 iterations. The results showed high spatial specificity and several previously identified regions were still significant: middle cingulate cortex [14, -8, 30], right insula [38, 4, 2], medial OFC [−4, 50,–10], left premotor cortex [−62, 2, 24] and left superior temporal gyrus [−50,–32, 12]. (B) Overlap of results for switch versus stay on the next trial and past error conditional on error magnitude of 1 or 2 on the current trial. The two types of cluster-forming approaches are shown.
Figure 5—figure supplement 2

Univariate GLM for switch versus stay on small error trials (magnitudes of 1 or 2) in the noisy condition.
A GLM was implemented with several trial-by-trial regressors of interest: onset of trials with error magnitude of 0, onset of trials with error magnitude of 3+, onset of trials with error magnitudes of 1 or two followed by switching, onset of trials with error magnitudes of 1 or two followed by staying. We tested the effects of the difference between switch and stay for small errors. For statistical testing, we implemented one-sample cluster-mass permutation tests with 5000 iterations. The cluster-forming threshold was uncorrected voxel p<0.01 (t = 2.6). There were no significant clusters. For the demonstration, the results were shown with uncorrected voxel p<0.01.
Tables
Table 1
BIC of behavior models.
| Model | Condition | BIC improvement by RB model |
|---|---|---|
| Reduced Bayesian model (RB) | Unstable | |
| Noisy | ||
| Fixed learning rate model (fixedLR) | Unstable | 5.06 [3.63, 5.71]** |
| Noisy | −21.05 [-76.63, 0.20]† | |
| RB + fixedLR | Unstable | −9.83 [-11.20,–8.07]*** |
| Noisy | −4.64 [-10.51, 0.89] | |
| RB + Pstay | Unstable | −5.20 [-5.65,–3.68]** |
| Noisy | −5.55 [-5.65,–2.67]* |
-
Values are shown as median [IQR]. A negative value means that the RB model performed better than the alternative model. Significance was tested by a sign test. †p<0.08, **p<0.01, ***p<0.001.
Table 2
Parameters of behavior models.
| Model | Parameter | Unstable | Noisy | Unstable > Noisy |
|---|---|---|---|---|
| RB | H | 0.82 [0.64, 0.90] | 0.33 [0.11, 0.50] | 0.37 [0.24, 0.62]*** |
| K | 0.59 [0.03, 2.22] | 1.86 [1.22, 2.32] | −0.23 [-1.97, 0.71] | |
| fixedLR | 0.96 [0.86, 0.97] | 0.63 [0.37, 0.73] | 0.33 [0.19, 0.49]*** | |
| RB + fixedLR | H | 0.07 [0.00, 0.86] | 0.03 [0.00, 0.19] | 0.03 [-0.03, 0.77] |
| K | 11.19 [2.78, 18.01] | 3.22 [2.28, 9.90] | 5.13 [-4.91, 16.10] | |
| 0.96 [0.75, 1.00] | 0.88 [0.23, 1.00] | 0.02 [-0.12, 0.52] | ||
| w | 0.38 [0.16, 0.81] | 0.71 [0.52, 0.87] | −0.28 [-0.57, 0.22] | |
| RB + Pstay | H | 0.73 [0.64, 0.88] | 0.31 [0.06, 0.53] | 0.27 [0.15, 0.66]** |
| K | 8.42 [0.73, 30.42] | 2.19 [1.62, 9.09] | 2.71 [-2.60, 23.94] | |
| 0.01 [0.00, 0.05] | 0.01 [0.00, 0.13] | 0.00 [-0.11, 0.03] |
-
Parameter values are shown as median [IQR]. Difference of parameter values between the two conditions was tested by a sign test. **p<0.01, ***p<0.001.
Table 3
Summary of fMRI results: error magnitude and past error.
| Cluster index | #Voxels | Region | Peak t | Peak x | Peak y | Peak z |
|---|---|---|---|---|---|---|
| Error magnitude: noisy versus unstable | ||||||
| 1 | 21032 | R precuneus | 5.22 | 16 | −56 | 12 |
| R angular gyrus | 5.17 | 44 | −70 | 32 | ||
| L precuneus | 5.08 | −18 | −58 | 20 | ||
| Occipital pole | 5.07 | 2 | −98 | -2 | ||
| L superior parietal lobule | 4.91 | −10 | −66 | 48 | ||
| R occipital cortex | 4.69 | 26 | −76 | 18 | ||
| L occipital cortex | 4.54 | −38 | −86 | 26 | ||
| R superior parietal lobule | 4.44 | 44 | −44 | 54 | ||
| Posterior cingulate cortex | 4.43 | 2 | −46 | 20 | ||
| Past error on current error magnitude of 1 or 2: noisy versus unstable | ||||||
| 1 | 1881 | Posterior cingulate cortex | 4.79 | 12 | −24 | 52 |
| R Superior parietal lobule | 4.04 | 32 | −38 | 54 | ||
| R Precuneus | 3.58 | 6 | −54 | 70 | ||
| L superior parietal lobule | 3.54 | −16 | −54 | 62 | ||
| Conjunction: Error magnitude and Past error on current error magnitude of 1 or 2 | ||||||
| 1 | 304 | R superior parietal lobule | 3.41 | 38 | −40 | 52 |
| 2 | 103 | R Precuneus | 3.02 | 2 | −58 | 70 |
| 3 | 81 | L superior parietal lobule | 3.23 | −18 | −56 | 72 |
Table 4
Summary of fMRI results: behavior change.
| Cluster index | #Voxels | Region | Peak t | Peak x | Peak y | Peak z |
|---|---|---|---|---|---|---|
| Switch versus stay on error magnitude of 1 or two in the noisy condition | ||||||
| 1 | 12042 | Middle cingulate cortex | 4.35 | 14 | -8 | 30 |
| R insula | 4.33 | 38 | 4 | 2 | ||
| Medial orbitofrontal cortex | 4.24 | -4 | 50 | −10 | ||
| R frontal pole | 4.11 | 40 | 46 | 0 | ||
| R inferior frontal gyrus | 4.11 | 48 | 26 | 10 | ||
| L frontal pole | 4.01 | −24 | 52 | -2 | ||
| Dorsomedial frontal cortex | 3.96 | 0 | 26 | 34 | ||
| Posterior cingulate cortex | 3.93 | 2 | −28 | 50 | ||
| R primary motor cortex | 3.91 | 48 | -6 | 50 | ||
| Anterior cingulate cortex | 3.51 | 0 | 48 | 20 | ||
| 2 | 3134 | L premotor cortex | 4.43 | −62 | 2 | 24 |
| L superior temporal gyrus | 4.28 | −50 | −32 | 12 | ||
| L inferior frontal junction | 3.72 | −38 | 4 | 28 | ||
| L postcentral gyrus | 3.61 | −50 | −26 | 44 | ||
Additional files
Download links
A two-part list of links to download the article, or parts of the article, in various formats.
Downloads (link to download the article as PDF)
Open citations (links to open the citations from this article in various online reference manager services)
Cite this article (links to download the citations from this article in formats compatible with various reference manager tools)
Neural encoding of task-dependent errors during adaptive learning
eLife 9:e58809.
https://doi.org/10.7554/eLife.58809


