Single-cell RNA-sequencing reveals distinct patterns of cell state heterogeneity in mouse models of breast cancer
- Department of Cancer Biology, University of Cincinnati College of Medicine, United States
- Division of Biomedical Informatics, Cincinnati Children’s Hospital Research Foundation, United States
- Department of Electrical Engineering and Computer Science, University of Cincinnati College of Engineering and Applied Science, United States
- School of Information Management, Wuhan University, China
Figures
Figure 1 with 4 supplements
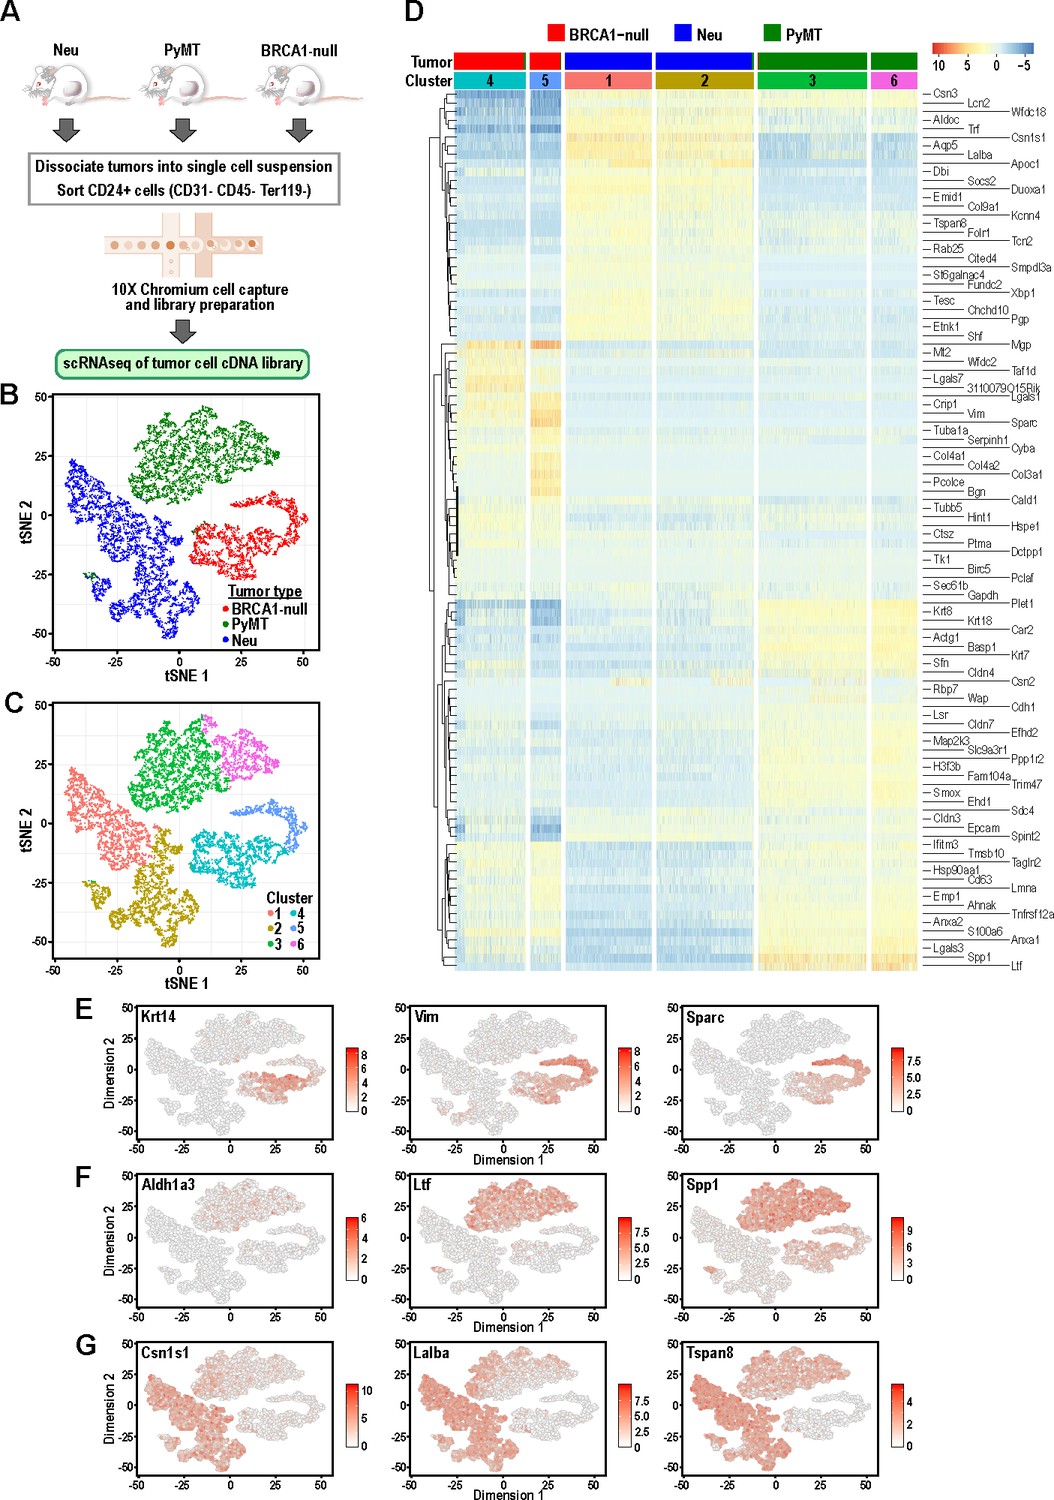
Tumor cells from distinct mouse models of breast cancer cluster separately and can be differentiated by the expression of mammary lineage markers.
(A) Schematic of workflow for the isolation of mammary tumor cells from BRCA1-null, PyMT and Neu tumors for scRNA-seq. (B) t-SNE plots of mammary tumor cells colored by tumor sample; Neu (blue), PyMT (green), BRCA1-null (red). (C) t-SNE plots of mammary tumor cells colored by clusters 1–6. (D) Heatmap of top differentially upregulated genes between tumor clusters. (E–G) t-SNE plots of tumor clusters colored by the normalized log-transformed expression of the indicated genes classified as (E) basal genes, (F) luminal progenitor associated genes and (G) alveolar lineage genes.
Figure 1—figure supplement 1
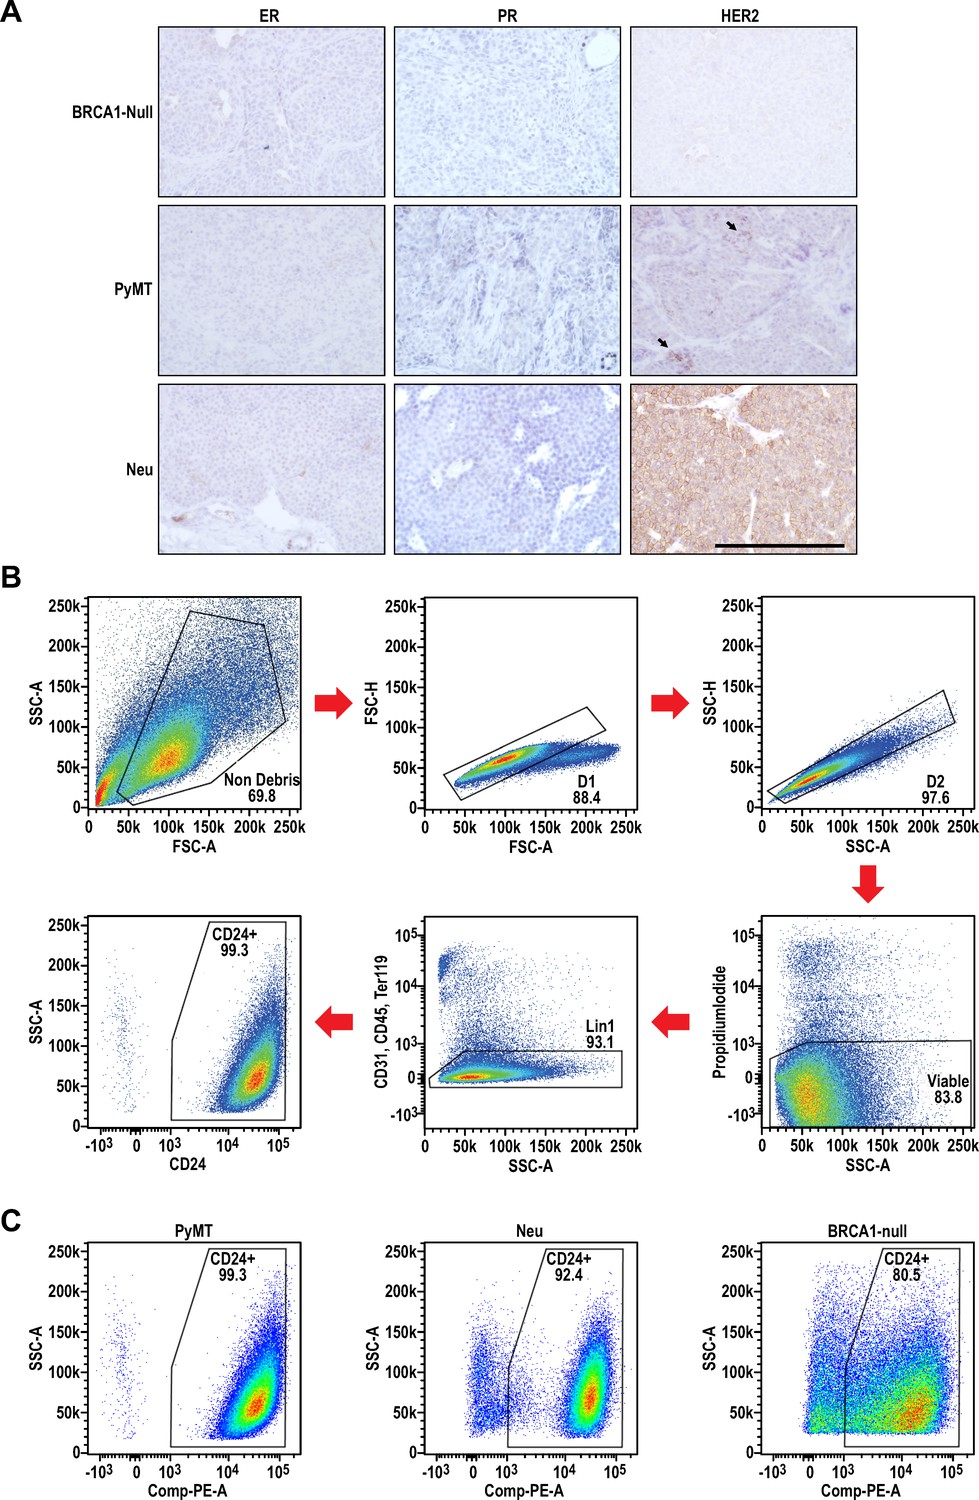
Receptor status and representative gating strategy for sorting of Lin- CD24+ mammary tumor cells from the distinct tumors.
(A) Immunohistochemical staining for ER, PR and HER2 in BRCA1-null, PyMT and Neu tumors. Scale bars represent 200 µm. (B) Gating strategy for sorting tumor cells. (C) Representative CD24+ gates for PyMT, Neu and BRCA1-null tumor models.
Figure 1—figure supplement 2
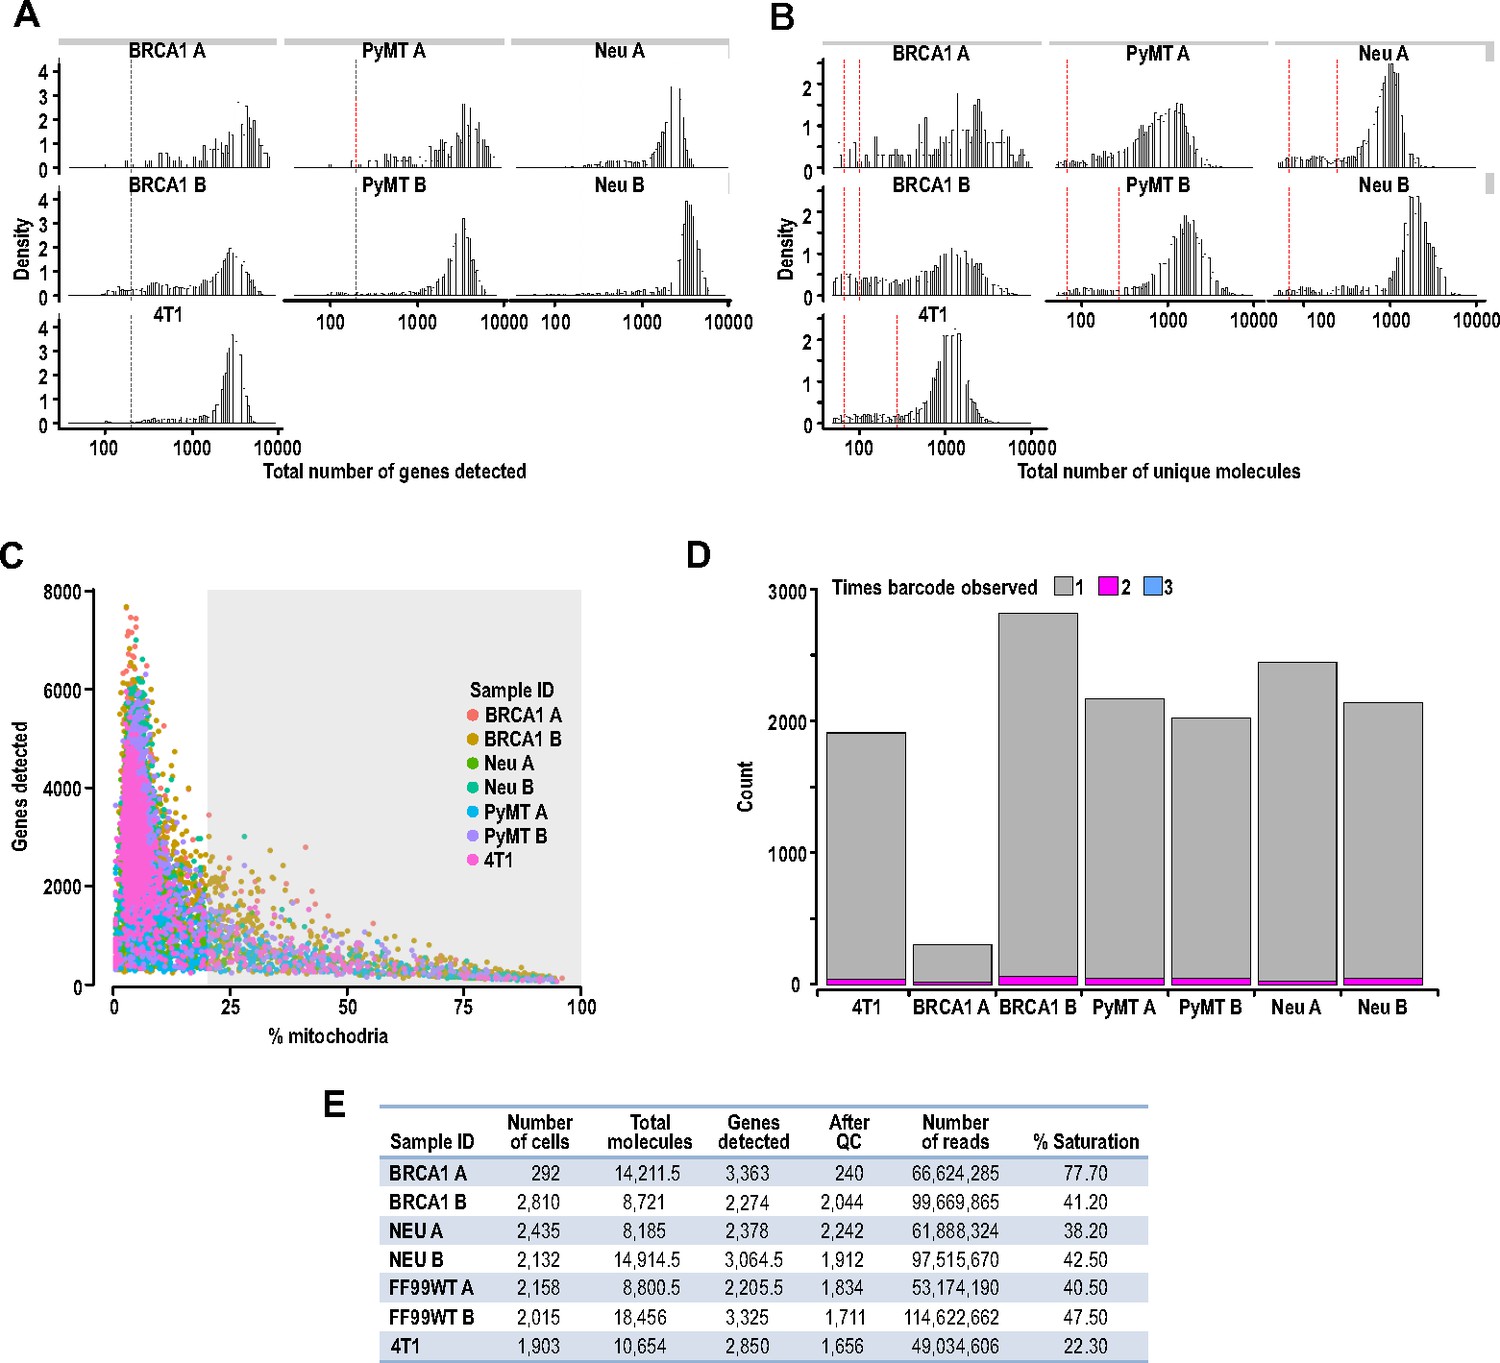
Quality control filtering of scRNA-seq prior to processing.
(A) Exclusion of cells with <500 genes detected or three median absolute deviations (MADs) below the median. (B) Exclusion of cells with <1000 unique molecular identifiers (UMIs) or 3 MADs below the median. (C) Exclusion of cells with increased reads corresponding to mitochondrial genes (>20%). (D) Bar charts showing the proportion of index-swapped barcodes that were removed from each tumor sample. (E) Table showing the average number of molecules and genes detected per cell for tumor samples.
Figure 1—figure supplement 3
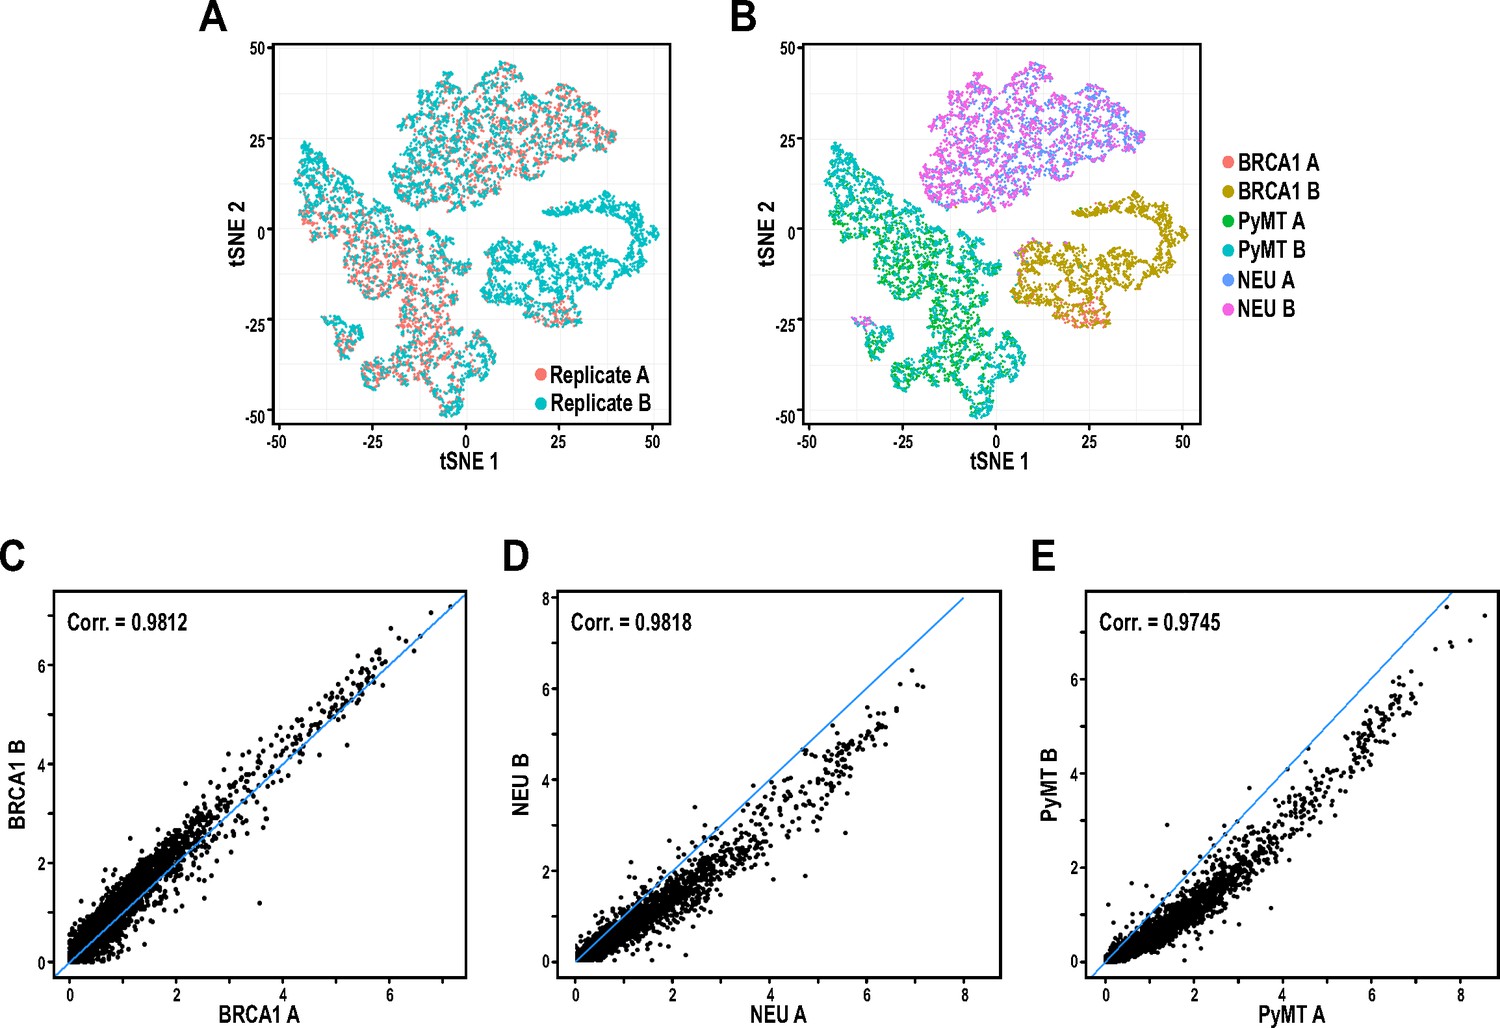
Replicates of tumor samples exhibit a high degree of concordance and reproducibility.
(A) t-SNE plots showing tumor cell clusters colored by the independent sequencing batches. (B) t-SNE plots showing tumor cell clusters colored by tumor type and replicate. (C–E) Plots showing the r2 values between (C) BRCA1-null replicates, (D) Neu replicates and (E) PyMT replicates.
Figure 1—figure supplement 4
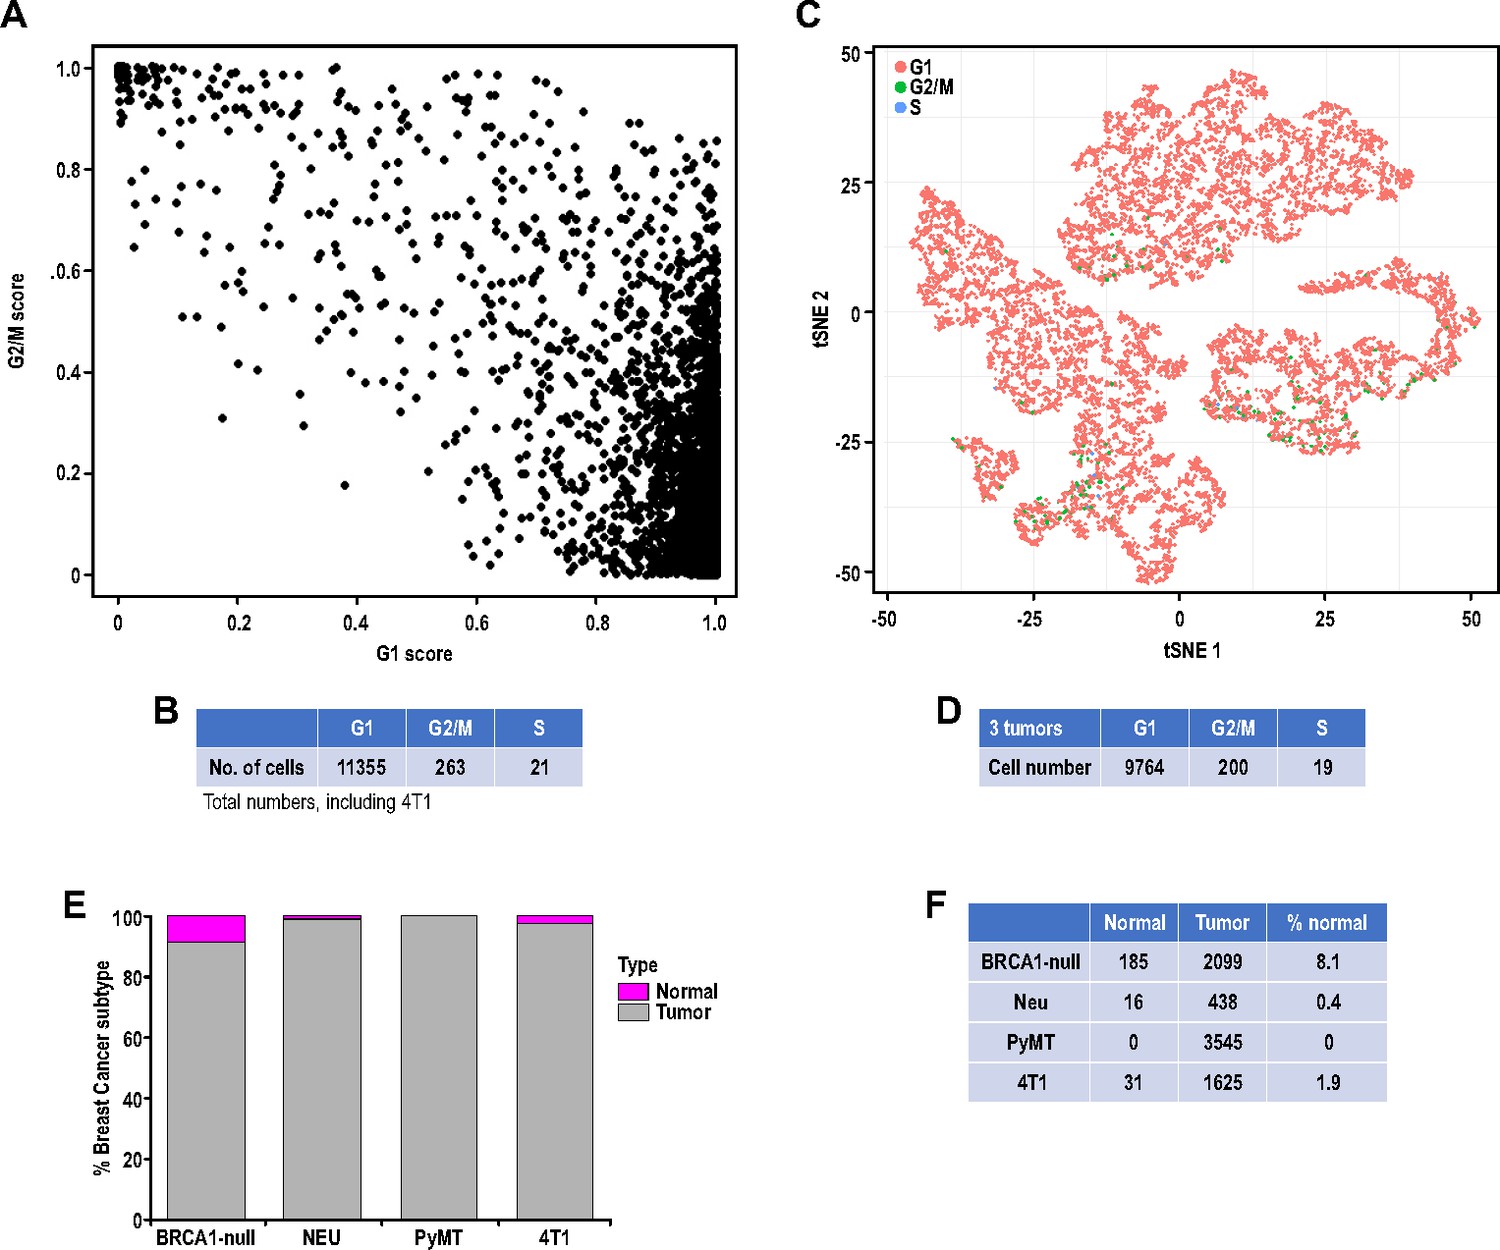
Cell cycle and copy number variation (CNV) prediction for individual tumor cells.
(A) Plot showing tumor cells with gene expression patterns correlating with G1 and G2/M scores respectively. (B) Table showing the number of tumor cells assigned into either G1, G2/M or S categories. (C) t-SNE plots showing the distribution of cells in the G1, G2/M or S categories for BRCA1-null, PyMT and Neu tumors. (D) Table showing the number of tumor cells assigned into either G1, G2/M or S categories for BRCA1-null, PyMT and Neu tumors. (E) Bar chart and (F) table, showing the number of cells inferred to harbor copy number variations (CNVs), as determined by CONICSmat, in every tumor sample.
Figure 2 with 1 supplement
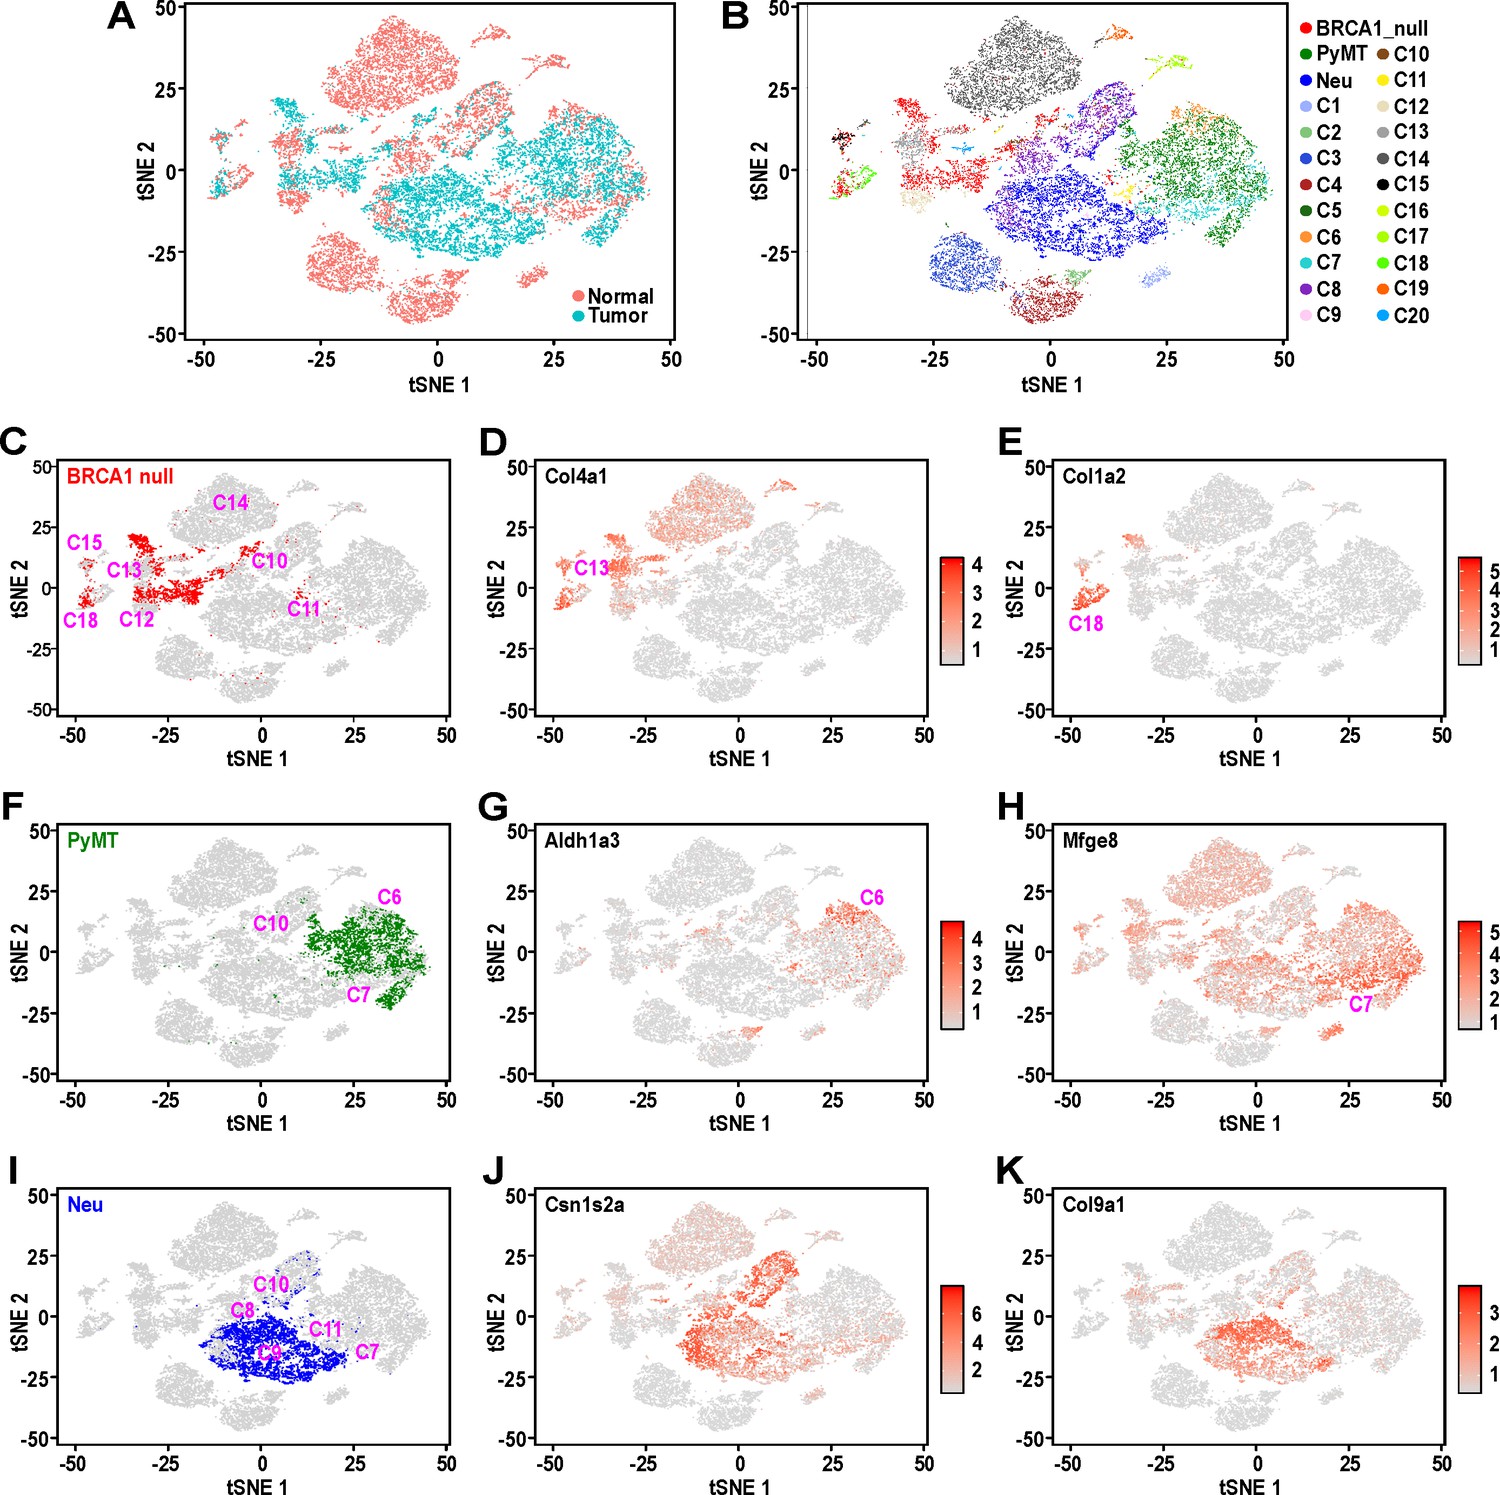
Mouse mammary tumors display distinct patterns of hierarchical heterogeneity.
(A) t-SNE plots of mammary tumor cells (light blue) along with 12000 randomly selected normal MECs (pink) from Bach et al.’s dataset (Bach et al., 2017). (B–I) Similar t-SNE plots colored by (B) tumor sample and putative normal MEC identity (as described in Bach et al., 2017), (C) BRCA1-null tumor cells (red) with surrounding clusters, (D) normalized log-transformed expression levels of Col4a1, (E) normalized log-transformed expression levels of Col1a2, (F) PyMT tumor cells (green) with surrounding tumor clusters, (G) normalized log-transformed expression levels of Aldh1a3, (H) normalized log-transformed expression levels of Mfge8, (I) Neu tumor cells (blue) with surrounding clusters, (J) normalized log-transformed expression levels of Csn1s2a and (K) normalized log-transformed expression levels of Col9a1.
Figure 2—figure supplement 1
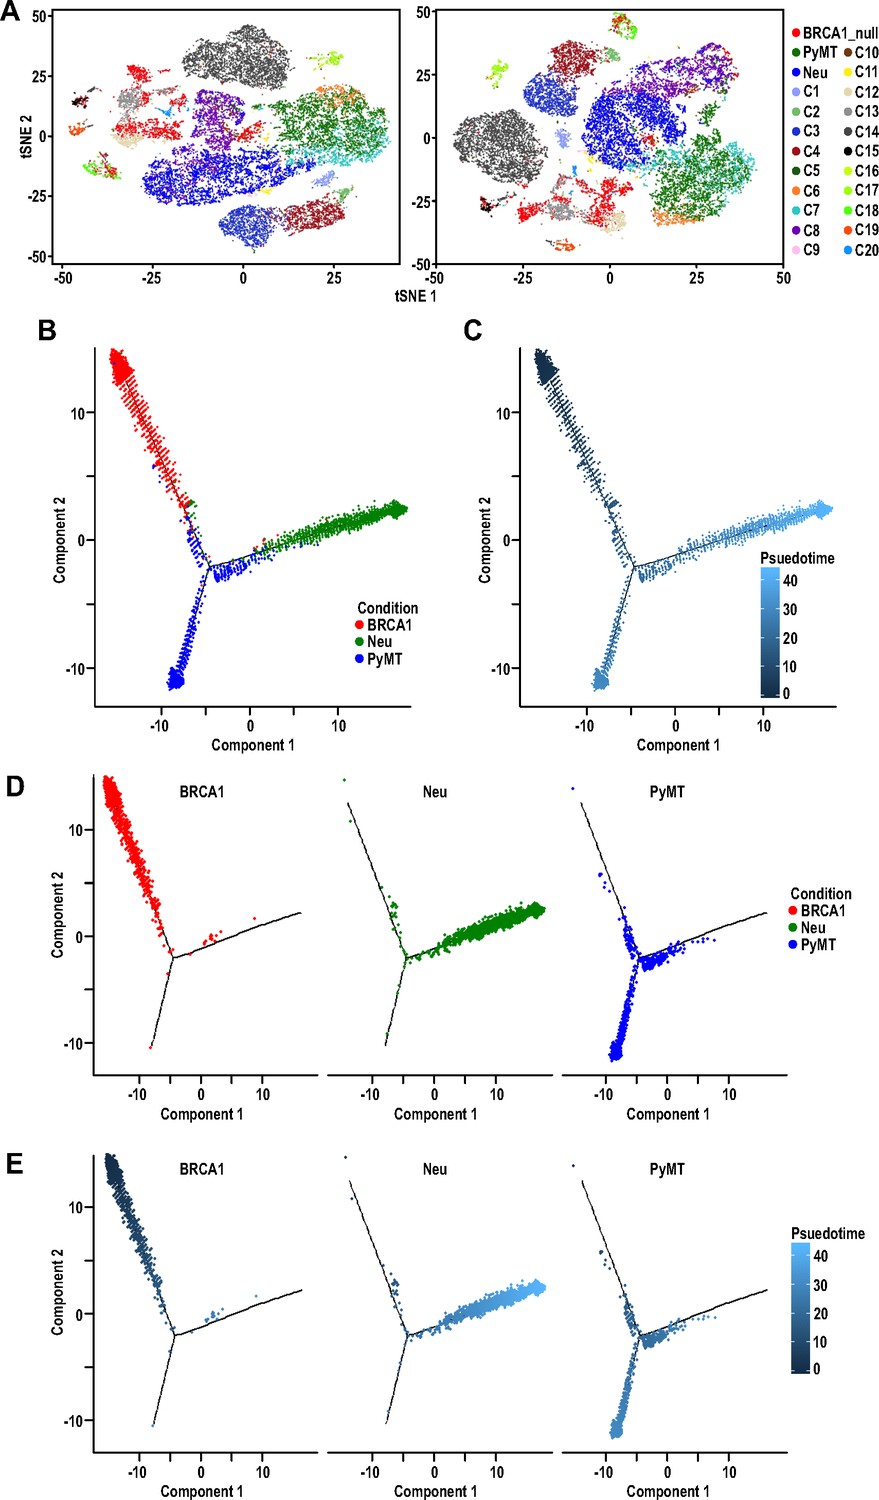
Independent iterations for Seurat v3 analysis and Monocle trajectory analysis of mammary tumor cells.
(A) Two independent iterations of t-SNE plots of mammary tumor cells along with 12000 randomly selected normal MECs from Bach et al.’s dataset (Bach et al., 2017) colored by tumor sample and putative normal MEC identity (as described in Bach et al., 2017). (B–C) Trajectory analysis with three branches of cells colored by tumor sample (B) and pseudo-time (C). (D–E) Monocle analysis of individual tumor samples colored by (D) tumor sample and (E) pseudo-time. Pseudo-time shown is colored from a gradient of dark to light blue.
Figure 3
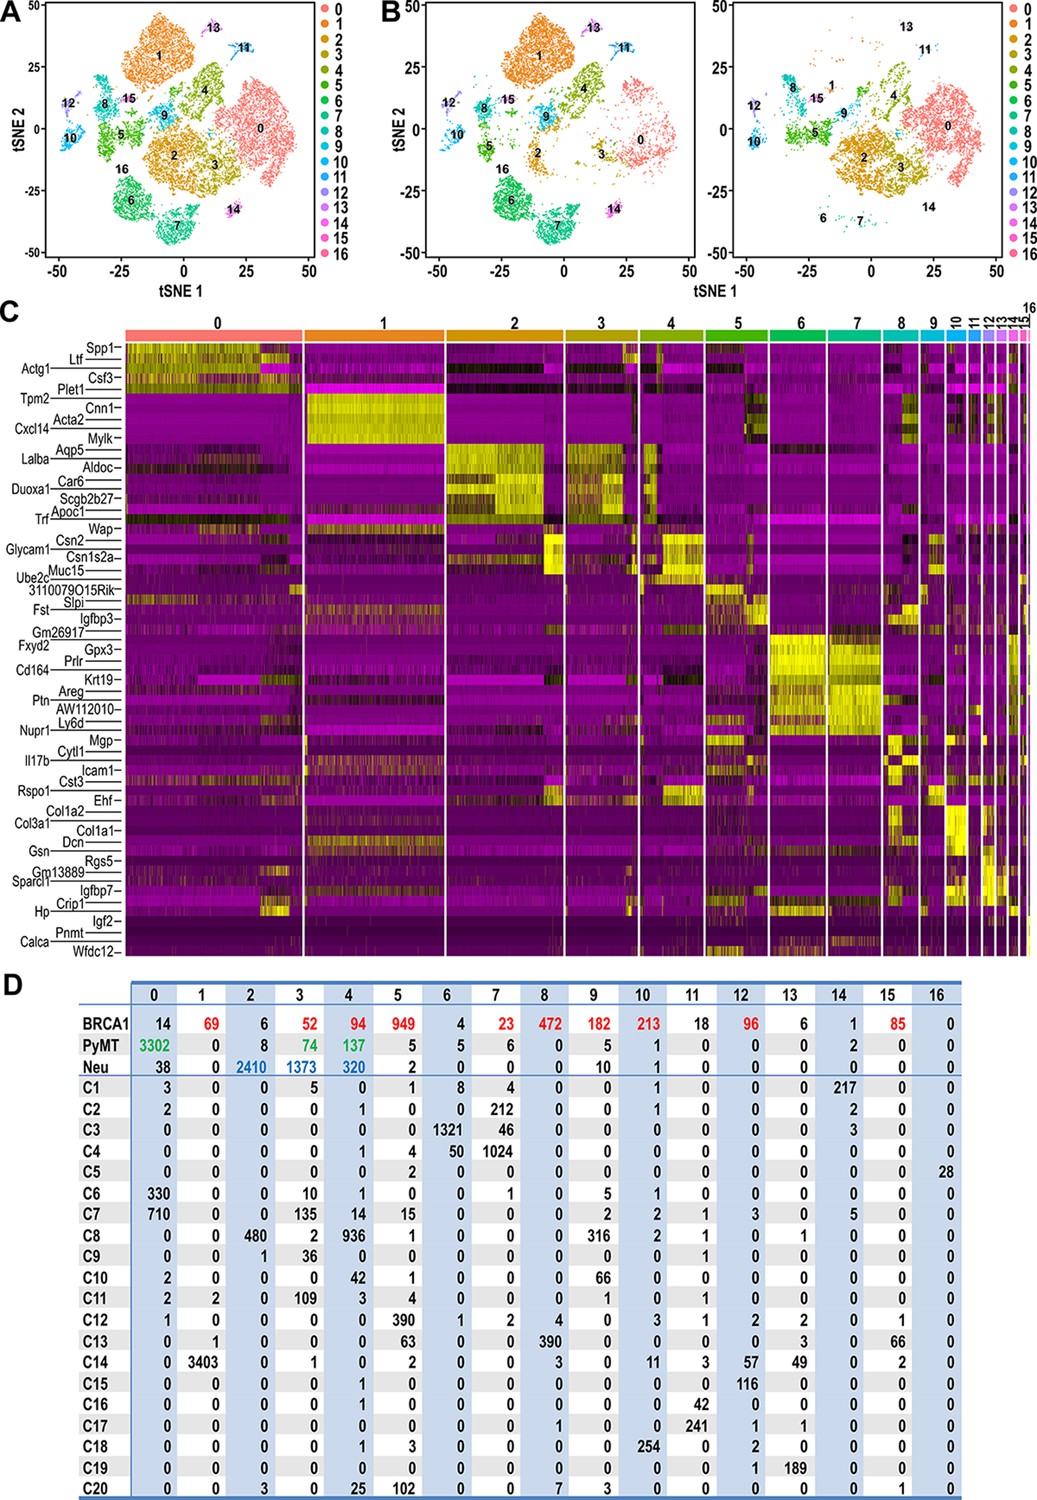
Clustering of tumor and normal datasets reveal distinct spectrums of cell states within each tumor.
(A) t-SNE plots of tumor and normal datasets colored by clusters 0–16. (B) t-SNE plots showing the composition of normal and tumor cells respectively in clusters 0–16. (C) Heatmap of top upregulated genes defining cluster 0–16. (D) Table showing the number of tumor and/or normal cells within clusters 0–16. Tumor cell numbers which were more than 1% of the total cells for each respective tumor type are colored; BRCA1-null (red), PyMT (green) and Neu (blue).
Figure 4 with 4 supplements

Identification of tumor sub-populations from distinct mouse models of breast cancer.
(A,C,E) t-SNE plots for individual tumor samples (A) BRCA1-null tumor, (C) PyMT tumor and (E) Neu tumor, respectively. (B,D,F) Tables summarizing the sub-clusters, putative identities and key cluster defining genes; (B) BRCA1-null tumor, (D) PyMT tumor and (F) Neu tumor, respectively.
-
Figure 4—source data 1
Differentially upregulated genes between sub-clusters in BRCA1-null tumors.
- https://cdn.elifesciences.org/articles/58810/elife-58810-fig4-data1-v1.xlsx
-
Figure 4—source data 2
Differentially upregulated pathways (GO analysis) between sub-clusters in BRCA1-null tumors.
- https://cdn.elifesciences.org/articles/58810/elife-58810-fig4-data2-v1.xlsx
-
Figure 4—source data 3
Differentially upregulated genes between sub-clusters in PyMT tumors.
- https://cdn.elifesciences.org/articles/58810/elife-58810-fig4-data3-v1.xlsx
-
Figure 4—source data 4
Differentially upregulated pathways (GO analysis) between sub-clusters in PyMT tumors.
- https://cdn.elifesciences.org/articles/58810/elife-58810-fig4-data4-v1.xlsx
-
Figure 4—source data 5
Differentially upregulated genes between sub-clusters in a 4T1 tumor.
- https://cdn.elifesciences.org/articles/58810/elife-58810-fig4-data5-v1.xlsx
-
Figure 4—source data 6
Differentially upregulated genes between sub-clusters in Neu tumors.
- https://cdn.elifesciences.org/articles/58810/elife-58810-fig4-data6-v1.xlsx
-
Figure 4—source data 7
Differentially upregulated pathways (GO analysis) between sub-clusters in Neu tumors.
- https://cdn.elifesciences.org/articles/58810/elife-58810-fig4-data7-v1.xlsx
Figure 4—figure supplement 1
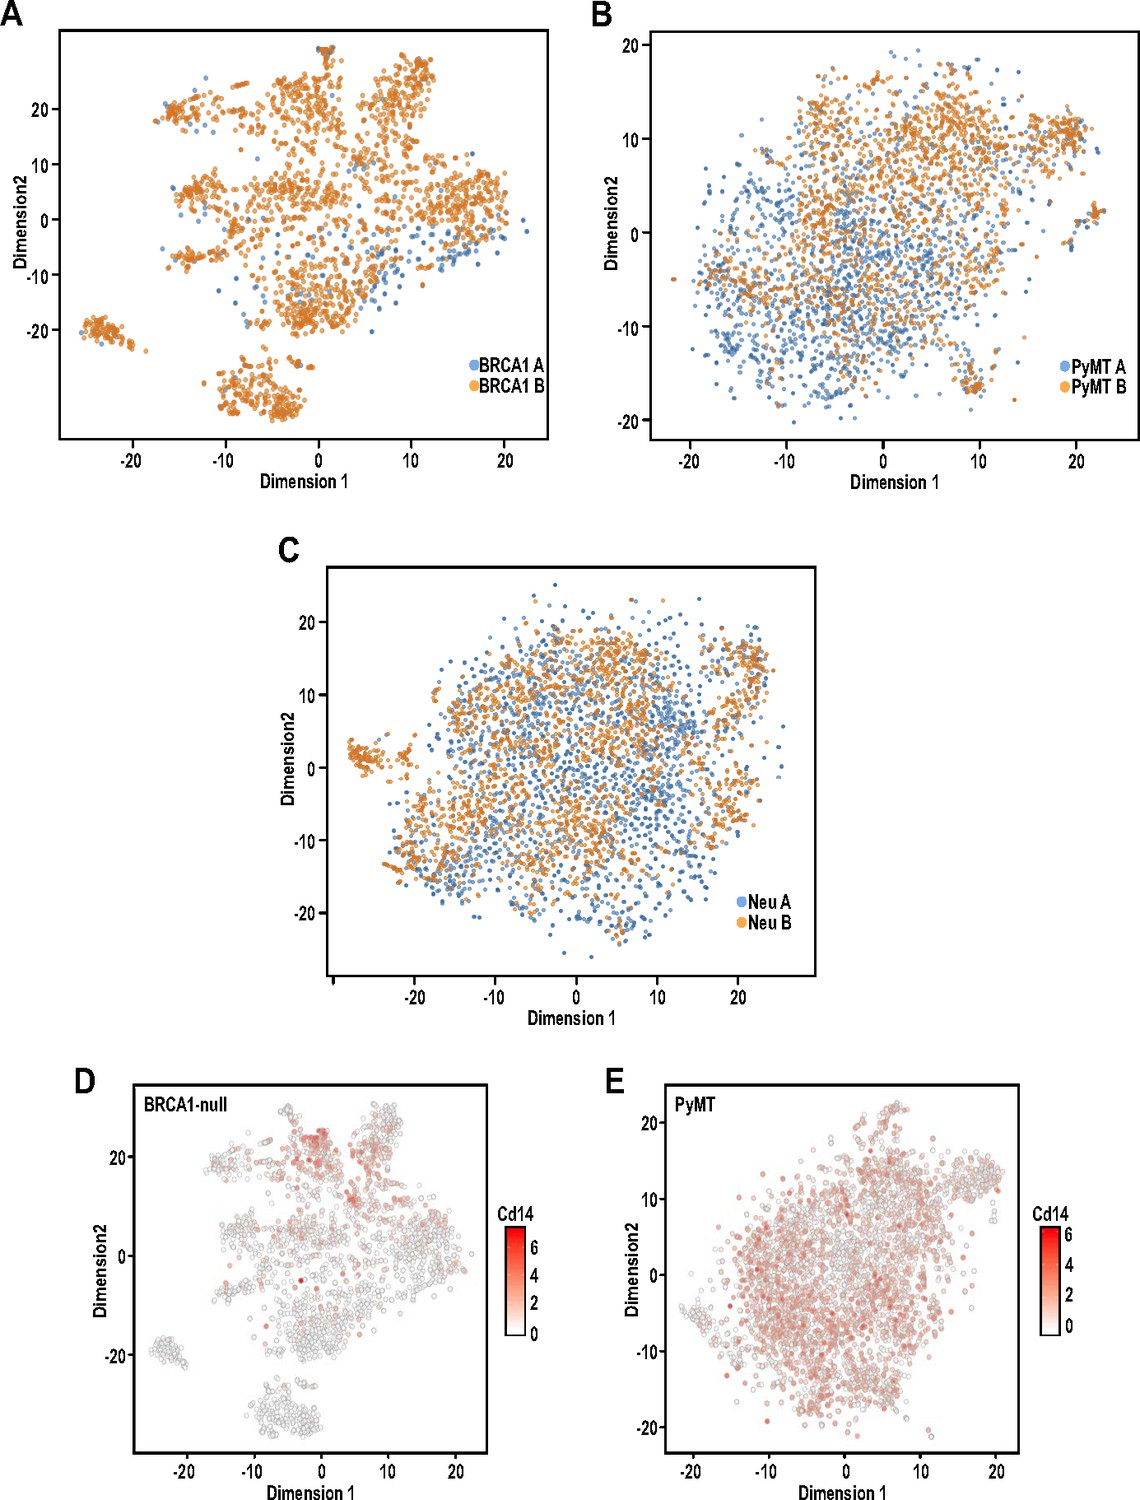
Even distribution of cells between respective tumor replicates in intra-tumoral analysis.
(A–C) t-SNE plots showing the distribution of respective replicates in (A) BRCA1-null tumor, (B) PyMT tumor and (C) Neu tumor for intra-tumoral heterogeneity analysis. (D–E) t-SNE plots showing the levels of Cd14 expression in (D) BRCA1-null and (E) PyMT tumor cells.
Figure 4—figure supplement 2
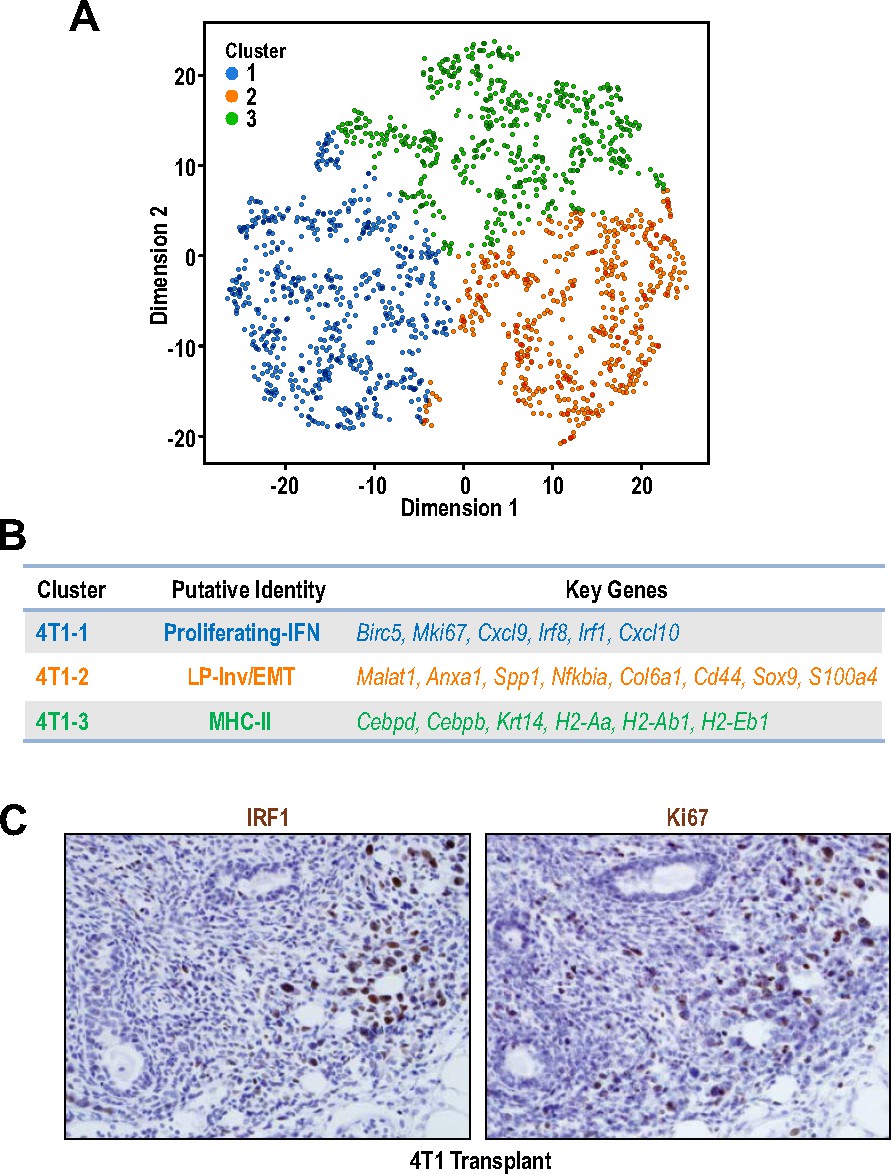
Intra-tumoral heterogeneity within a 4T1 tumor.
(A) t-SNE plot of cell clusters within a 4T1 tumor. (B) Table showing the clusters, putative identities and key cluster defining genes within a 4T1 tumor. (C) Immunohistochemical staining of IRF1 and Ki67 in serial sections in a 4T1 tumor.
Figure 4—figure supplement 3
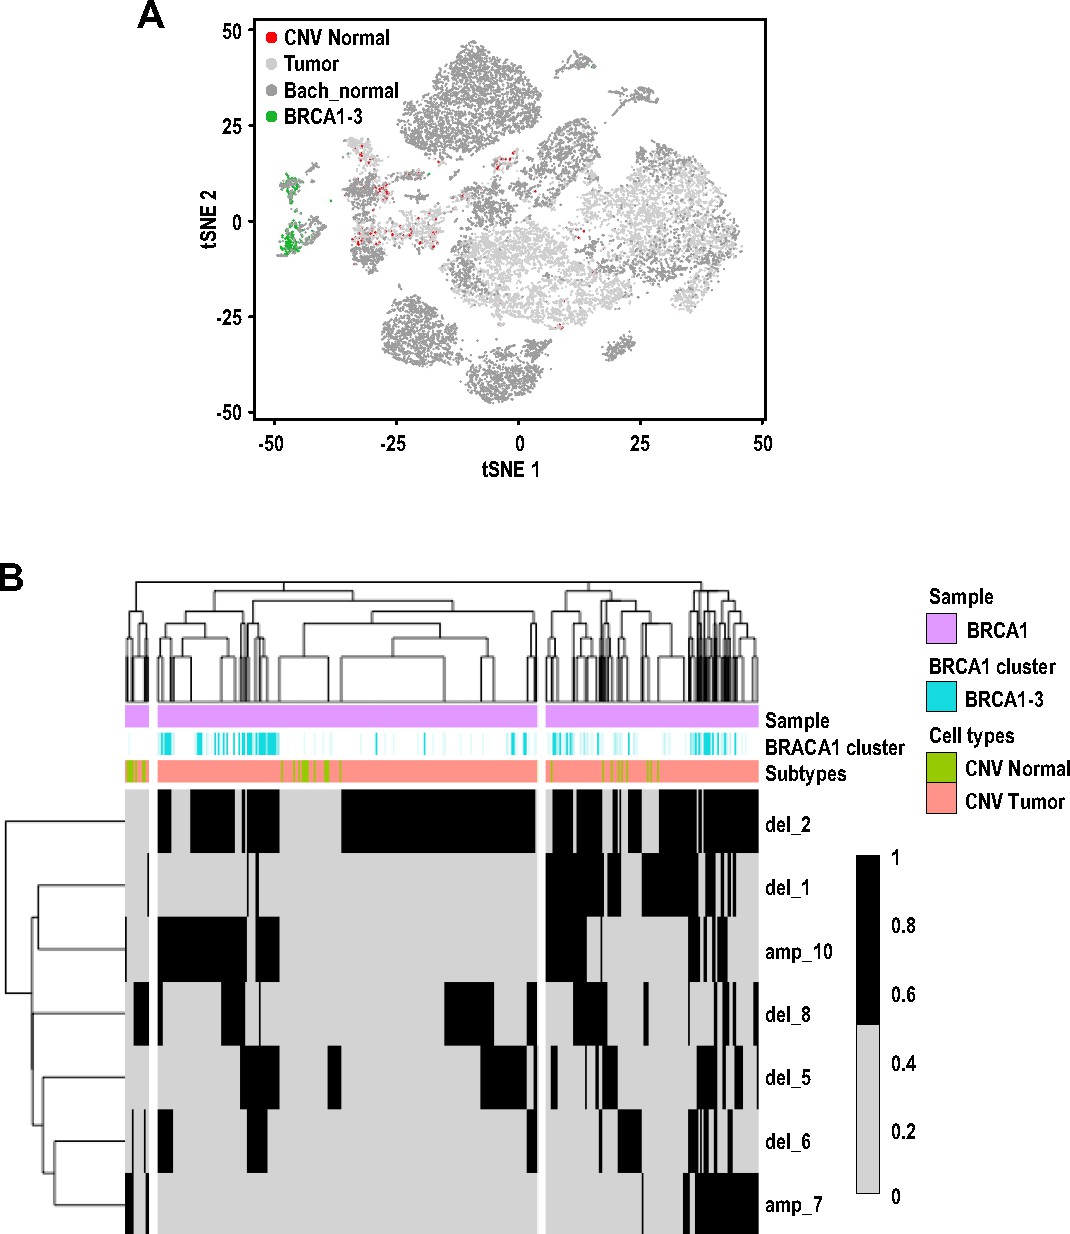
Cluster BRCA1-3 cells with mesenchymal characteristics were classified as tumor cells due to inferred presence of copy number variations (CNVs).
(A) t-SNE plot of cell clusters (similar to Figure 2A), colored by normal cell without CNVs (red) and cluster BRCA1-3 cells (green), showing mutual exclusivity. (B) Heatmap showing the CNVs inferred for cells within cluster BRCA1-3.
Figure 4—figure supplement 4
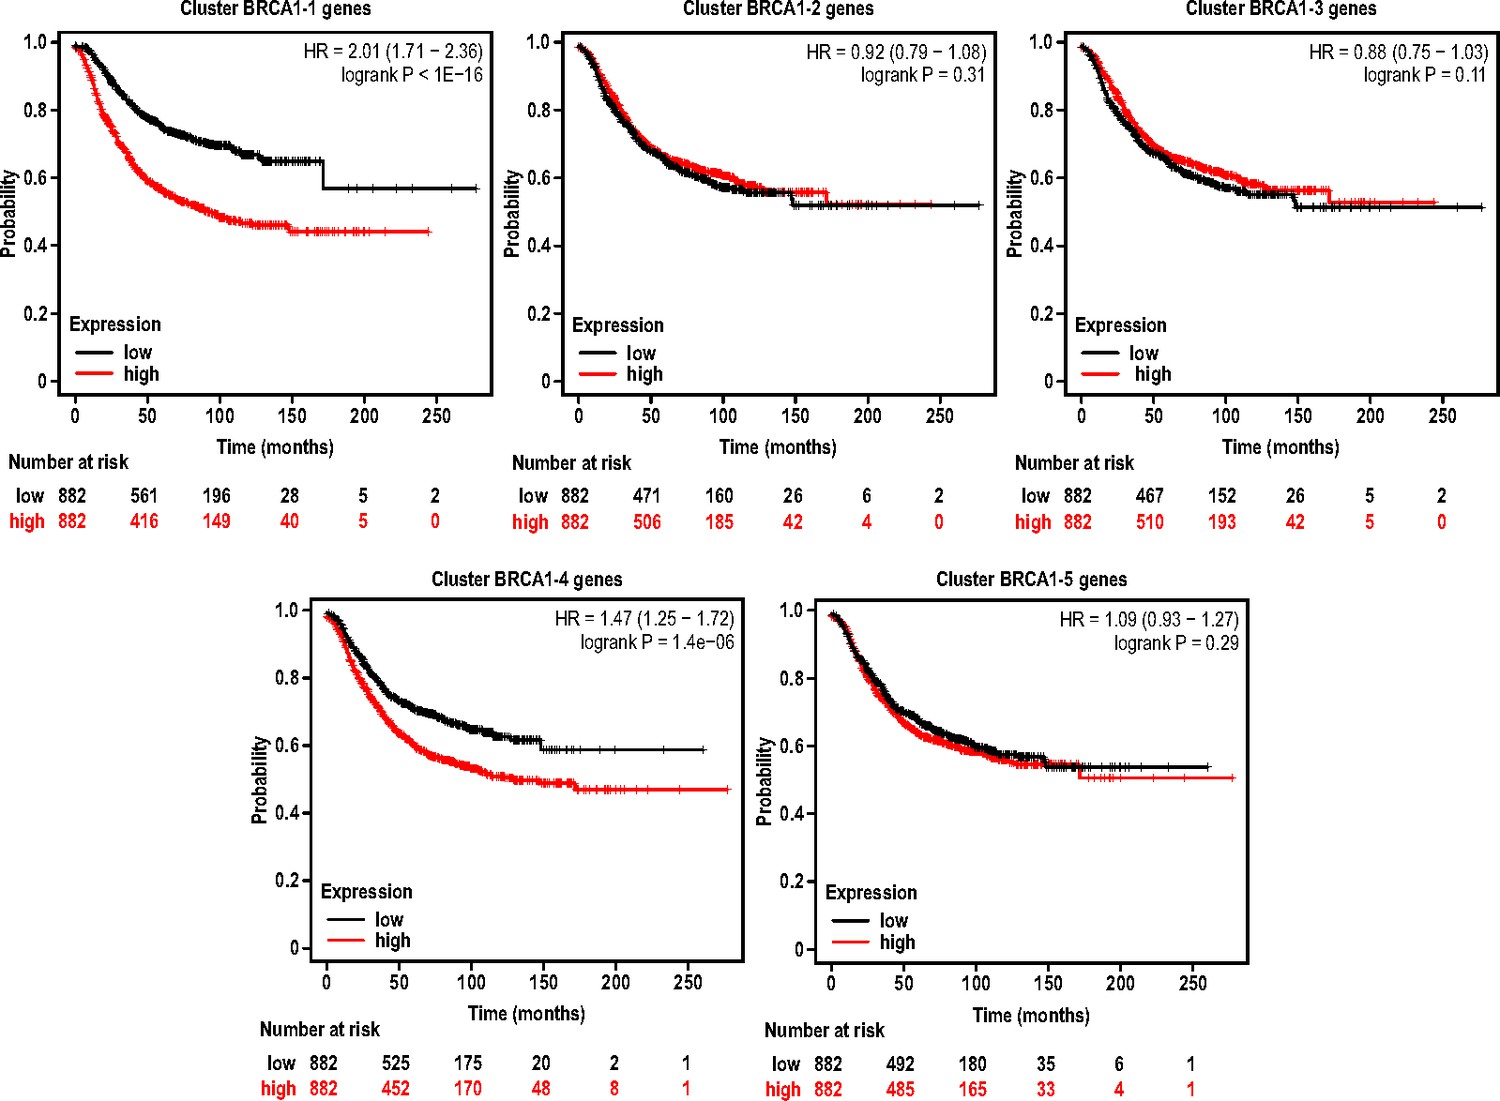
Relapse free survival plots for breast cancer patients with gene expression signatures associated with BRCA1 clusters.
Kaplan-Meier survival plots showing relapse free survival for patients stratified by high gene expression for the top 50 differentially expressed genes of a particular BRCA1 cluster (BRCA1-1 to BRCA1-5). Plots were generated using kmplot.com and statistical significance by logrank test were indicated for respective BRCA1 clusters.
Figure 5 with 1 supplement

Isolation of CD14hi cells with increased tumorigenic potential in the Neu tumor.
(A) t-SNE plots showing the expression levels of Cd14, Bcl3, Osmr and Nfkbia in the Neu tumor sub-clusters. (B) Representative immuno-histochemical staining of Neu and CD14 in a Neu tumor. (C) Dot plot showing the gating for isolation of CD14hi and CD14lo/- Neu tumor cell sub-populations. (D) Relative mRNA expression levels of Cd14, Bcl3, Osmr and Nfkbia between the sorted Neu tumor sub-populations. Bar charts show mean expression values and error bars represent standard error (n = 9, triplicates from three independent experiments, ** denotes p<0.01, *** denotes p<0.001). (E) Immuno-blots showing the levels of phospho-STAT3, STAT3 and ACTIN between the sorted Neu tumor sub-populations. (F) Limiting dilution transplant analysis of sorted Neu tumor sub-populations in syngeneic FvB mice. The appearance of tumors were recorded 4 weeks post-transplant and CSC frequencies were estimated using ELDA limiting dilution analysis (Hu and Smyth, 2009).
Figure 5—figure supplement 1
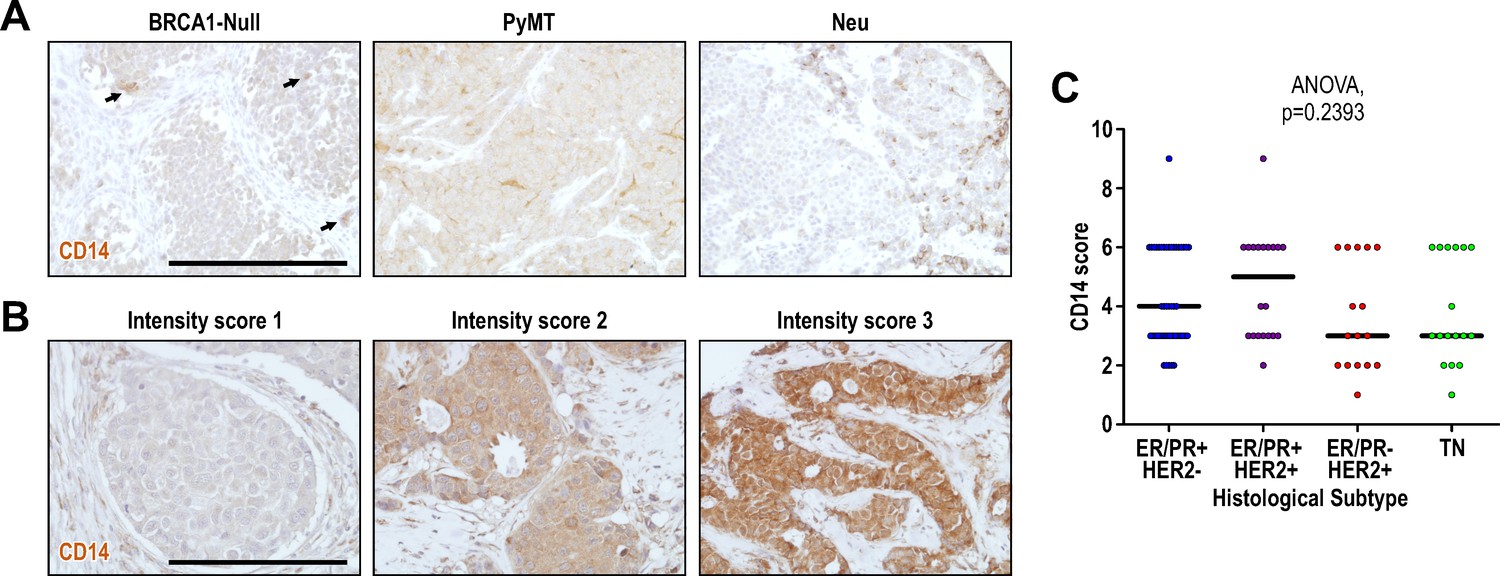
CD14 protein expression levels in mouse models and human breast tumors.
Immunohistochemical staining for CD14 in (A) respective mouse models and (B) human breast cancer tissue array. Scale bar represents 200 µm. (C) Quantification of CD14 scores for each histological subtype for the human breast cancer array examined. Intensity scores (1-3) for human breast cancer samples were quantified for each tumor and multiplied by the coverage score (1 = 0–5% positive cells, 2 = 5–50% positive cells, 3=>50% positive cells).
Figure 6
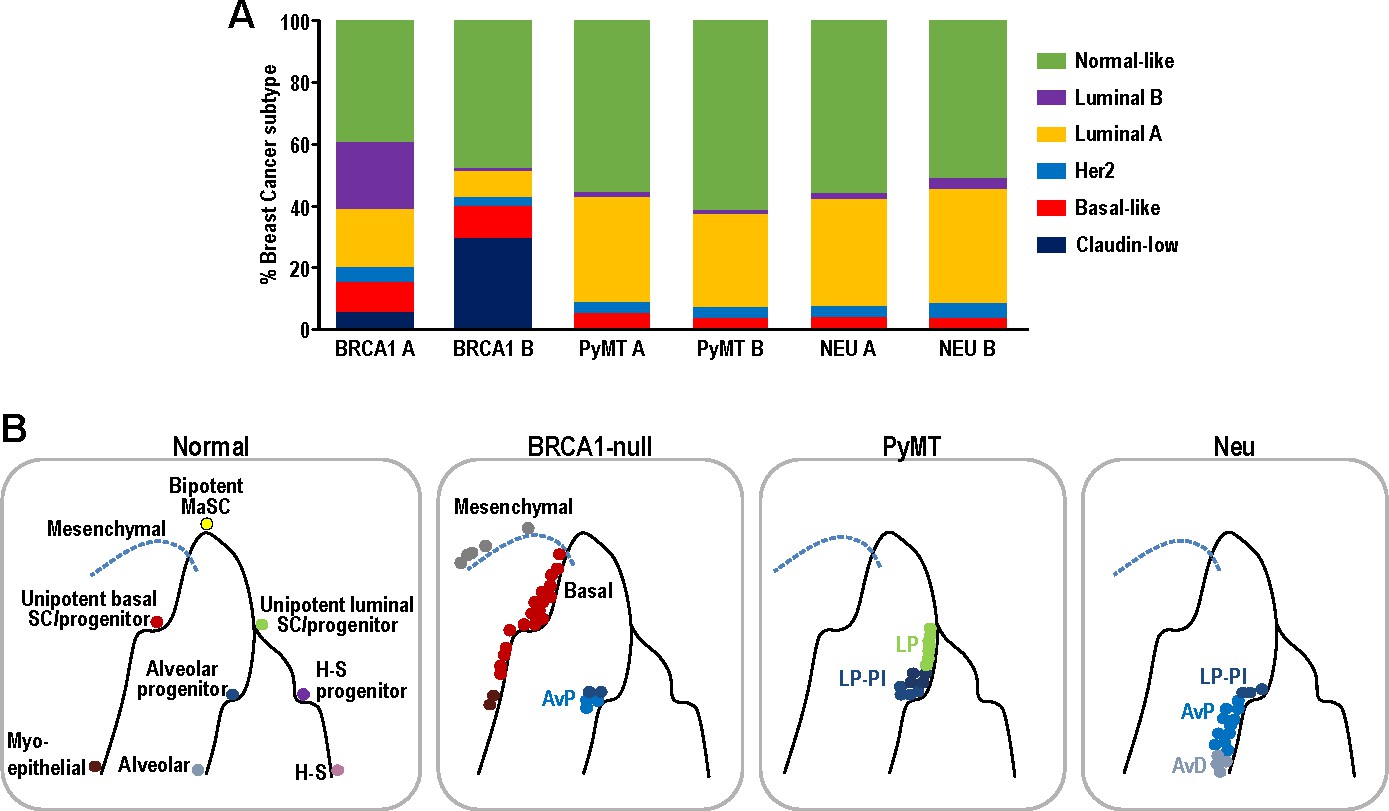
Single-cell intrinsic molecular subtype assignment of mammary tumor cells and model for the distribution of cell states within each mammary tumor.
(A) Bar charts showing the % of cells representing claudin-low (navy blue), basal-like (orange), Her2 (blue), luminal A (yellow), luminal B (purple) and normal-like (green) breast cancer subtypes within BRCA1-null, PyMT and Neu tumors. (B) Schematic model summarizing the distribution of cell states for each of the tumors examined. Lines represent differentiation trajectories of MECs, while circles indicate cells.
Tables
Key resources table
| Reagent type (species) or resource | Designation | Source or reference | Identifiers | Additional information |
|---|---|---|---|---|
| Genetic reagent (Mus musculus) | FVB/NJ | Jackson Laboratory | 001800 | RRID:IMSR_JAX:001800 |
| Genetic reagent (Mus musculus) | BALB/cJ | Jackson Laboratory | 000651 | RRID:IMSR_JAX:000651 |
| Genetic reagent (Mus musculus) | FVB/N-Tg(MMTV-neu)202Mul/J | Jackson Laboratory | 002376 | RRID:IMSR_JAX:002376 |
| Genetic reagent (Mus musculus) | FVB/N-Tg(MMTV-PyVT)634Mul/J | Jackson Laboratory | 002374 | RRID:IMSR_JAX:002374 |
| Genetic reagent (Mus musculus) | FVB/N-Brca1f/fTrp53f/f Tg(Krt14-Cre) | Liu et al., 2007 | Jos Jonkers RRID:MGI:3762188 | |
| Cell line (Mus musculus) | N148 | This paper | Primary cell line derived from Neu tumor. Description can be found under the‘Limiting dilution transplantation’ section in Materials and methods | |
| Cell line (Mus musculus) | FF99WT | This paper | Primary cell line derived from PyMT tumor. Description can be found under the ‘Animals’ section in Materials and methods | |
| Cell line (Mus musculus) | 4T1 | ATCC | CRL-2539 | RRID:CVCL_0125 |
| Antibody | Anti-CD14 (Rabbit polyclonal) | Invitrogen | PA5-78957 | IHC (1:200) RRID:AB_2746073 |
| Antibody | Anti-ErbB2 (Rabbit monoclonal) | Cell Signaling Technology | 2165 | IHC (1:200) RRID:AB_10692490 |
| Antibody | Anti-Mki67 (Rabbit monoclonal) | Spring Bioscience | M3062 | IHC (1:200) RRID:AB_11219741 |
| Antibody | Anti-Irf1 (Rabbit monoclonal) | Cell Signaling Technology | 8478 | IHC (1:200) RRID:AB_10949108 |
| Antibody | Anti-p-Stat3 (Rabbit monoclonal) | Cell Signaling Technology | 9145 | WB (1:1000) RRID:AB_2491009 |
| Antibody | Anti-Stat3 (Mouse monoclonal) | Cell Signaling Technology | 9139 | WB (1:1000) RRID:AB_331757 |
| Antibody | Anti-beta Actin (Mouse monoclonal) | Sigma | A5441 | WB (1:1000) RRID:AB_476744 |
| Antibody | PE Anti-CD24 (Rat monoclonal) | BD Biosciences | 553262 | Flow (1:200) RRID:AB_394741 |
| Antibody | APC Anti-CD31 (Rat monoclonal) | Biolegend | 102410 | Flow (1:500) RRID:AB_312905 |
| Antibody | APC Anti-TER119 (Rat monoclonal) | Biolegend | 116212 | Flow (1:500) RRID:AB_313713 |
| Antibody | APC Anti-CD45 (Rat monoclonal) | Biolegend | 103112 | Flow (1:500) RRID:AB_312977 |
| Antibody | APC/Cy7 Anti-CD14 (Rat monoclonal) | Biolegend | 123317 | Flow (1:200) RRID:AB_10900813 |
| Sequence-based reagent | CD14 F | IDT | qPCR primer | ACCGACCATGGAGCGTGTG |
| Sequence-based reagent | CD14 R | IDT | qPCR primer | GCCGTACAATTCCACATCTGC |
| Sequence-based reagent | BCL3 F | IDT | qPCR primer | CCGGAGGCCCTTTACTACCA |
| Sequence-based reagent | BCL3 R | IDT | qPCR primer | GGAGTAGGGGTGAGTAGGCAG |
| Sequence-based reagent | OSMR F | IDT | qPCR primer | CATCCCGAAGCGAAGTCTTGG |
| Sequence-based reagent | OSMR R | IDT | qPCR primer | GGCTGGGACAGTCCATTCTAAA |
| Sequence-based reagent | NFKBIA F | IDT | qPCR primer | TGAAGGACGAGGAGTACGAGC |
| Sequence-based reagent | NFKBIA R | IDT | qPCR primer | TTCGTGGATGATTGCCAAGTG |
| Commercial assay or kit | 10x Chromium single-cell kit | 10x Genomics | V2 chemistry | |
| Software, algorithm | Cell Ranger | 10x Genomics | ||
| Software, algorithm | Single-cell RNA sequencing analysis | This paper | https://github.com/ZhuXiaoting/BreastCancer_SingleCell (copy archived at https://github.com/elifesciences-publications/BreastCancer_SingleCell) |
Additional files
Download links
A two-part list of links to download the article, or parts of the article, in various formats.
Downloads (link to download the article as PDF)
Open citations (links to open the citations from this article in various online reference manager services)
Cite this article (links to download the citations from this article in formats compatible with various reference manager tools)
Single-cell RNA-sequencing reveals distinct patterns of cell state heterogeneity in mouse models of breast cancer
eLife 9:e58810.
https://doi.org/10.7554/eLife.58810


