A feedback loop governs the relationship between lipid metabolism and longevity
- Department of Neuroscience and The Dorris Neuroscience Center, The Scripps Research Institute, United States
- Skaggs Graduate School of Chemical and Biological Sciences, The Scripps Research Institute, United States
Figures
Figure 1
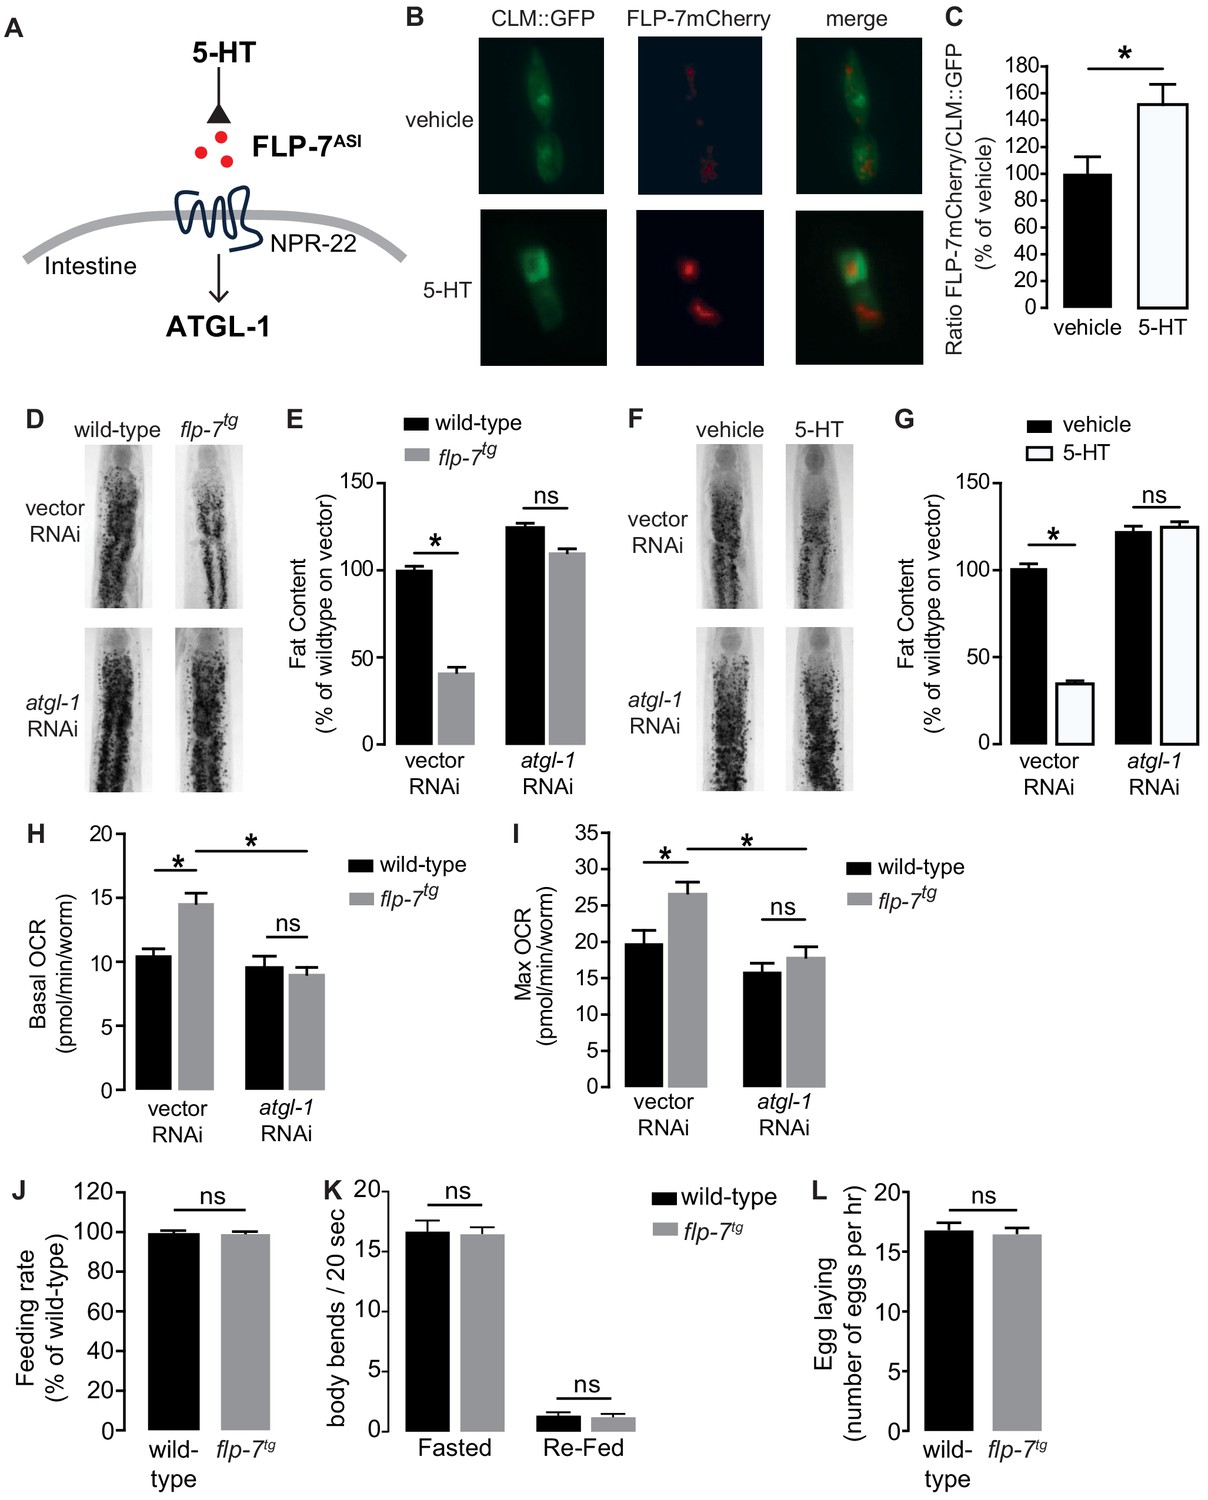
Neuronal FLP-7/tachykinin secretion as an experimental tool to model sustained fat oxidation in vivo.
(A) Model depicting the C. elegans tachykinin neuroendocrine axis. Neuronal FLP-7/tachykinin is secreted from the ASI neurons in response to 5-HT signaling. Secreted FLP-7 acts on its cognate receptor NPR-22 (ortholog of the mammalian neurokinin two receptor NK2R) in the intestine. FLP-7/NPR-22 signaling transcriptionally activates the conserved lipase ATGL-1, which is the rate-limiting enzyme that converts stored triglycerides to free fatty acids destined for beta-oxidation. (B) An assay to detect and quantify secreted FLP-7mCherry that was previously validated (Palamiuc et al., 2017). Representative images of vehicle or 5-HT treated wild-type animals bearing a FLP-7mCherry fusion protein (red) expressed from ASI neurons, and coelomocytes countermarked with GFP (CLM::GFP). FLP-7mCherry is secreted and non-specifically endocytosed by the coelomocytes. Left panels, GFP expression in coelomocytes; center panels, secreted FLP-7mCherry in coelomocytes; Right panels, merge. (C) The intensity of FLP-7mCherry within the coelomocytes was quantified and normalized to the area of CLM::GFP. Data are presented as percent of vehicle ± sem (n = 21). *, p<0.05 by Student’s t-test. (D) Representative images of wild-type and flp-7tg animals on vector or atgl-1 RNAi fixed and stained with Oil Red O. (E) Quantification of lipid droplets in the depicted conditions, presented as a percentage of wild-type controls (n = 16–20). ns, not significant. *, p<0.05 by two-way ANOVA. (F) Representative images of wild-type animals on vector or atgl-1 RNAi, treated with vehicle or 5-HT, fixed and stained with Oil Red O to measure fat content. (G) Quantification of lipid droplets in the depicted conditions, presented as percent of wild-types treated with vehicle ± sem. (n = 18–20). ns, not significant. *, p<0.05 by two-way ANOVA. (H, I) Oxygen consumption rate (OCR) of wild-type or flp-7tg animals fed vector or atgl-1 RNAi. Basal OCR (H) was quantified prior to addition of FCCP (50 µM) and maximal OCR (I) was determined following FCCP stimulation. Data are presented as pmol/min/worm ± sem. (n = 10–20 wells, each containing approximately 10 worms). For all genotypes and conditions tested, no developmental delays, growth or size changes were detectable. ns, not significant. *, p<0.05 by two-way ANOVA. (J) Feeding rate was measured in wild-type and flp-7tg animals and data are presented as percent of wild-type. (n = 25 per group) ns, not significant by Student’s t-test. (K) Locomotion was measured in wild-type and flp-7tg animals that were fasted or animals that were fasted and then re-fed. Data are plotted as body bends per 20 s. (n = 15 per group) ns, not significant by two-way ANOVA. (L) Egg laying was recorded in wild-type and flp-7tg animals and results are presented as number of eggs laid per hour. (n = 10 per group) ns, not significant by Student’s t-test.
Figure 2 with 1 supplement
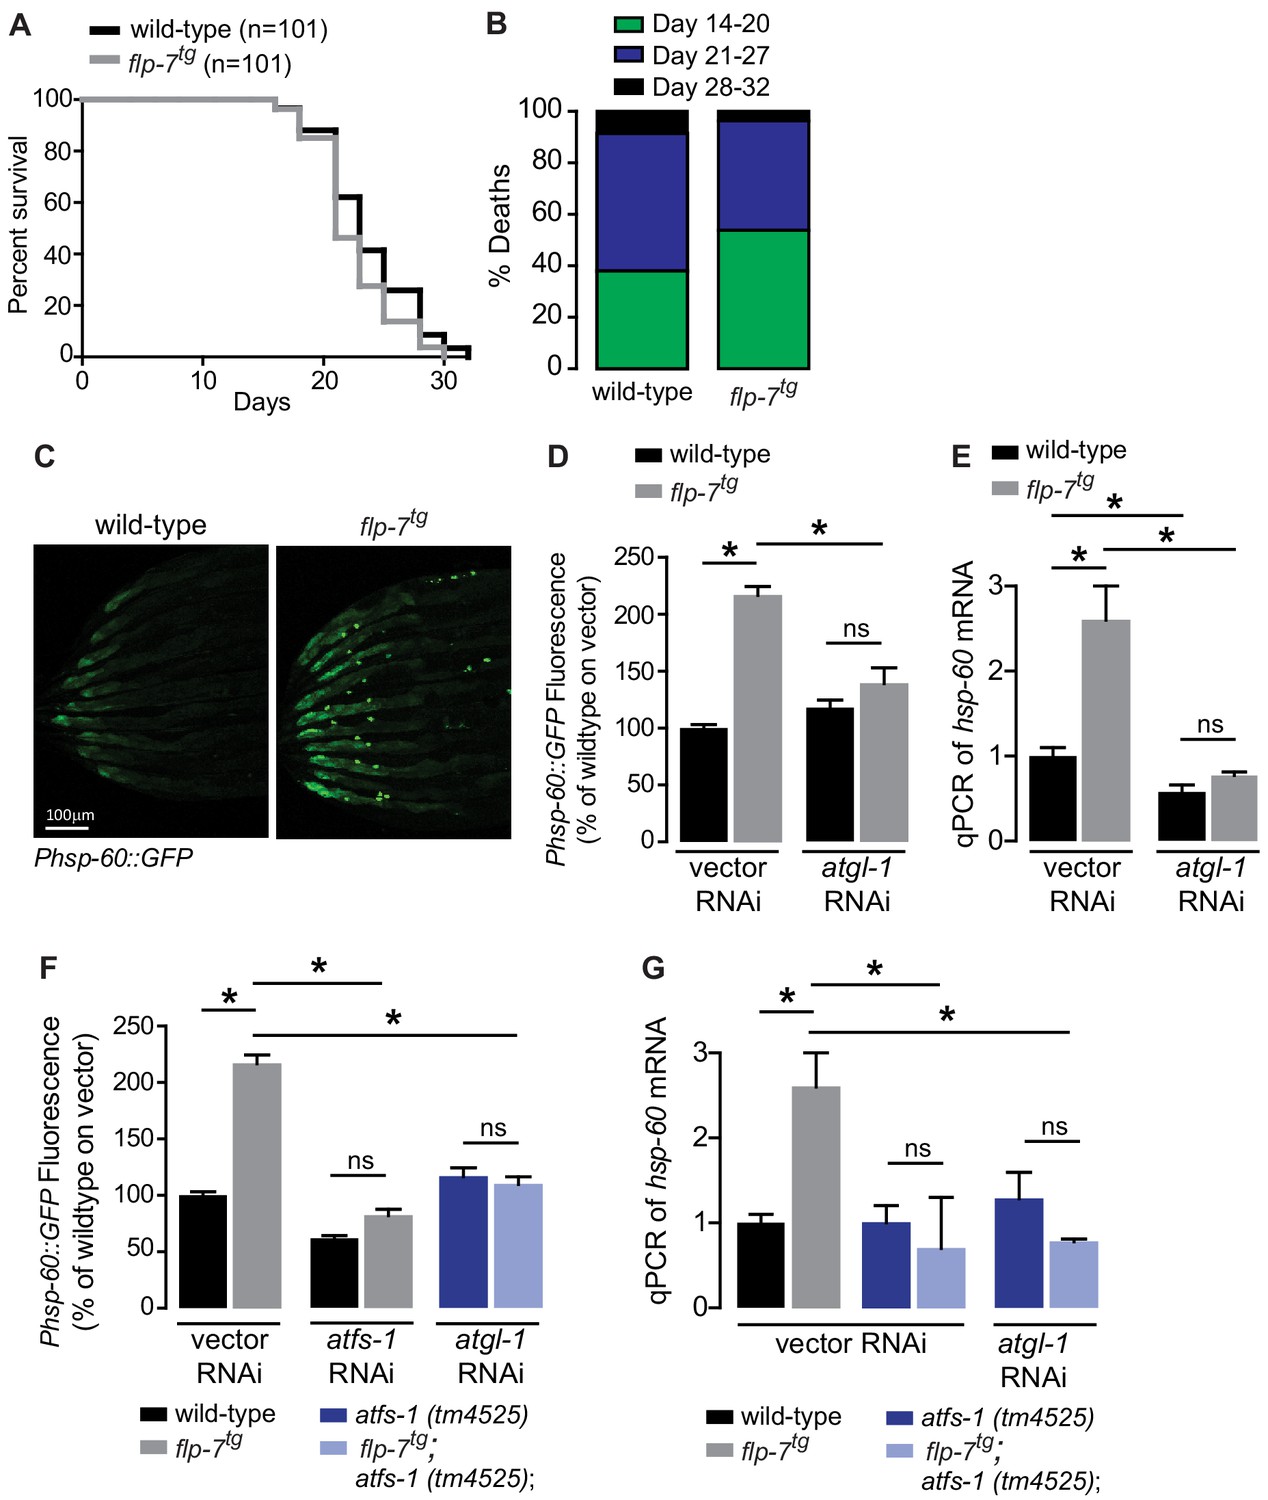
Sustained fat oxidation in the intestine stimulates a mitochondrial stress response.
(A) Lifespans of wild-type (n = 101) and flp-7tg (n = 101) were assessed by counting the number of alive and dead animals every other day until all animals had died. Data are plotted as the percentage of animals that survived on any given day, relative to the number of animals alive on Day 1 of adulthood. p-value=0.08 by the Log-Rank Test. (B) Percent deaths of wild-type and flp-7tg animals over the span of days 14–20 (green), days 21–27 (blue), and days 28–32 (black). Data are presented as percent death for each range of days. (C) Representative images of wild-type and flp-7tg bearing an integrated Phsp-60::GFP transgene. Scale bar, 100 µm. (D) GFP intensity was quantified and normalized to the area of each animal, fed vector or atgl-1 RNAi, expressed relative to wild-type vector ± sem. (n = 30). ns, not significant. *, p<0.05 by two-way ANOVA. (E) hsp-60 mRNA was measured via qPCR in the groups indicated. act-1 mRNA was used as a control. Data are presented as fold change relative to wild-type vector ± sem. (n = 4–6). ns, not significant. *, p<0.05 by two-way ANOVA. (F) The fluorescence intensity of hsp-60 expression was quantified in the conditions indicated in the figure panel. Data are presented as a percent of wild-type vector ± sem. (n = 30). ns, not significant. *, p<0.05 by two-way ANOVA. (G) qPCR of hsp-60 mRNA. Data are presented as fold change relative to wild-type vector ± sem. (n = 4–6). ns, not significant. *, p<0.05 by two-way ANOVA.
Figure 2—figure supplement 1

Induction of mitochondrial stress by 5-HT.
qPCR of hsp-60 mRNA in wild-type worms treated with vehicle of r5-HT and fed vector, atgl-1, or atfs-1 RNAi. Data are presented as fold change relative to vehicle treatment on vector RNAi ± sem (n = 6). ns, not significant. *, p<0.05 vs vehicle and $, p<0.05 vs vector RNAi by two-way ANOVA.
Figure 3 with 1 supplement
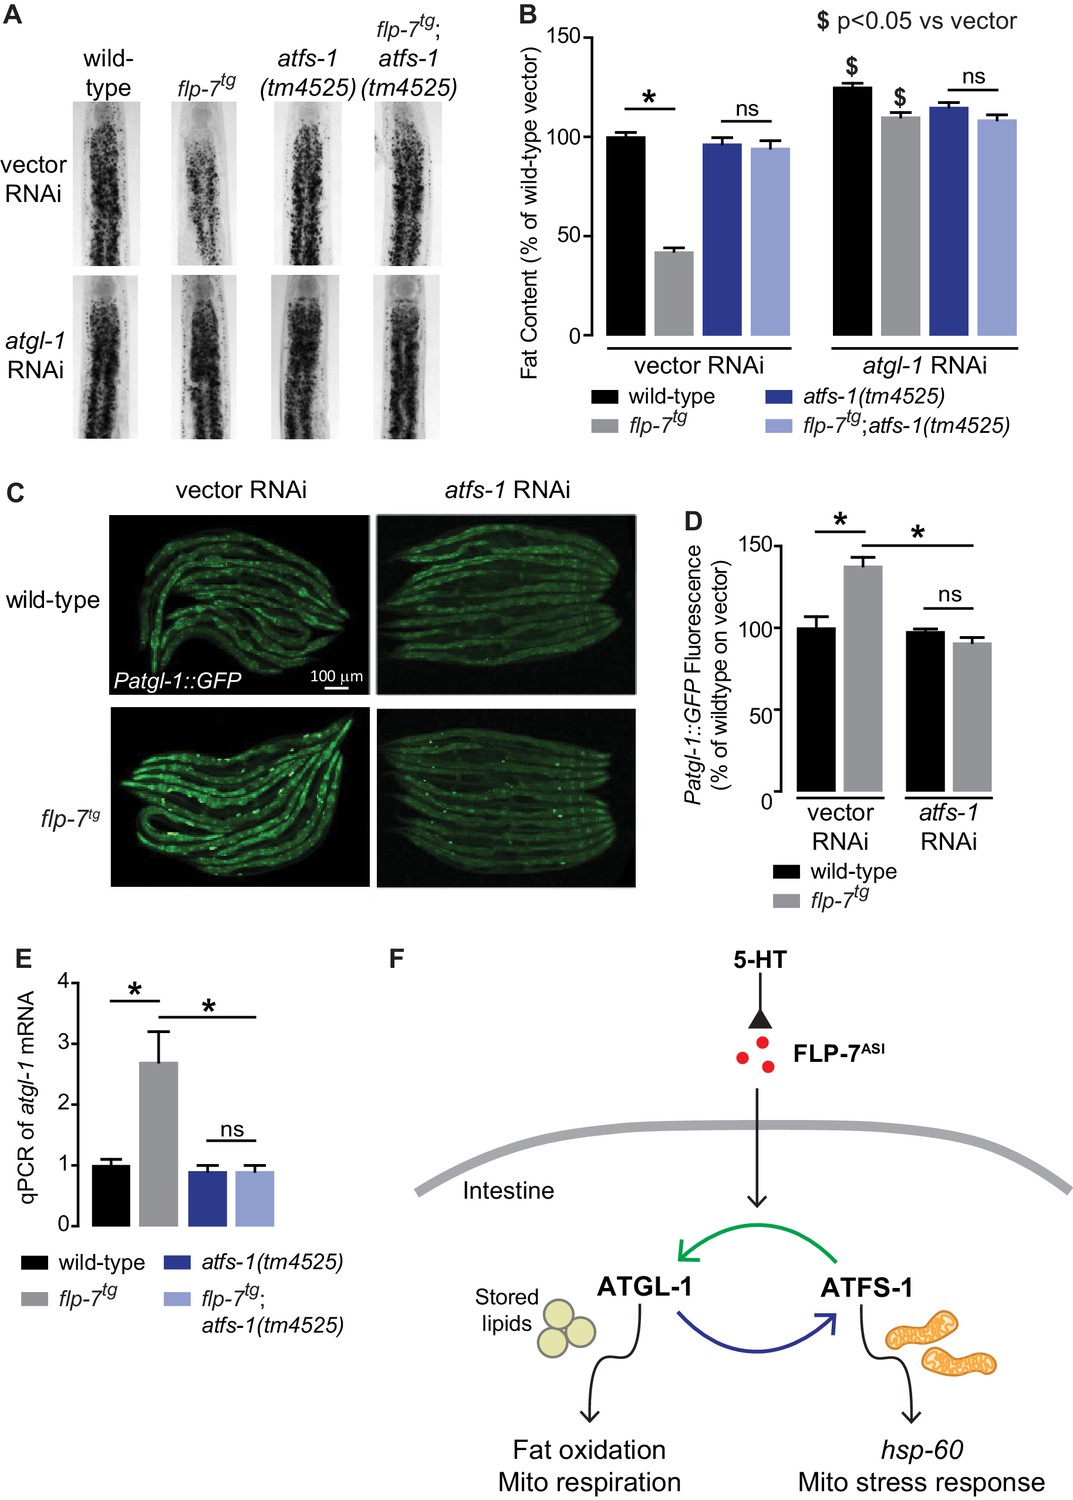
The ATFS-1-mediated mitochondrial stress response is required to sustain fat oxidation.
(A) Representative images of wild-type and indicated genotypes on vector or atgl-1 RNAi fixed and stained with Oil Red O. (B) Quantification of lipid droplets in the depicted conditions, presented as a percentage of wild-type vector ± sem. (n = 20). ns, not significant. *, p<0.05 vs wild-type and $ p<0.05 vs vector by two-way ANOVA. (C) Representative images are shown of wild-type and flp-7tg animals bearing an integrated Patgl-1::GFP transgene fed vector or atfs-1 RNAi. Scale bar, 100 µm. (D) The fluorescence intensity of atgl-1 expression is quantified and presented as percent of wild-type vector ± sem. (n = 29–30). ns, not significant. *, p<0.05 by two-way ANOVA. (E) qPCR of atgl-1 mRNA. act-1 mRNA was used as a control. Data are presented for the indicated genotypes as fold change relative to wild-type ± sem. (n = 4). ns, not significant. *, p<0.05 by two-way ANOVA. (F) As indicated by the data, model depicting the reciprocal regulatory relationship between the fat-burning enzyme ATGL-1 that triggers the hsp-60 mitochondrial stress response (blue arrow), and the stress sensor ATFS-1 that is required for fat oxidation (green arrow).
Figure 3—figure supplement 1
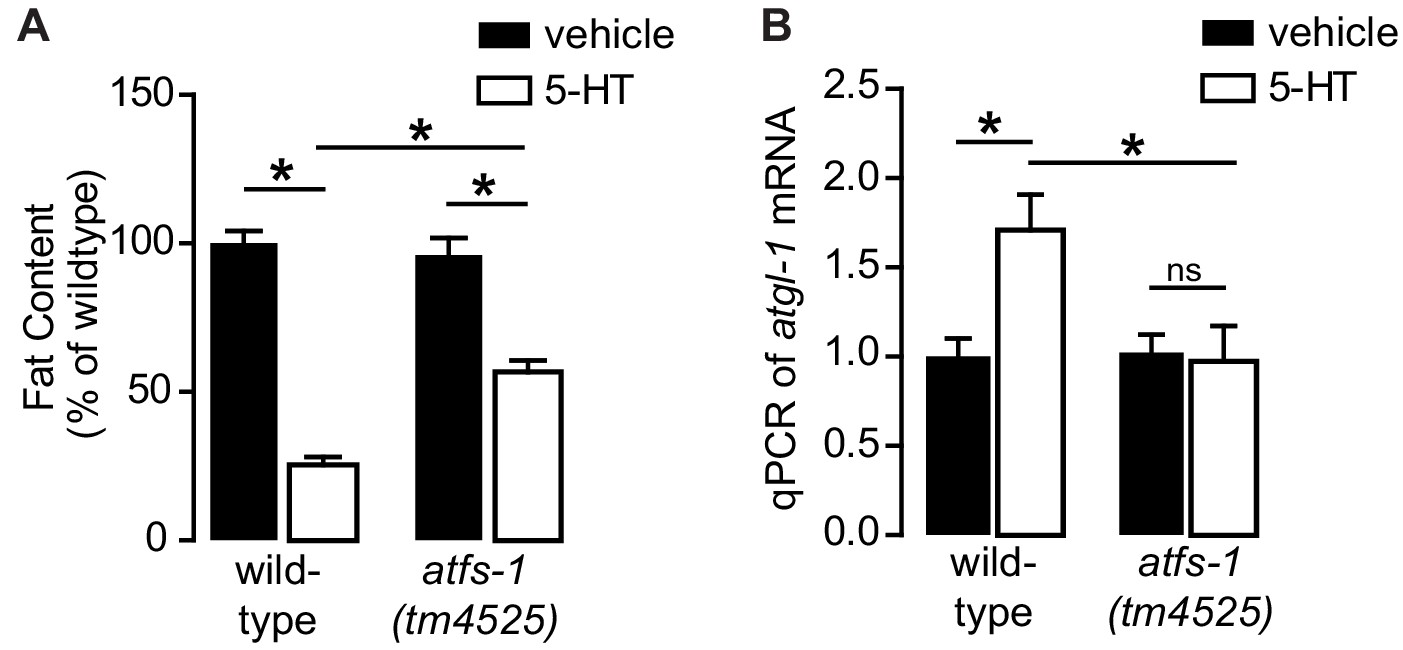
5-HT drives fat metabolism via ATFS-1.
(A) Fat content of wild-type and atfs-1(tm4525) animals treated with vehicle or 5-HT. Data are presented as percent of wild-type treated with vehicle ± sem (n = 10–16). *, p<0.05 by two-way ANOVA. (B) qPCR of atgl-1 mRNA in wild-type or atfs-1(tm4525) null animals treated with vehicle of r5-HT. Data are presented as fold change relative to wild-type animals treated with vehicle ± sem (n = 5). ns, not significant. *, p<0.05 as indicated and $, p<0.05 vs vector RNAi by two-way ANOVA.
Figure 4
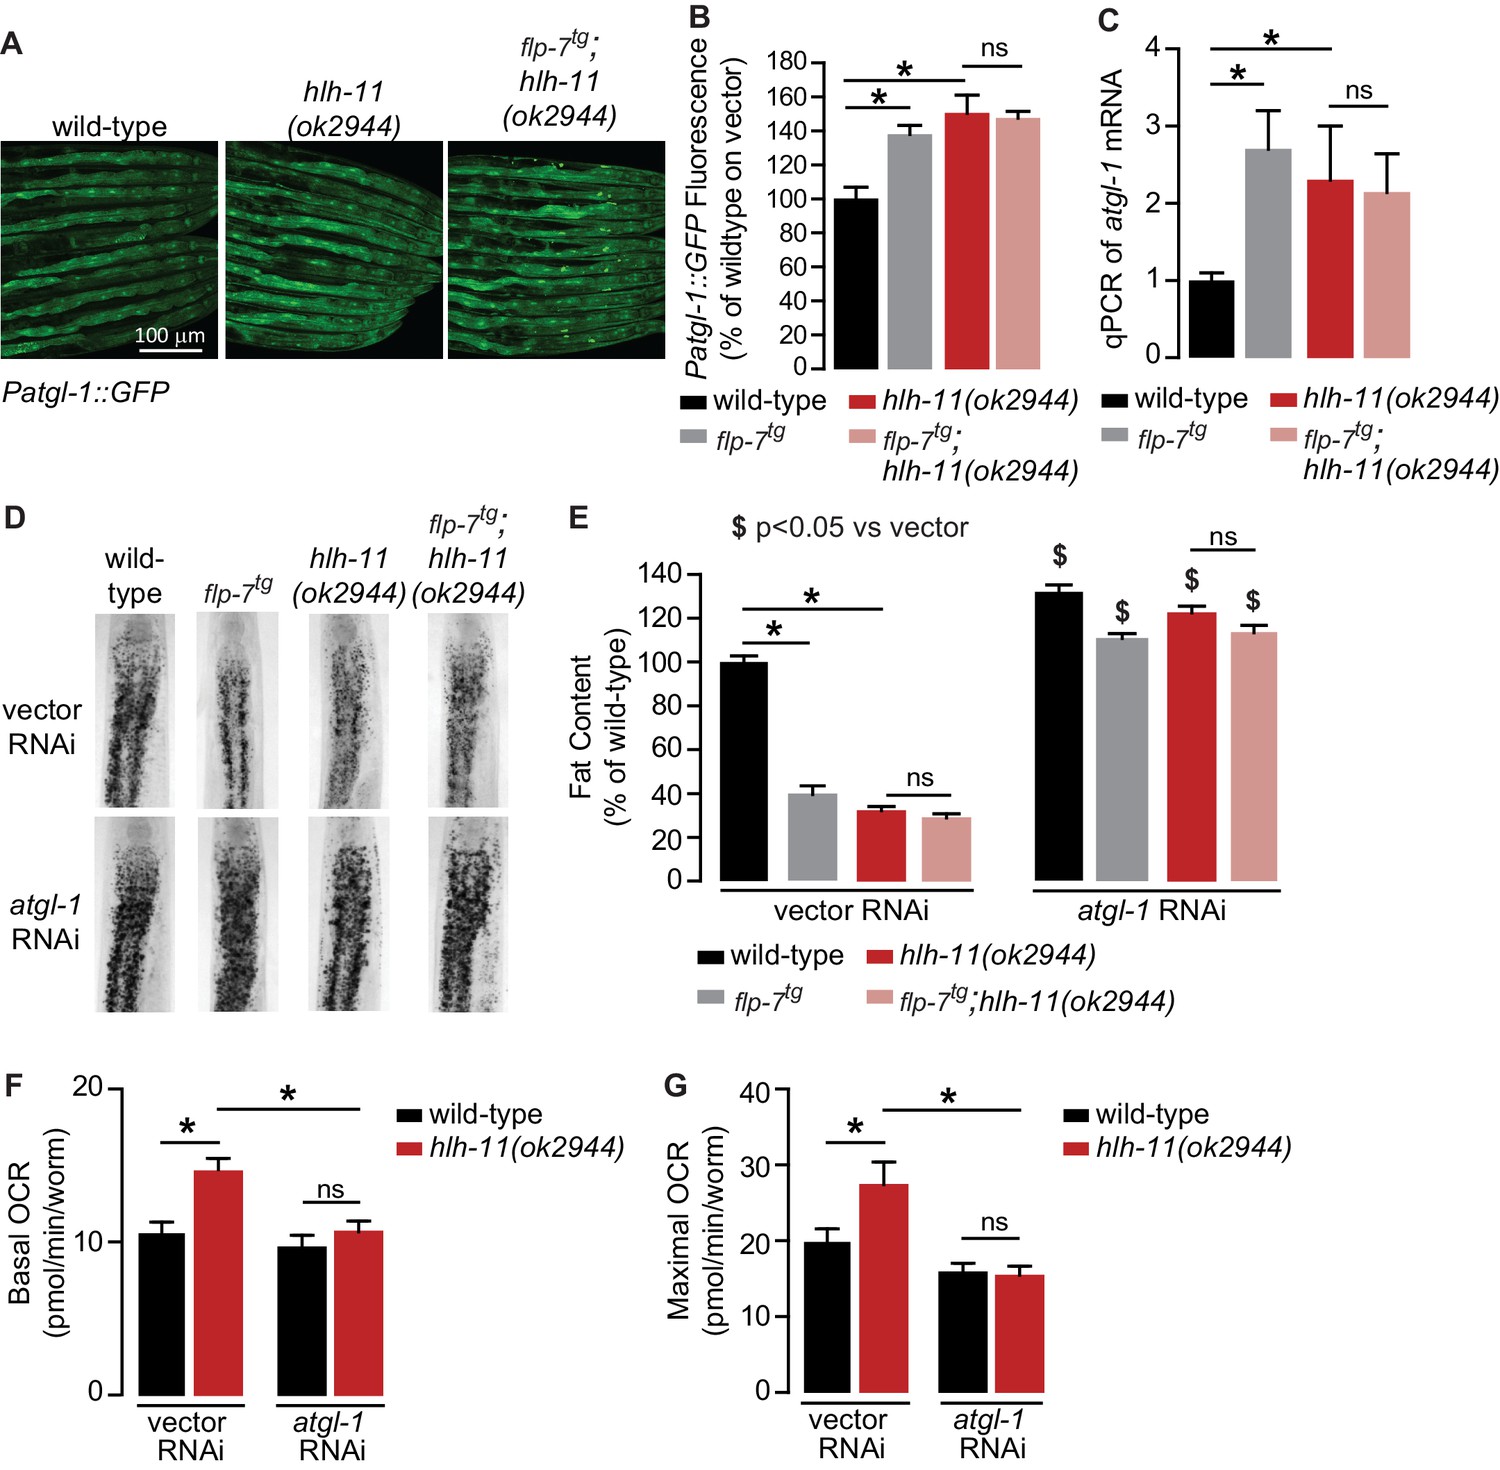
A genetic screen identifies the conserved transcription factor HLH-11 as a negative regulator of ATGL-1.
(A) Representative images of wild-type, flp-7tg, and flp-7tg;hlh-11(ok2944) animals bearing an integrated Patgl-1::GFP transgene. Scale bar, 100 µm. (B) The fluorescence intensity of atgl-1 expression was quantified and normalized to the area of each animal for each indicated genotype. Data are presented as percent of wild-type vector ± sem. (n = 26–30). ns, not significant. *, p<0.05 by one-way ANOVA. (C) qPCR of atgl-1 mRNA in the indicated genotypes. act-1 mRNA was used as a control. Data are presented as fold change relative to wild-type ± sem. (n = 4). ns, not significant. *, p<0.05 by one-way ANOVA. (D) Representative images of animals of the indicated genotypes on vector or atgl-1 RNAi, fixed and stained with Oil Red O to measure fat content. (E) Quantification of lipid droplets in the depicted conditions, presented as percent of wild-types treated with vehicle ± sem. (n = 18–20). ns, not significant. *p<0.05 vs wild-type and $ p<0.05 vs vector by two-way ANOVA. (F, G) OCR of wild-type or hlh-11(ok2944) animals on vector or atgl-1 RNAi were measured over time. Basal OCR (F) was quantified prior to addition of FCCP (50 µM) and maximal OCR (G) was determined following FCCP stimulation. Data are presented as pmol/min/worm ± sem. (n = 15 wells, each well containing approximately 10 worms). ns, not significant. *, p<0.05 by two-way ANOVA.
Figure 5
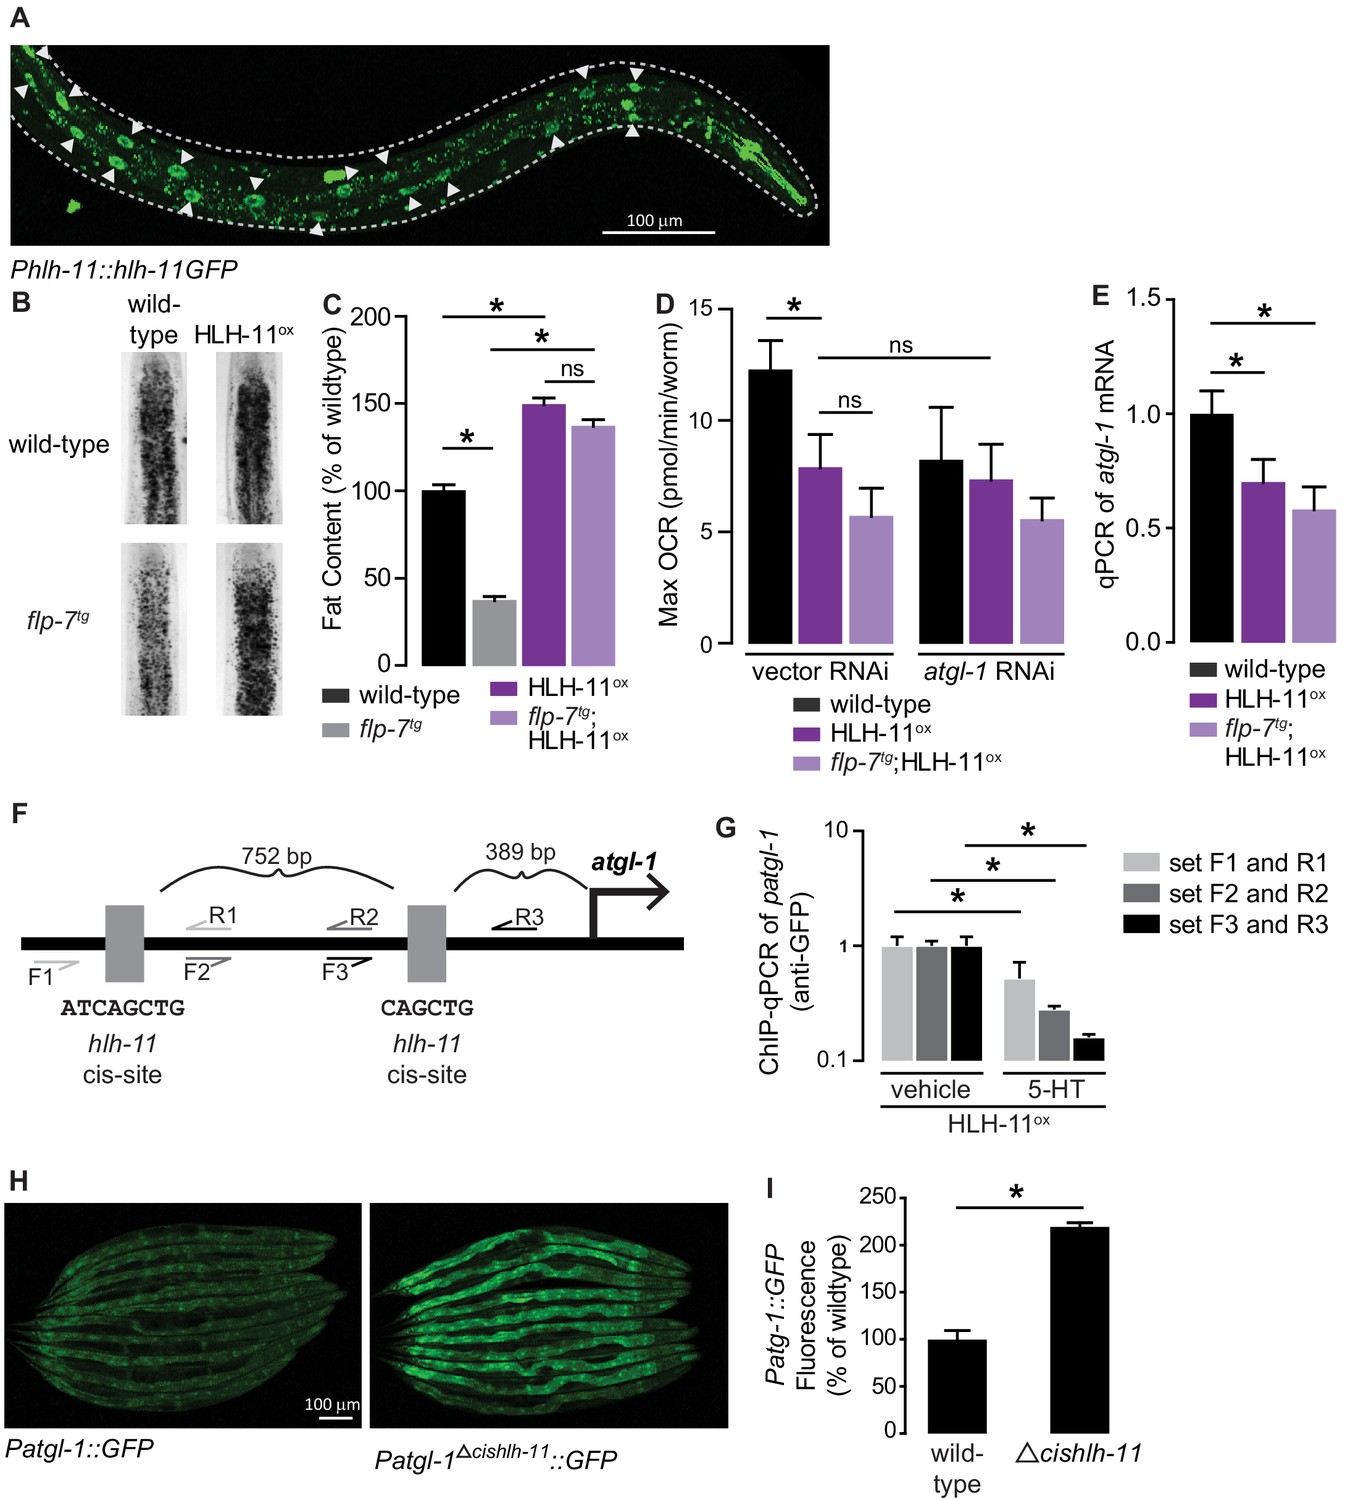
HLH-11 is a direct repressor of atgl-1 transcription.
(A) Representative image of an integrated transgenic animal expressing the HLH-11GFP fusion protein. GFP was clearly visible in the nucleus of intestinal cells (arrowheads). Scale bar, 100 µm. (B) Representative images of animals of the indicated genotypes, fixed and stained with Oil Red O to measure fat content. (C) Quantification of lipid droplets in the depicted conditions, presented as percent of wild-types ± sem. (n = 18–20). ns, not significant. (D) Maximal OCR of wild-type, HLH-11ox, and flp-7tg;HLH-11ox animals on vector or atgl-1 RNAi. Data are presented as pmol/min/worm ± sem. (n = 15 wells each containing approximately 10 worms). ns, not significant. *, p<0.05 vs wild-type and $, p<0.05 vs vector RNAi by one-way ANOVA. (E) qPCR of atgl-1 mRNA in wild-type, HLH-11ox, and flp-7tg;HLH-11ox. act-1 mRNA was used as a control. Data presented as fold change relative to wild-type ± sem. (n = 4–6). ns, not significant. *, p<0.05 by one-way ANOVA. (F) Schematic of the promoter region of atgl-1. There are two hlh-11 cis-sites (grey): one is 389 bp upstream of the atgl-1 transcription start site and the second binding site is another 752 bp upstream. The exact HLH-11 predicted binding sequence is listed for each site. For ChIP-qPCR, three primer sets were designed. Set #1 (light grey) flanks the distal HLH-11 binding site, set #2 (dark grey) targets the region between the binding sites, and set #3 (black) flanks the proximal binding site relative to the transcriptional start site. (G) Animals bearing the extrachromosomal Phlh-11::hlh-11GFP transgene were treated with vehicle or 5-HT and subjected to ChIP-qPCR. Data are presented as fold change relative to vehicle. ChIP-qPCR was performed using three technical replicates, and the experiment was repeated three times. *, p<0.05 by Student’s t-test. (H) Representative images of transgenic animals bearing the Patgl-1::GFP (left panel) and those bearing the Patgl-1Δcishlh-11::GFP transgene (right panel), which lacks both HLH-11 binding domains. Scale bar, 100 µm. (I) The fluorescence intensity of atgl-1 expression was quantified, normalized to number of worms, and presented as percent of wild-type ± sem. (n = 23–26). *, p<0.05 by Student’s t-test.
Figure 6
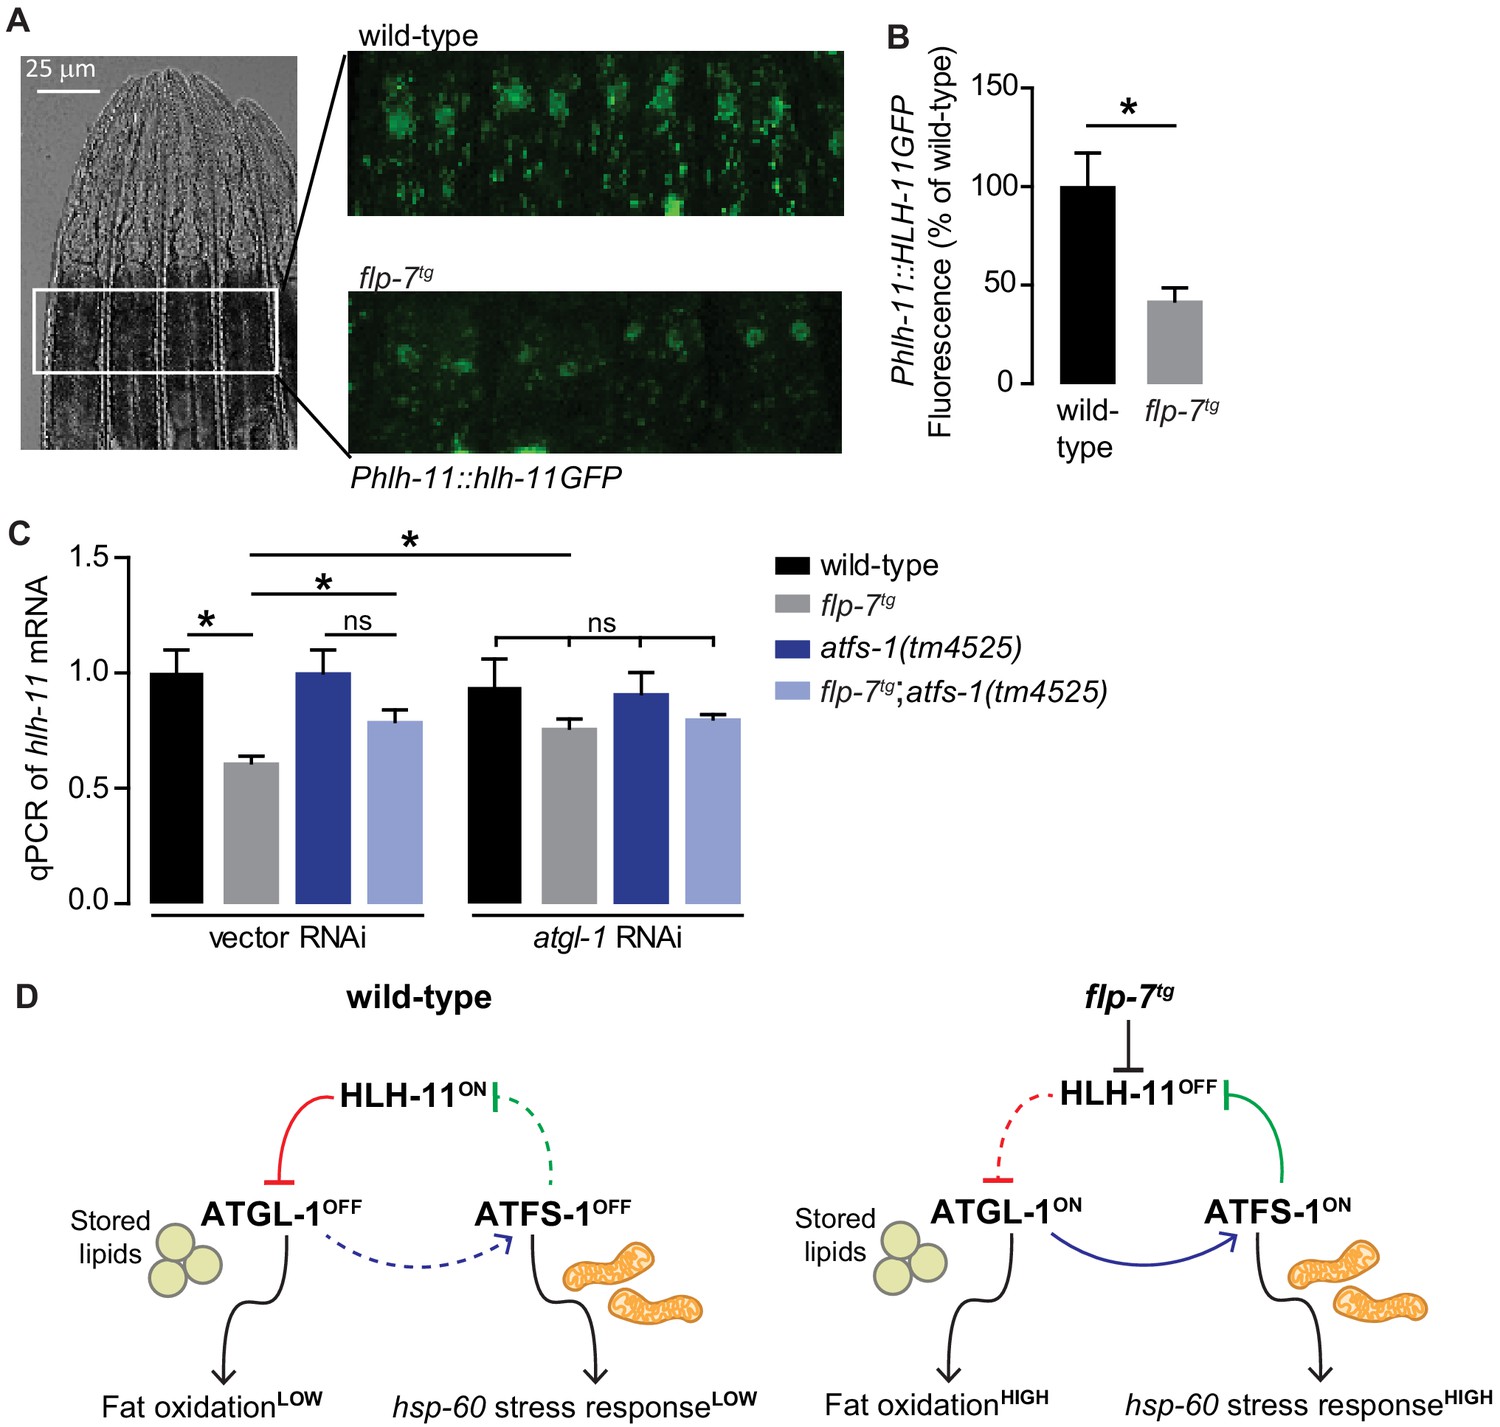
FLP-7 and ATFS-1 alter HLH-11 transcriptional status.
(A) Representative images of wild-type and flp-7tg animals bearing an integrated Phlh-11::hlh-11GFP transgene. DIC (left) and GFP (right) in the first two pairs of intestinal cells shown in representative animals. Scale bar, 25 µm. (B) The fluorescence intensity of hlh-11 expression was quantified and normalized to the area of the first two pairs of intestinal cells. Data are presented as percent of wild-type vector ± sem. (n = 26–30). *, p<0.05 by Student’s t-test. (C) qPCR of hlh-11 mRNA in wildtype and flp-7tg animals fed vector or atgl-1 RNAi. act-1 mRNA was used as a control. Data are presented as fold change relative to wild-type ± sem. (n = 4–6). ns, not significant. *, p<0.05 by two-way ANOVA. (D) Model for interaction between HLH-11, ATGL-1 and ATFS-1. In wild-type (left panel), HLH-11 is constitutively on, which represses ATGL-1 (red arrow) and keeps fat oxidation low. In this state, mitochondrial stress is not activated, hsp-60 levels are low and ATFS-1 is not induced, keeping HLH-11 levels high. The FLP-7 neuronal signal (right panel) represses HLH-11, which de-represses ATGL-1, triggering fat oxidation. In turn, this generates an ATFS-1-dependent mitochondrial stress response as observed by the hsp-60 induction (blue arrow). ATFS-1 represses HLH-11 (green arrow), providing a feedback cue to match fat oxidation with mitochondrial capacity.
Figure 7
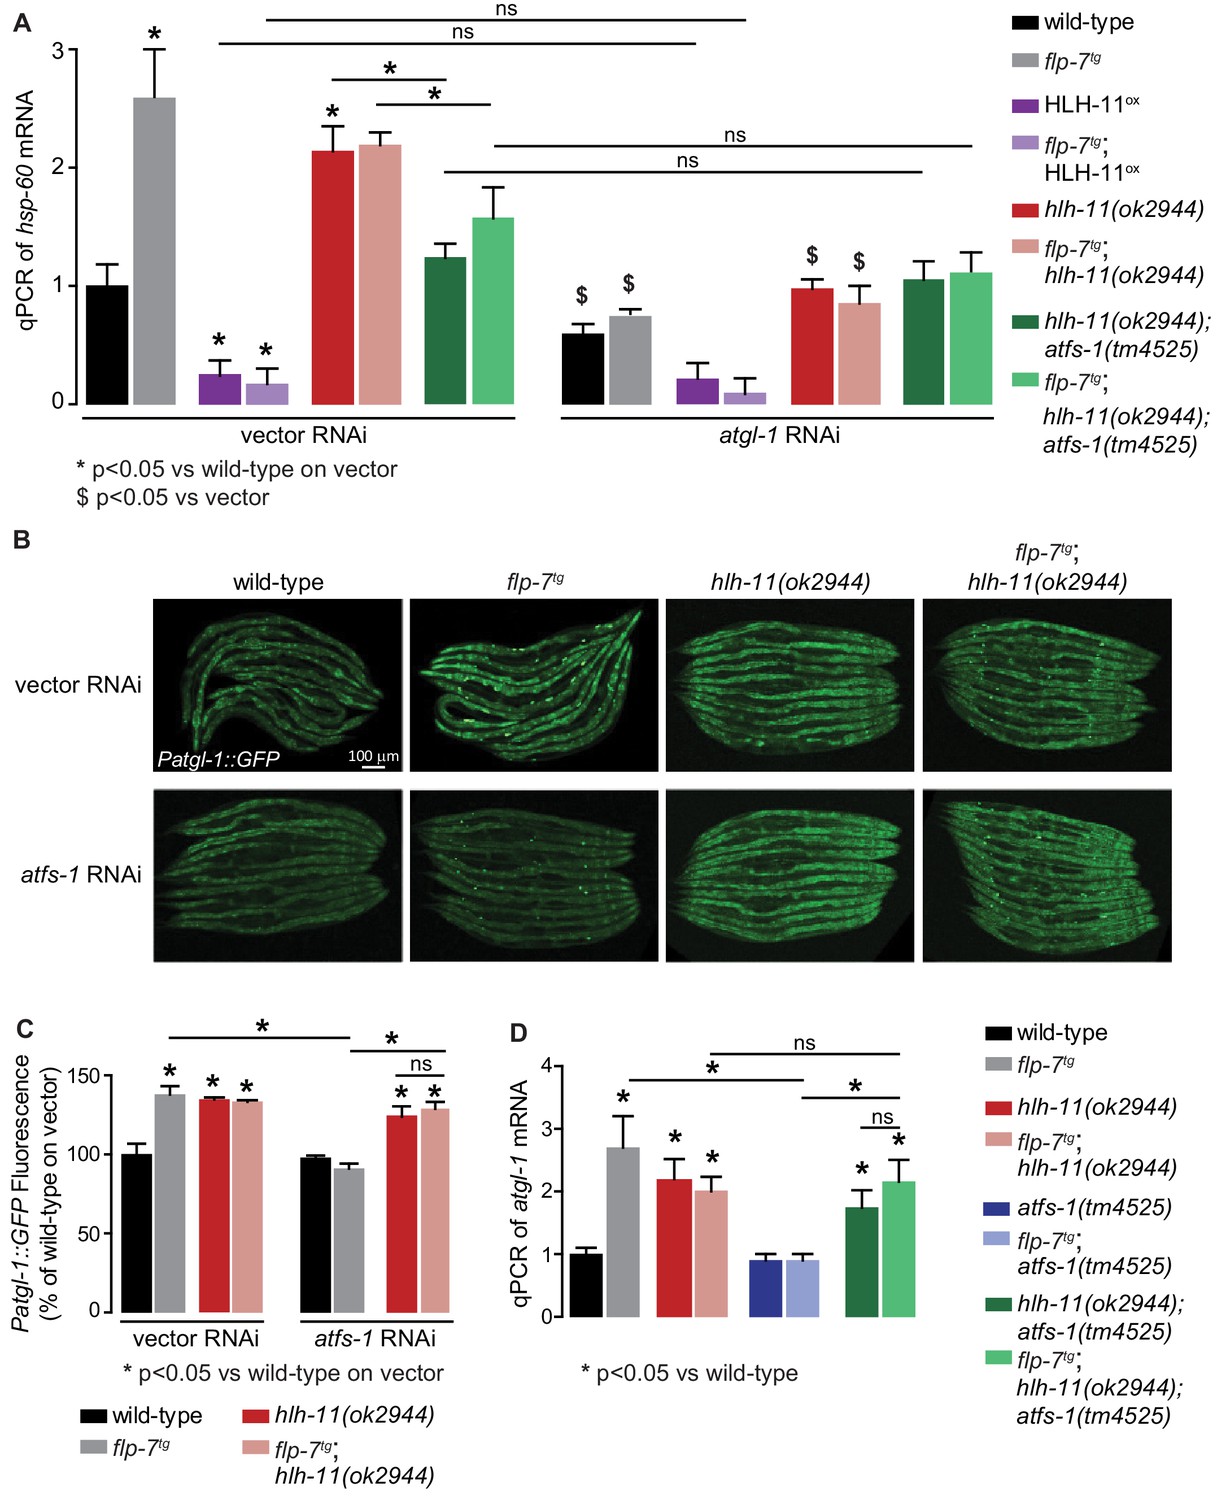
HLH-11-ATFS-1 interaction integrates HSP-60 mitochondrial stress response and ATGL-1 transcriptional status.
(A) qPCR of hsp-60 mRNA in groups indicated in the figure panel. Data are presented as fold change relative to wild-type vector ± sem. (n = 3–6). ns, not significant. *, p<0.05 vs wild-type on vector RNAi and $, p<0.05 vs vector RNAi by two-way ANOVA. (B) Representative images of animals bearing the integrated Patgl-1::GFP transgene. Animals with the indicated genotype were fed vector or atfs-1 RNAi. Scale bar, 100 µm. (C) The fluorescence intensity of atgl-1 expression was quantified and presented as percent of wild-type vector ± sem; groups as indicated in the figure panel. (n = 26–30). *p<0.05 vs wild-type on vector and $ p<0.05 vs vector by two-way ANOVA. (D) qPCR of atgl-1 mRNA in the genotypes indicated on the right. Data presented as fold change relative to wild-type ± sem. (n = 3–6). *, p<0.05 vs wild-type by one-way ANOVA.
Figure 8 with 1 supplement
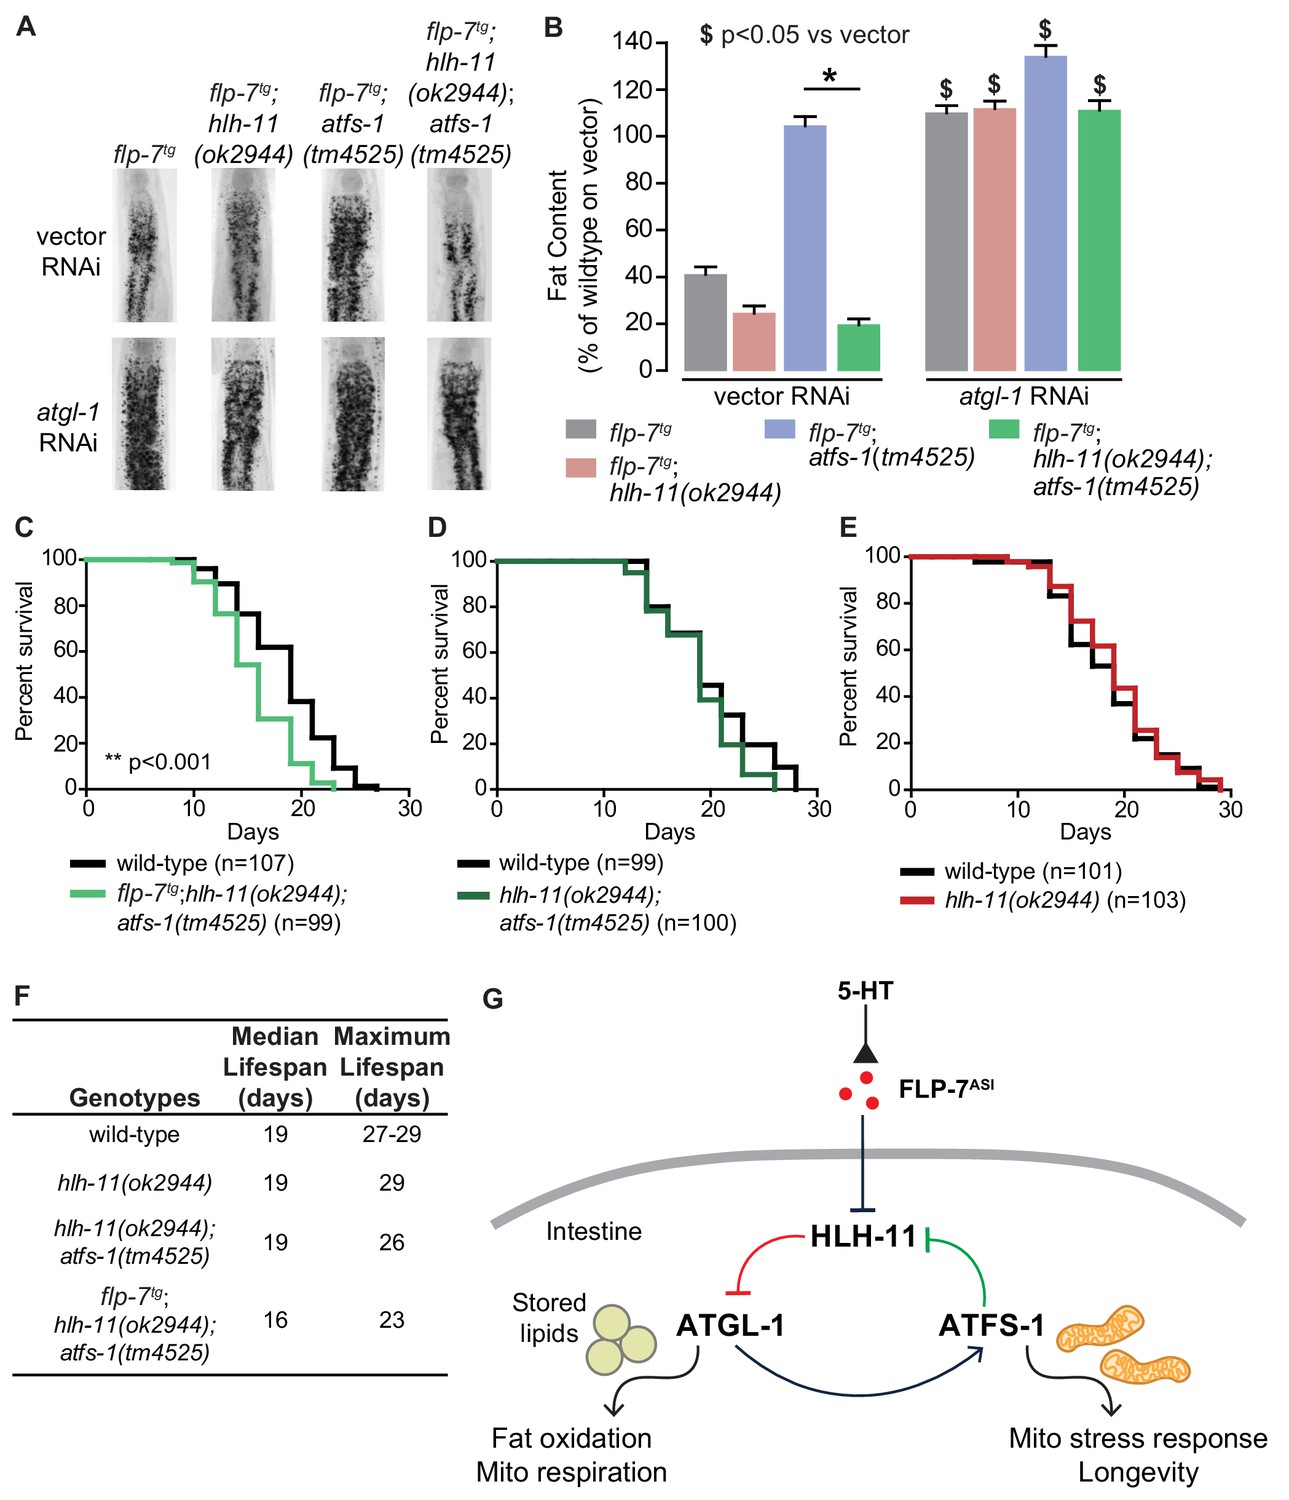
HLH-11 and ATFS-1 balance the tradeoff between sustained fat oxidation and longevity.
(A) Representative images of animals of the indicated genotypes on vector or atgl-1 RNAi, fixed and stained with Oil Red O to measure fat content. (B) Quantification of lipid droplets in the depicted conditions, presented as percent of wild-type vector ± sem. (n = 18–20). ns, not significant. *, p<0.05 vs wild-type and $, p<0.05 vs vector by two-way ANOVA. (C–E) Lifespan for each indicated genotype was assessed by counting the number of alive and dead animals every other day until all animals had died. Data are plotted as the percentage of animals that survived on any given day relative to the number of animals alive on Day 1 of adulthood. Number of animals used for each genotype are indicated in the figure panels. **p<0.001 by Log-Rank Test. (F) Table of median and maximum lifespans for each genotype. Data are presented in days. (G) Model depicting a feedback loop that coordinates fat oxidation with longevity. 5-HT-mediated FLP-7 secretion from neurons stimulates lipid metabolism in the intestine via repression of the conserved transcription factor HLH-11, which de-represses ATGL-1. Increased ATGL-1-dependent fat oxidation and mitochondrial respiration activates a mitochondrial stress response, as seen by induction of hsp-60. Simultaneously, the mito-nuclear transcription factor, ATFS-1, represses HLH-11 providing a feedback cue to sustain and augment HLH-11-dependent fat oxidation. On the one hand, overexpression of HLH-11 or absence of ATGL-1 blocks fat oxidation. On the other hand, during high fat oxidation and mitochondrial respiration, loss of the ATFS-1-HLH-11 feedback signal attenuates lifespan. Thus, the feedback signaling loop orchestrates the balance between sustained fat oxidation, mitochondrial stress, and lifespan.
Figure 8—figure supplement 1
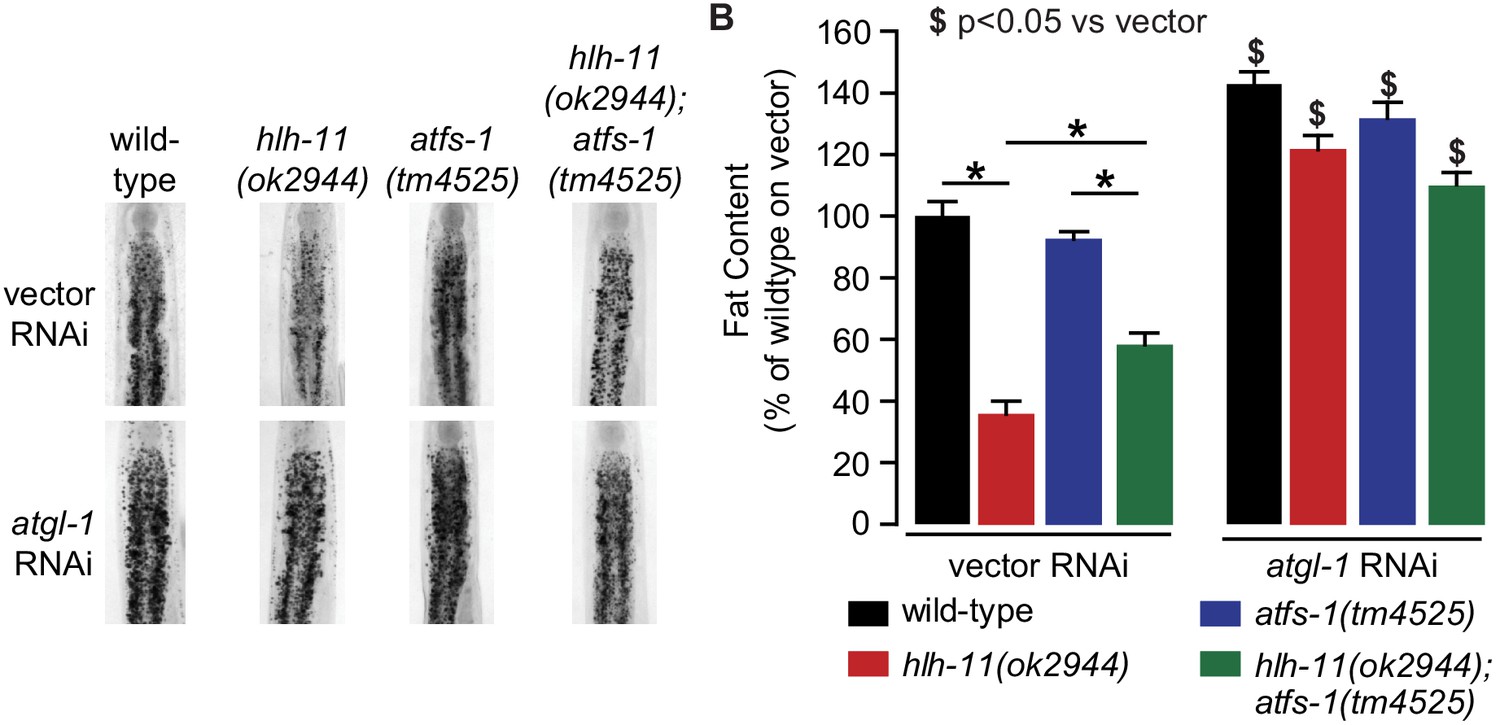
Reduced fat content with loss of both hlh-11 and atfs-1.
(A) Fat content was measure in wild-type, hlh-11, atfs-1, and hlh-11;atfs-1 null animals fed vector or atgl-1 RNAi. Representative images are shown. (B) Fat was quantified and data are presented as percent of wild-type animals fed vector RNAi ± sem (n = 6–12). *, p<0.05 as indicated and $, p<0.05 versus vector RNAi by two-way ANOVA.
Tables
Key resources table
| Reagent type (species) or resource | Designation | Source or reference | Identifiers | Additional information |
|---|---|---|---|---|
| Strain, strain background (C. elegans) | N2;Pdaf-7::flp-mCherry; Punc-122::GFP | This paper | SSR1164 | Integrated. Backcrossed 6X. See Methods section “Cloning and transgenic strain construction” |
| Strain, strain background (C. elegans) | N2;Phsp-60::GFP | Nargund et al., 2012 | Integrated. | |
| Strain, strain background (C. elegans) | N2;Pdaf-7::flp-mCherry; Punc-122:: GFP;Phsp-60::GFP | This paper | SSR1488 | Integrated. See Methods section “Cloning and transgenic strain construction” |
| Strain, strain background (C. elegans) | atfs-1(tm4525)V | Nargund et al., 2012 | ||
| Strain, strain background (C. elegans) | atfs-1(tm4525);Pdaf-7::flp-7mCherry | This paper | SSR1481 | Integrated. See Methods section “Cloning and transgenic strain construction” |
| Strain, strain background (C. elegans) | atfs-1(tm4525); Phsp-60::GFP | Nargund et al., 2012 | Integrated. Backcrossed 1X. | |
| Strain, strain background (C. elegans) | atfs-1(tm4525); Pdaf-7::flp-7mCherry;Punc-122::GFP; Phsp-60::GFP | This paper | SSR1571 | Integrated. Backcrossed 1X. See Methods section “Cloning and transgenic strain construction” |
| Strain, strain background (C. elegans) | N2;Patgl-1::GFP | This paper | SSR1564 | Integrated. Backcrossed 7X. See Methods section “Cloning and transgenic strain construction” |
| Strain, strain background (C. elegans) | N2;Pdaf-7::flp-7mCherry;Punc-122::GFP;Patgl-1::GFP | This paper | SSR1503 | Integrated. Backcrossed 7X. Originated from N2;Pdaf-7::flp-7mCherry;Punc-122::GFP and N2;Patgl-1::GFP |
| Strain, strain background (C. elegans) | hlh-11(ok2944)III | This paper | SSR725 | Backcrossed 7X. See Methods section “Worm maintenance and strains” |
| Strain, strain background (C. elegans) | hlh-11(ok2944);Pdaf-7::flp-7mCherry;Punc-122::GFP | This paper | SSR1560 | Integrated. Originated from hlh-11(ok2944) and N2;Pdaf-7::flp-7mCherry;Punc-122::GFP |
| Strain, strain background (C. elegans) | hlh-11(ok2944);Patg-1::GFP | This paper | SSR1563 | Integrated. Backcrossed 7X. Originated from hlh-11(ok2944) and N2;Patg-1::GFP |
| Strain, strain background (C. elegans) | hlh-11(ok2944);Pdaf-7::flp-7mCherry;Punc-122::GFP; Patg- 1l::GFP | This paper | SSR1536 | Integrated. Backcrossed 7X. Originated from hlh- 11(ok2944); Pdaf-7::flp-mCherry; Punc-122::GFP and N2;Patg-1::GFP |
| Strain, strain background (C. elegans) | N2;Phlh-11::hlh-11GFP | This paper | SSR1530 | Integrated. Backcrossed 4X. See Methods section “Cloning and transgenic strain construction” |
| Strain, strain background (C. elegans) | N2;Pdaf-7::flp-7mCherry;Punc-122::GFP;Phlh-11::hlh- 11GFP | This paper | SSR1550 | Integrated. Backcrossed 5X. Originated from N2;Pdaf-7::flp-mCherry; Punc-122::GFP and N2;Phlh-11::hlh-11GFP |
| Strain, strain background (C. elegans) | N2;Patgl-1Δcishlh-11::GFP | This paper | SSR1567 | Extrachromosomal. See Methods section “Cloning and transgenic strain construction” |
| Strain, strain background (C. elegans) | hlh-11(ok2944);atfs-1(tm4525) | This paper | SSR1399 | Originated from hlh-11(ok2944) and atfs-1(tm4525) |
| Strain, strain background (C. elegans) | hlh-11(ok2944);atfs-1(tm4525);Pdaf-7::flp-7mCherry;Punc- 122::GFP | This paper | SSR1538 | Integrated. Originated from hlh-11(ok2944);atfs-1(tm4525) and N2;Pdaf-7::flp-7mCherry;Punc-122::GFP |
| Antibody | GFP-Trap coupled to magnetic agarose beads (Camelidae antibody) | Bulldog Bio | Cat# GTMA020 | ChIP (20 uL per 3 mg of protein) |
| Recombinant DNA reagent | Phlh-11::hlh-11GFP (plasmid) | This paper | pSS1222 | See Methods section “Cloning and transgenic strain construction” |
| Recombinant DNA reagent | Patgl-1::GFP (plasmid) | Noble et al., 2013 | pSS496 | |
| Recombinant DNA reagent | Patgl-1Δcishlh-11::GFP (plasmid) | This paper | pSS1245 | See Methods section “Cloning and transgenic strain construction” |
| Sequence-based reagent | Forward primer for cloning the promoter of hlh-11 | IDT | 5’-ggggacaactttgtatagaaaagttggagtgtggtgtgtttctcgtcag -3’ | |
| Sequence-based reagent | Reverse primer for cloning the promoter of hlh-11 | IDT | 5’-ggggactgcttttttgtacaaacttgtcattttctactattgatctacctg -3’ | |
| Sequence-based reagent | Forward primer for cloning the hlh-11 gene | IDT | 5’- ggggacaagtttgtacaaaaaagcaggcttggttcgttcggatag -3’ | |
| Sequence-based reagent | Reverse primer for cloning the hlh-11 gene | IDT | 5’- ggggaccactttgtacaagaaagctgggtaacggacgagcgatgtctg -3’ | |
| Sequence-based reagent | Forward primer to remove the upstream hlh-11 cis-site in the Patgl-1::GFP plasmid | IDT | 5’- gcactaactatttttttgttcgttcattttc -3’ | |
| Sequence-based reagent | Reverse primer to remove the upstream hlh-11 cis-site in the Patgl-1::GFP plasmid | IDT | 5’- cctcctgtctcggaacgc -3’ | |
| Sequence-based reagent | Forward primer to remove the downstream hlh-11 cis-site in the Patgl-1::GFP plasmid | IDT | 5’- aatgattacataaagtcacg -3’ | |
| Sequence-based reagent | Reverse primer to remove the downstream hlh-11 cis-site in the Patgl-1::GFP plasmid | IDT | 5’- atcttgctatgaatgtacc -3’ | |
| Sequence-based reagent | qPCR forward primer for act-1 | IDT | 5’- gtatggagtccgccgga -3’ | |
| Sequence-based reagent | qPCR reverse primer for act-1 | IDT | 5’- cttcatggttgatggggcaa -3’ | |
| Sequence-based reagent | qPCR forward primer for atgl-1 | IDT | 5’- ctaccactgcaatgggaatct -3’ | |
| Sequence-based reagent | qPCR reverse primer for atgl-1 | IDT | 5’- gtgggctgaccatatccaaata -3’ | |
| Sequence-based reagent | qPCR forward primer for hlh-11 | IDT | 5’- gcgcagaagaagatcaaatcatc -3’ | |
| Sequence-based reagent | qPCR reverse primer for hlh-11 | IDT | 5’- ggtgccattcgtgcatttg -3’ | |
| Sequence-based reagent | qPCR forward primer for hsp-60 | IDT | 5’- cgagcttatcgagggaatgaa -3’ | |
| Sequence-based reagent | qPCR reverse primer for hsp-60 | IDT | 5’- gccttctcgtactcgactttag -3’ | |
| Sequence-based reagent | ChIP-qPCR forward primer set 1 for Patgl-1 | IDT | 5’- cgtggggtacggtacattca -3’ | |
| Sequence-based reagent | ChIP-qPCR reverse primer set 1 for Patgl-1 | IDT | 5’- ttggctagcgtgtagtgacg -3’ | |
| Sequence-based reagent | ChIP-qPCR forward primer set 2 for Patgl-1 | IDT | 5’- cgtcactacacgctagccaa -3’ | |
| Sequence-based reagent | ChIP-qPCR reverse primer set 2 for Patgl-1 | IDT | 5’- cagccaggtggtgatggaat -3’ | |
| Sequence-based reagent | ChIP-qPCR forward primer set 3 for Patgl-1 | IDT | 5’- gtgatggcgttccgagacag -3’ | |
| Sequence-based reagent | ChIP-qPCR reverse primer set 3 for Patgl-1 | IDT | 5’- ggtaccatactggtacaaacg -3’ | |
| Chemical compound, drug | Serotonin (5-HT) | Alfa Aesar | Cat. # B21263-03 | 5 mM |
| Software, algorithm | ImageJ | Schindelin et al., 2012 | https://imagej.net/Fiji | |
| Software, algorithm | GraphPad Prism | https://graphpad.com | Version 8.0.0 |
Additional files
-
Supplementary file 1
List of all p-values and 95% Confidence Interval (CI) of the difference between means for all Figures.
* indicates the 95% CI for the ratio of median survival.
- https://cdn.elifesciences.org/articles/58815/elife-58815-supp1-v1.docx
-
Transparent reporting form
- https://cdn.elifesciences.org/articles/58815/elife-58815-transrepform-v1.docx
Download links
A two-part list of links to download the article, or parts of the article, in various formats.
Downloads (link to download the article as PDF)
Open citations (links to open the citations from this article in various online reference manager services)
Cite this article (links to download the citations from this article in formats compatible with various reference manager tools)
A feedback loop governs the relationship between lipid metabolism and longevity
eLife 9:e58815.
https://doi.org/10.7554/eLife.58815


