Cryo-EM structures of human ZnT8 in both outward- and inward-facing conformations
- Howard Hughes Medical Institute and Department of Physiology, University of Texas Southwestern Medical Center, United States
- Department of Biophysics, University of Texas Southwestern Medical Center, United States
- Department of Cell Biology, University of Texas Southwestern Medical Center, United States
Figures
Figure 1 with 6 supplements
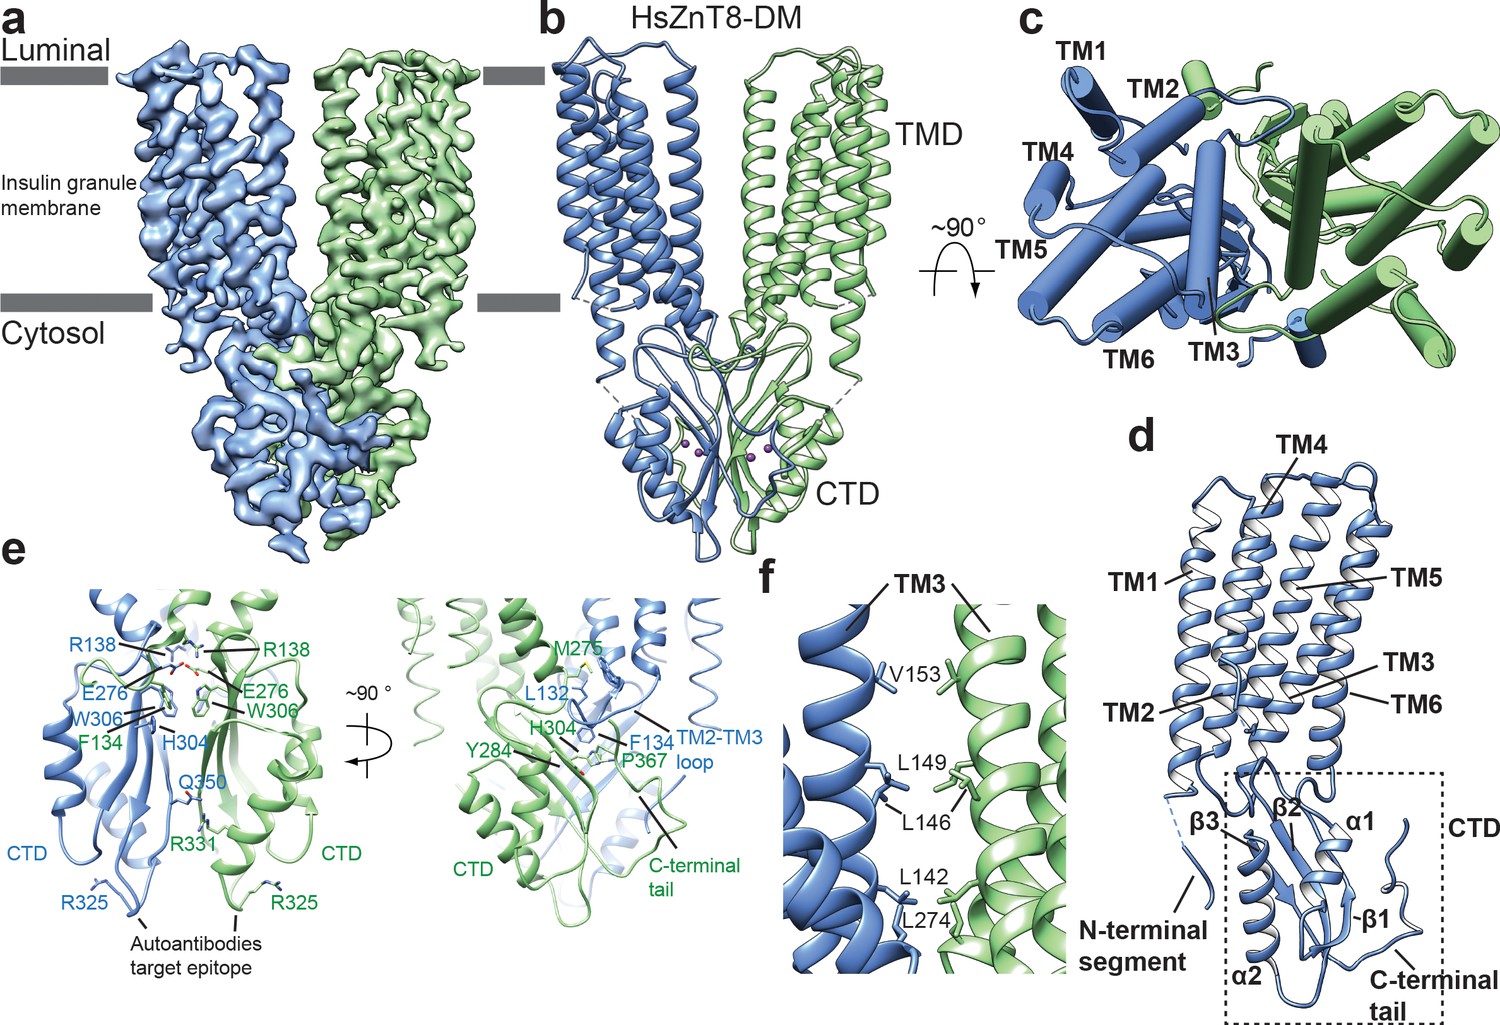
Overall structure of HsZnT8-DM in the outward-facing conformation.
(a) Cryo-EM reconstruction of HsZnT8-DM in the outward-facing conformation (contour level: 0.018, 4.8 σ). The two subunits are colored in blue and green, respectively. (b) The ribbon representation of the HsZnT8-DM dimer in the side view. (c) The cylinder representation of the HsZnT8-DM dimer in the top view with TMs from one subunit labeled. (d) The ribbon representation of a single HsZnT8-DM subunit with secondary structural elements labeled. (e) Zoomed-in views of the interface between the two adjacent CTDs in two orthogonal orientations. (f) Zoomed-in view of the interface between the two adjacent TMDs.
Figure 1—figure supplement 1
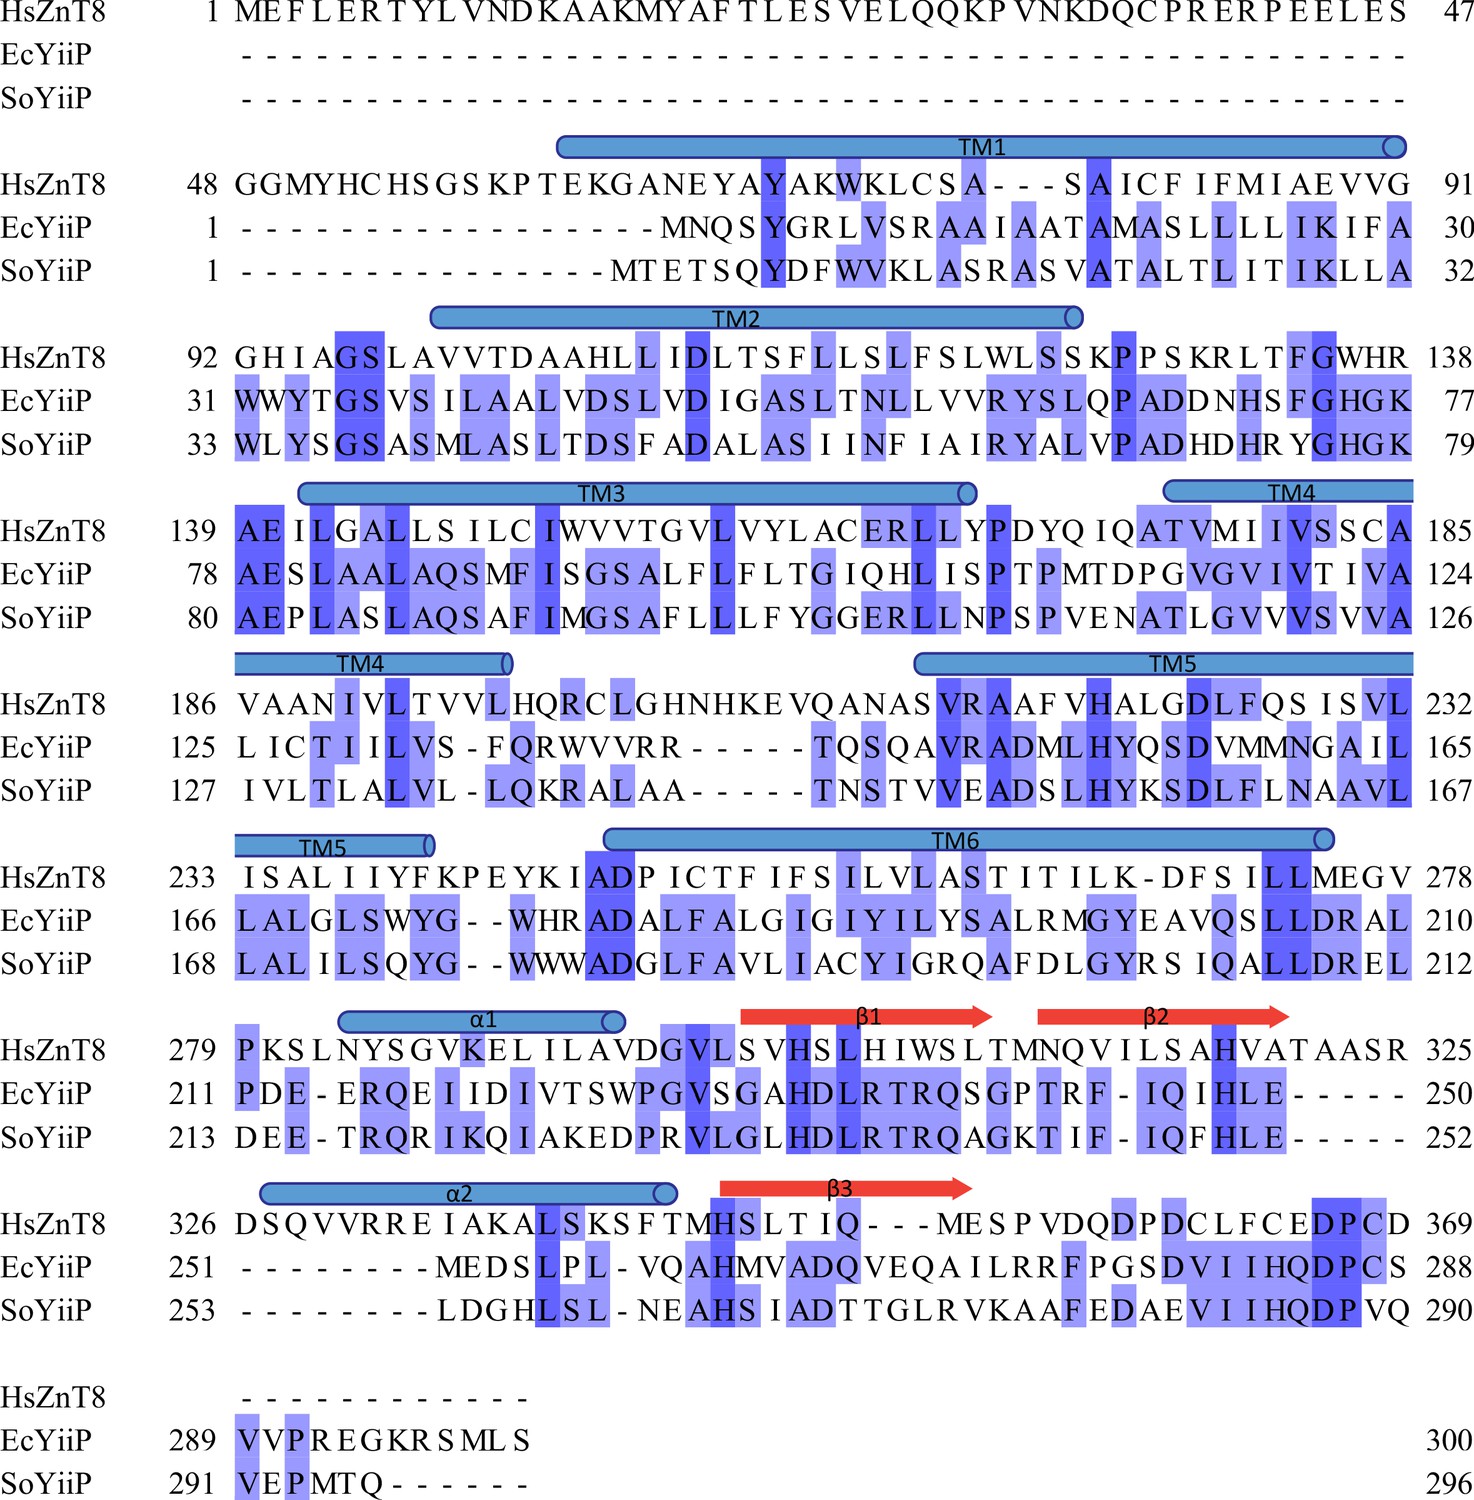
Sequence alignment of HsZnT8 (Q8IWU4), EcYiiP (P69380) and SoYiiP (Q8E919).
The protein accession codes for HsZnT8 and its bacterial orthologs are indicated.
Figure 1—figure supplement 2
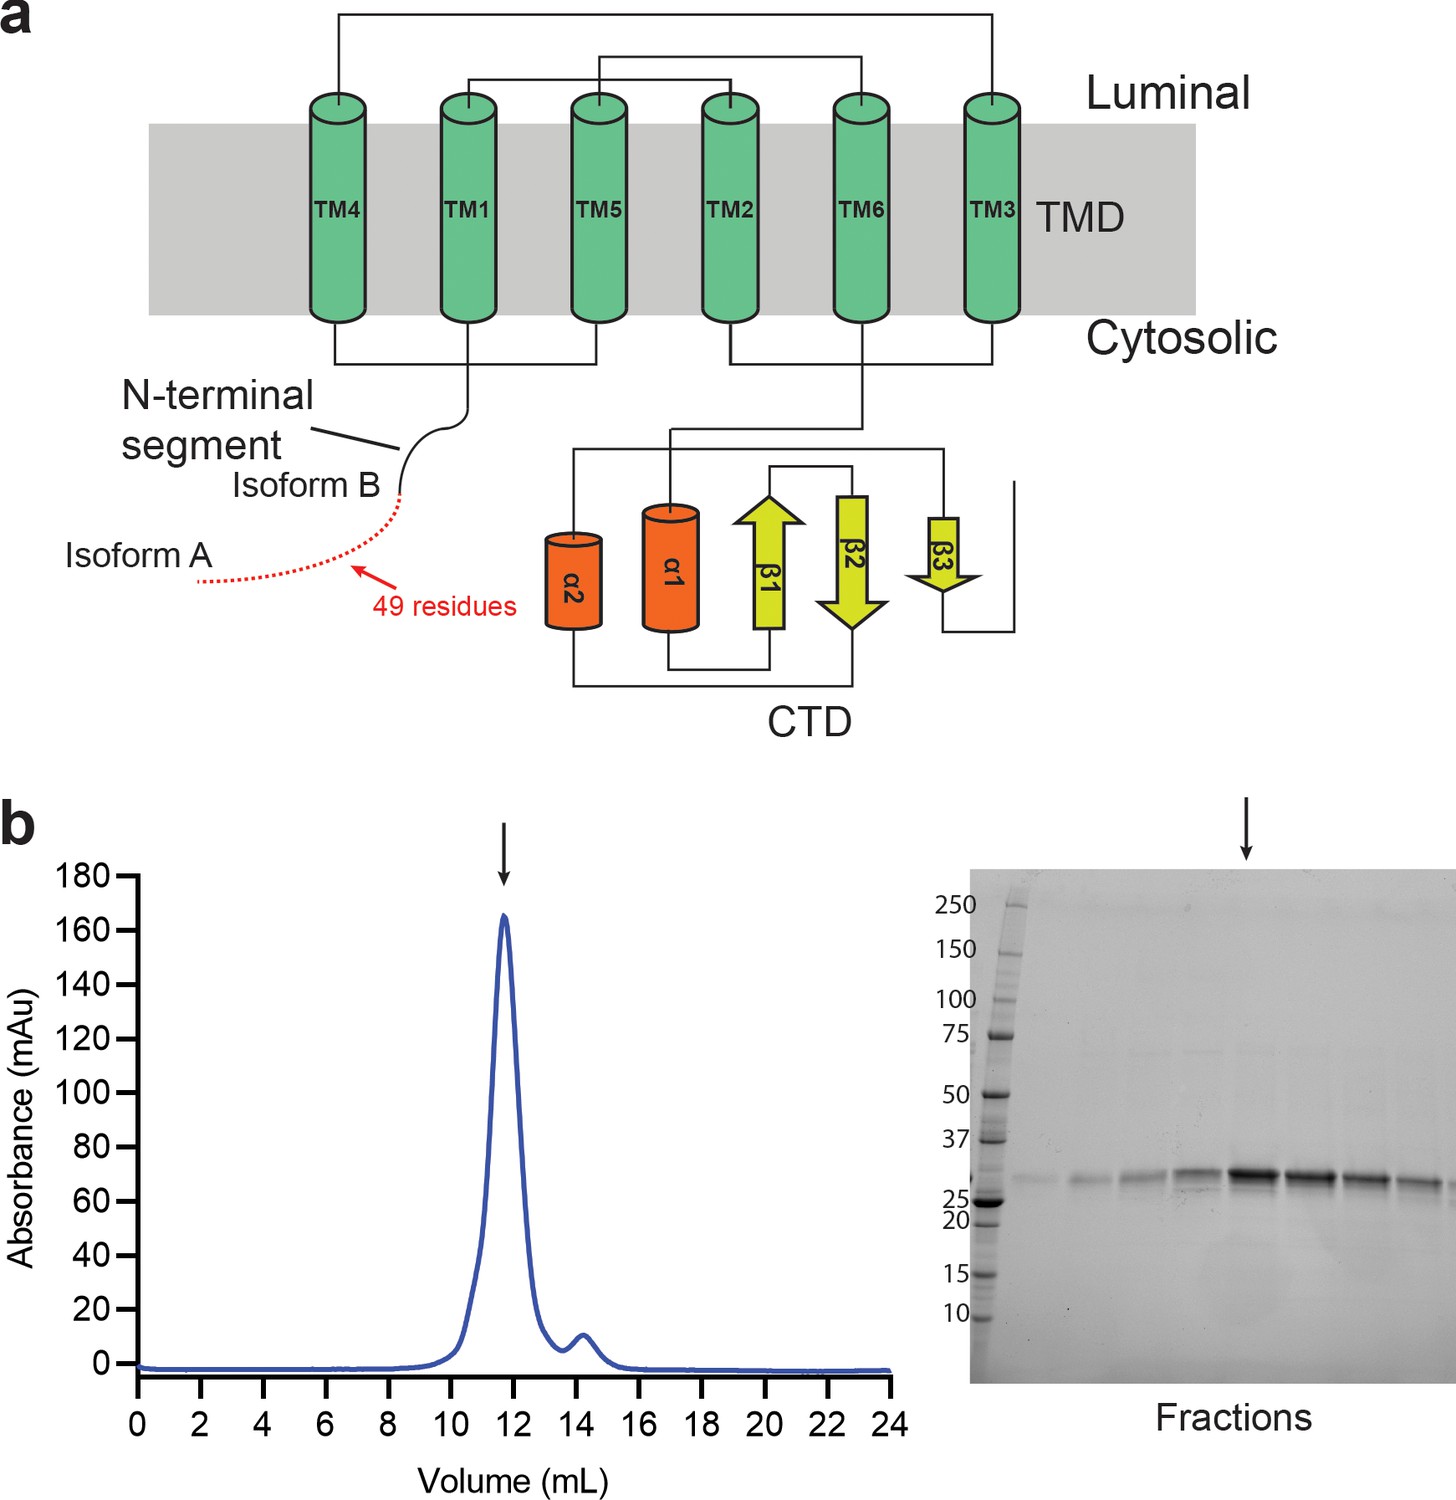
Purification of the HsZnT8.
(a) Topology and domain organization of the HsZnT8 subunit. The starting points of isoform A and B are labeled. (b) A representative size-exclusion chromatography of HsZnT8-DM (left) and the SDS–PAGE of the peak fractions (right, coomassie staining). Arrow indicates the peak fraction collected for structural determination.
Figure 1—figure supplement 3
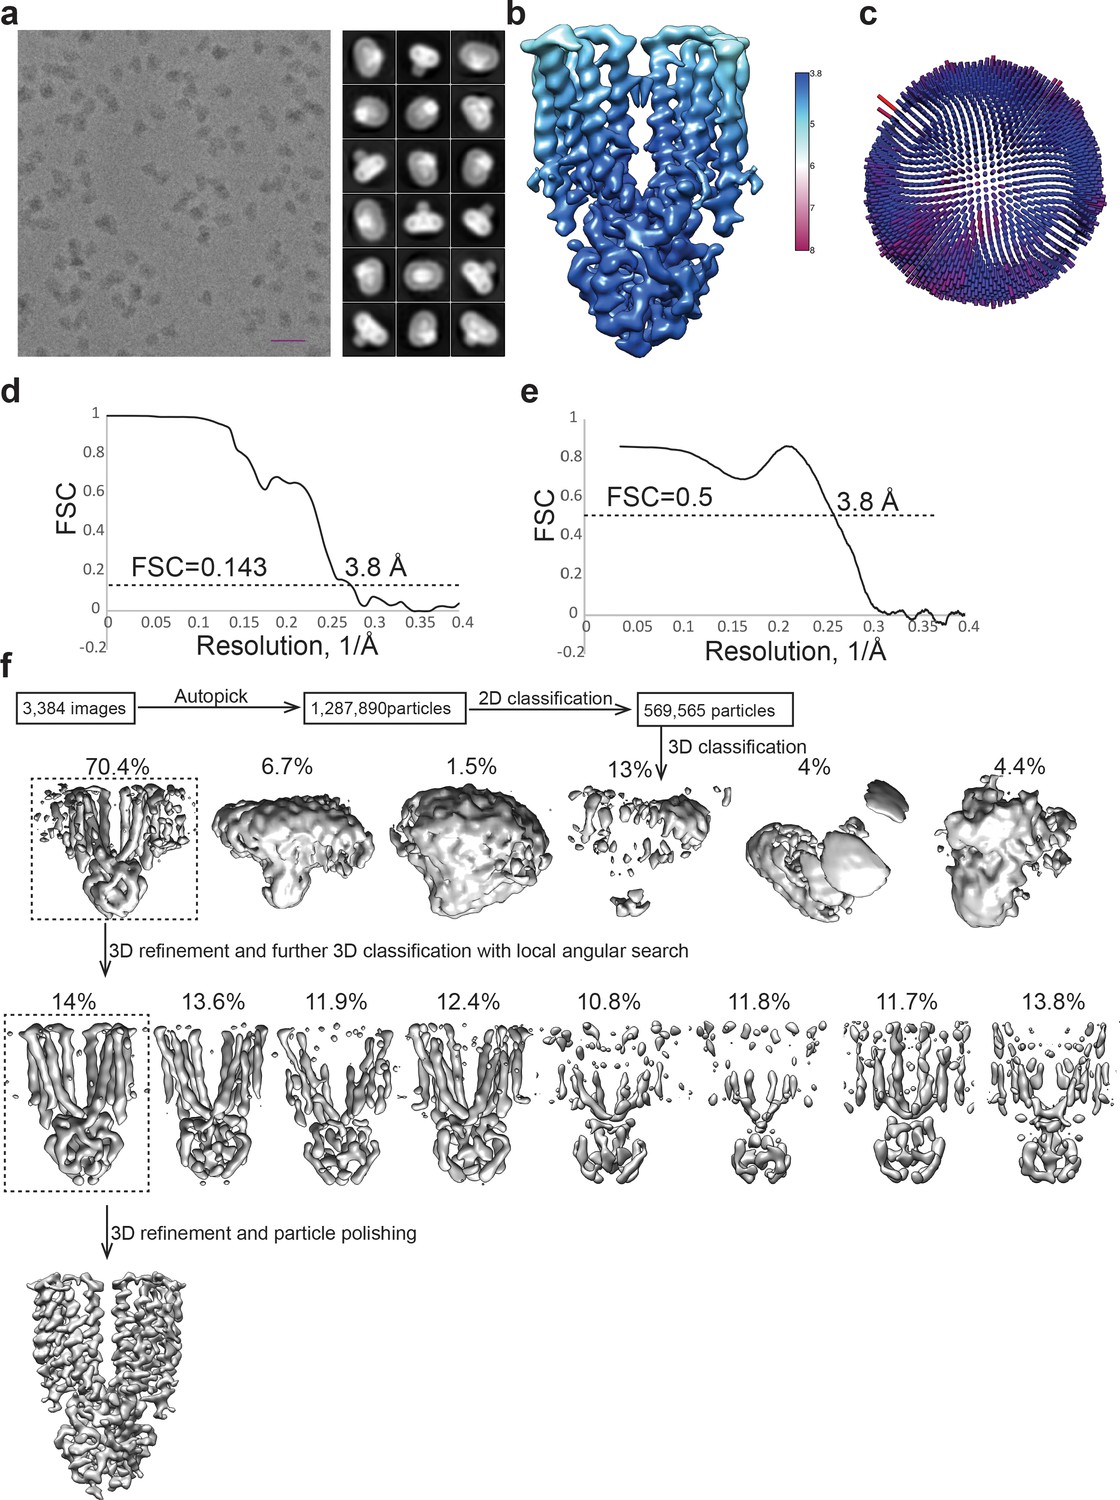
Cryo-EM analysis of the HsZnT8-DM in the absence of Zn2+.
(a) Representative electron micrograph and 2D class averages of the HsZnT8-DM. (Scale bar: 200 Å) (b) Cryo-EM map colored by local resolution. (c) Euler angle distribution of particles used in the final 3D reconstructions. (d) The gold-standard Fourier shell correlation curve for the cryo-EM map shown in Figure 1a. (e) FSC curve for the refined model versus the cryo-EM map. (f) Flowchart of cryo-EM data processing.
Figure 1—figure supplement 4
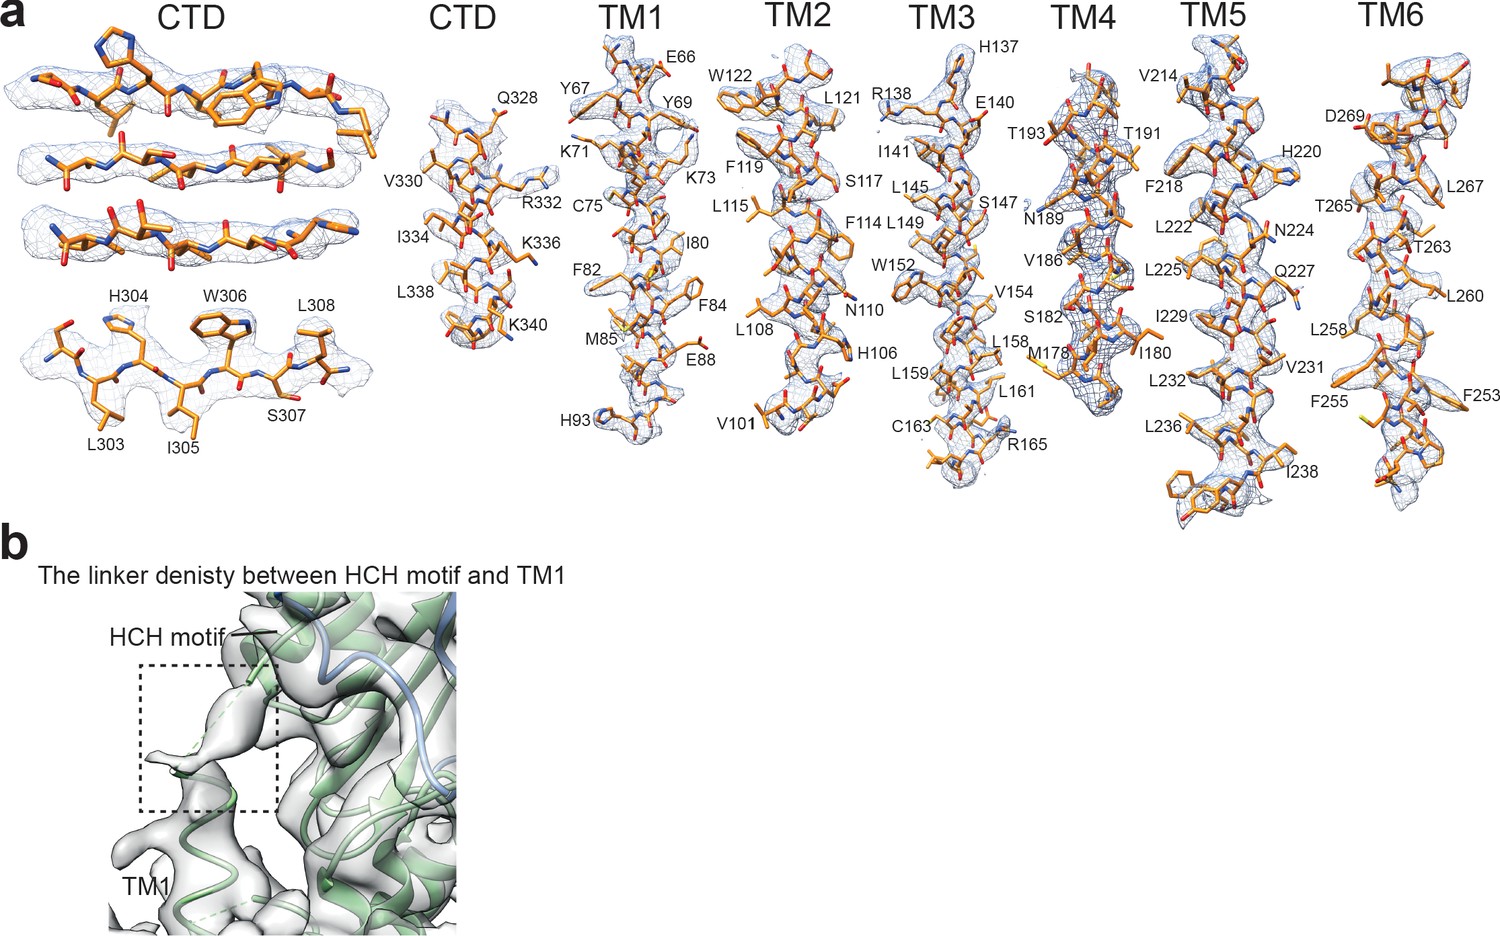
Cryo-EM density of HsZnT8-DM in the absence of Zn2+.
(a) Representative density maps of CTD domain and each TM of HsZnT8-DM. (b) The cryo-EM map of HsZnT8-DM low-pass filtered to 5 Å showing the clear density (indicated by a dash box) for the linker between HCH motif and the N-terminus of TM1.
Figure 1—figure supplement 5
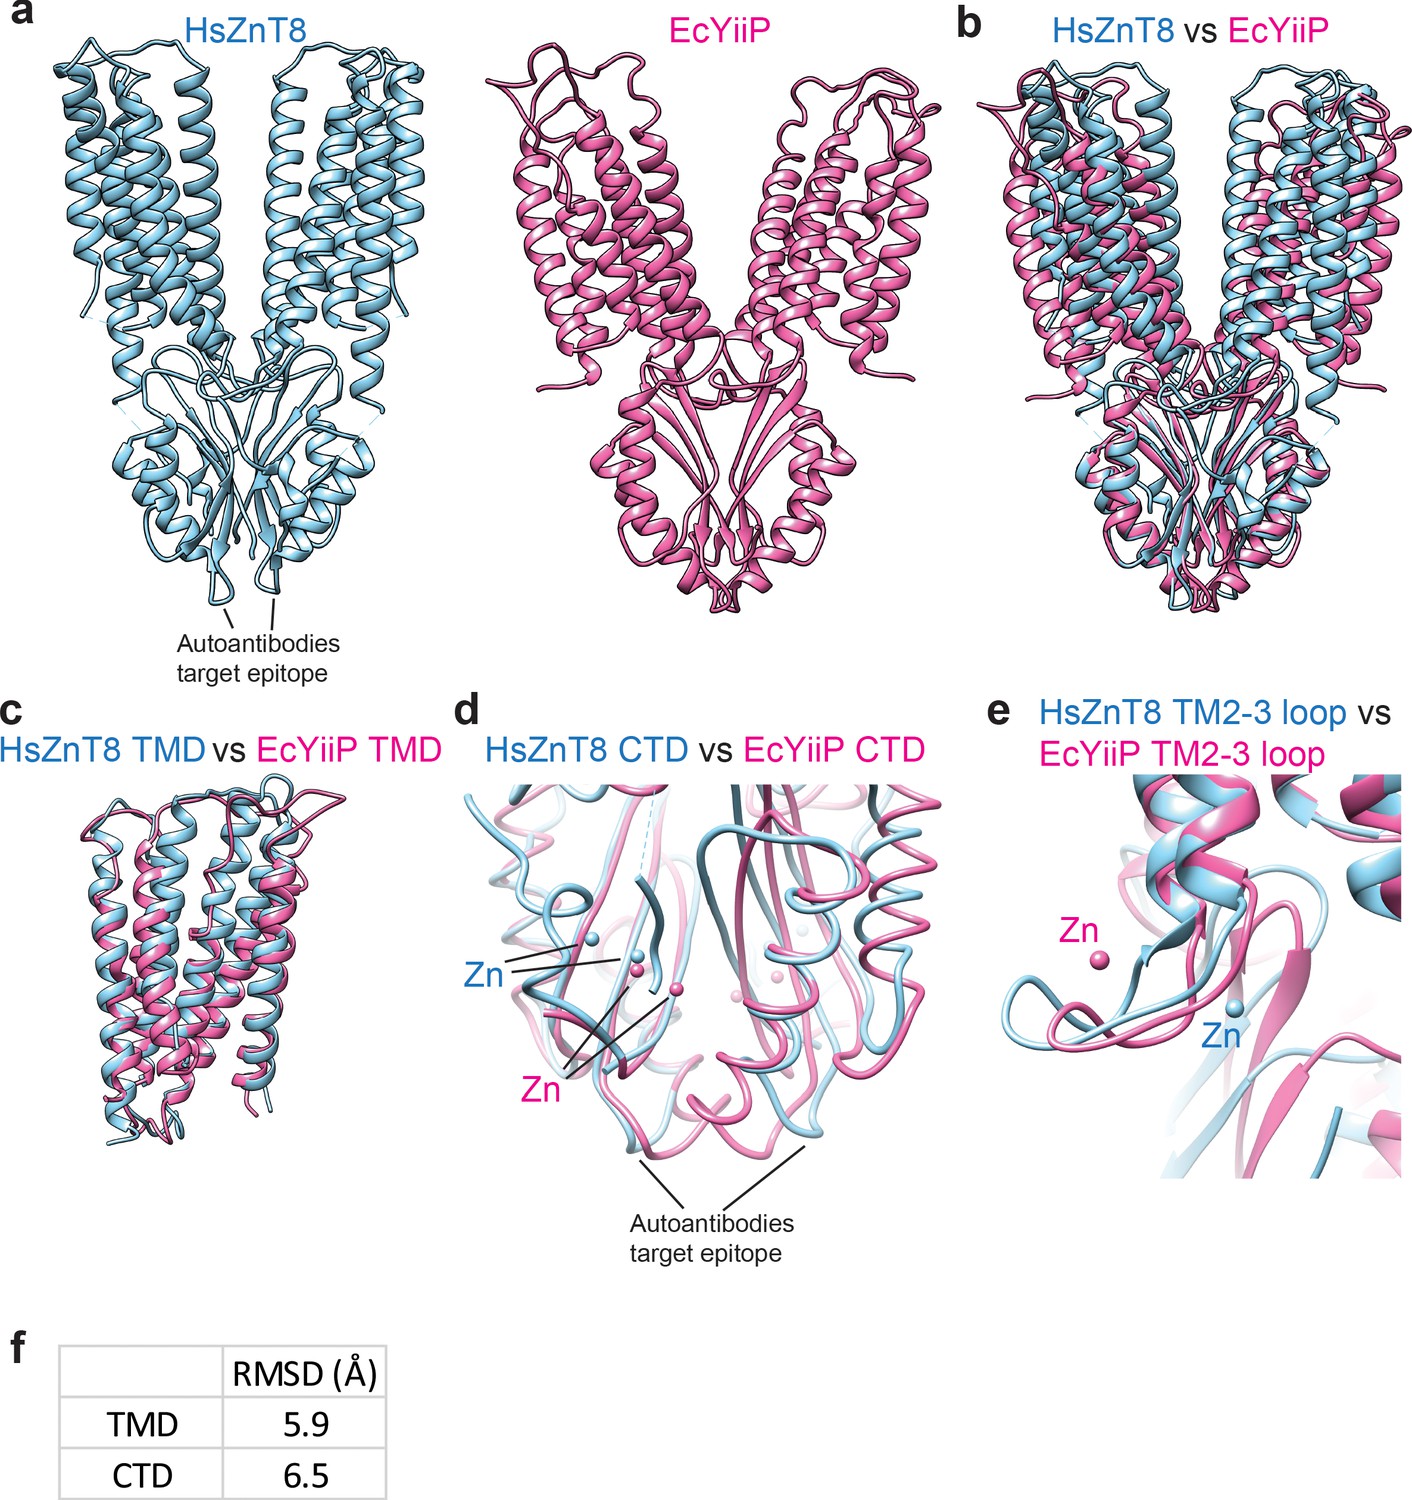
Structural comparison between HsZnT8 and EcYiiP in outward-facing conformation.
(a) Overall structures of HsZnT8 (blue) and EcYiiP (pink, PDB: 3H90) in outward-facing conformation. (b) Superposition of the dimeric HsZnT8 (blue) and EcYiiP (pink). (c) Superposition of the TMDs of HsZnT8 (blue) and EcYiiP (pink). (d) Superposition of the CTDs of HsZnT8 (blue) and EcYiiP (pink), showing the different locations of the Zn2+ binding sites in CTD. (e) Superposition of the TM2-3 loops of HsZnT8 (blue) and EcYiiP (pink), showing the different locations of the Zn2+ binding sites at the CTD/TMD interface. (f) RMSD value of TMD and CTD between HsZnT8 and EcYiiP in outward-facing conformation. RMSD was calculated based on only the position of C-α atom.
Figure 1—figure supplement 6
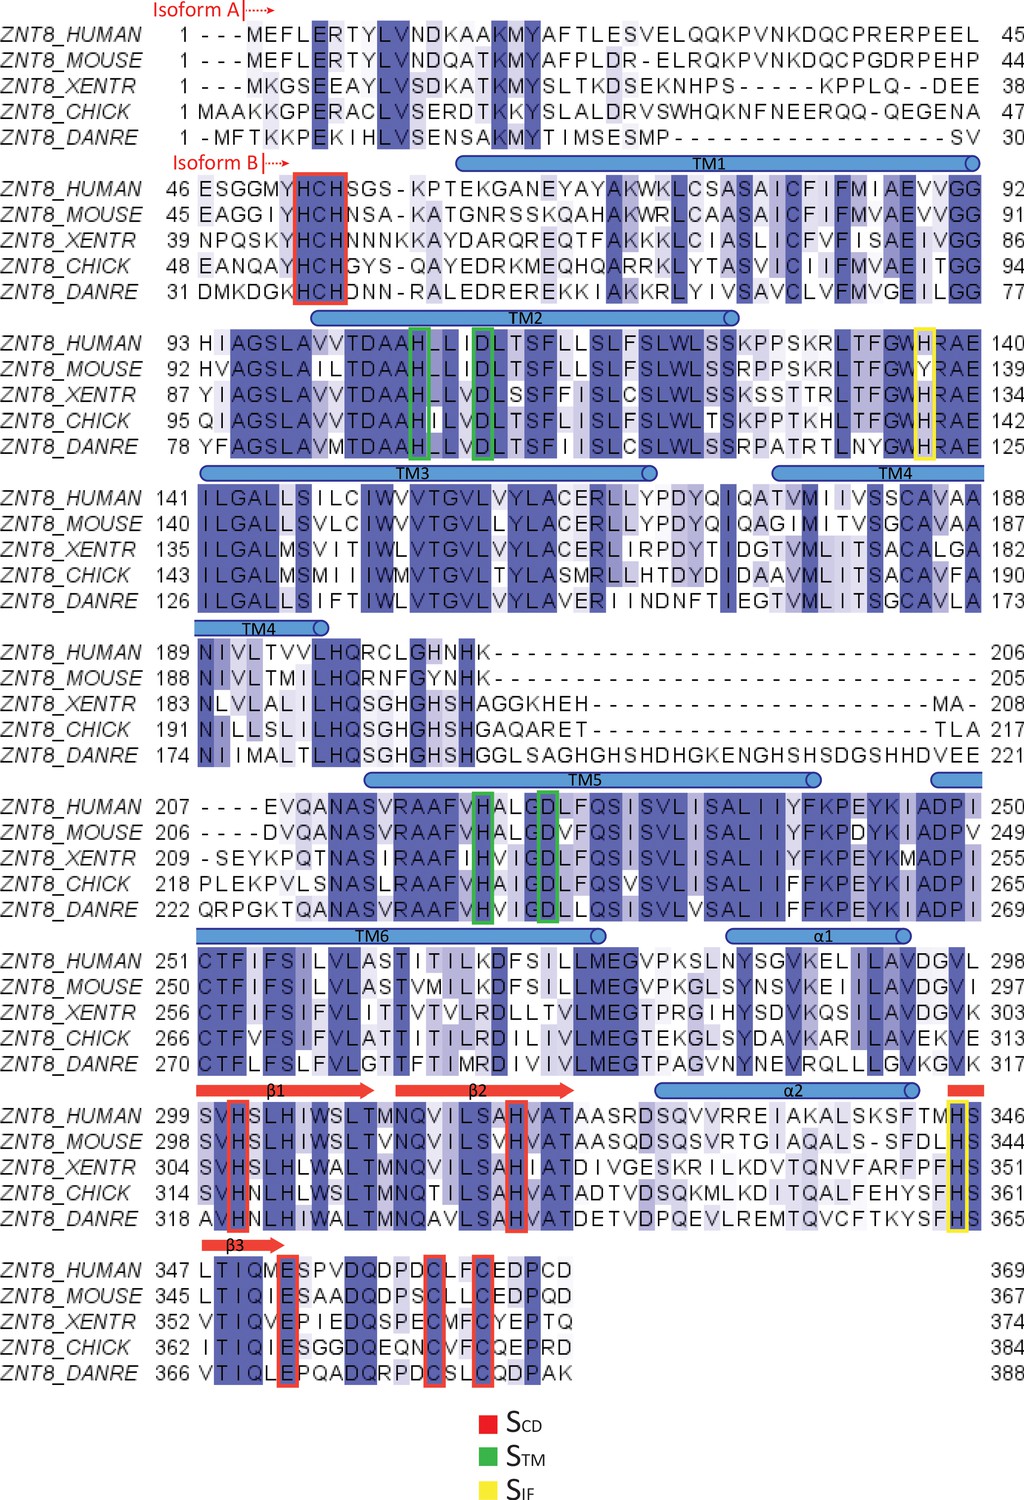
Sequence alignment of ZnT8 from human (Q8IWU4), mouse (Q8BGG0), western clawed frog (Q5XHB4), chicken (A0A1D5NY81) and zebrafish (A0A0R4IFM6).
The starting residues of isoform A and B are labeled. The Zn2+ binding sites residues are marked with boxes. The protein accession codes for different ZnT8 orthologs are indicated.
Figure 2 with 1 supplement
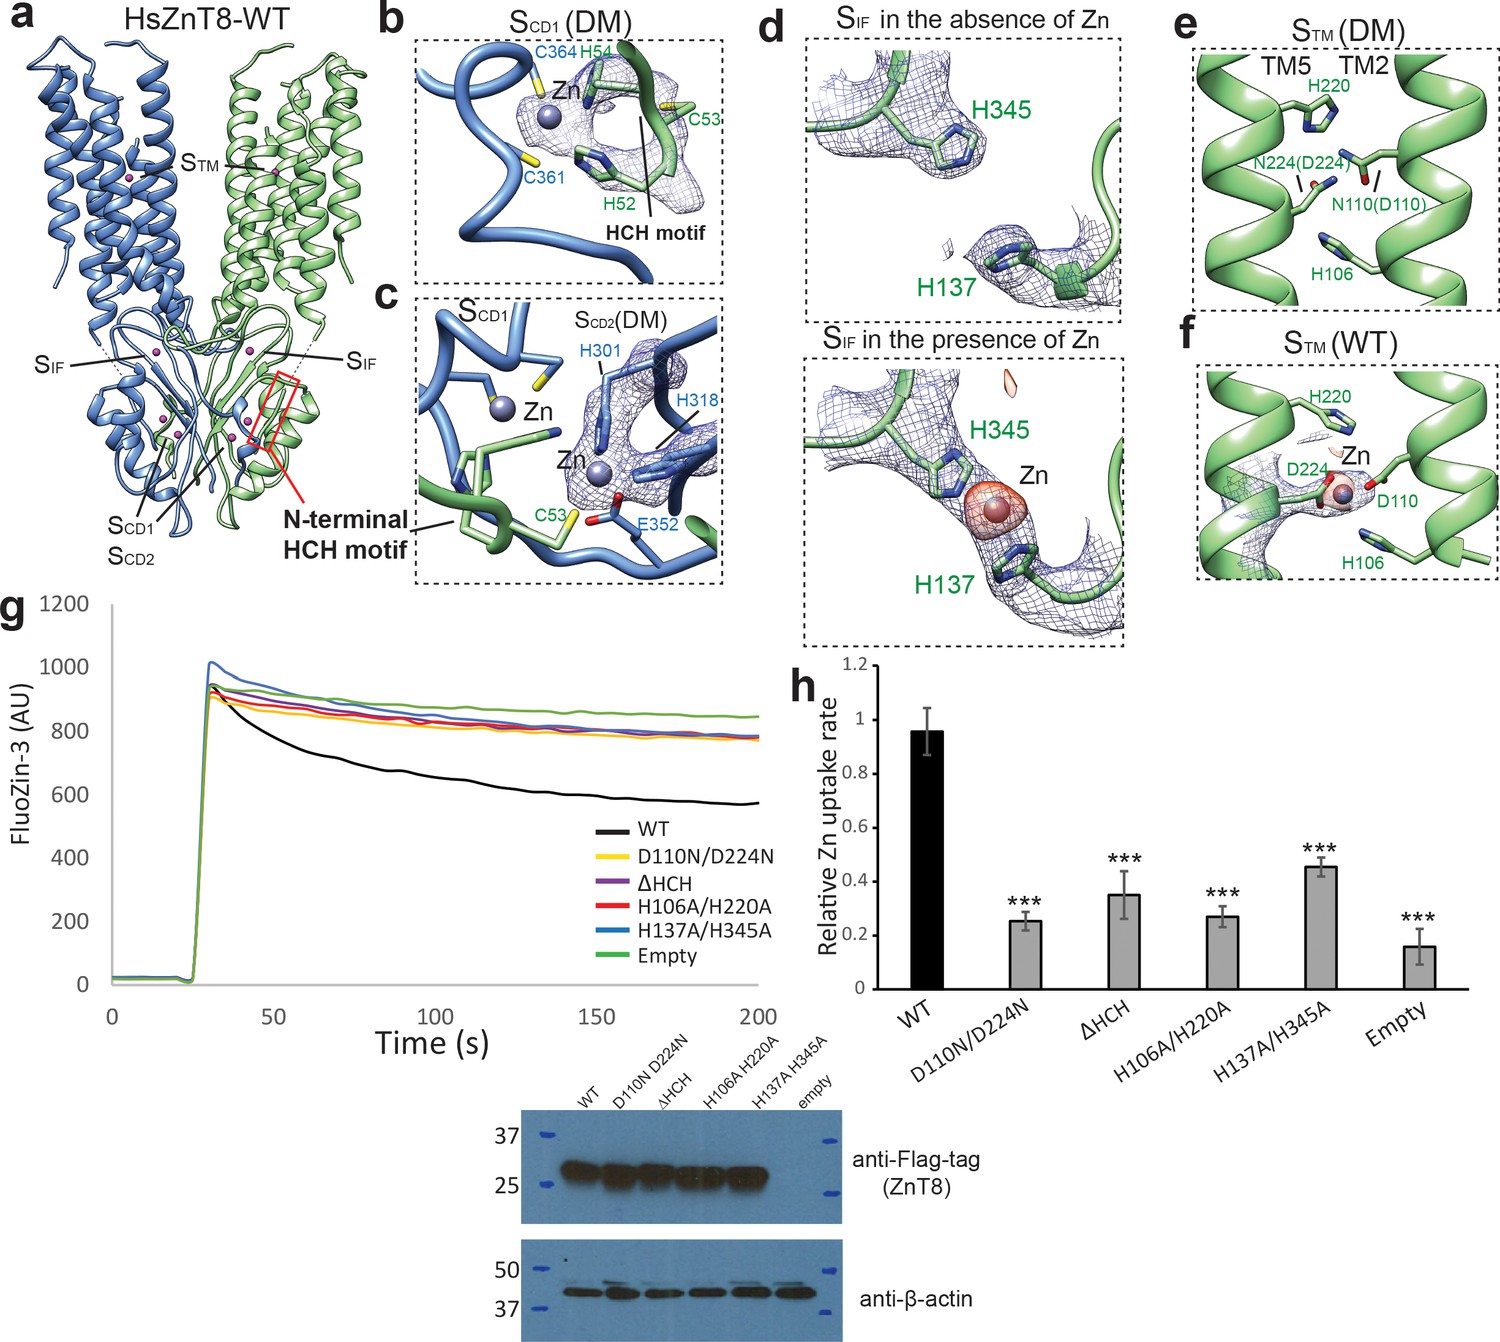
The Zn2+ binding sites in HsZnT8.
(a) Overall view of Zn2+ binding sites in HsZnT8-WT. The location of each site is indicated by a dash box. (b) and (c) Detailed views of SCD1 and SCD2 in the structure of HsZnT8-DM in the absence of Zn2+. The cryo-EM densities are displayed as blue mesh (6 σ). (d) , (e) and (f) Detailed views of SIF and STM in the structures of HsZnT8-DM in the absence of Zn2+ and HsZnT8-WT in the presence of Zn2+. The cryo-EM densities are displayed as blue mesh (6 σ). The density differences between the cryo-EM maps of HsZnT8-DM in the absence of Zn2+ and HsZnT8-WT in the presence of Zn2+ are shown as orange blobs (8 σ). (g) Representative fluorescence traces of vesicular Zn2+ uptake for the cells expressing wild-type HsZnT8 or its mutants. Non-induced HEK293F cells (empty) was used as the negative control. Expression levels of HsZnT8 wild type and mutants were monitored by western blot using anti-flag antibody. Mouse anti-β-actin was used as a loading control. (h) Relative Zn2+ uptake rate between HsZnT8 and its mutants (Mean ± SD). The uptake rates were normalized to the expression levels of HsZnT8. Each experiment was repeated four times. Significance calculated using two-tailed students t-test; between wild-type and mutants; ***p<0.001.
-
Figure 2—source data 1
Source data for Figure 2g.
- https://cdn.elifesciences.org/articles/58823/elife-58823-fig2-data1-v2.xlsx
-
Figure 2—source data 2
Source data for Figure 2h.
- https://cdn.elifesciences.org/articles/58823/elife-58823-fig2-data2-v2.xlsx
Figure 2—figure supplement 1
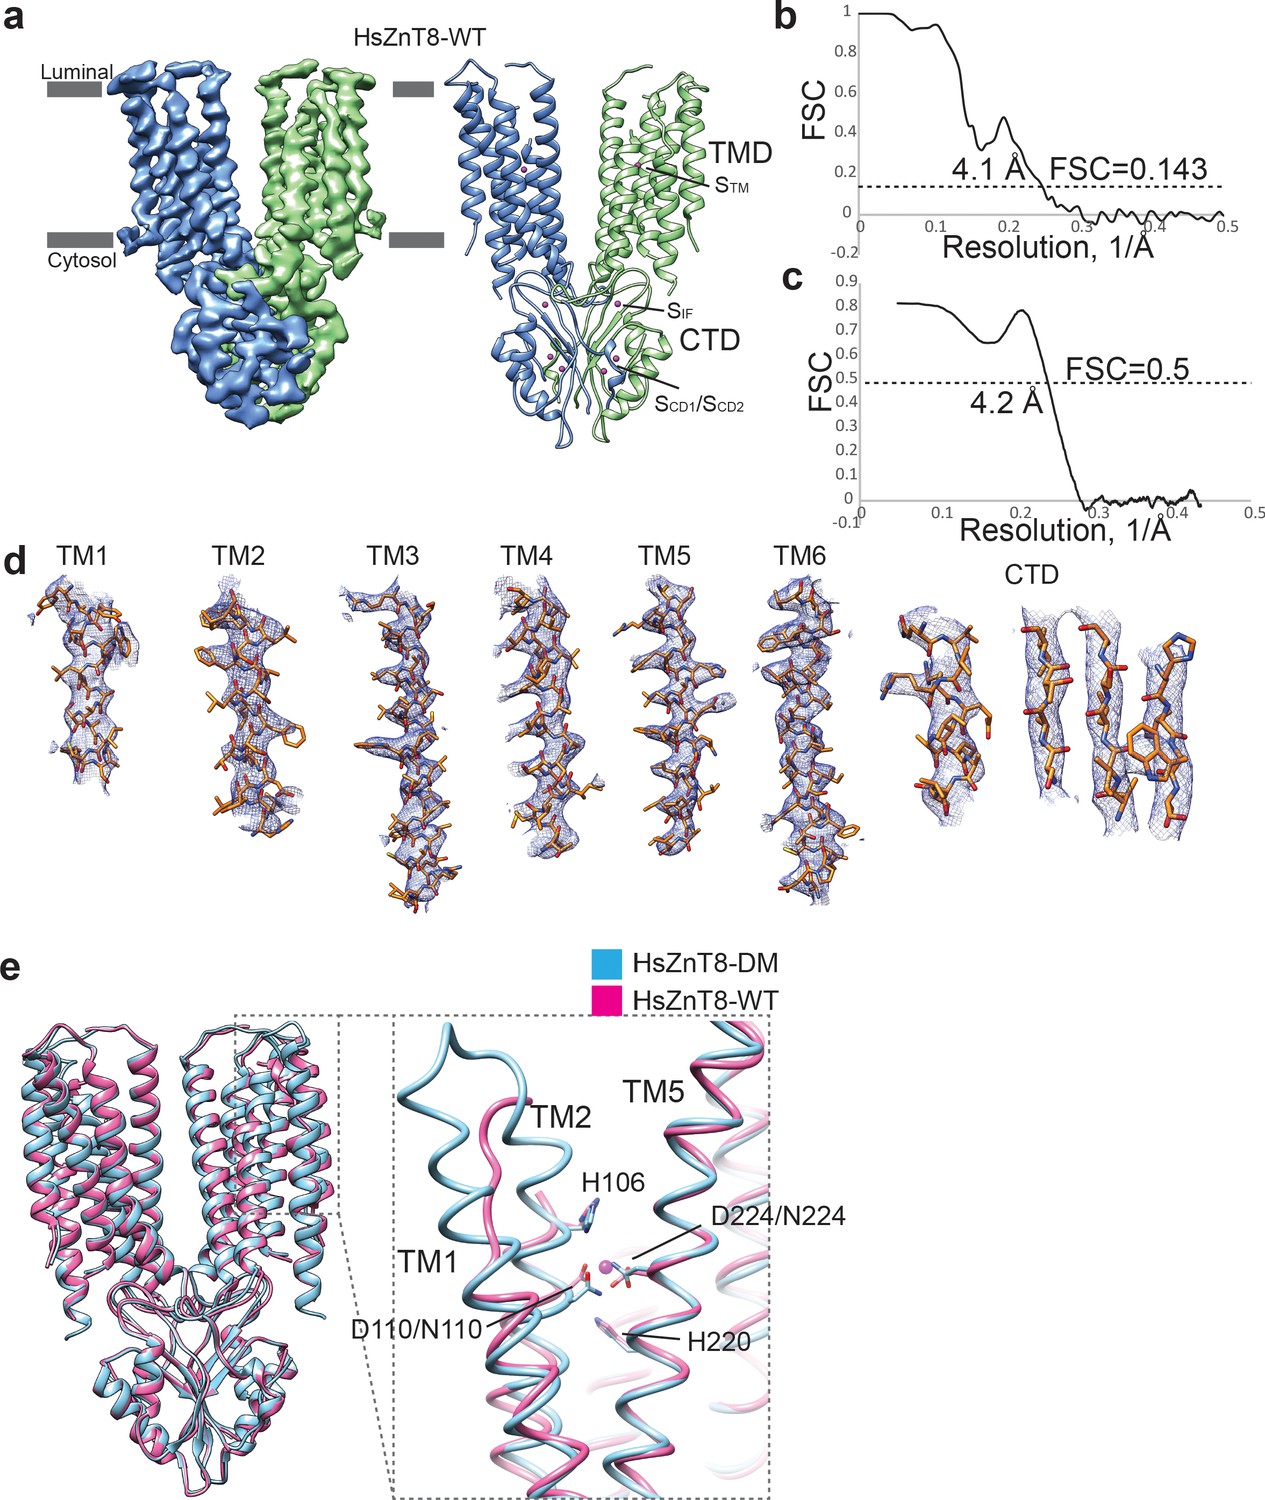
Cryo-EM analysis of the HsZnT8-WT in the presence of Zn2+.
(a) 3D reconstruction of HsZnT8-WT in the presence of Zn2+ (left) and the corresponding ribbon representation of this complex (right). The 4 Zn2+ binding sites in one subunit are labeled. The bound Zn2+ ions are shown as pink spheres. (b) The gold-standard Fourier shell correlation curve for the cryo-EM map shown in (a). (c) FSC curve for the refined model versus the cryo-EM map. (d) Representative density maps of CTD domain and each TM of HsZnt8-WT in the presence of Zn2+. (e) Superposition between the models of HsZnT8-DM in the absence of Zn2+ (blue) and HsZnT8-WT in the presence of Zn2+ (pink). Inset: zoomed-in view of the superposition at STM site.
Figure 3 with 3 supplements
Structural transitions between outward- and inward-facing conformations.
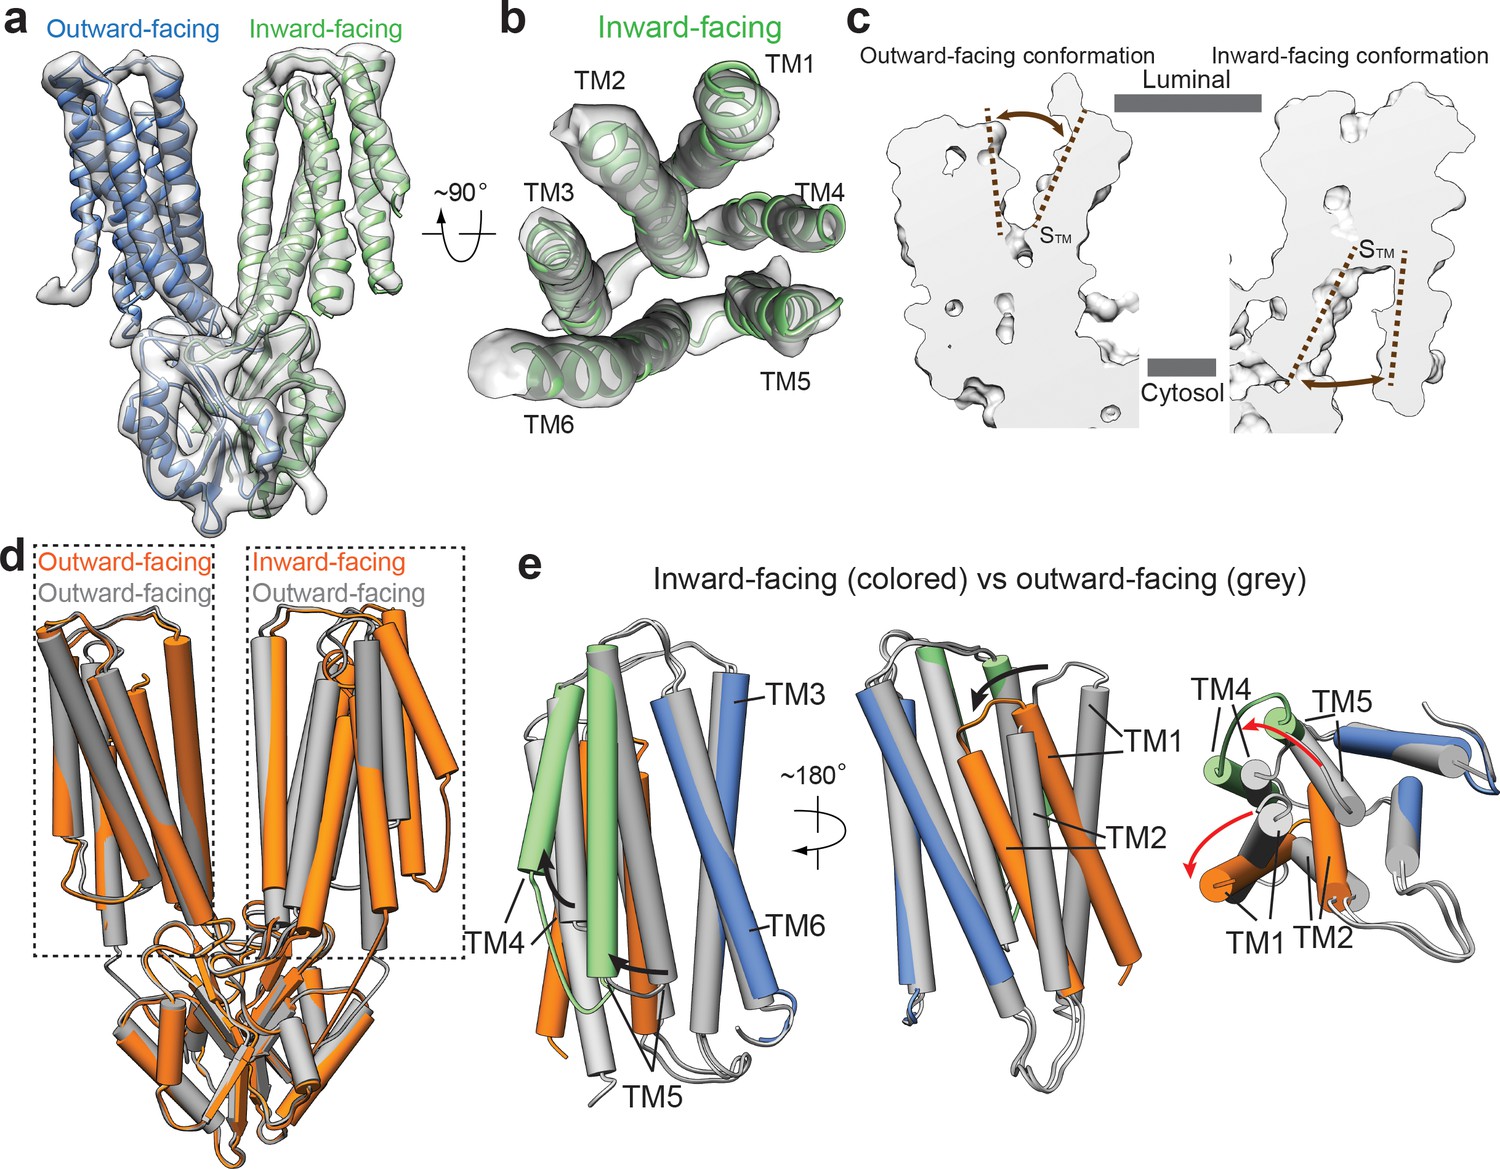
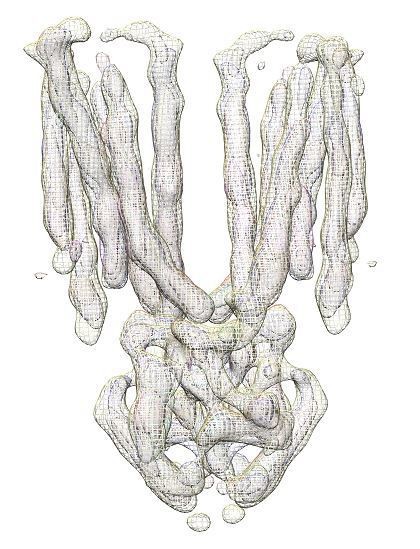
(a) 3D reconstruction of HsZnT8-WT in the absence of Zn2+ and the ribbon representation of the model fitted into cryo-EM map. (b) Top view of the TMD (TMs 1–6) from the inward-facing subunit in ribbon representation fitted into cryo-EM map. (c) The surface-rendered models of an outward-facing subunit from the HsZnT8-DM structure (left) and an inward-facing subunit from the HsZnT8-WT structure obtained in the absence of Zn2+ (right). The brown dashed lines indicate the opening of STM to either the luminal or the cytosolic side. (d) Superposition between the structures of HsZnT8-DM dimer (grey) and HsZnT8-WT dimer (orange) both obtained in the absence of Zn2+ (e) Superposition of the TMD structures between the outward-facing subunit from HsZnT8-DM (with TMs colored in grey) and the inward-facing subunit from HsZnT8-WT (with TMs 1–2 colored in brown, TMs 4–5 in green and TMs 3 and six in blue), revealing two different types of rocking motions (indicated by the arrows).
Figure 3—figure supplement 1
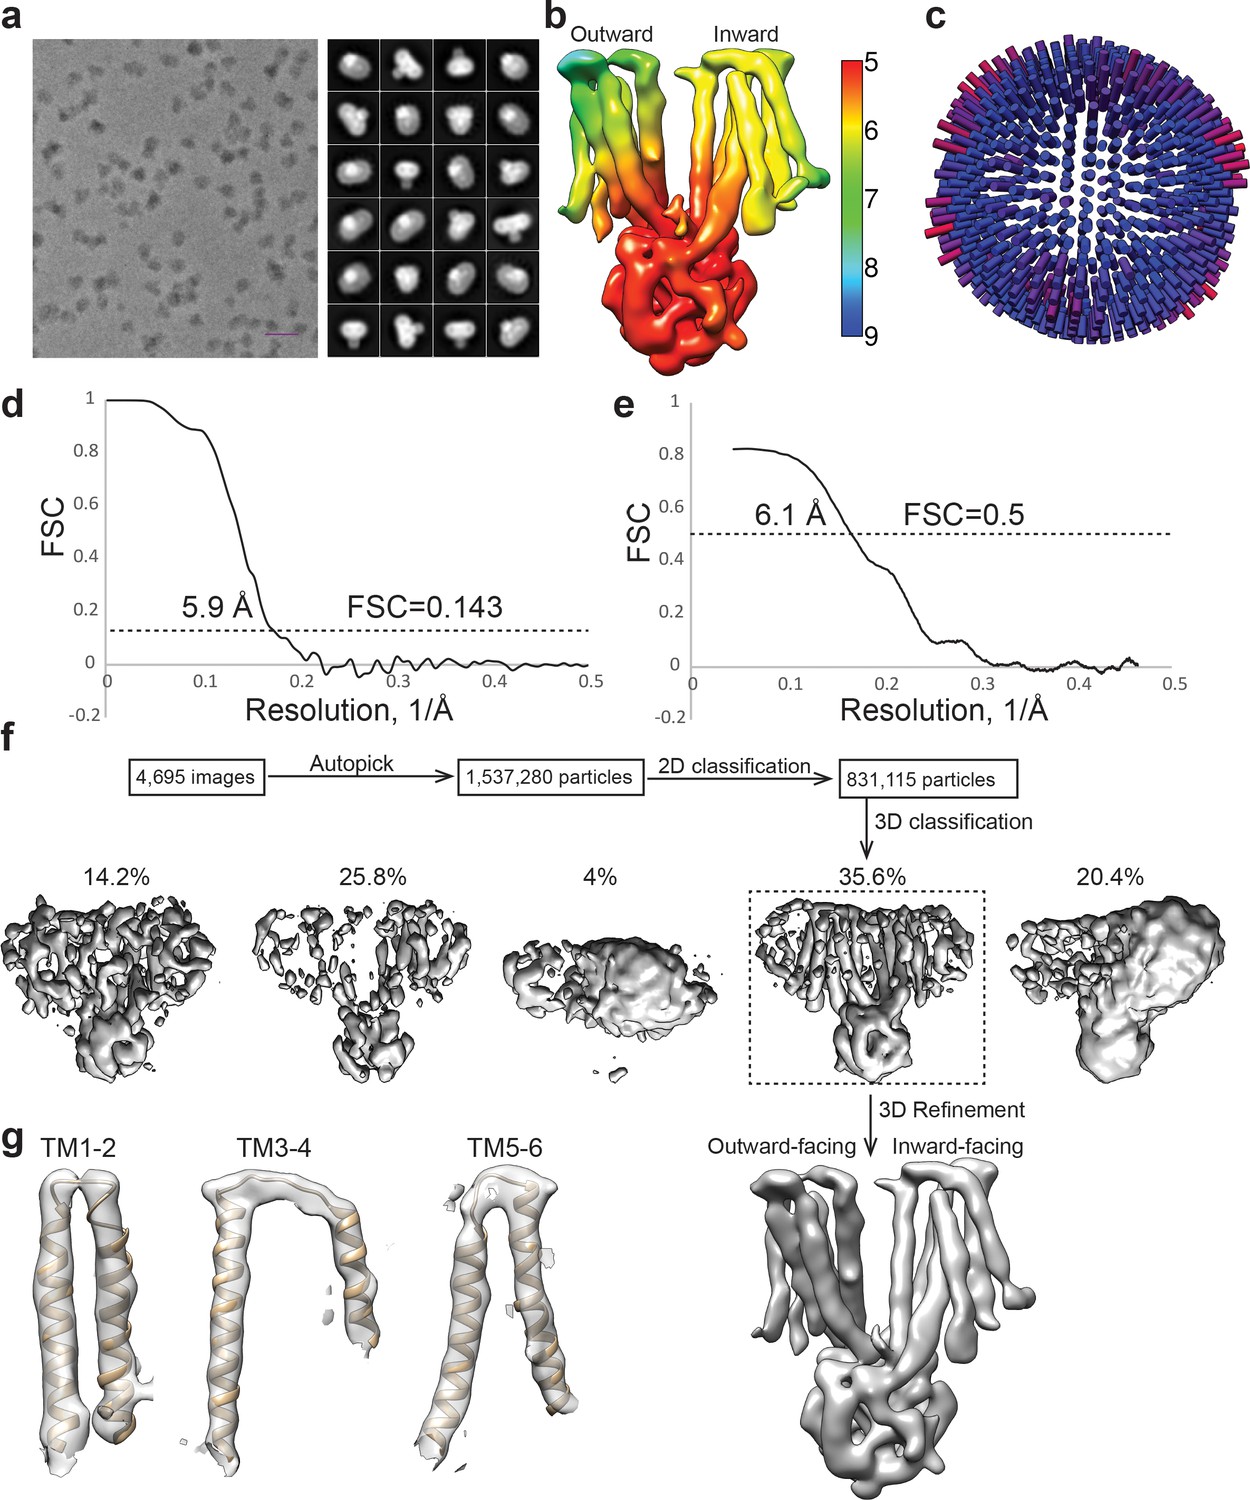
Cryo-EM analysis of the HsZnT8-WT in the absence of Zn2+.
(a) Representative electron micrograph and 2D class averages of the HsZnT8-WT in the absence of Zn2+. (Scale bar: 200 Å) (b) Cryo-EM map colored by local resolution. (c) Euler angle distribution of particles used in the final 3D reconstructions. (d) The gold-standard Fourier shell correlation curve for the cryo-EM map shown in Figure 3a. (e) FSC curve for the refined model versus the cryo-EM map. (f) Flowchart of cryo-EM data processing. (g) Representative density maps of each TM of HsZnT8-WT in the absence of Zn2+.
Figure 3—figure supplement 2
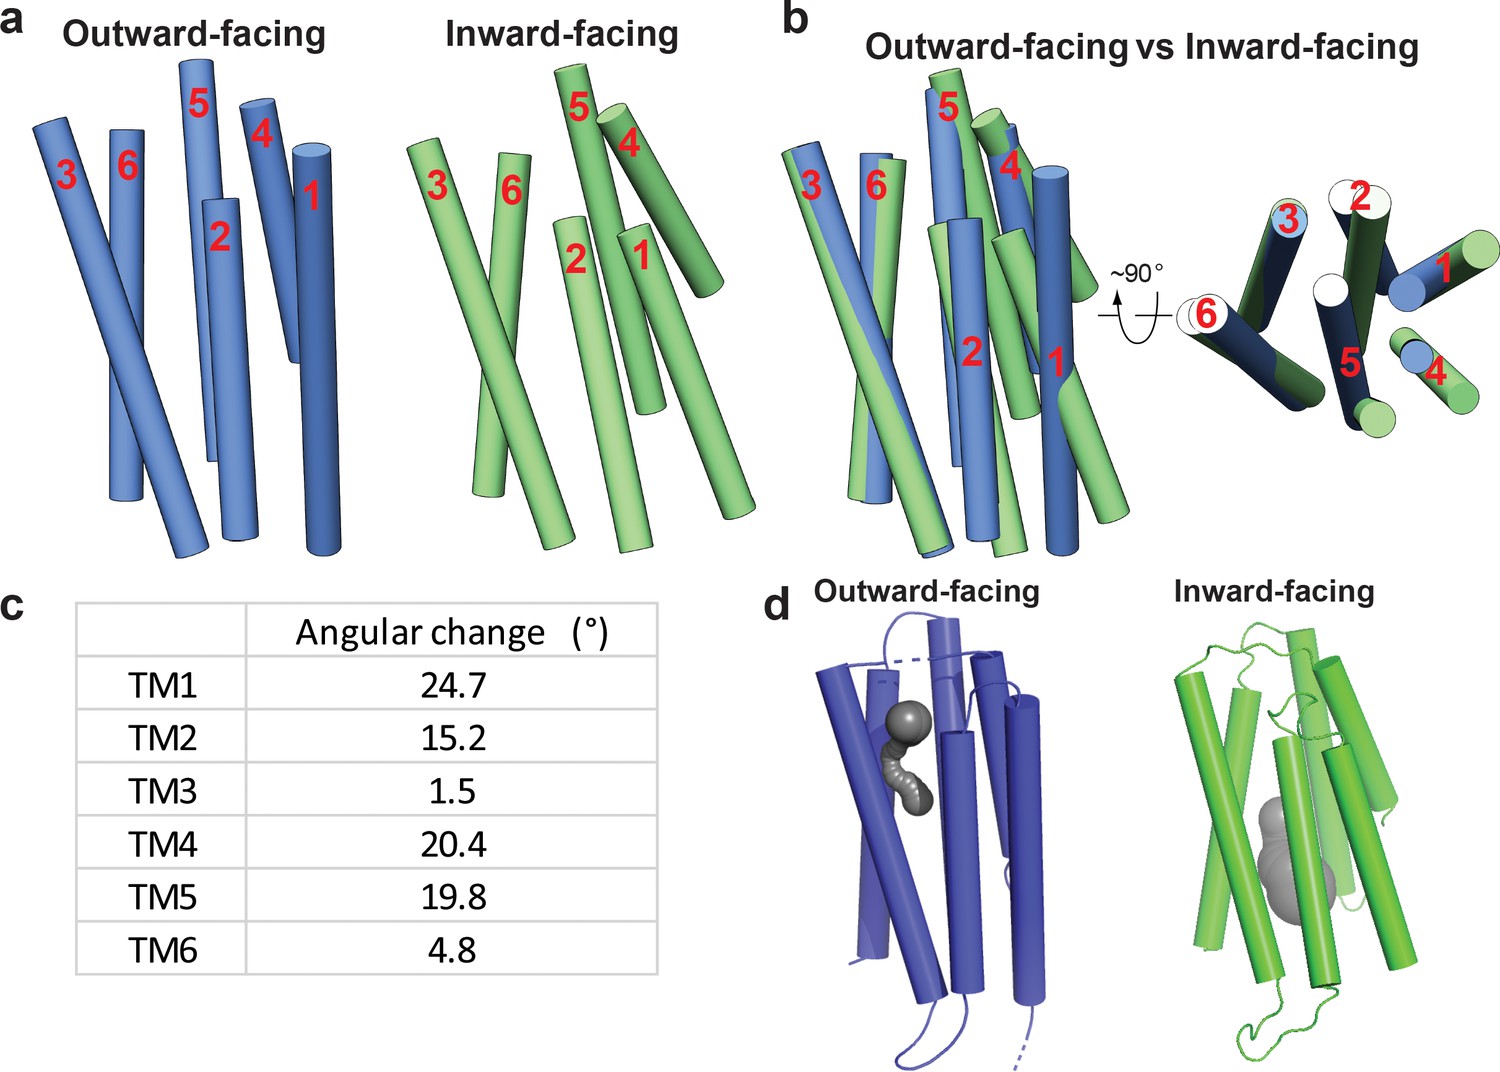
Structural comparison between HsZnT8 in outward- and inward-facing conformations.
(a) Structures of HsZnT8 TMD in outward- (blue) and inward-facing (green) conformation. The loops connecting TMs are omitted for clarity. (b) Superposition of the HsZnT8 TMD in outward- (blue) and inward-facing (green) conformations. (c) The angular change of each TM between outward- and inward-facing confirmations. (d) Solvent accessible cavities (grey) in outward- and inward-facing conformations.
Figure 3—figure supplement 3
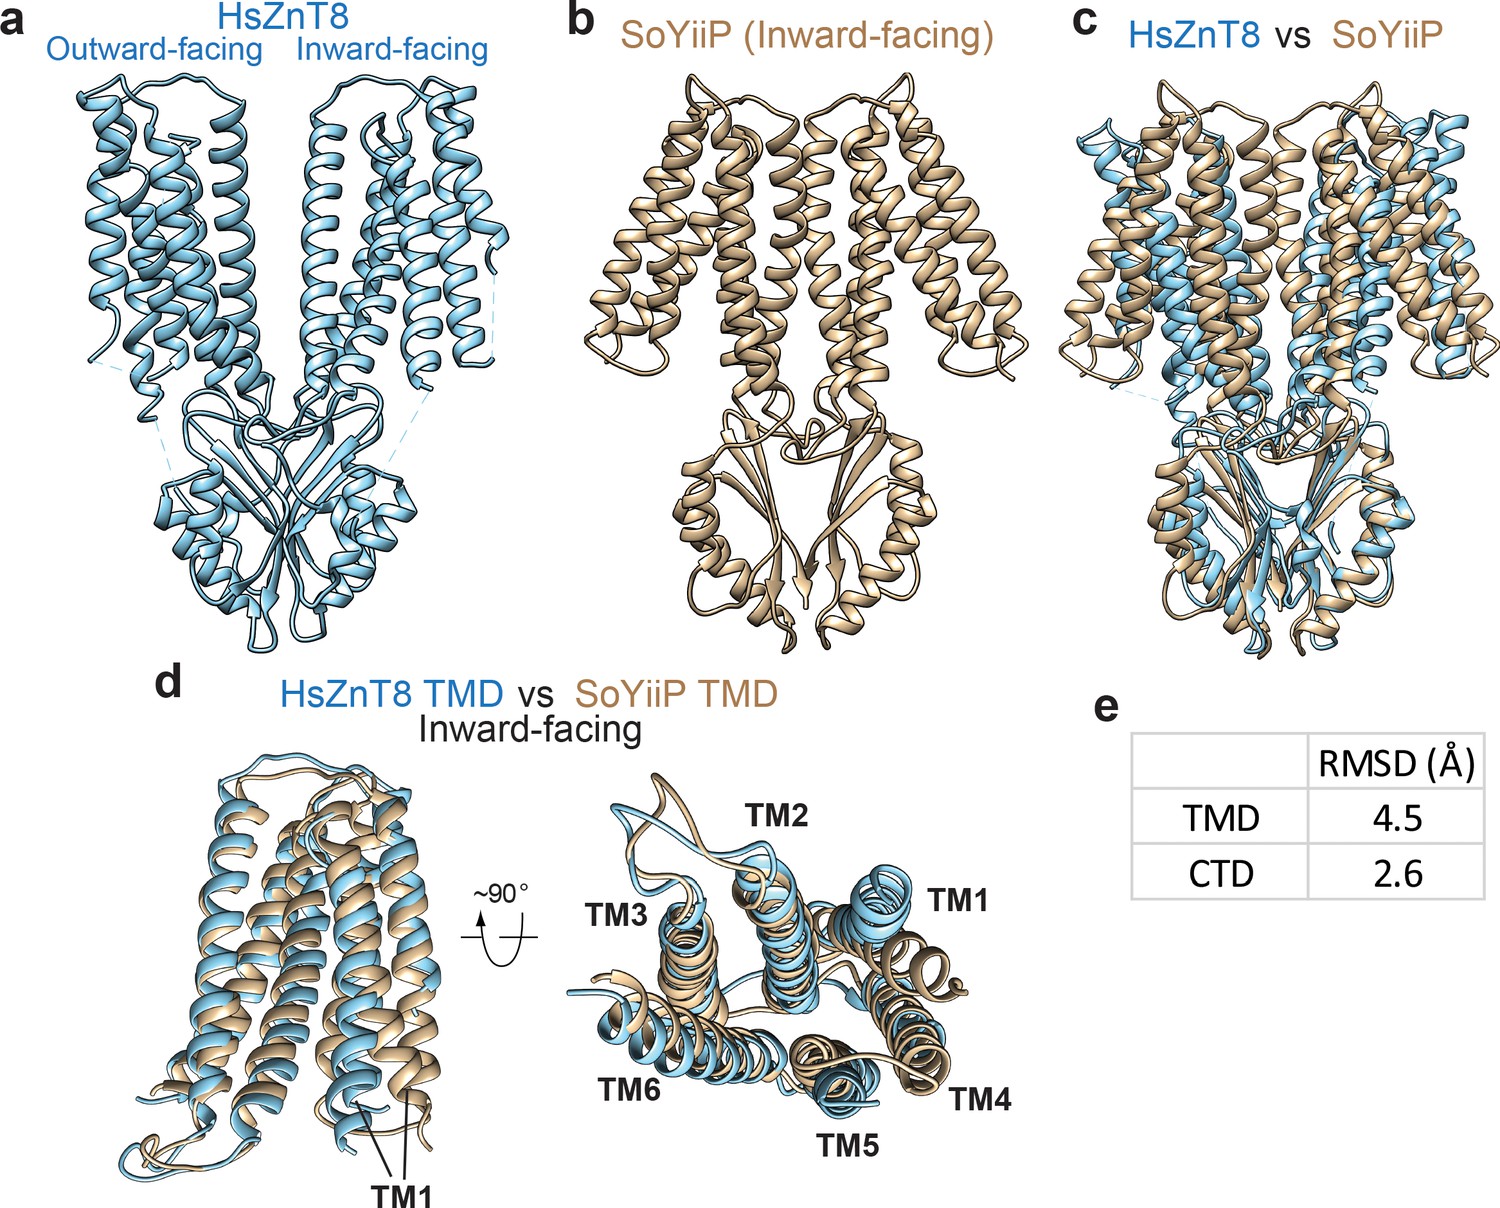
Structural comparison between HsZnT8 and SoYiiP in inward-facing conformation.
(a) Overall structures of HsZnT8 (blue) in heterogeneous conformation. (b) Overall structure of SoYiiP (yellow, PDB: 5VRF) in inward-facing conformation. (c) Superposition of the dimeric HsZnT8 (blue) and SoYiiP (yellow). (d) Superposition of the TMDs of HsZnT8 (blue) and SoYiiP (yellow). (e) RMSD value of TMD and CTD between HsZnT8 and SoYiiP in inward-facing conformation. RMSD was calculated based on only the position of C-α atom.
Figure 4 with 1 supplement
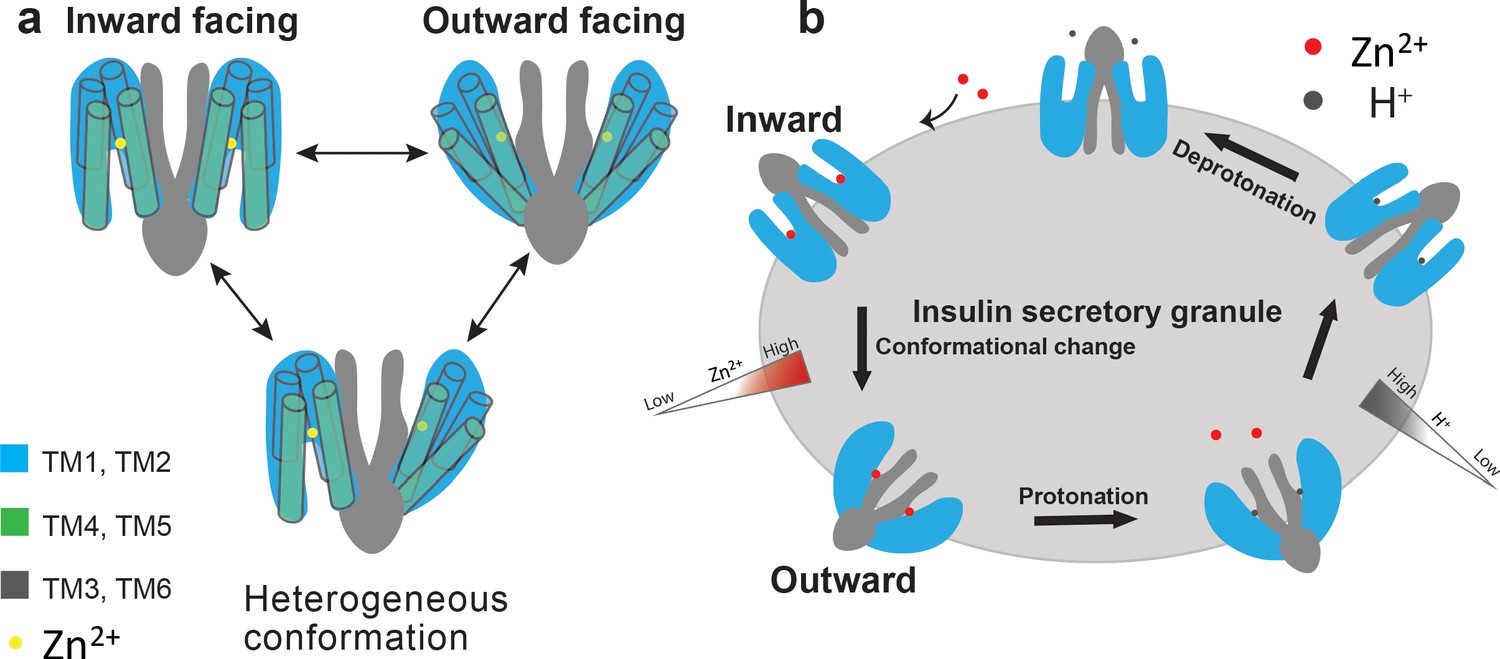
Proposed working model of HsZnT8.
(a) A cartoon representation illustrates that each ZnT8 subunit may shuttle between inward- and outward-facing conformations independently during the Zn2+ transport cycle. (b) Schematic representation of a simplified model for the transport cycle of ZnT8. For simplicity, both subunits in a ZnT8 dimer are drawn in homogeneous conformations, but they likely carry out Zn2+/H+ exchange function independent from each other, as shown in a.
Figure 4—figure supplement 1
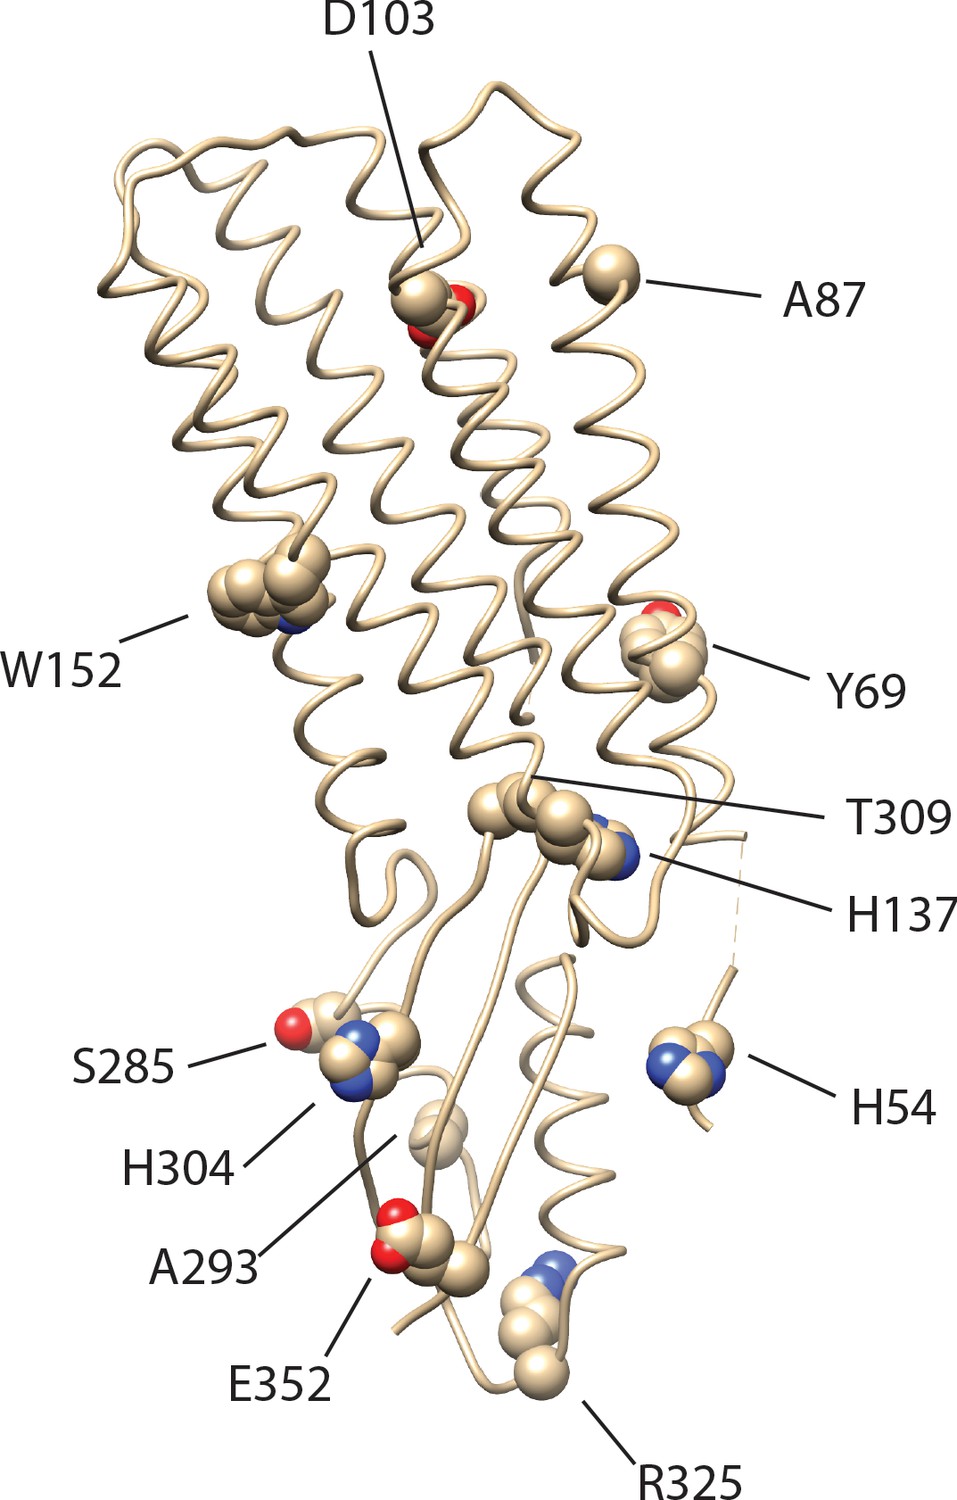
Mapping of the disease-associated point mutations onto HsZnT8.
Several of these mutations are found in other ZnTs, but conserved in ZnT8.
Author response image 1
Videos
Video 1
Structural transitions of the TMD of HsZnT8 between outward- and inward-facing conformations.
Tables
Key resources table
| Reagent type (species) or resource | Designation | Source or reference | Identifiers | Additional information |
|---|---|---|---|---|
| Strain, strain background (Escherichia coli) | TOP10 | Thermo Fisher Scientific | Cat# 18258012 | |
| Strain, strain background (Escherichia coli) | DH10bac | Thermo Fisher Scientific | Cat# 10361012 | |
| Cell line (Spodoptera frugiperda) | Sf9 cells | Thermo Fisher Scientific | Cat# 11496015; RRID:CVCL_0549 | |
| Cell line (Homo sapiens) | FreeStyle 293 F cells | Thermo Fisher Scientific | Cat# R79007; RRID:CVCL_D603 | |
| Recombinant DNA reagent | pEZT-BM | DOI:10.1016/j.str.2016.03.004 | Addgene:74099 | |
| Transfected construct (Homo-sapiens) | pEZT-BM-ZNT8-NFlagand mutations | This paper | N/A | transfected construct (human) |
| Antibody | Mouse monoclonal anti-FLAG tag | Sigma | Cat# F1804 | WB (1:5000) |
| Antibody | Mouse monoclonal anti-b-actin | Santa Cruz Biotechnology | Cat# sc-69879; RRID:AB_1119529 | WB (1:200) |
| Antibody | Mouse IgG HRP linked whole Ab | GE healthcare | Cat# NA931V; RRID:AB_772210 | WB (1:10000) |
| Chemical compound, drug | Sodium Butyrate | Sigma-Aldrich | Cat# 303410 | |
| Chemical compound, drug | n-Dodecyl-b-Maltopyranoside | Anatrace | Cat# D310, D310s | |
| Chemical compound, drug | Cholesteryl hemisuccinate | Sigma-Aldrich | Cat# C6512 | |
| Chemical compound, drug | Lauryl Maltose Neopentyl Glycol | Anatrace | Cat# NG310 | |
| Chemical compound, drug | Digitonin | Sigma | Cat# D141 | |
| Chemical compound, drug | 1,10-Phenanthroline | Sigma | Cat# 131377 | |
| Chemical compound, drug | FluoZin−3 | Thermo Fisher Scientific | Cat# F24194 | |
| Peptide, recombinant protein | 3X FLAG Peptide | Sigma | Cat# F4799 | |
| Software, algorithm | MotionCor2 | Zheng et al., 2017 | https://emcore.ucsf.edu/ucsf-software | |
| Software, algorithm | GCTF | Zhang, 2016 | https://www2.mrc-lmb.cam.ac.uk/research/locally-developed-software/zhang-software/#gctf | |
| Software, algorithm | RELION | Scheres, 2012 | http://www2.mrc-lmb.cam.ac.uk/relion | |
| Software, algorithm | Chimera | Pettersen et al., 2004 | https://www.cgl.ucsf.edu/chimera; RRID:SCR_004097 | |
| Software, algorithm | PyMol | Schrödinger | https://pymol.org/2; RRID:SCR_000305 | |
| Software, algorithm | COOT | Emsley et al., 2010 | https://www2.mrc-lmb.cam.ac.uk/ personal/pemsley/coot; RRID:SCR_014222 | |
| Software, algorithm | PHENIX | Adams et al., 2010 | https://www.phenix-online.org | |
| Software, algorithm | GraphPad Prism | GraphPad Software | https://www.graphpad.com/scientific-software/prism | |
| Software, algorithm | OriginPro 8 | OriginLab Corp. | https://www.originlab.com | |
| Other | Superose 6 Increase10/300 GL | GE Healthcare | Cat# 29091596 | |
| Other | Anti-DYKDDDDK G1 Affinity Resin | GeneScript | Cat# 10362101 | |
| Other | Amicon Ultra-15 Centrifugal Filter Units | Milliporesigma | Cat# UFC9100 | |
| Other | Quantifoil R 1.2/1.3 grid Au300 | quantifoil | Cat# Q37572 | |
| Other | Cellfectin | Invitrogen | Cat# 10362100 |
Additional files
-
Supplementary file 1
CryoEM data collection and model statistics.
- https://cdn.elifesciences.org/articles/58823/elife-58823-supp1-v2.doc
-
Transparent reporting form
- https://cdn.elifesciences.org/articles/58823/elife-58823-transrepform-v2.pdf
Download links
A two-part list of links to download the article, or parts of the article, in various formats.
Downloads (link to download the article as PDF)
Open citations (links to open the citations from this article in various online reference manager services)
Cite this article (links to download the citations from this article in formats compatible with various reference manager tools)
Cryo-EM structures of human ZnT8 in both outward- and inward-facing conformations
eLife 9:e58823.
https://doi.org/10.7554/eLife.58823


