Neural population dynamics in motor cortex are different for reach and grasp
- Committee on Computational Neuroscience, University of Chicago, United States
- Department of Organismal Biology and Anatomy, University of Chicago, United States
- Grossman Institute for Neuroscience, Quantitative Biology and Human Behavior, University of Chicago, United States
Figures
Figure 1 with 2 supplements
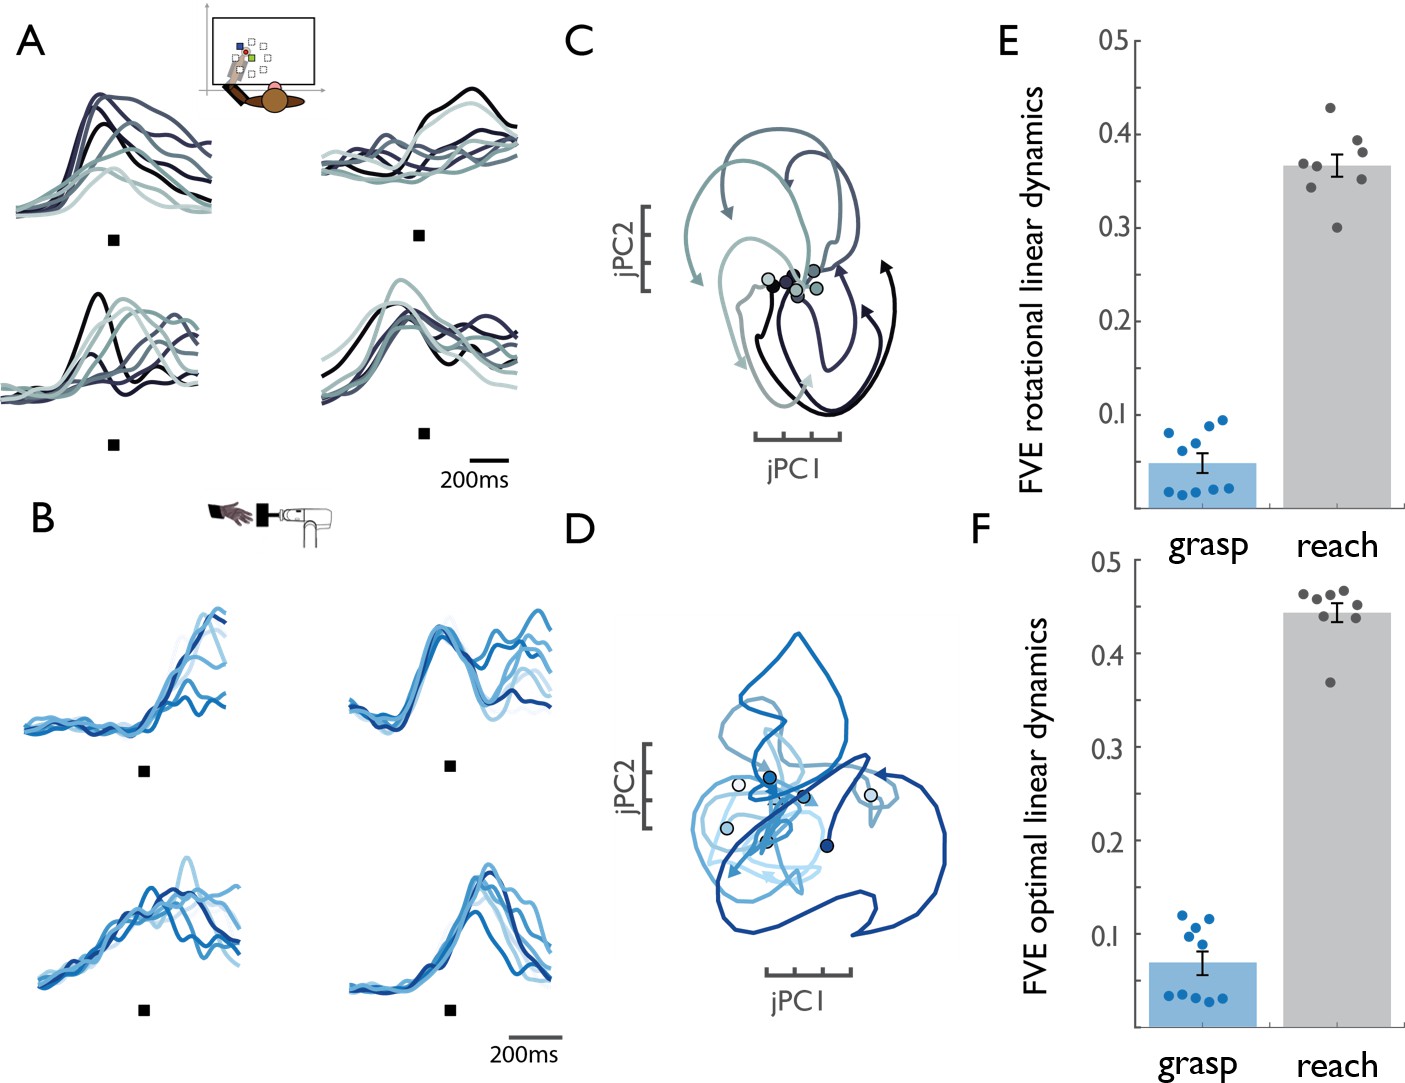
M1 rotational dynamics during reaching and grasping.
(A) Normalized peri-event histograms aligned to movement onset (black square) for four representative neurons during the reaching task (Monkey 4, Dataset 5). Each shade of gray indicates a different reach direction, trial-averaged for each reaching condition (eight total). (B) Normalized peri-event histograms aligned to maximum aperture (black square) for four representative neurons during the grasping task (Monkey 2, Dataset 2). Each shade of blue indicates a neuron’s response, trial-averaged for different object groups. (C) Rotational dynamics in the population response during reaching for Monkey 4 (Dataset 5) projected onto the first jPCA plane. Different shades of gray denote different reach directions. (D) Lack of similar M1 rotational dynamics during grasping. Different shades of blue indicate different object groups, for Monkey 2 (Dataset 2). (E) FVE (fraction of variance explained) in the rate of change of neural PCs (dx/dt) explained by the best fitting rotational dynamical system. The difference in FVE for reach and grasp is significant (two-sample two-sided equal-variance t-test, t(16) = −19.44, p=4.67e-13). Error bars denote standard error of the mean and data points represent the outcomes of cross-validation folds (across conditions – see Materials and methods) for each of two monkeys. (F) FVE in the rate of change of neural PCs (dx/dt) explained by the best fitting linear dynamical system, not constrained to be rotational. The difference in FVE is highly significant (two-sample two-sided equal-variance t-test, t(16) = −21.37 p=1.57e-14). Error bars denote standard error of the mean and data points represent the outcomes of cross-validation folds for each of two monkeys (fourfold for reaching data, and 5-fold for grasping data). The lack of dynamical structure during grasping relative to reach is further established in a series of control analyses (Figure 1—figure supplement 1).
Figure 1—figure supplement 1
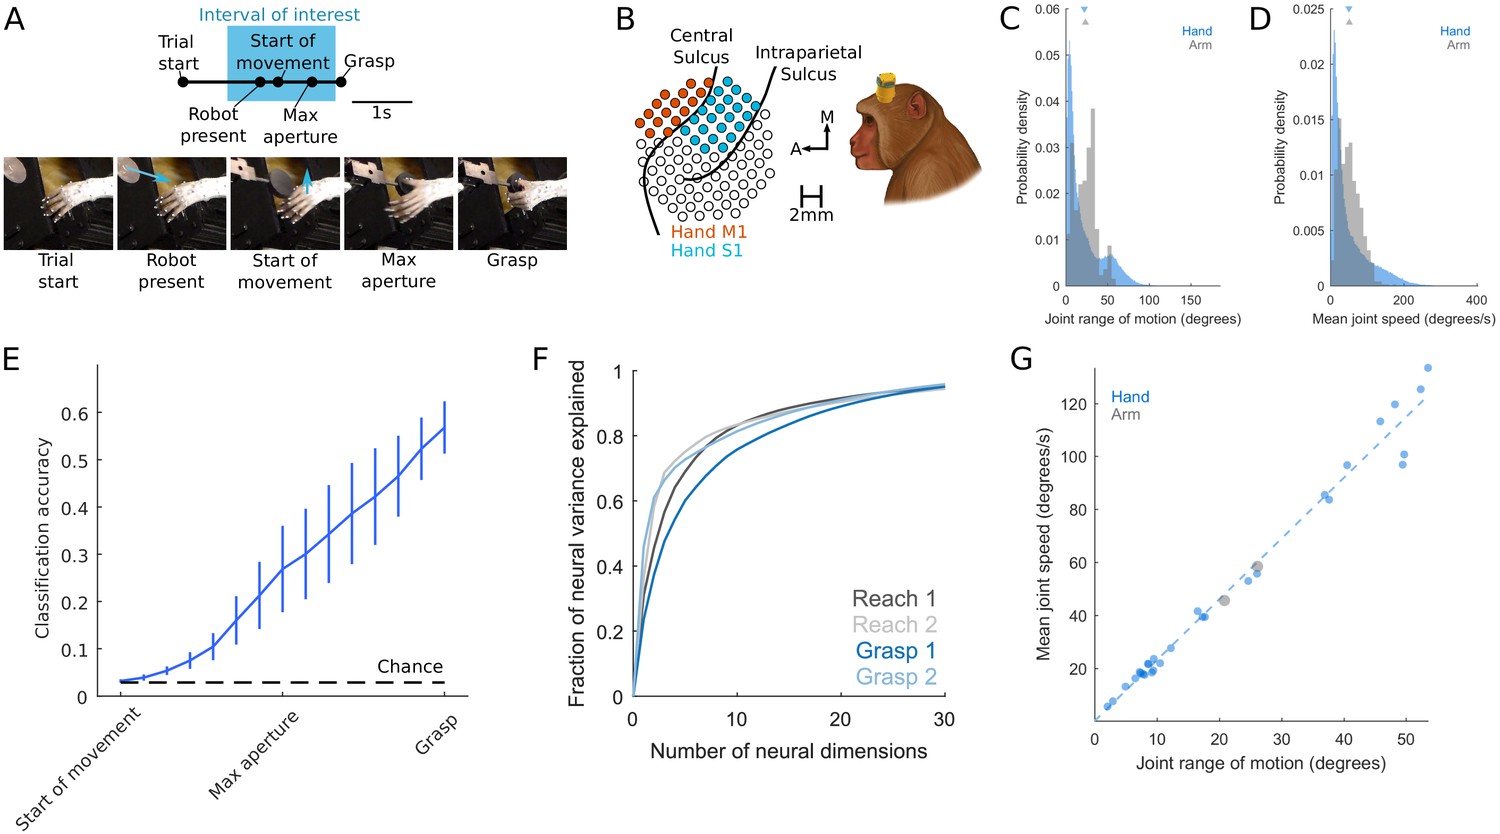
Grasping behavior and neurophysiology.
Related to Materials and methods. (A) Time course of grasp task. Start of Movement, Maximum Aperture, and Grasp epochs were inferred based on hand kinematics. Arrows indicate motion of the robot presenting the object or motion of the hand. (B) Multi-electrode arrays were used to record neuronal activity. (C) Probability density of the range of motion, where each instance is the difference between the maximum and minimum angle of a joint DOF during a single trial. Instances are pooled across joint DOFs, sessions, and animals. (D) Probability density of mean joint angular speed, where each instance is the mean speed of a single joint degree of freedom (DOF) during a single trial. (E) Performance of a linear discriminant analysis to decode object identity on the basis of hand posture (DOFs). Objects are most discriminable just before object contact (Grasp) but are also discriminable well above chance long before contact is established (for example, at maximum aperture). Trace indicates the mean, error bars the S.E.M. across monkeys. (F) Scree plots, for both reach- and grasp-related M1 responses used in the jPCA analysis, indicating the cumulative variance explained by the first n principal components of neural activity. Principal components analysis was applied to rate-normalized, trial-averaged, Gaussian-smoothed firing rates. (G) Relationship between the mean speed and mean range of motion for each DOF. Neither the mean joint angular speed (two-sample equal-variance t-test [t(202780) = 0.65, p=0.51) nor the joint angular range of motion (t(202780) = 1.8462, p=0.0649]) differs between reach and grasp. Moreover, the two DOFs tracked during reach follow the same trend as joint DOFs during grasp (R2 = 0.9820). In other words, grasping and reaching movements are associated with overlapping distributions of joint angular speeds and ranges of motion.
© 2019, Elsevier. Panels A-E and G are reproduced from Goodman et al., 2019, with permission from Elsevier. It is not covered by the CC-BY 4.0 licence and further reproduction of this panel would need permission from the copyright holder.
Figure 1—figure supplement 2
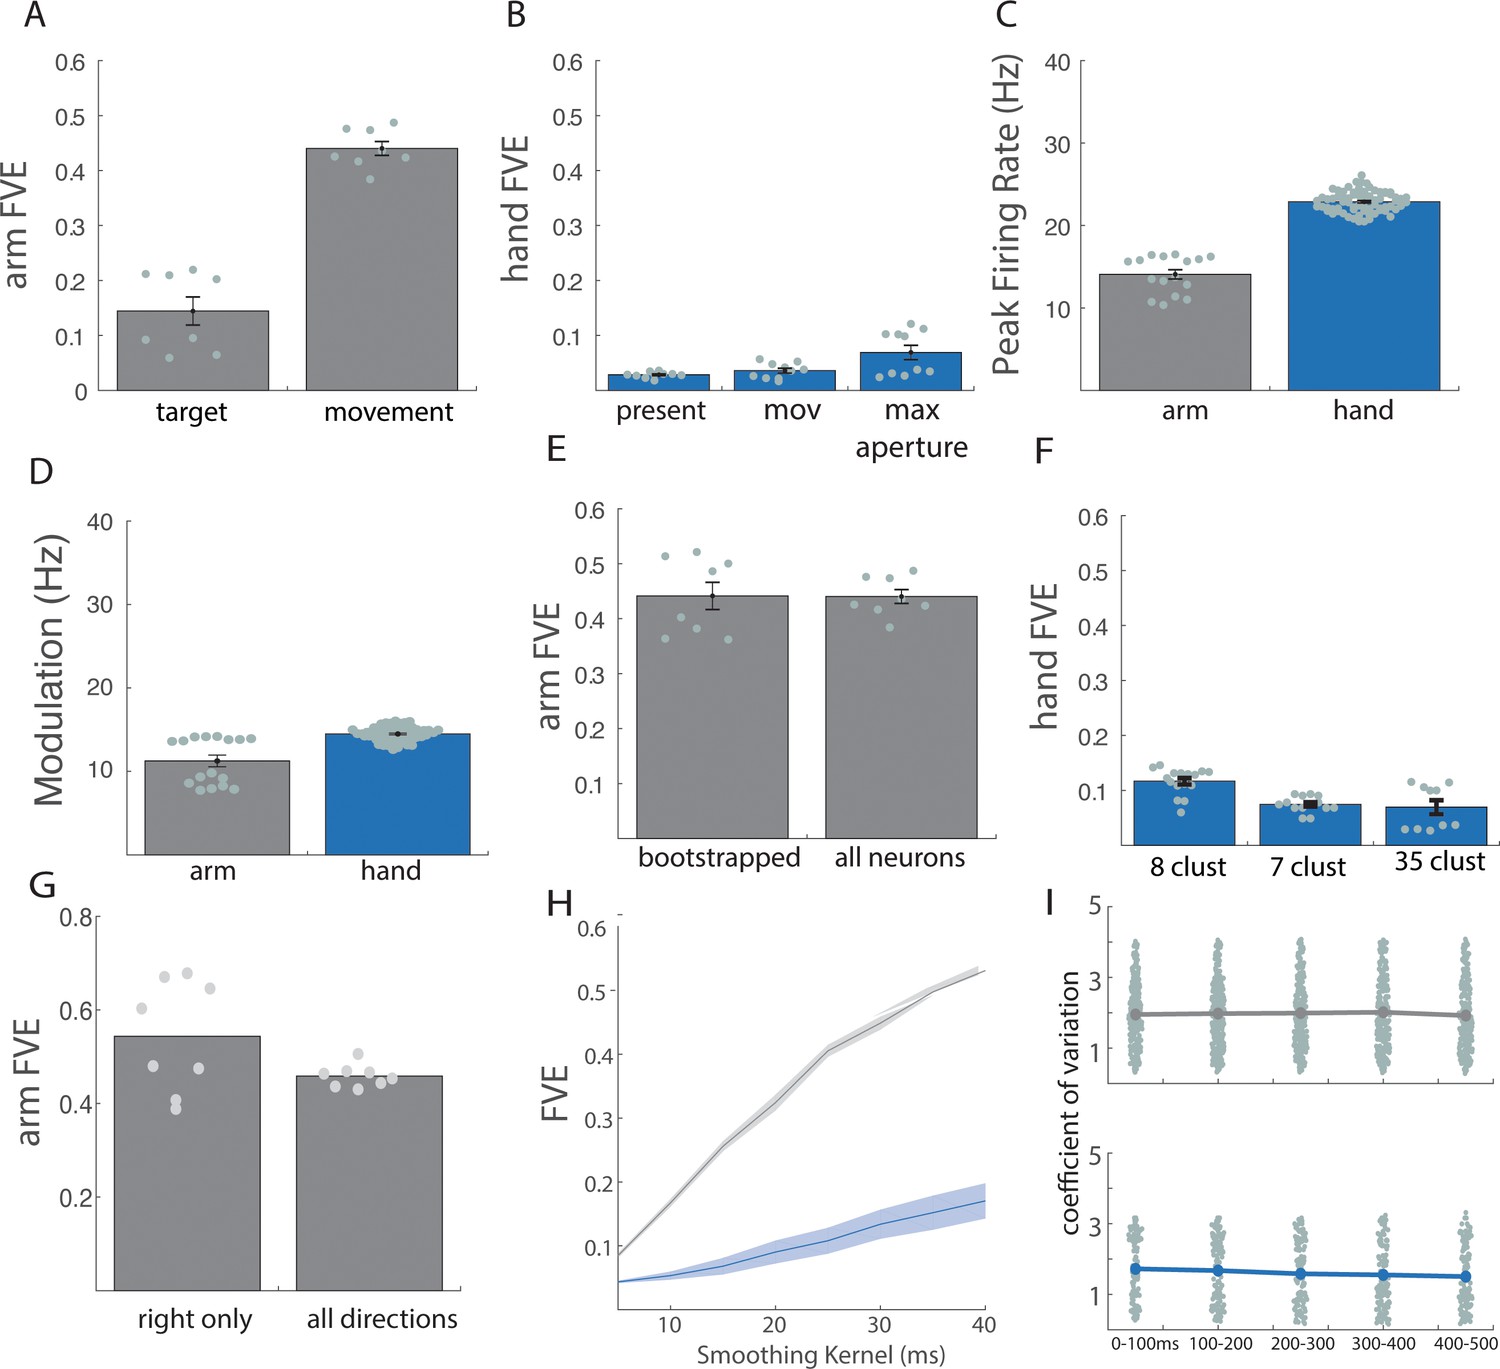
Control analyses for reaching and grasping.
Related to Figure 1. (A) For reaching: cross-validated fraction of variance explained (FVE) in the rate of change of neural PCs (dx/dt) explained by the linear dynamical system that best fit the data, with data aligned to target presentation (target) or movement onset (movement). (B) For grasping: cross-validated FVE in the rate of change of neural PCs (dx/dt) explained by the linear dynamical system that best fits the data, when the data are aligned to a 500 ms window centered on object presentation (present), a 700 ms window centered on movement onset (mov), and a 700 ms window centered on maximum aperture (max aperture). (C) Average peak firing rate across all neurons for arm (gray) and hand (blue) responses. Each point indicates the mean peak rate for a single task condition within a single animal: for ‘arm’, this constitutes eight reaching directions across two animals; for ‘hand’, 35 objects across two animals. (D) Average neuronal modulation (90th percentile firing rate – 10th percentile firing rate, before normalization) for arm (gray) and hand (blue) responses. Each point denotes the mean modulation across trials and neurons for a single task condition within a single animal. (E) Bootstrapped responses (55 neurons) vs. full sample for reaching. (F) Cross-validated FVE in the rate of change of neural PCs (dx/dt) explained by the linear dynamical system that best fits the data when the grasping data are clustered into just a few object groups (see methods). For 8 and 7 clusters, cross validation was achieved on a leave-one-out basis. For 35 clusters, the standard fivefold (leave-7-out) cross-validation was used. Difference between 8 clusters and 35 clusters is significant (p=0.0008) while difference between 7 clusters and 35 clusters is not significant (p=0.57). However, for both clustering methods, the difference between hand and arm remains highly significant (eight clusters| p=2.5e-18; seven clusters | p=2.08e-19). (G) Cross-validated FVE for rightward arm movements only compared to all arm movements (right and left). For all figures, except where otherwise indicated, bar heights and solid lines represent the mean, shaded regions and error bars represent standard error of the mean, and each data point represents the result of an individual cross-validation fold for each of two monkeys. (H) Cross-validated FVE across various smoothing kernels (10 to 50 ms). Difference between arm and hand remains substantial regardless of smoothing. (I) Coefficient of variation (CV) of spike counts across trials within condition. Each point denotes the mean CV across each condition for a single neuron, assessed over 100 ms bins around movement onset (at 250 ms). Results indicate that trial-to-trial variability in neuronal responses is stable over the trial and similar for reach (top) and grasp (bottom).
Figure 2 with 1 supplement

Decoding of kinematics based on population activity pre-processed with Gaussian smoothing or with LFADS.
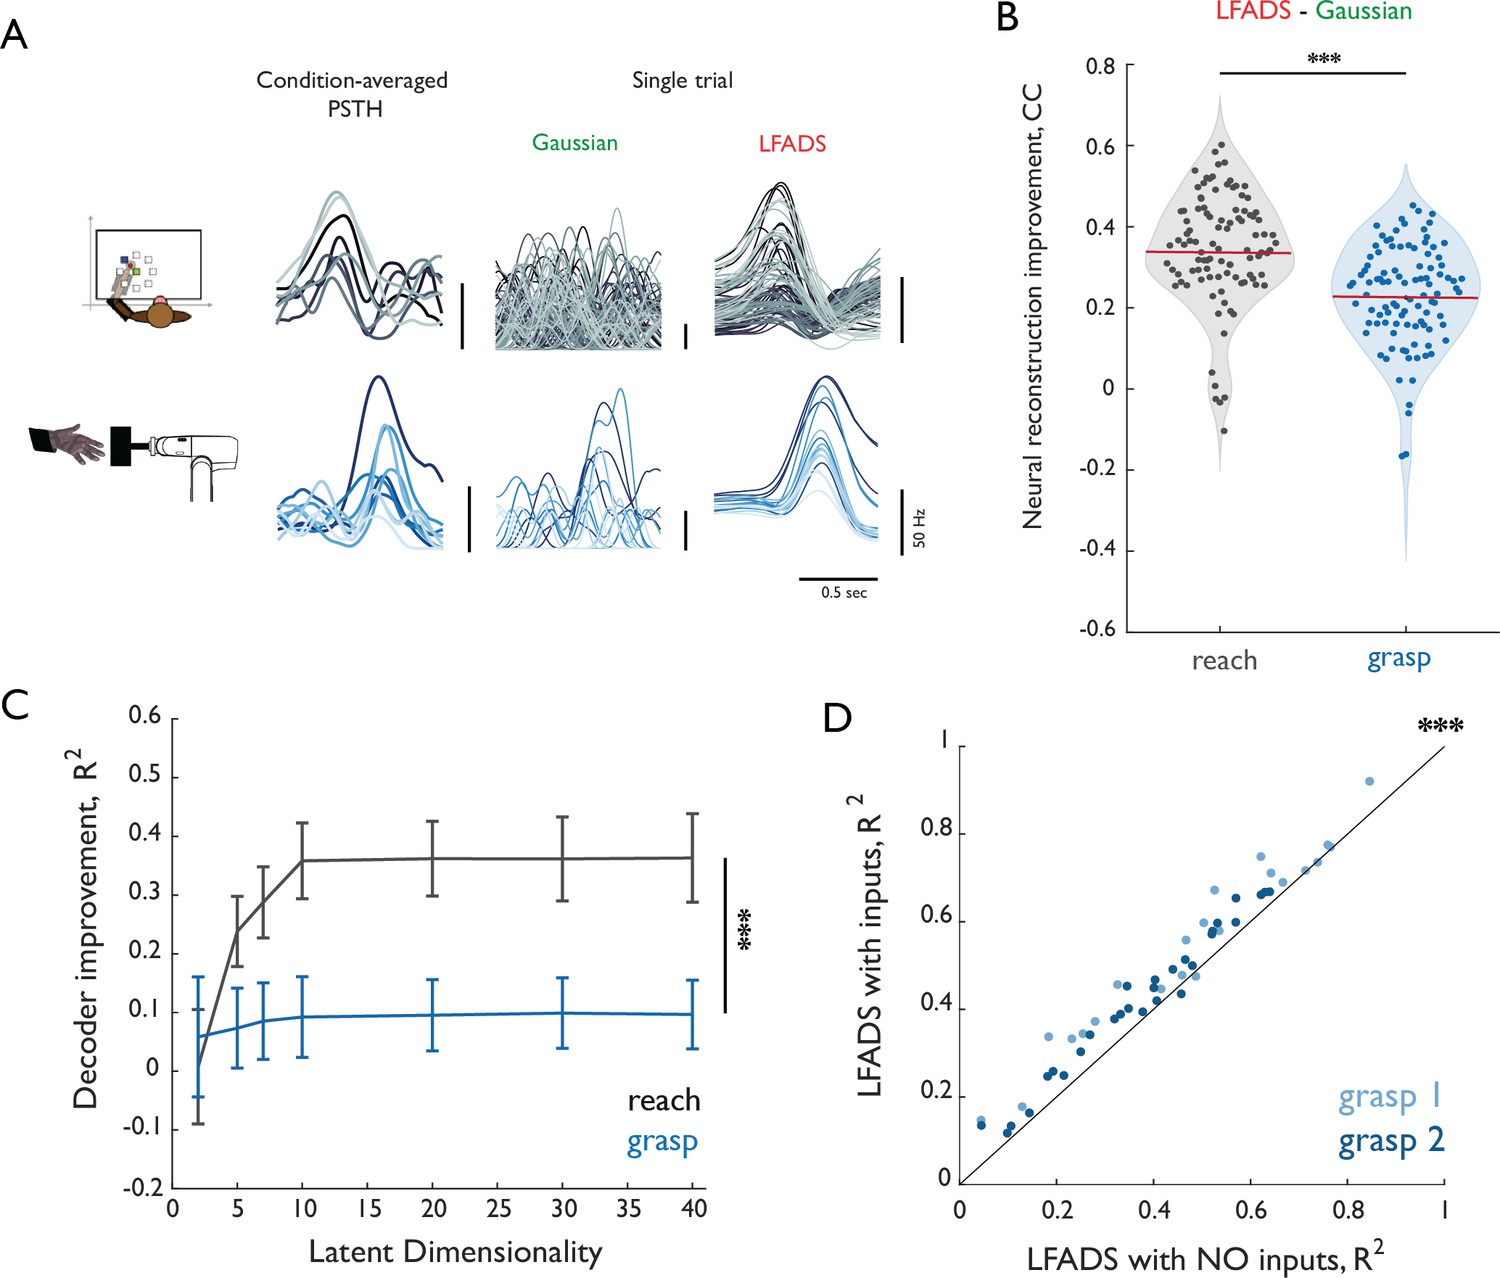
(A) End-point coordinates of center-out reaching with actual kinematics (top) or kinematics reconstructed with neural data preprocessed with Gaussian smoothing (middle) or LFADS (bottom). Coordinates are color-coded according to the eight directions of movement. While conditions are visually separable in both Gaussian and LFADS reconstructions, the later provides a smoother and more reliable estimate. (B) Single-trial time-varying angles of five hand joints (black, dashed) from monkey three as it grasped five objects along with their decoded counterparts (Gaussian-smoothed in green, LFADS-inferred in red). Both Gaussian-smoothed and LFADS-inferred firing rates yield similar decoding errors. Here, ‘4mcp flexion’ refers to flexion/extension of the fourth metacarpophalangeal joint; ‘5pip flexion’ - flexion/extension of the fifth proximal interphalangeal joint; and ‘1cmc flexion’ - flexion/extension of the first carpo-metacarpal joint. (C) Difference in performance gauged by the coefficient of determination between decoders with LFADS and Gaussian smoothing for reach (gray) and grasp (blue). Each point denotes the mean performance increase across 10-fold cross-validation of all degrees of freedom pooled across monkeys for reach (2 monkeys with 2 DoFs each) and grasp (2 monkeys with 22 and 29 DoFs, respectively). All decoders were fit using a population of 37 M1 neurons. LFADS leads to significantly larger decoder performance improvement for reach than for grasp. Stars indicate significance of a Mann-Whitney-Wilcoxon test for unmatched samples: *** - alpha of 0.001 for one-sided alternative hypothesis.
Figure 2—figure supplement 1
Validation of LFADS.
(A) Reconstruction of single trials with Gaussian smoothing and LFADS for reach (top row) and grasp (bottom row). Leftmost column shows PSTHs for eight conditions (color-coded) computed using all training trials. Middle and right columns show single-trial PSTHs for test trials color-coded by condition computed with either gaussian smoothing or LFADS. (B) Improvement in the neural reconstruction (change in correlation coefficient) with LFADS compared to Gaussian smoothing for reach (gray) and grasp (blue). Red horizontal lines denote the respective means. Stars indicate significance of two-sample, one-sided t-test (α = 0.001). (C) Difference in performance between decoders based on LFADS and Gaussian smoothing (delta R2) for reach (gray) and grasp (blue) as a function of latent dimensionality (i.e. number of inferred factors) in the LFADS model. Error bars denote the standard error of the mean for all reconstructed joints pooled from across monkeys. All decoders were trained using a population of 37 M1 neurons. Decoder performance increase with LFADS was significantly larger for reach than for grasp with as few as five dimensions. Stars indicate significance of a one-sided Mann-Whitney-Wilcoxon test for unmatched samples (α = 0.001). Differences are significant for dimensionalities greater than 5. (D) Comparison of LFADS with (ordinate) and without (abscissa) the assumption of external inputs to the dynamical system of grasp. In LFADS with inputs, we relaxed the assumption of autonomy and allowed two controllers to perturb the internal dynamics. Each point denotes the mean R2 for each of 22 DoF of Monkey three in Dataset 3 (grasp 1, light blue) and 29 DoF of Monkey one in Dataset 4 (grasp 2, dark blue). Stars indicate significance of paired-sample one-sided Wilcoxon signed rank test (α = 0.001).
Figure 3 with 2 supplements
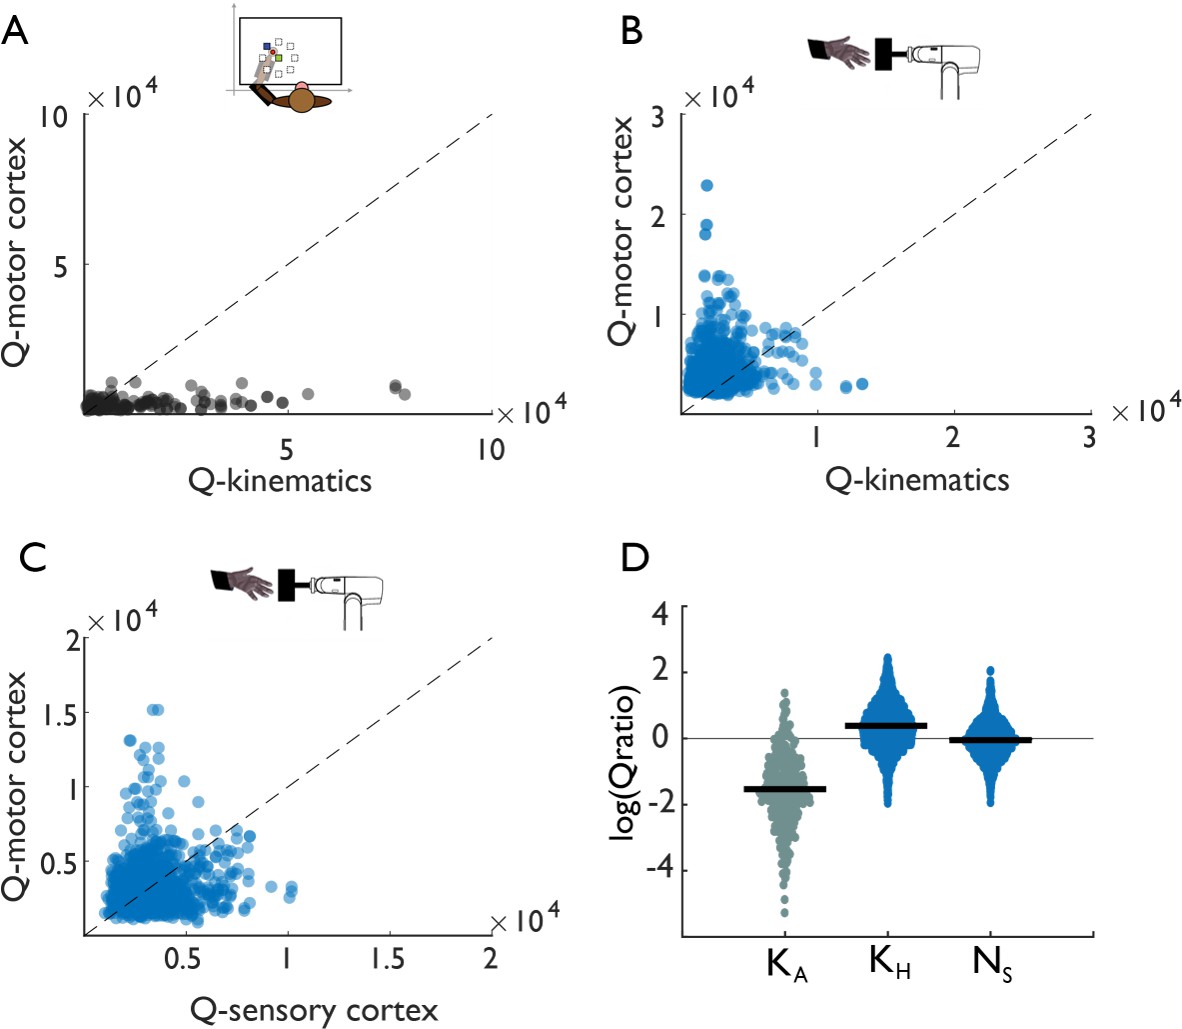
Tangling in reach and grasp.
(A) Tangling metric (Q) for population responses in motor cortex vs. Q for kinematics during reaching. Kinematic tangling is higher than neural tangling, consistent with motor cortex acting as a pattern generation during reach. (B) Q-M1 population vs. Q-kinematics for grasping. Neural tangling is higher than kinematic tangling, which argues against pattern generation as the dominant mode during grasp. (C) Q-M1 population vs. Q-SCx population. Neural tangling is similar in M1 and SCx. For plots A-C, each point represents the max Q value for a (trial-averaged) neural state at a single time point and single task condition for one monkey (Monkey 1, Dataset 1). (D) Log of Q-motor/Q-kinematics of the arm during reach (KA), Q-motor/Q-kinematics of the hand during grasp (KH), and Q-motor/Q-sensory during grasp (Ns). Each point represents the log-ratio for a single condition and time point (pooled across two monkeys each). Black bars denote the mean log-ratio. The differences between reaching-derived and grasping-derived log-ratios are significant and substantial (two-sample two-sided equal-variance t-test: KH | t(2978)=-43, p=1.03e-130; Ns |t(2978)=-39 p=1.87e-121). Tangling is insensitive to the precise dimensionality, provided it exceeds a minimum dimensionality (Figure 3—figure supplement 1).
Figure 3—figure supplement 1
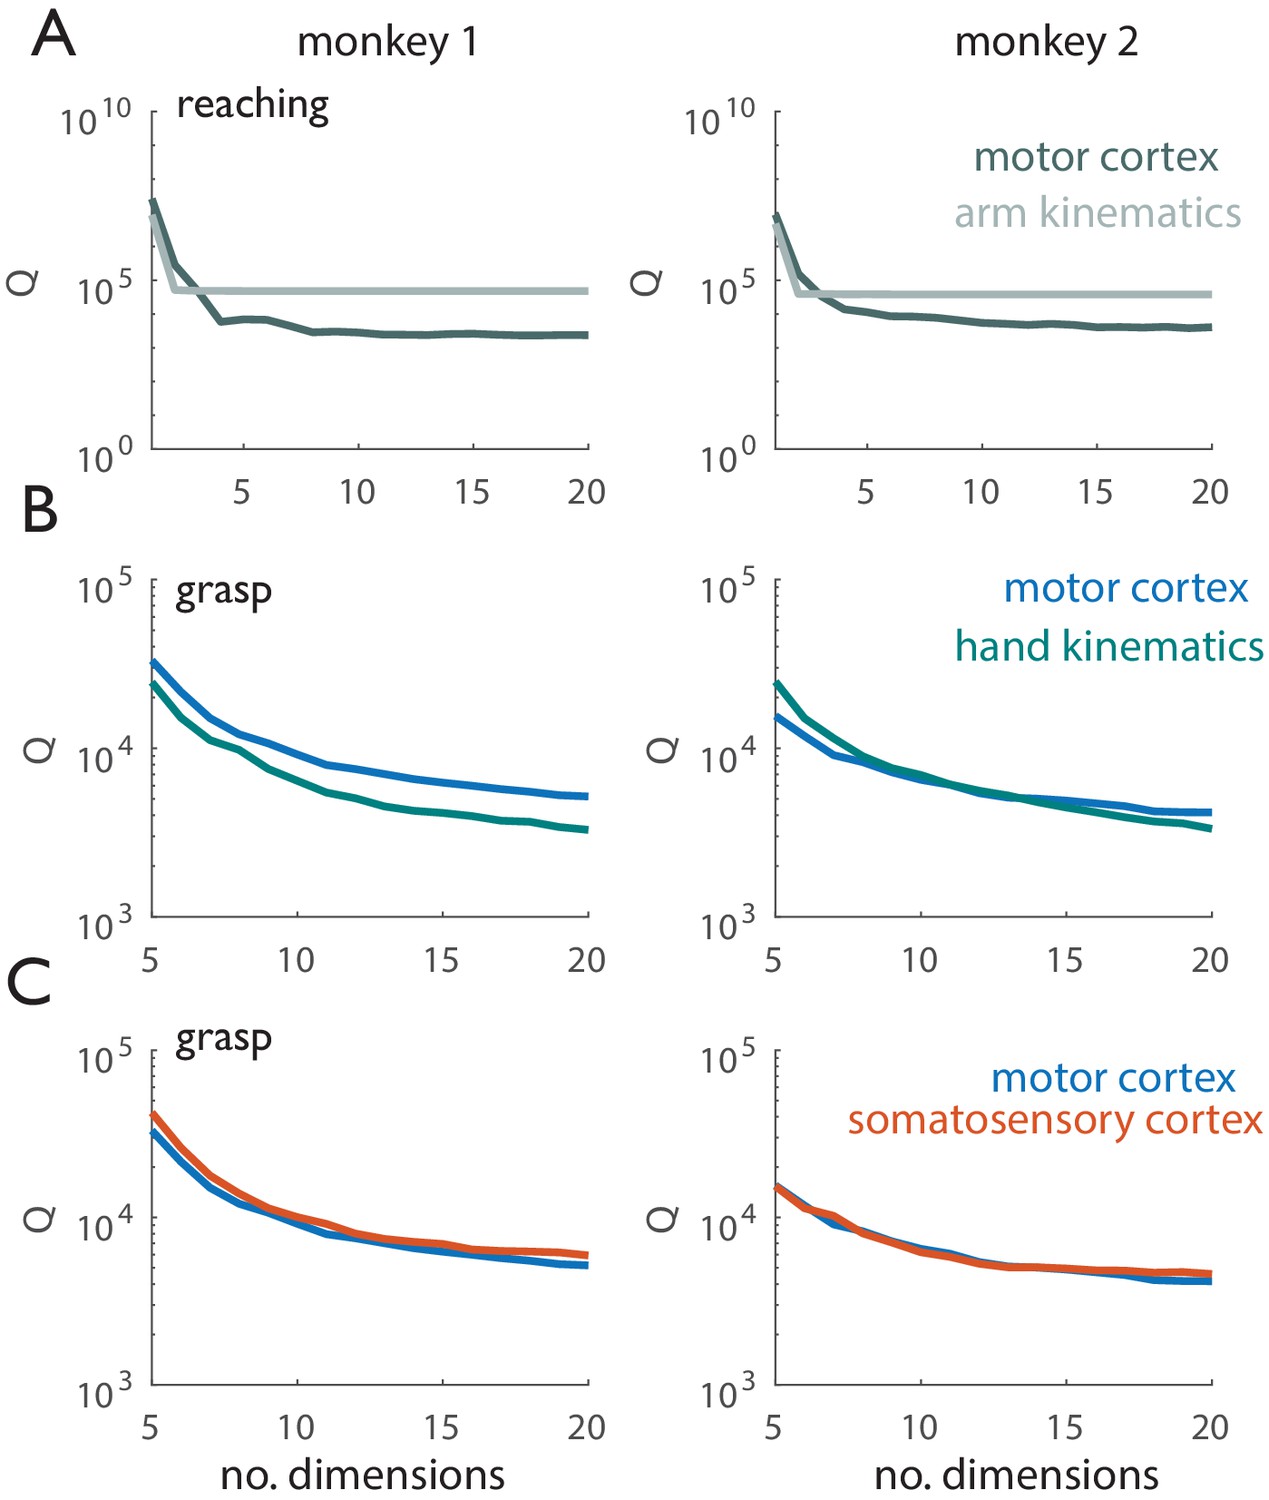
Tangling vs. dimensionality.
Left panels correspond to Monkey 1 (Dataset 1), right panels correspond to Monkey 2 (Dataset 2). (A) Tangling metric (90th percentile of Q, see Methods) vs. number of dimensions used to compute Q for reaching. Q values derived from motor cortical responses are shown in dark gray, Q values derived from kinematics are shown in light gray. Arm kinematics exhibit consistently higher tangling than do the corresponding population responses in motor cortex. (B) Tangling metric vs. number of dimensions used to compute Q for grasp. Q values derived from motor cortical responses are shown in blue, Q-values derived from hand kinematics are shown in green. When Q has leveled off for the kinematic and neural data (~20 dimensions), neuronal trajectories in motor cortex exhibit higher tangling than do the corresponding hand kinematic trajectories. (C) Tangling metric vs. number of dimensions used to compute Q for reaching in motor and somatosensory cortex. Q-values derived from motor cortical responses are shown in blue, those derived from somatosensory responses are shown in orange. Grasp-related responses in M1 and SCx exhibit similar tangling.
Figure 3—figure supplement 2
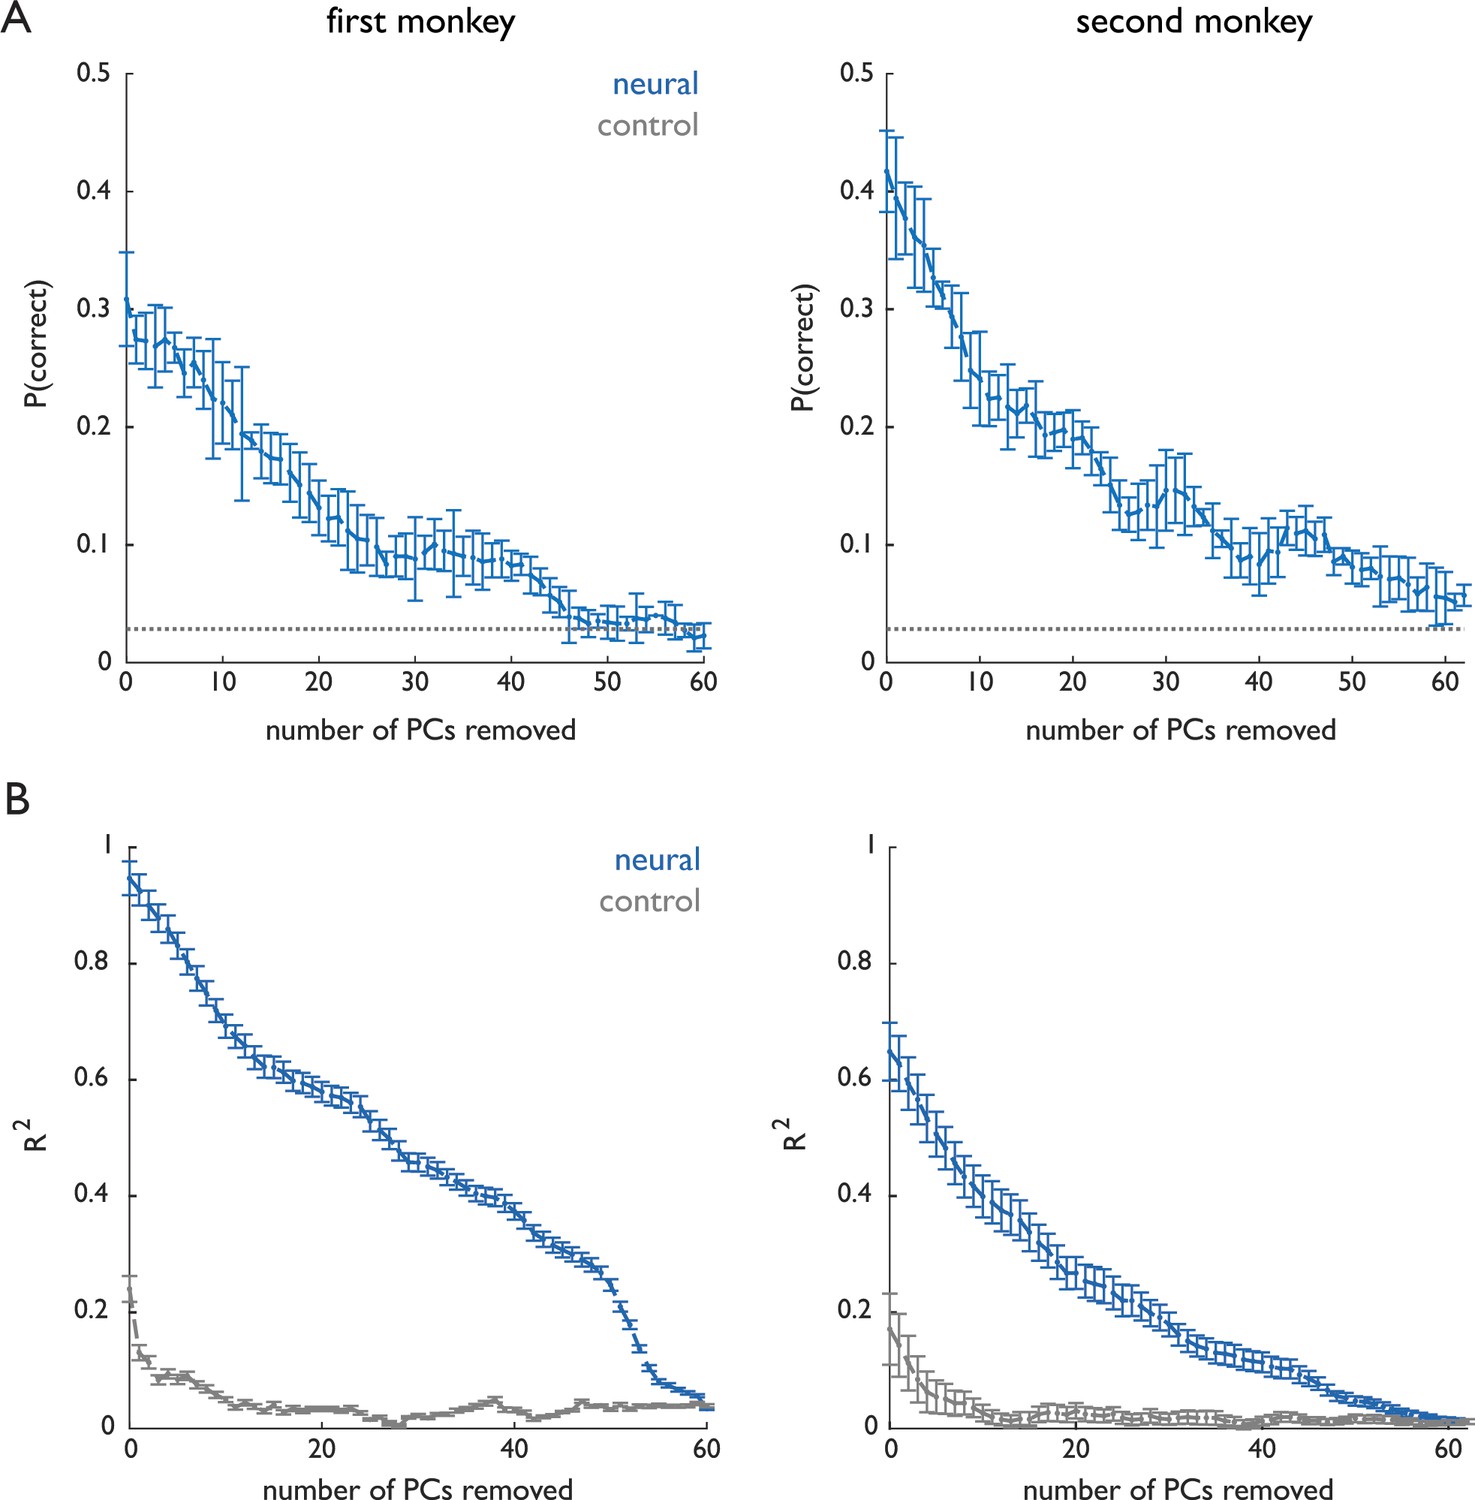
Dimensionality of grasp-related neuronal responses.
The first monkey (Dataset 1) performed a distinct grasp for nearly every object while the second monkey (Dataset 2) grasped many objects using very similar grasps, as evidenced by the fact that we could classify objects based on pre-contact hand posture with 84% accuracy for the first monkey and 33% accuracy for the second. These differences in the complexity of manual behaviors were reflected in the complexity of the associated neuronal responses. (A) Classification of grasped object based on the population response projected on progressively smaller subspaces – removing high-variance principal components first – remained above chance even after dozens of PCs were removed. (B) Continuous decoding of kinematics based on the population response projected on progressively smaller subspaces also remained above chance after removal of dozens of PCs. Classification and decoding performance is well above chance with over 20 dimensions removed, indicating that low-variance PCs still carry information about the behavior. Importantly, while the dimensionality of the response is systematically higher for the first monkey than it is for the second, dynamical systems analyses of both data sets yield identical conclusions. Chance performance was computed by randomly shifting spikes within each trial (preserving the spike count) and applying the Kalman filter to the shuffled spike trains.
Additional files
-
Supplementary file 1
Datasets and related analyses and figures.
- https://cdn.elifesciences.org/articles/58848/elife-58848-supp1-v2.docx
Download links
A two-part list of links to download the article, or parts of the article, in various formats.
Downloads (link to download the article as PDF)
Open citations (links to open the citations from this article in various online reference manager services)
Cite this article (links to download the citations from this article in formats compatible with various reference manager tools)
Neural population dynamics in motor cortex are different for reach and grasp
eLife 9:e58848.
https://doi.org/10.7554/eLife.58848


