Effects of lifelong testosterone exposure on health and disease using Mendelian randomization
- Population Health Research Institute, David Braley Cardiac, Vascular and Stroke Research Institute, Canada
- Thrombosis and Atherosclerosis Research Institute, David Braley Cardiac, Vascular and Stroke Research Institute, Canada
- Department of Medical Sciences, McMaster University, Canada
- Department of Biochemistry and Biomedical Sciences, McMaster University, Canada
- Department of Medicine, McMaster University, Hamilton Health Sciences, Canada
- Department of Kinesiology, McMaster University, Canada
- Department of Pathology and Molecular Medicine, McMaster University, Michael G. DeGroote School of Medicine, Canada
- Department of Health Research Methods, Evidence, and Impact, McMaster University, Canada
Figures
Figure 1 with 6 supplements
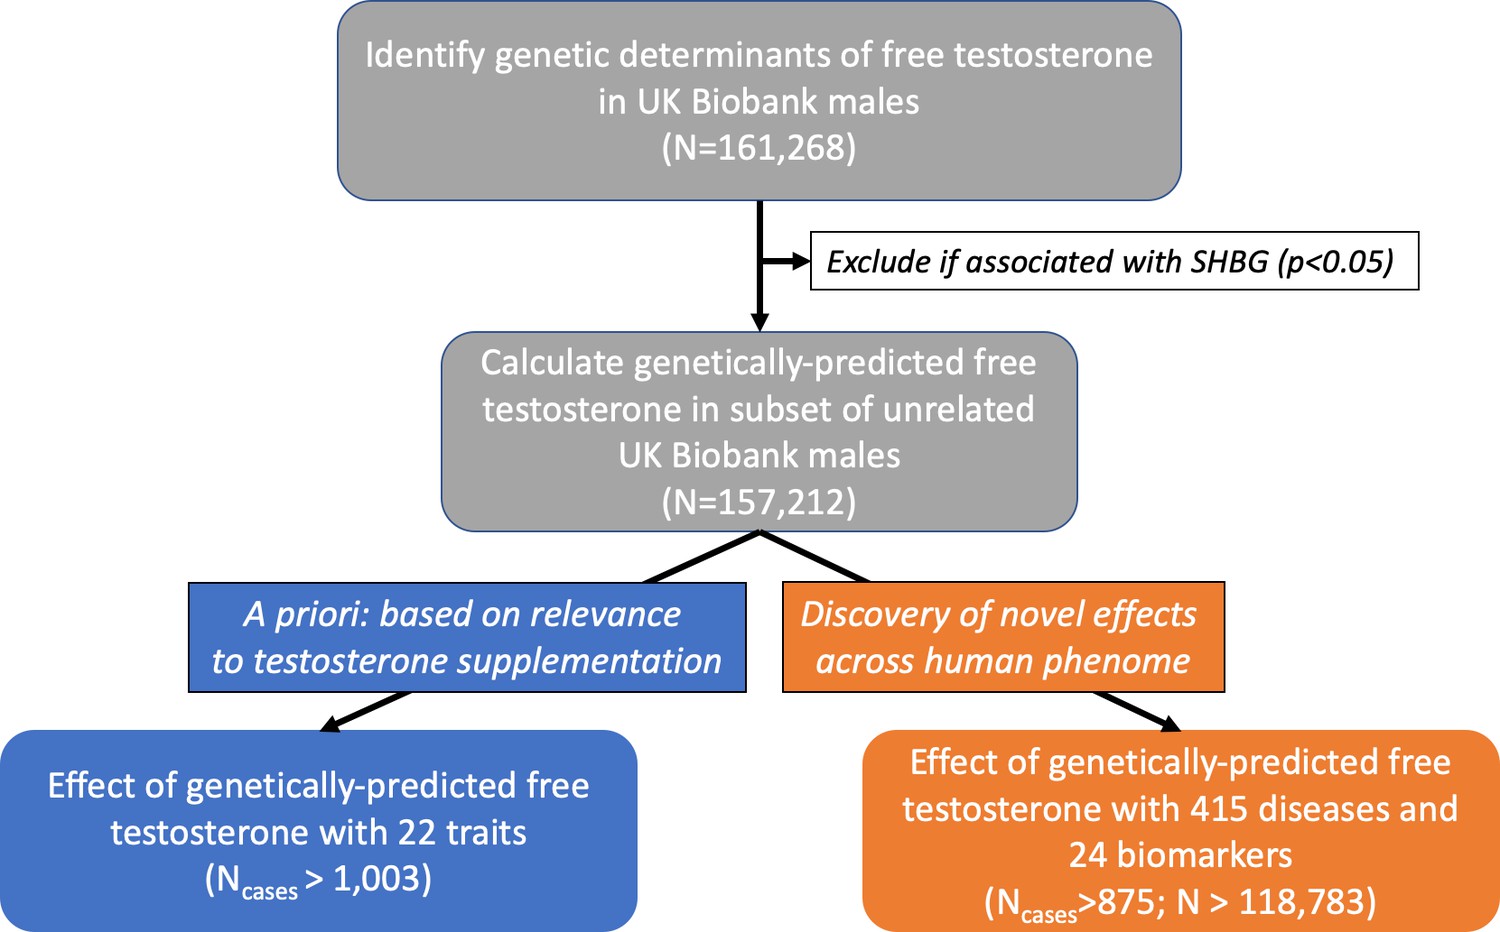
Flowchart depicting overall study design.
Free testosterone levels were calculated in males from the UK Biobank cohort. Then, genetic variants were tested for association with levels of CFT and carried forward if: genome-wide significant (p<5×10⁻⁸) and unassociated with SHBG (p<0.05). In the subset of unrelated males, these genetic variants were used to investigate the effect of genetically-predicted CFT on: (1) 22 a priori outcomes relevant to suspected effects of testosterone treatment using Mendelian randomization, and (2) 439 outcomes in a hypothesis-free approach using a weighted genetic risk score. CFT, calculated free testosterone; MR, Mendelian randomization; SHBG, sex hormone-binding globulin.
Figure 1—figure supplement 1
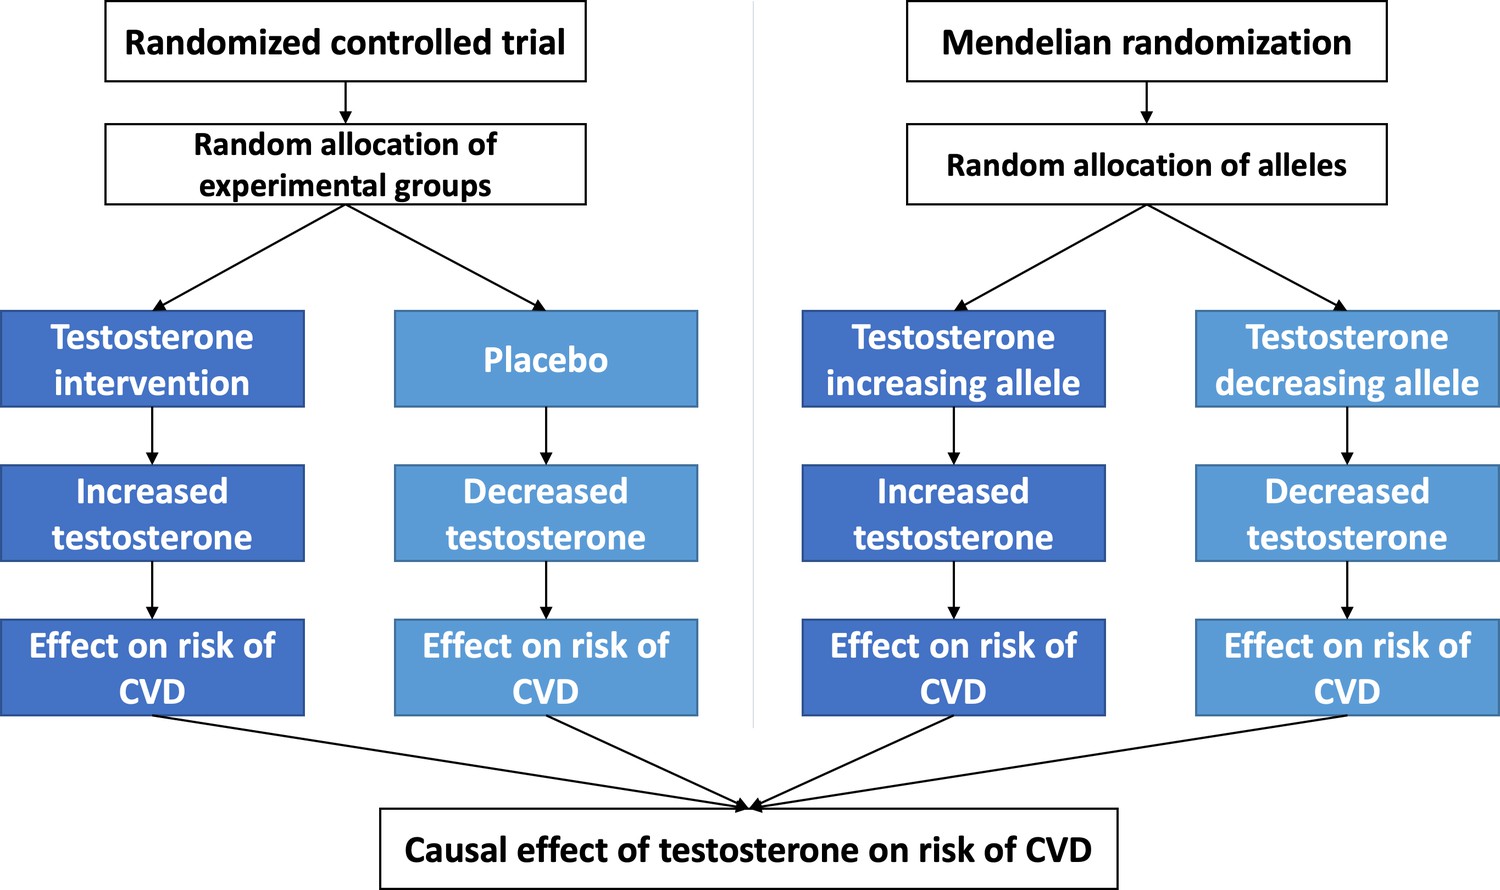
Comparison of randomized controlled trial (RCT) and Mendelian randomization (MR) study designs demonstrating the common foundation behind interpretation of a causal effect of testosterone on cardiovascular disease (CVD).
In accordance with Mendel’s second law, random and independent inheritance of alleles can be thought of akin to random allocation of treatment vs. placebo in RCT. Therefore, by the same reasoning, if MR finds genetic variants affecting testosterone are associated with a difference in CVD risk, it provides evidence that testosterone causally affects CVD.
Figure 1—figure supplement 2
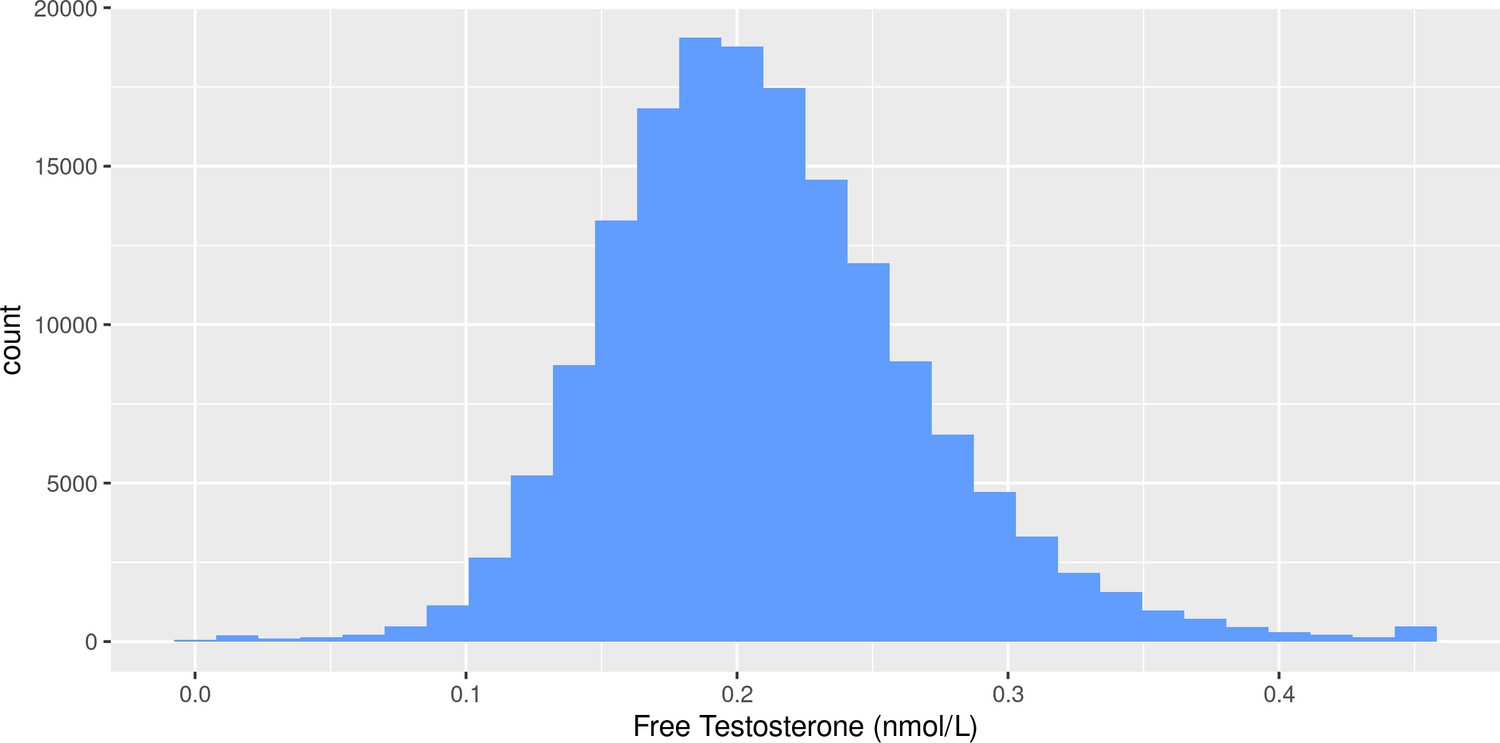
Distribution of free testosterone levels calculated using the Vermeulen equation in males from the UK Biobank cohort.
Figure 1—figure supplement 3
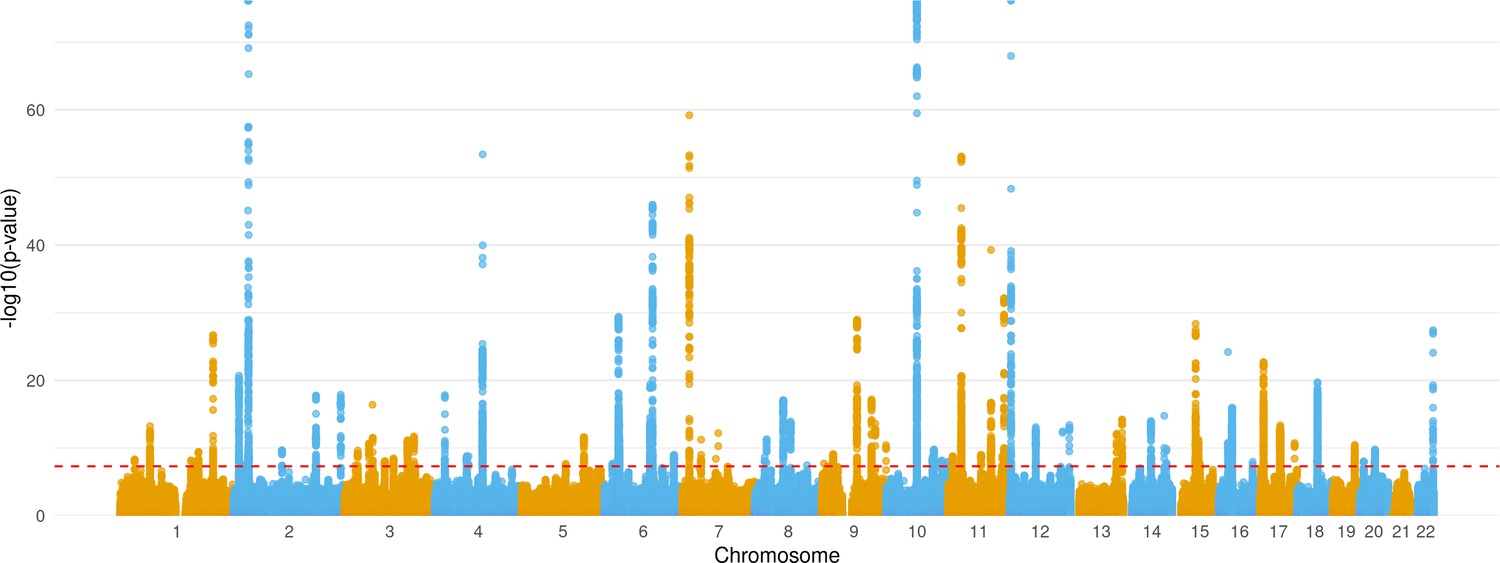
Manhattan plot showing distribution of p-values from genome-wide association study of calculated free testosterone after exclusion of SHBG-associated variants based on chromosomal location.
Figure 1—figure supplement 4
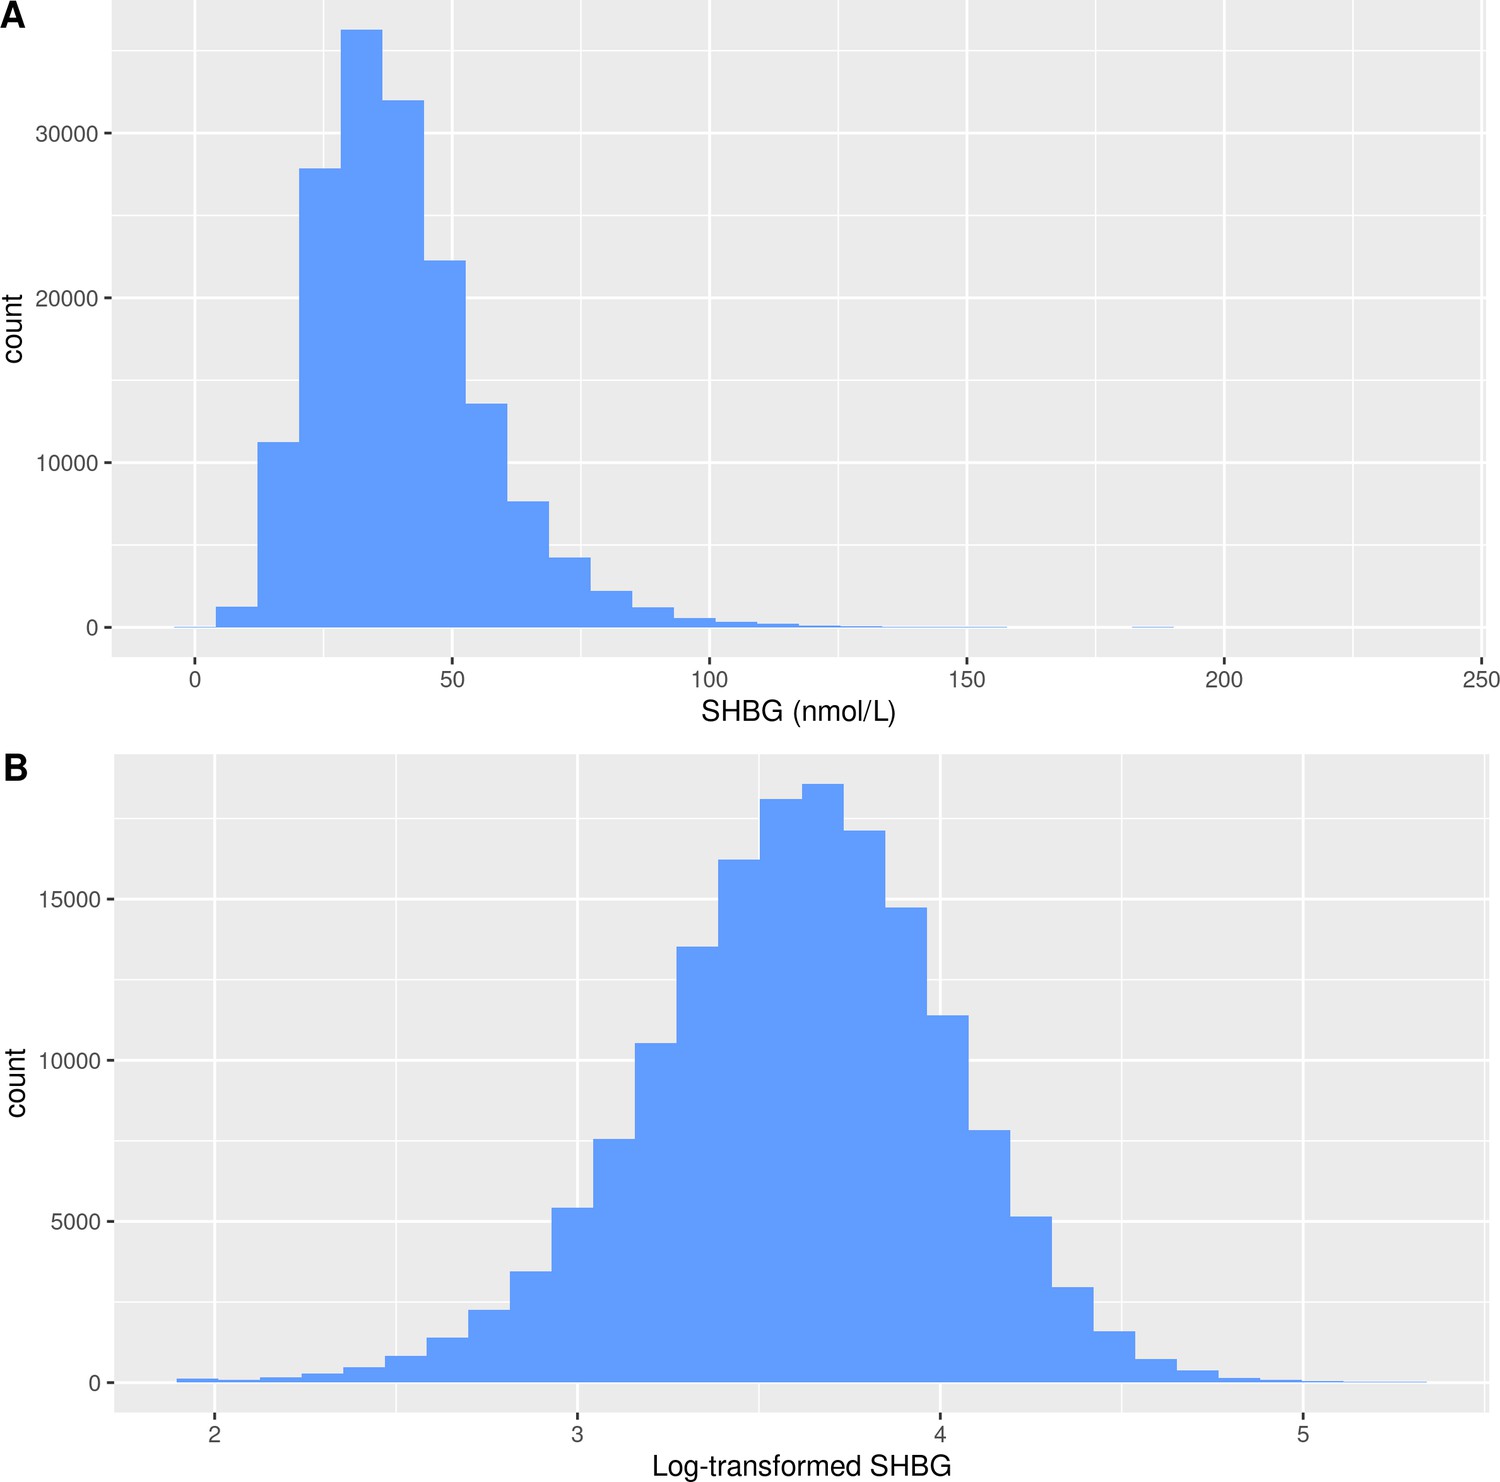
Distribution of sex hormone-binding globulin in males from the UK Biobank.
(A) Distribution of raw sex hormone-binding globulin levels in males from the UK Biobank cohort (B) Distribution of natural log-transformed sex hormone-binding globulin levels in males from the UK Biobank cohort.
Figure 1—figure supplement 5
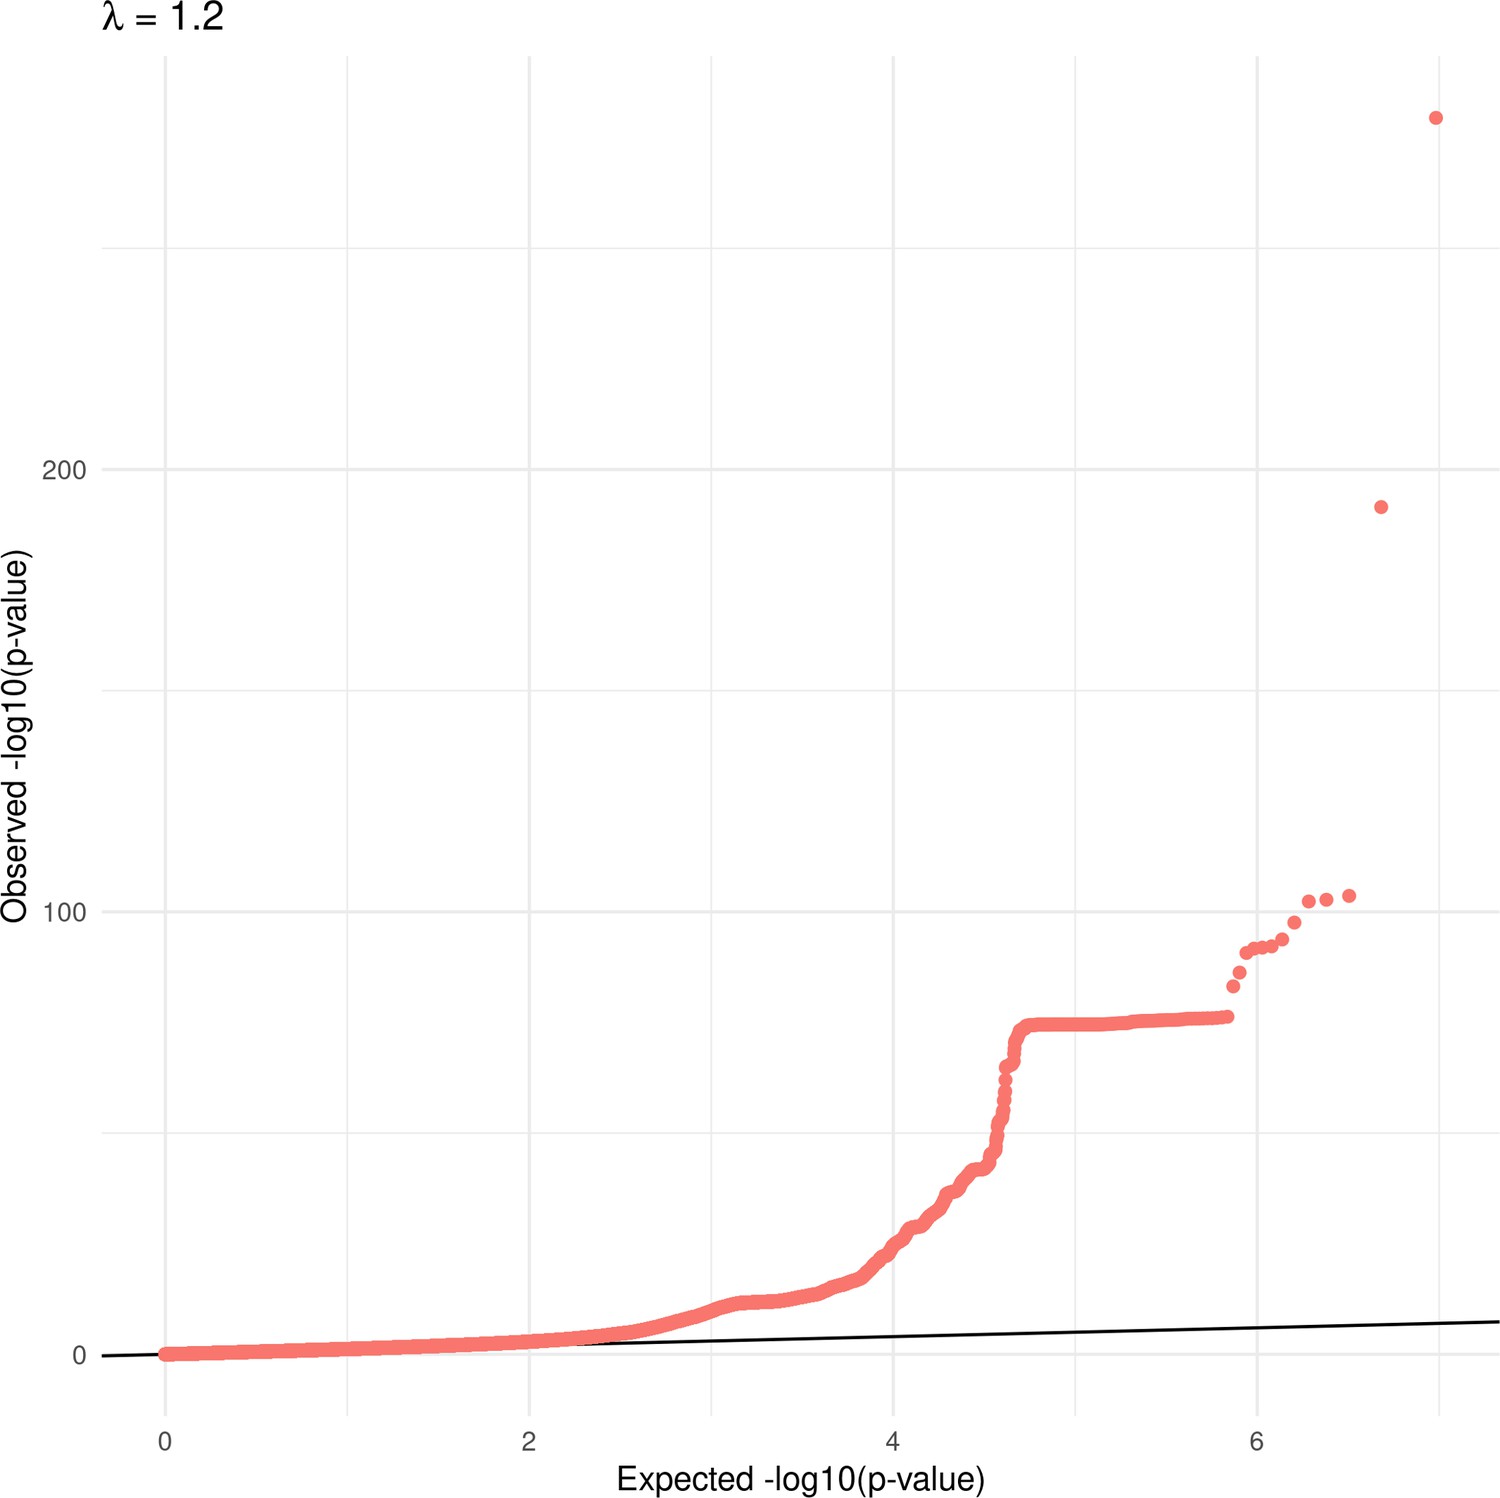
Quantile-quantile plot for genome-wide association study of calculated free testosterone levels (before exclusion of SHBG-associated genetic variants).
Plot shows observed test statistics (y-axis) relative to expected test statistics under a null model (x-axis), and lambda (λ) represents genomic inflation factor.
Figure 1—figure supplement 6
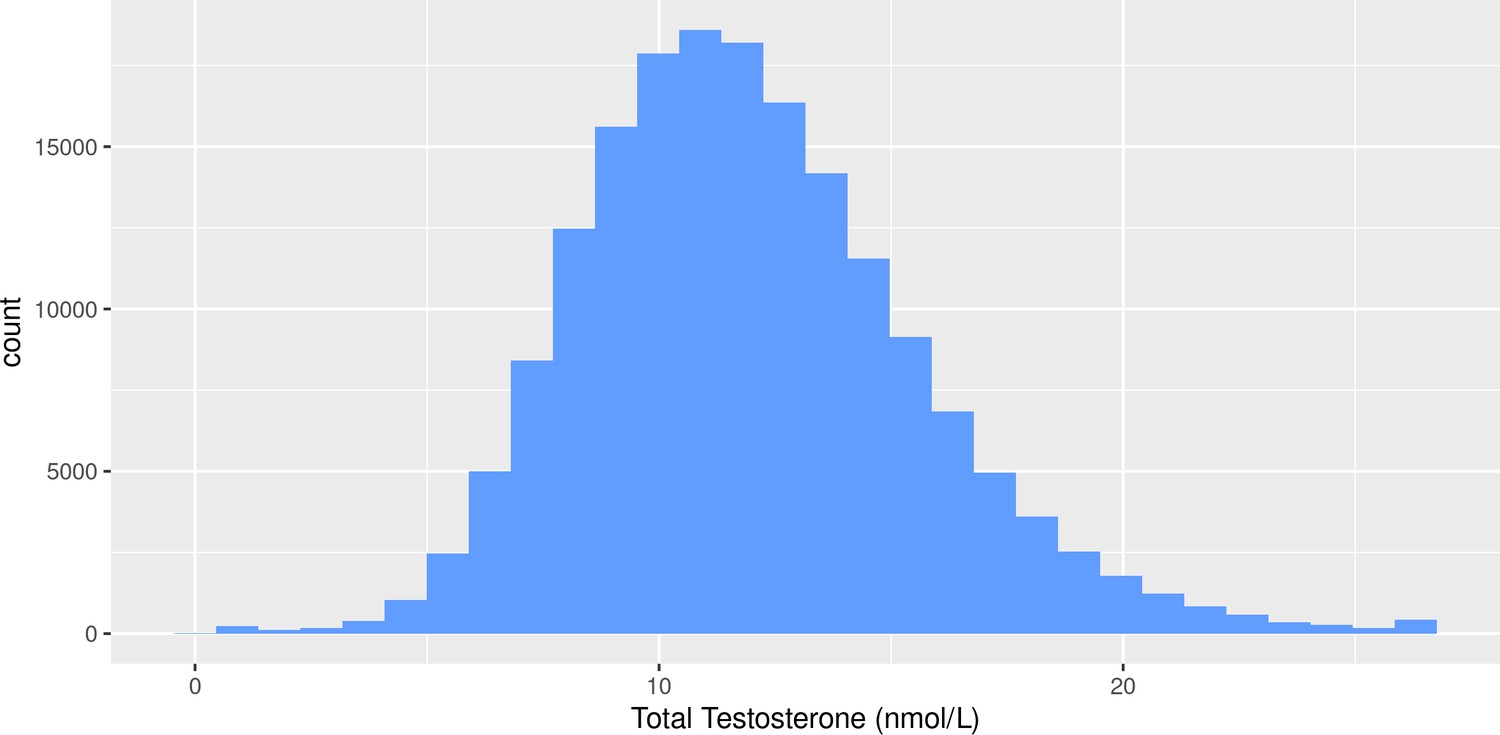
Distribution of total testosterone levels in males from the UK Biobank cohort.
Figure 2
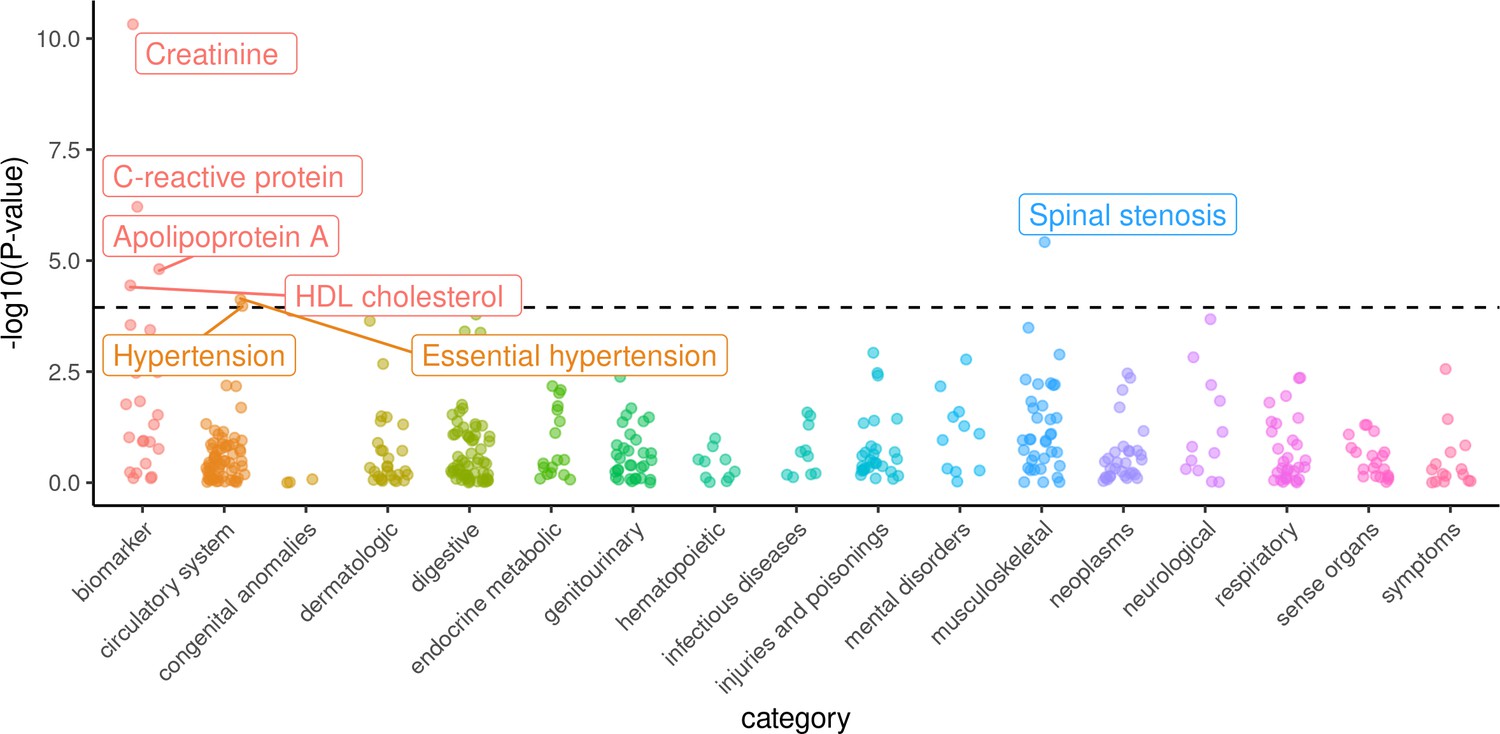
Phenome-wide survey of effects of genetically-predicted calculated free testosterone on 439 health outcomes in males from the UK Biobank.
Logistic or linear regression was used to assess the association of the genetic score for free testosterone against each dichotomous or quantitative outcome, respectively. -log10(p-values) for the association of each outcome on the y-axis are stratified into subcategories on the x-axis. Labelled outcomes were statistically significant adjusting for multiple hypothesis testing (p<1.14×10⁻⁴).
-
Figure 2—source data 1
Associations of genetically-predicted calculated free testosterone for 439 health outcomes across the human phenome.
- https://cdn.elifesciences.org/articles/58914/elife-58914-fig2-data1-v2.xlsx
Figure 3 with 6 supplements
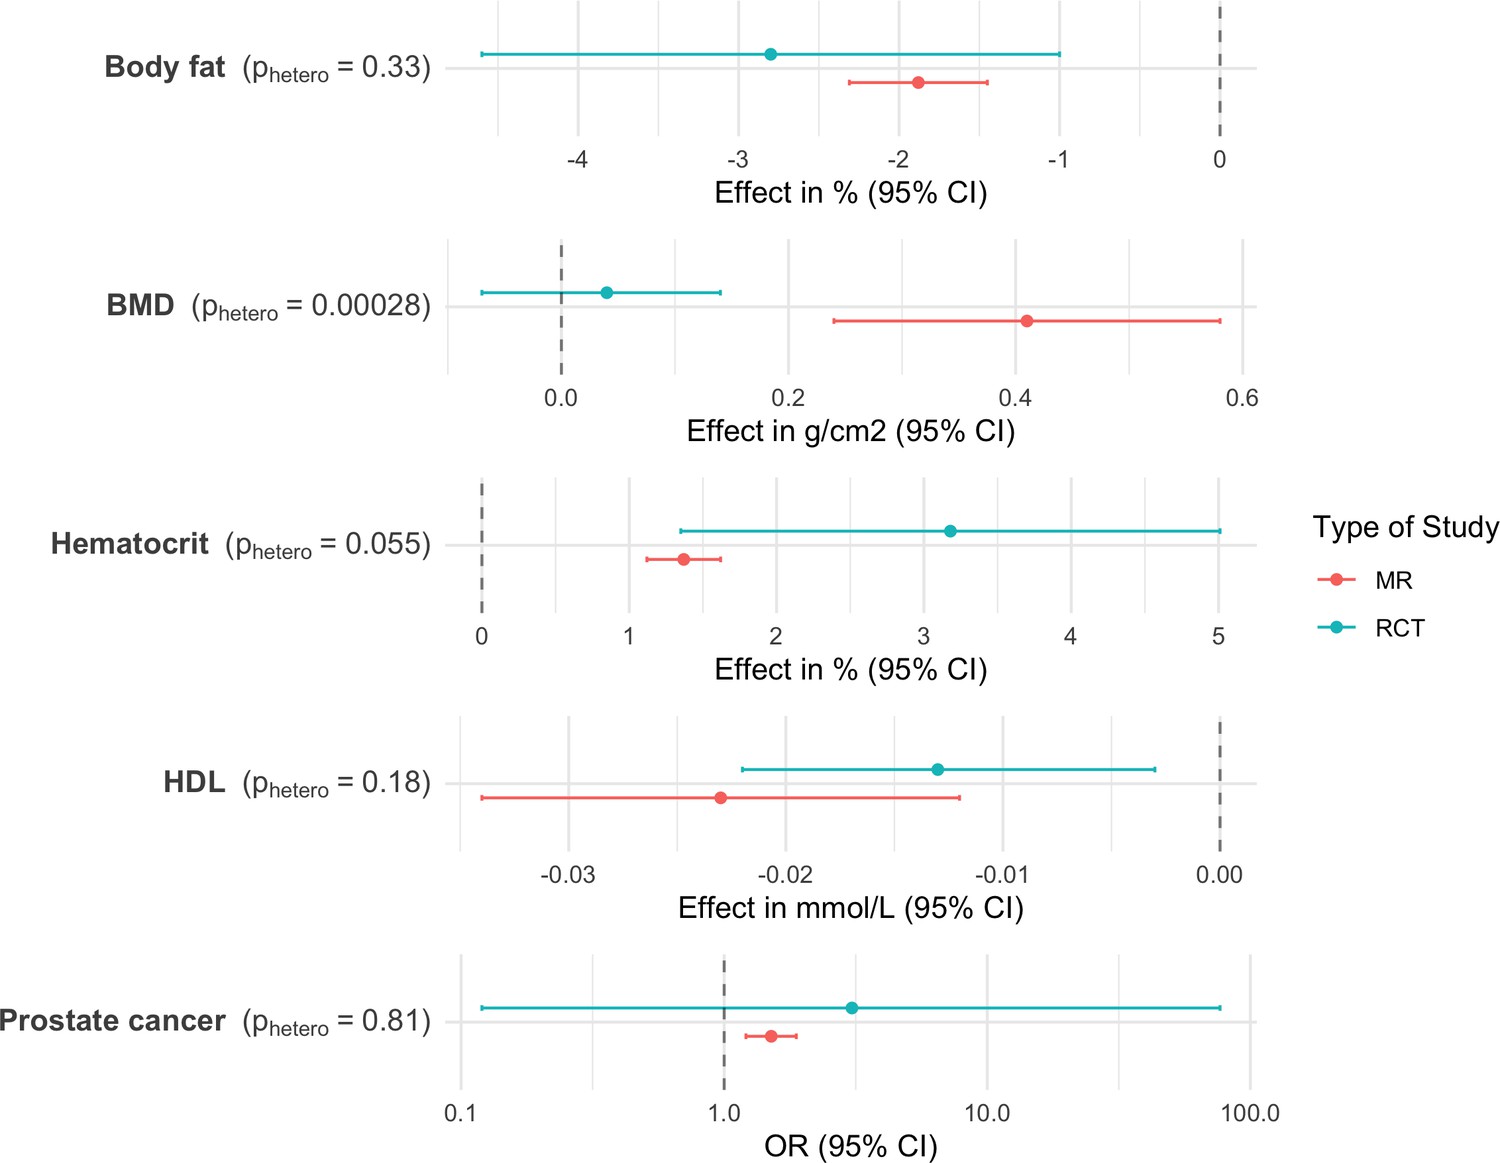
Comparison of effect sizes reported in randomized controlled trials and Mendelian randomization analyses.
Error bars indicate 95% confidence intervals around the effect estimate. MR effect estimates are reported in terms of 0.1 nmol/L of CFT to approximate expected effect sizes after initiation of testosterone treatment (Bhasin et al., 2018b).
Figure 3—figure supplement 1
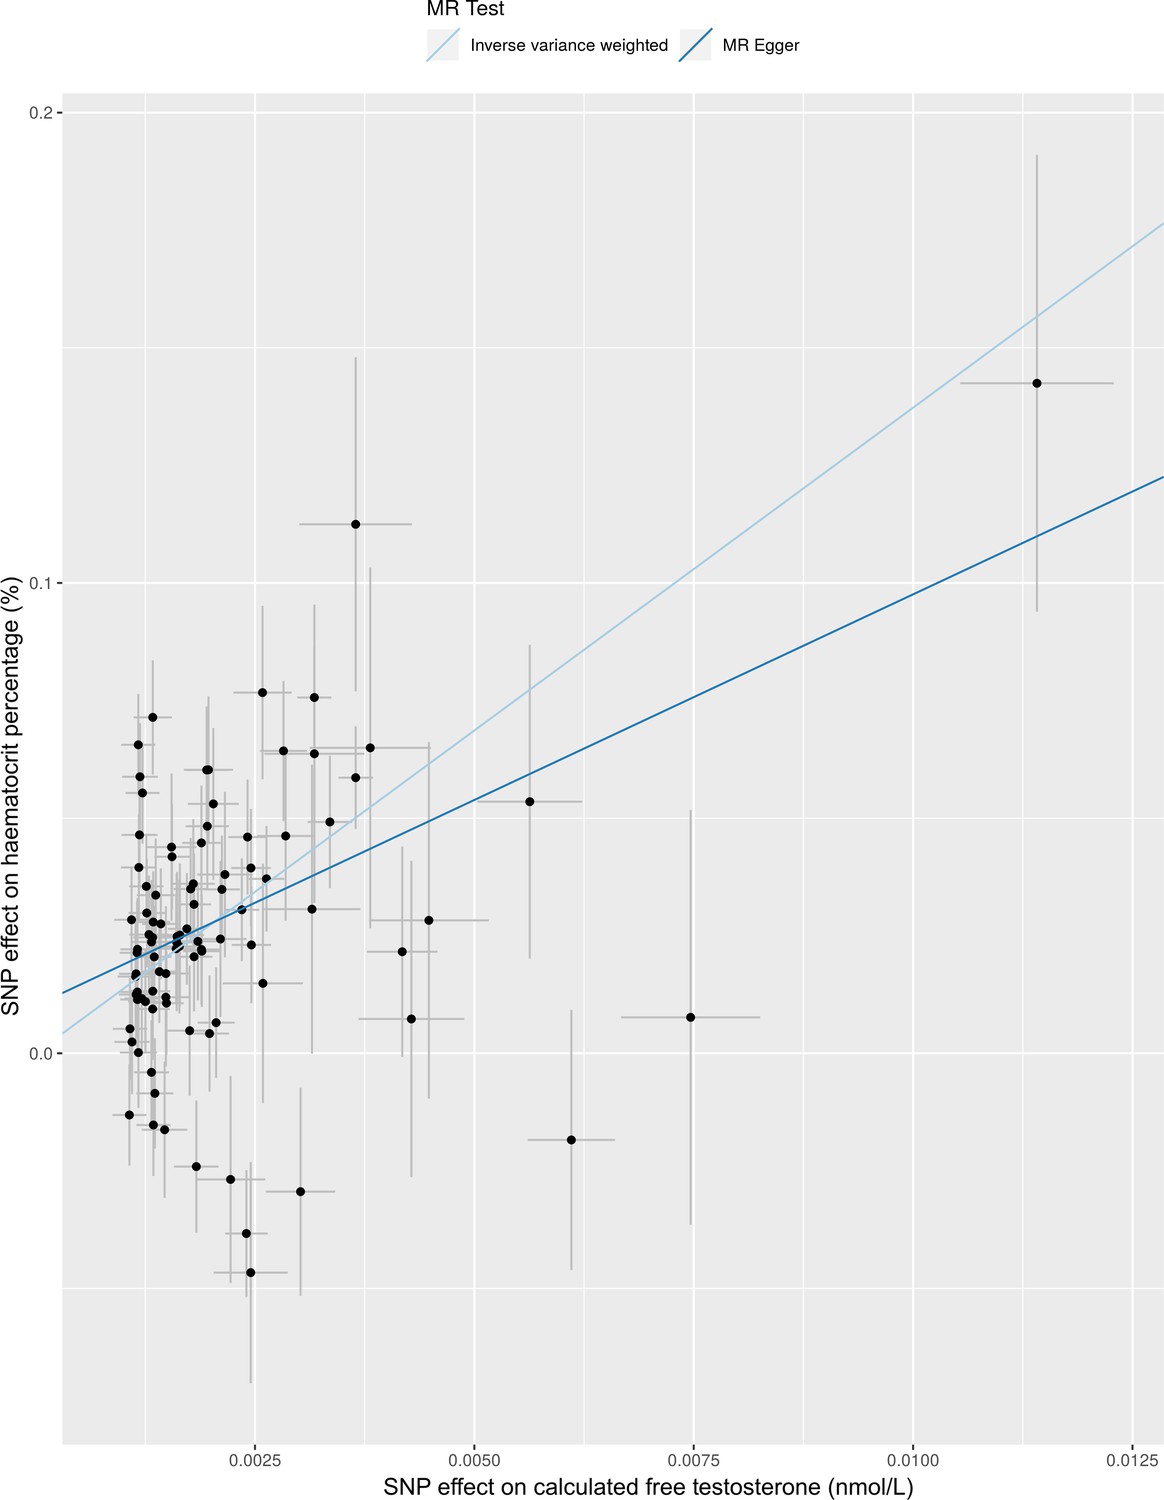
Comparison of effect of calculated free testosterone on hematocrit percentage using Mendelian randomization with IVW and Egger regression methods.
Figure 3—figure supplement 2
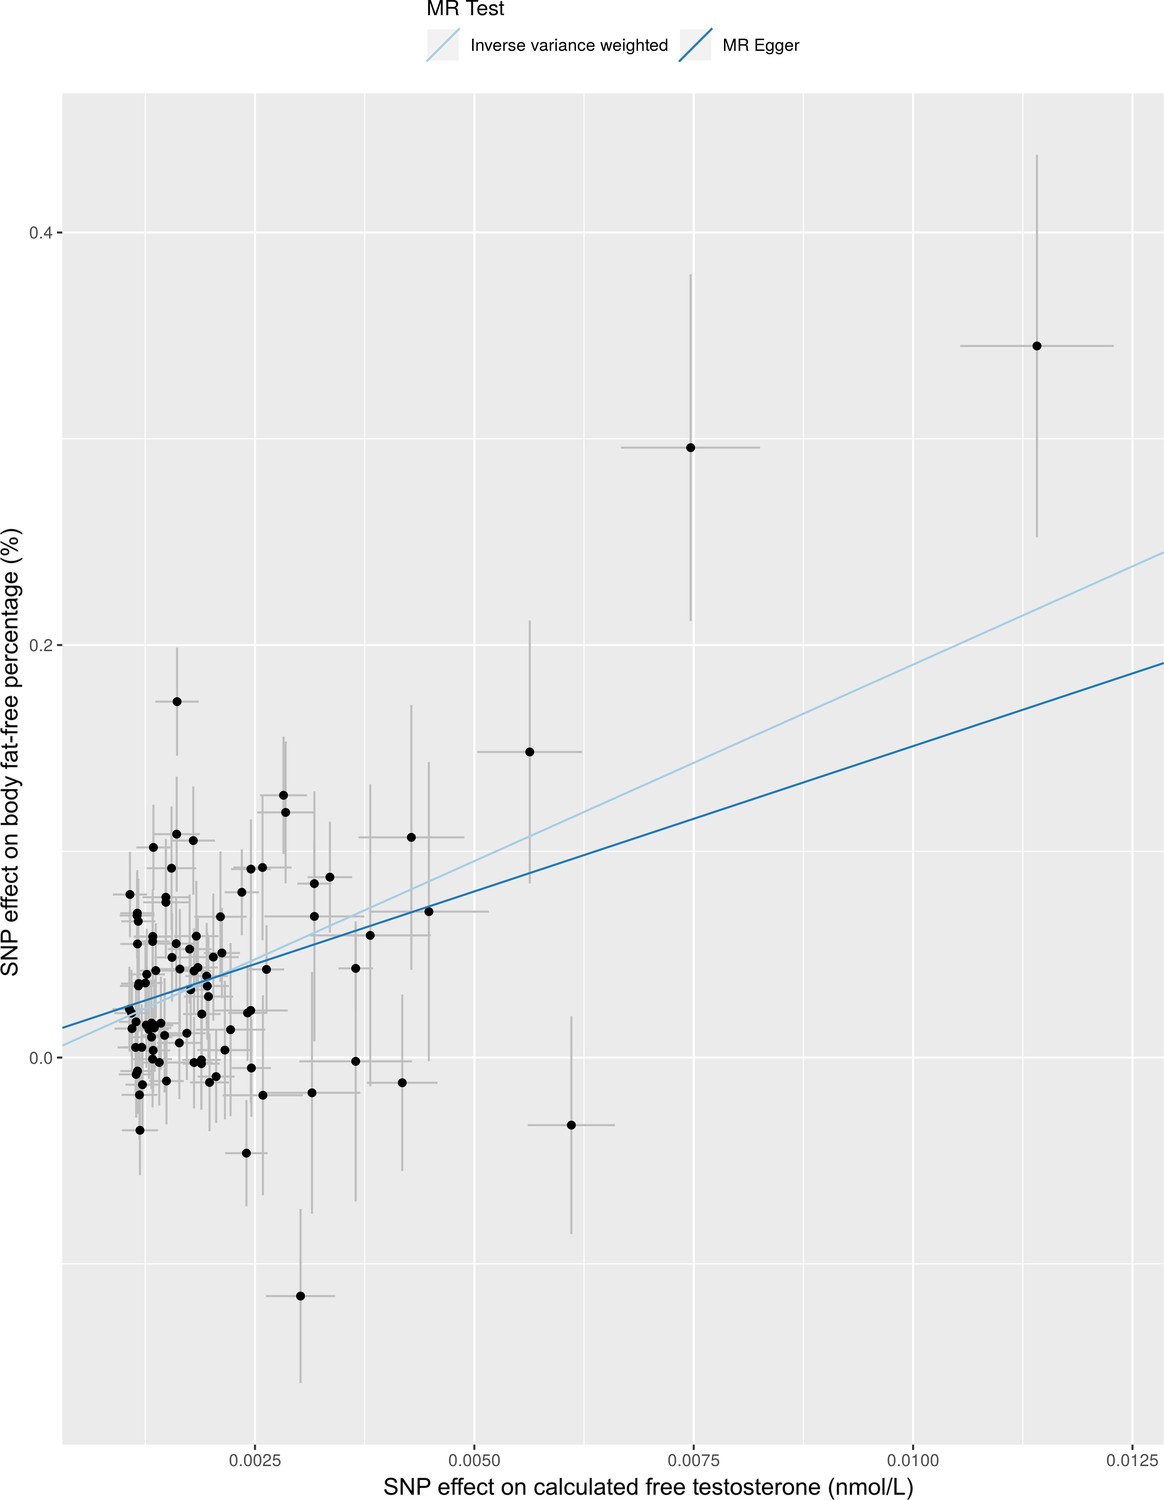
Comparison of effect of calculated free testosterone on body fat-free percentage using Mendelian randomization with IVW and Egger regression methods.
Figure 3—figure supplement 3
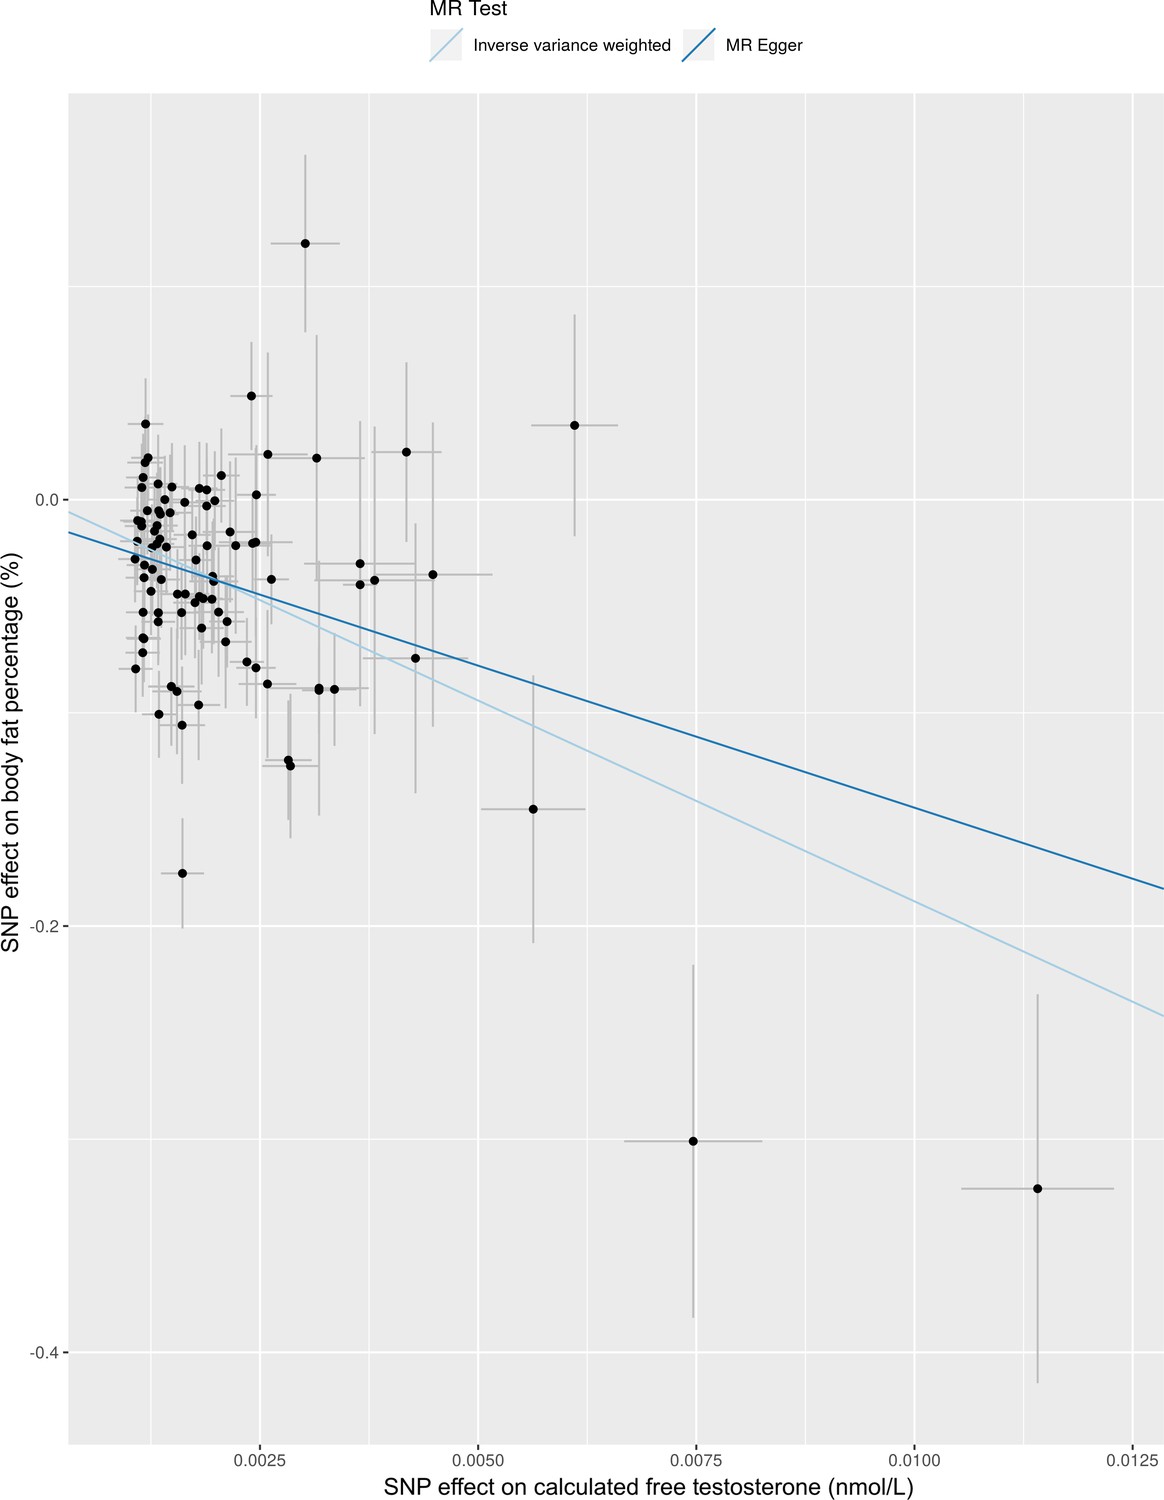
Comparison of effect of calculated free testosterone on body fat percentage using Mendelian randomization with IVW and Egger regression methods.
Figure 3—figure supplement 4
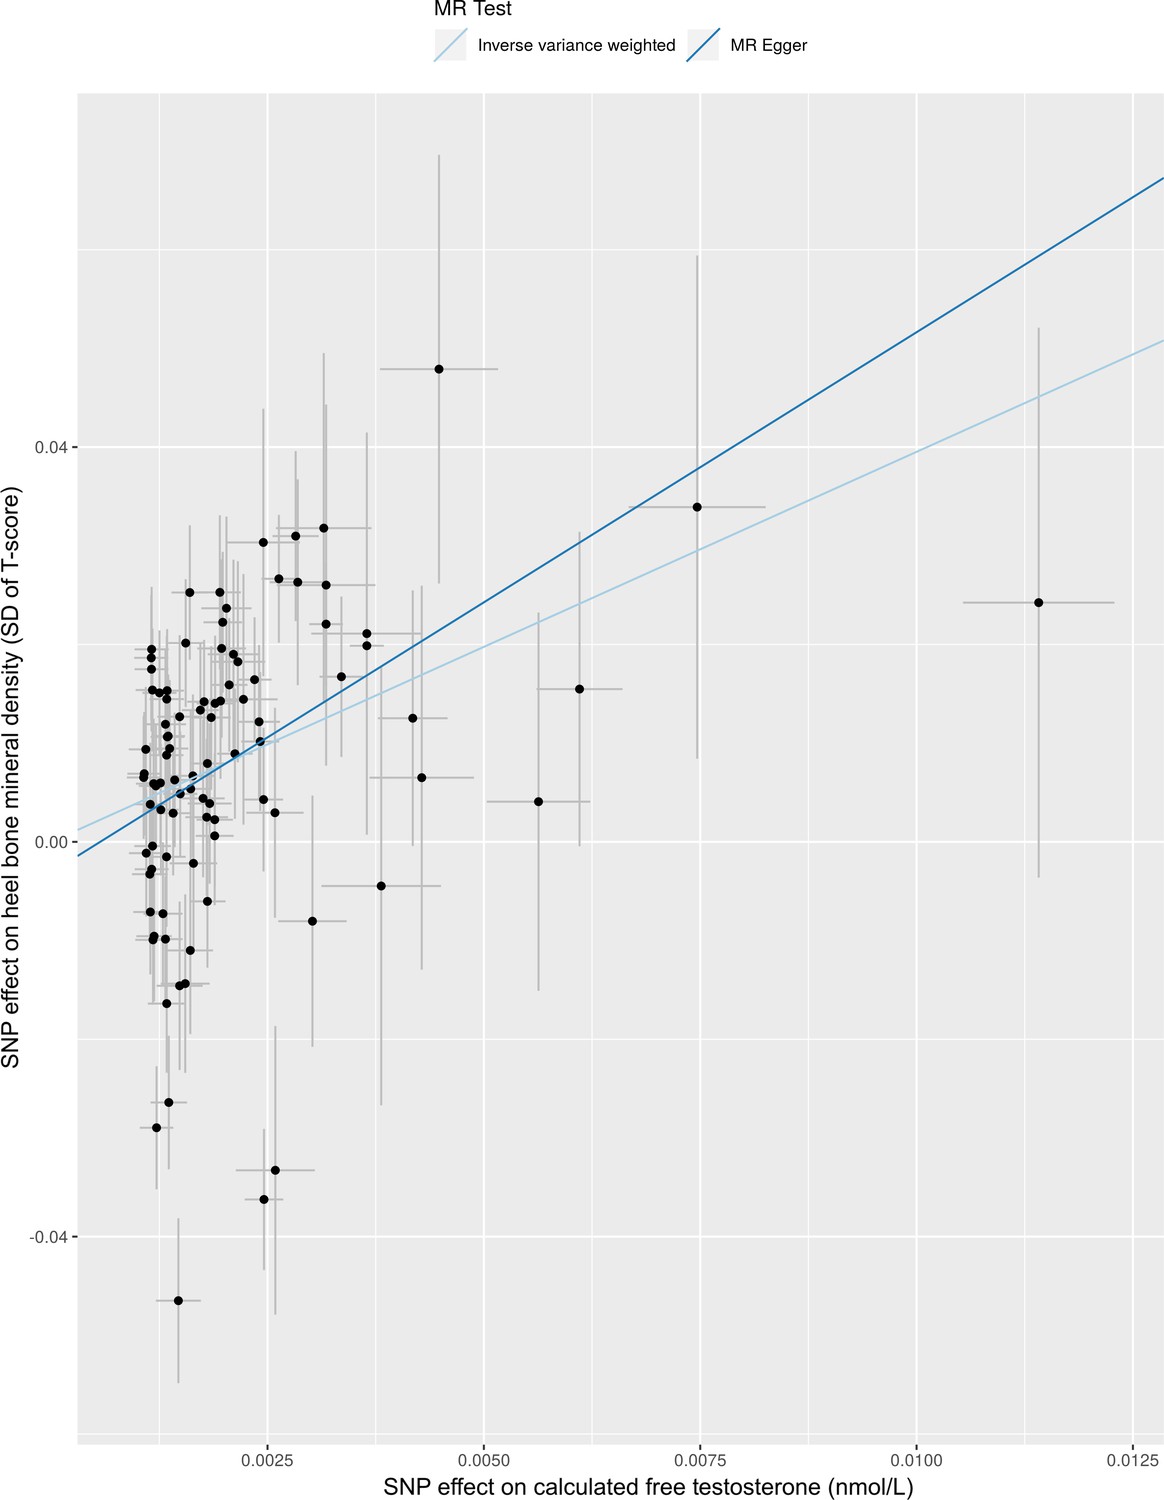
Comparison of effect of calculated free testosterone on heel bone mineral density using Mendelian randomization with IVW and Egger regression methods.
Figure 3—figure supplement 5
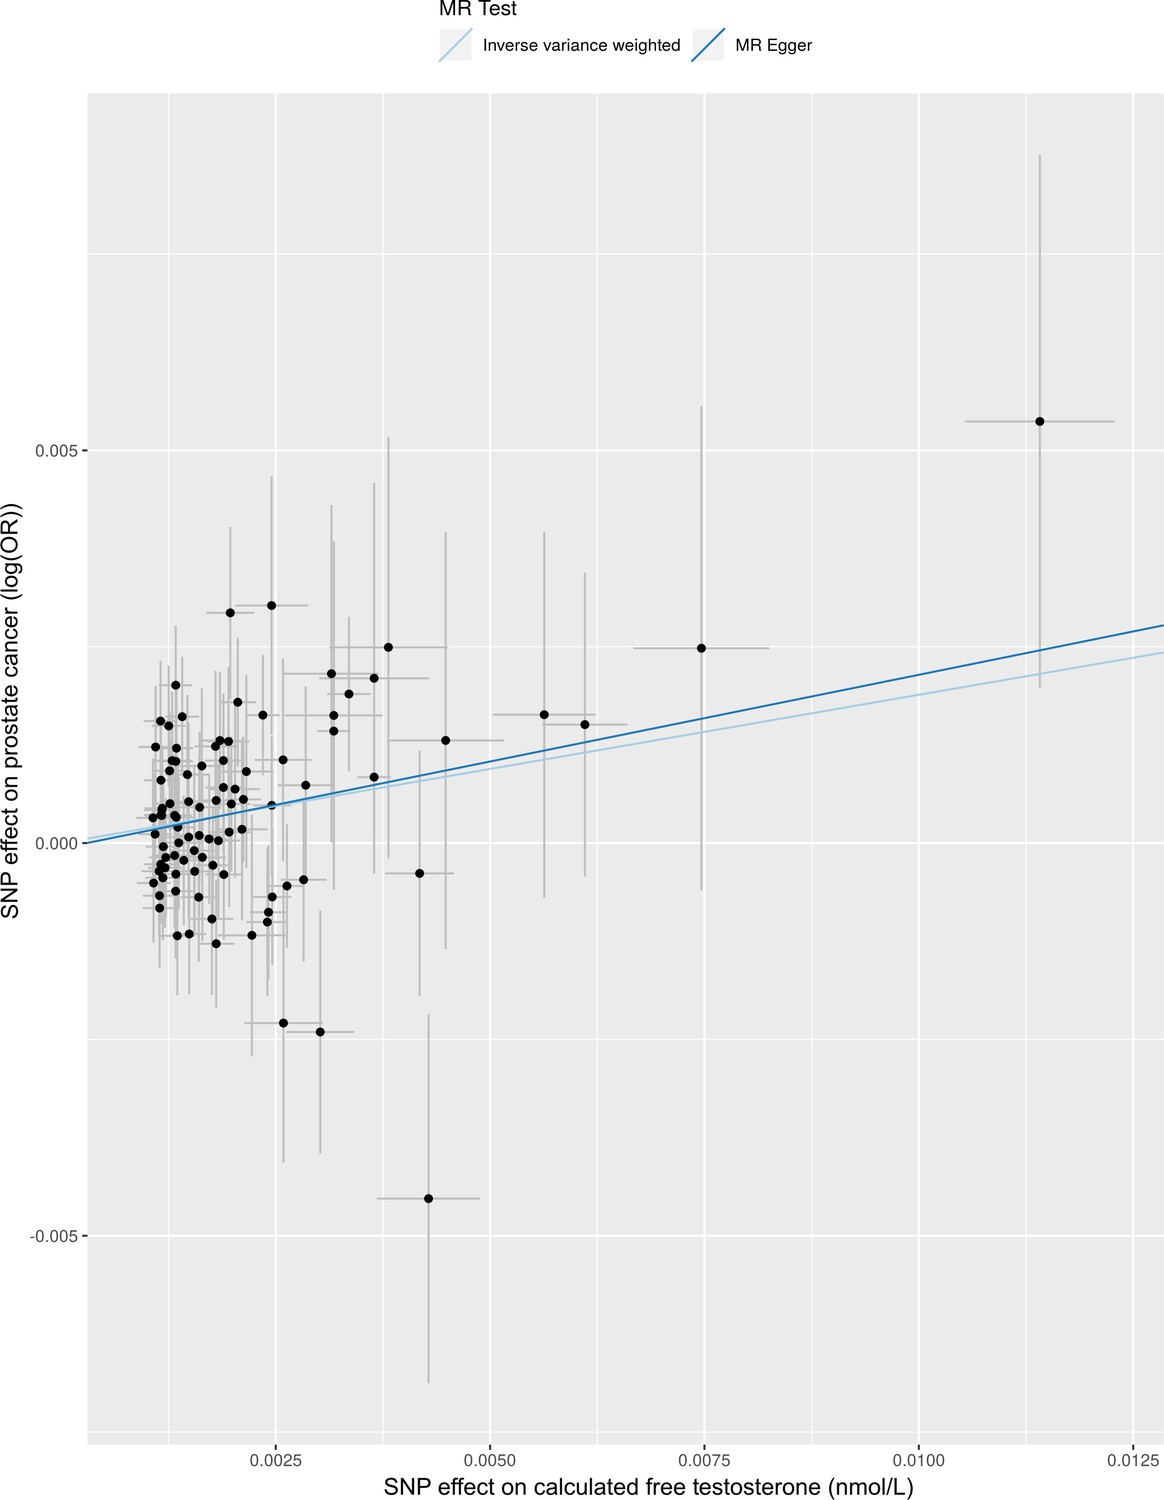
Comparison of effect of calculated free testosterone on prostate cancer using Mendelian randomization with IVW and Egger regression methods.
Figure 3—figure supplement 6
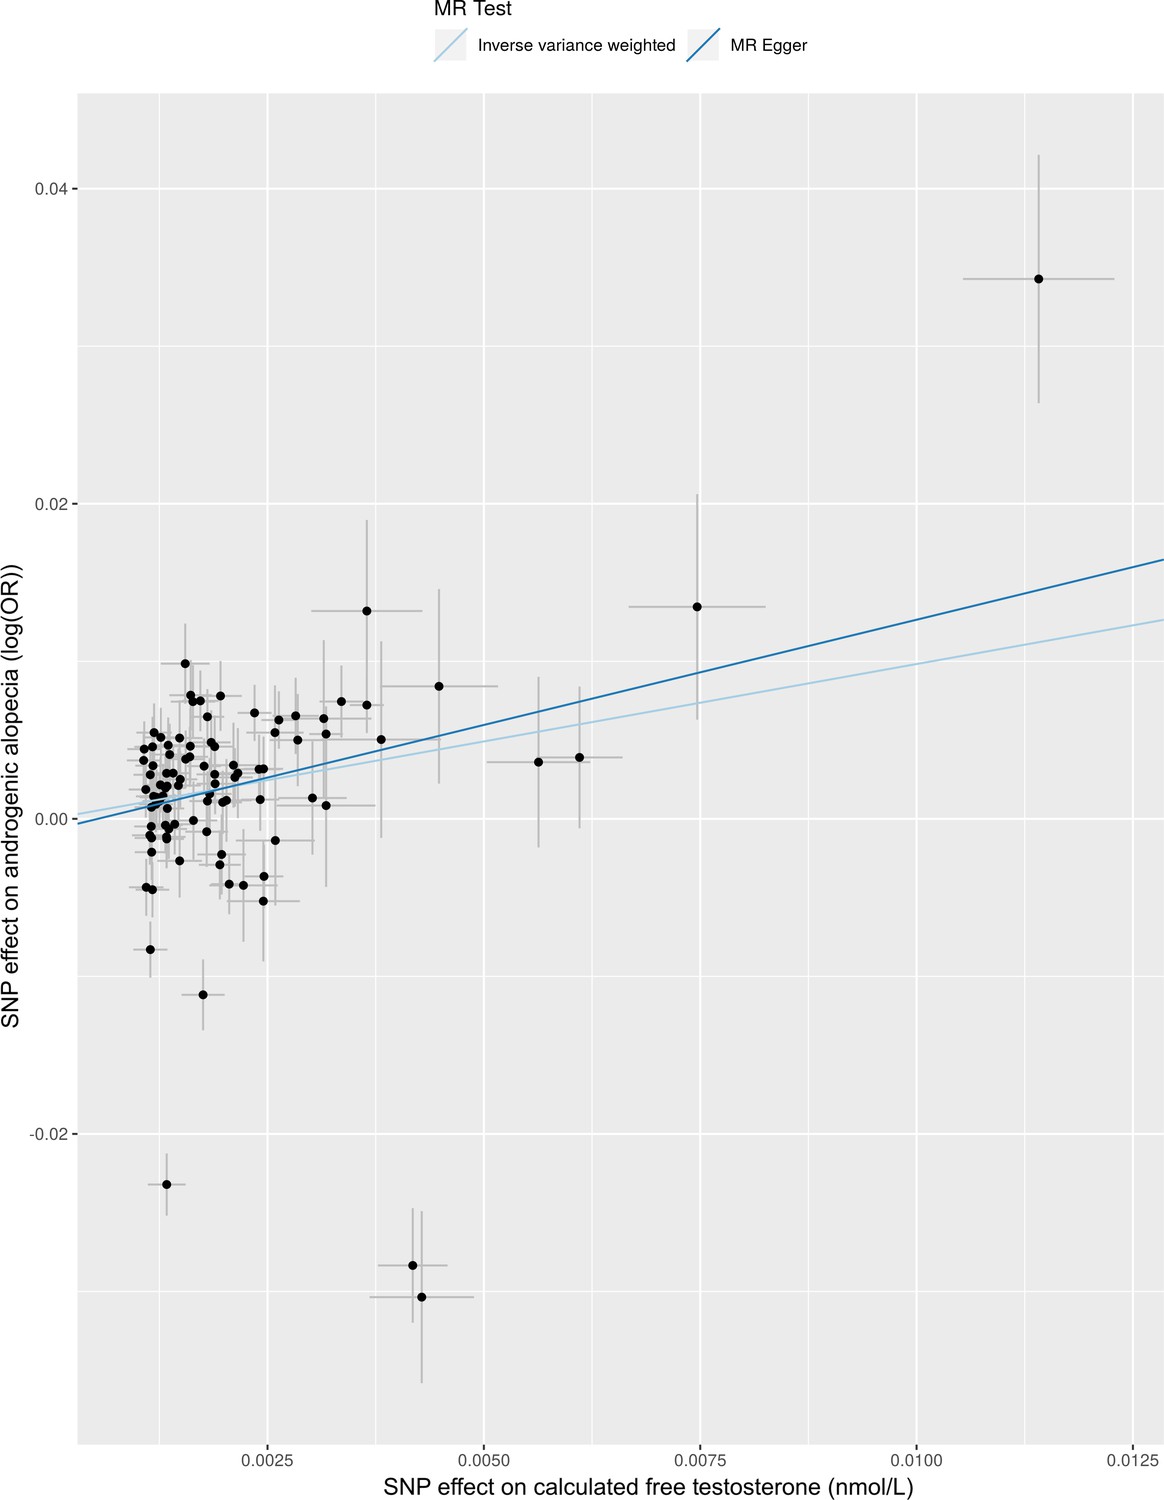
Comparison of effect of calculated free testosterone on androgenic alopecia using Mendelian randomization with IVW and Egger regression methods.
Tables
Table 1
Effect of calculated free testosterone on 22 health outcomes from the UK Biobank relevant to effects of testosterone treatment in males.
| Outcome | Effect per 0.1 nmol/L increased CFT (95% CI) | P-value | Sample Size Cases/Controls |
|---|---|---|---|
| Outcomes with Expected Clinical Benefits | |||
| Body fat-free percentage* | 1.91% (1.48 to 2.35) | 9.06E-18 | 154254 |
| Body fat percentage* | −1.88% (−2.31 to −1.45) | 1.65E-17 | 153772 |
| Heel bone mineral density* | 0.40 SD (0.25 to 0.54) | 1.10E-07 | 90676 |
| Depression | OR = 1.45 (1.1 to 1.91) | 7.77E-03 | 4725/152485 |
| Accelerometer-based physical activity | 0.89 milligravity (−0.05 to 1.82) | 0.06 | 30439 |
| All fracture | OR = 0.89 (0.71 to 1.11) | 0.30 | 9133/148077 |
| Handgrip strength | 0.29 kg (−0.31 to 0.89) | 0.34 | 156400 |
| All dementia | OR = 1.26 (0.67 to 2.34) | 0.47 | 1003/156207 |
| Outcomes with Potential Adverse Effects | |||
| Hematocrit percentage* | 1.37% (1.12 to 1.62) | 1.03E-27 | 152872 |
| Prostate cancer* | OR = 1.51 (1.21 to 1.88) | 2.10E-04 | 7586/149624 |
| Androgenic alopecia* | OR = 1.49 (1.19 to 1.86) | 5.28E-04 | 70283/85756 |
| Benign prostatic hyperplasia | OR = 1.36 (1.10 to 1.67) | 3.80E-03 | 10894/146316 |
| Myocardial infarction | OR = 1.23 (1 to 1.53) | 0.05 | 9398/147812 |
| Glucose | −0.06 mmol/L (−0.14 to 0.02) | 0.12 | 138307 |
| Hemoglobin A1c | −0.34 mmol/mol (−0.82 to 0.15) | 0.17 | 149828 |
| All stroke | OR = 1.18 (0.90 to 1.56) | 0.23 | 4569/152641 |
| Diastolic blood pressure | 0.27 mmHg (−0.30 to 0.85) | 0.35 | 148384 |
| Ischemic stroke | OR = 0.92 (0.61 to 1.37) | 0.67 | 2122/155088 |
| Systolic blood pressure | −0.12 mmHg (−1.23 to 1.00) | 0.84 | 148383 |
| Type 2 diabetes | OR = 1.02 (0.81 to 1.28) | 0.87 | 11079/146131 |
| Venous thromboembolism | OR = 1.02 (0.74 to 1.4) | 0.92 | 4127/153083 |
| Heart failure | OR = 1.01 (0.76 to 1.34) | 0.95 | 4288/152922 |
-
* Significant adjusting for Bonferroni correction of 22 outcomes (p<2.27×10⁻³).
CFT, calculated free testosterone.
Table 2
Effects of calculated free testosterone on 439 health outcomes in males from the UK Biobank significant after adjusting for multiple hypothesis testing using Bonferroni correction (p<1.14×10⁻⁴).
| Outcome | Effect per 0.1 nmol/L increased CFT (95% CI) | P-value | Sample Size Cases/Controls |
|---|---|---|---|
| Creatinine | 0.113 SD (0.079 to 0.146) | 4.78 × 10⁻¹¹ | 149849 |
| C-reactive protein | −0.085 SD (−0.119 to −0.052) | 6.15 × 10⁻⁷ | 149547 |
| Spinal stenosis | OR = 2.03 (1.51 to 2.75) | 3.82 × 10⁻⁶ | 1917/150919 |
| Apolipoprotein A | −0.018 g/L (−0.026 to −0.01) | 1.55 × 10⁻⁵ | 138185 |
| HDL cholesterol | −0.074 SD (−0.109 to −0.039) | 3.62 × 10⁻⁵ | 138394 |
| Essential hypertension | OR = 1.17 (1.08 to 1.27) | 7.53 × 10⁻⁵ | 40809/115957 |
| Hypertension | OR = 1.17 (1.08 to 1.26) | 1.05 × 10⁻⁴ | 40960/115957 |
-
CFT, calculated free testosterone; HDL, high density lipoprotein; GRS, genetic risk score.
Additional files
-
Supplementary file 1
Supplementary Tables.
Table 1. Characteristics at recruitment for study population of males from UK Biobank cohort study Table 2. Independent genetic variants associated with calculated free testosterone (CFT) at genome-wide significance (p<5×10⁻⁸) and not associated with sex hormone-binding globulin in males Table 3. Results of Mendelian randomization analysis using Egger regression for 22 a priori outcomes relevant to testosterone treatment Table 4. Results of Mendelian randomization analysis using MR-RAPS for effect of CFT on 22 a priori outcomes relevant to testosterone treatment Table 5. Results of Mendelian randomization analysis using MR-PRESSO for effect of CFT on 22 a priori outcomes relevant to testosterone treatment Table 6. Associations of genetically-predicted CFT for 439 health outcomes across the human phenome excluding individuals on antihypertensive medication Table 7. Associations of genetically-predicted CFT for 439 health outcomes across the human phenome excluding individuals on cholesterol-lowering medication Table 8. Independent genetic variants associated with total testosterone at genome-wide significance (p<5×10⁻⁸) and not associated with sex hormone-binding globulin in 175,421 males from UK Biobank Table 9. All Mendelian randomization analyses of total testosterone on 22 a priori outcomes Table 10. Associations of genetically-predicted total testosterone for 439 health outcomes across the human phenome. Table 11. Definitions for 22 health outcomes with suspected relevance with testosterone treatment Table 12. Definitions for 439 phenome-wide health outcomes Figure 1. Screenshot of options shown to male UK Biobank participants for selection of hair/baldness pattern.
- https://cdn.elifesciences.org/articles/58914/elife-58914-supp1-v2.xlsx
-
Transparent reporting form
- https://cdn.elifesciences.org/articles/58914/elife-58914-transrepform-v2.pdf
Download links
A two-part list of links to download the article, or parts of the article, in various formats.
Downloads (link to download the article as PDF)
Open citations (links to open the citations from this article in various online reference manager services)
Cite this article (links to download the citations from this article in formats compatible with various reference manager tools)
Effects of lifelong testosterone exposure on health and disease using Mendelian randomization
eLife 9:e58914.
https://doi.org/10.7554/eLife.58914


