Photosynthesis without β-carotene
- Biophysics of Photosynthesis, Department of Physics and Astronomy, Faculty of Sciences, VU University Amsterdam and LaserLab Amsterdam, Netherlands
- Max Planck Institute of Molecular Plant Physiology, Germany
Figures
Figure 1 with 1 supplement
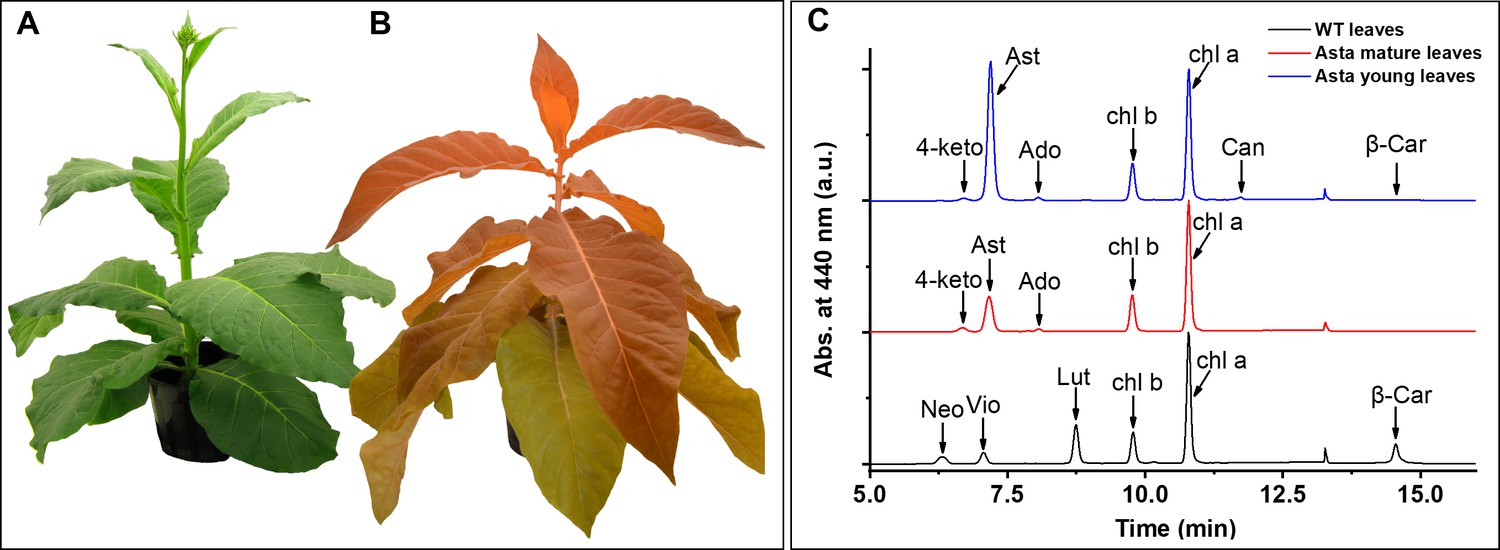
Phenotype of wild-type (WT) and astaxanthin-synthesizing tobacco plants (Asta) and pigment analysis.
WT (A) and Asta (B) plants, 7 and 21 weeks old, respectively. Note that the older leaves in the mutant are less orange than the young leaves. See also Figure 1—figure supplement 1. (C) Chromatographic profiles of the pigments extracted from leaves normalized to the Chl a peak. Neo, neoxanthin; Vio, violaxanthin; Lut, lutein; β-car, β-carotene; Chl, chlorophyll; 4-keto, 4-ketoanteraxanthin; Ast, astaxanthin; Ado, adonixanthin; Can, Canthaxanthin.
Figure 1—figure supplement 1
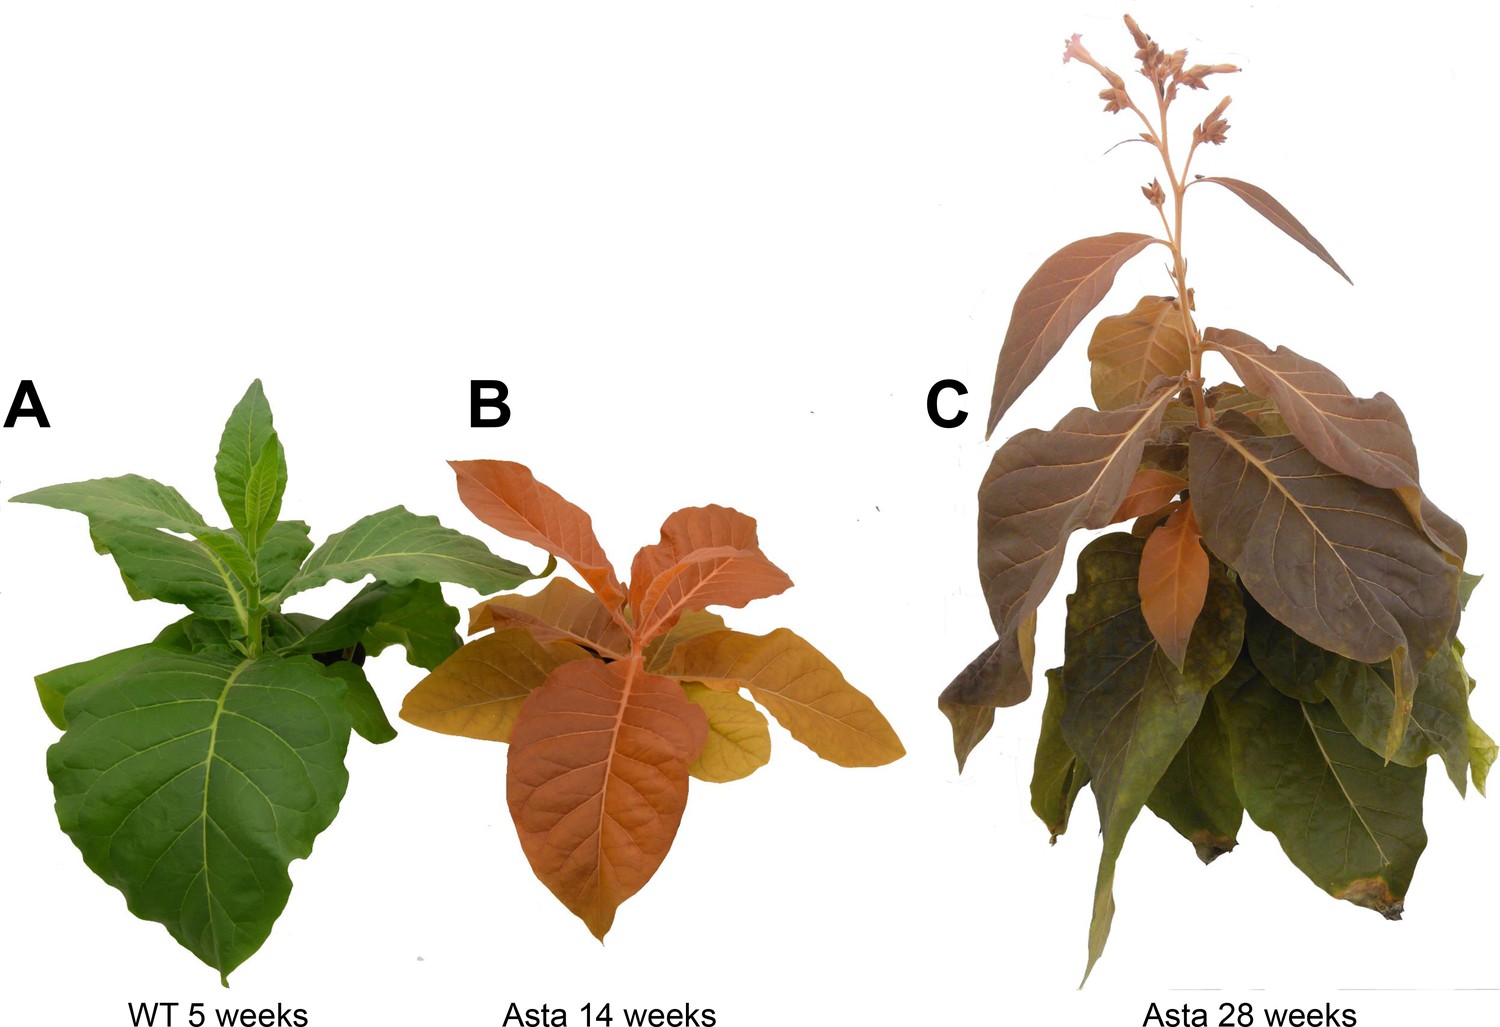
Plants at different ages.
(A) 5-week-old wild-type plant. (B) 14-week-old Asta plant. (C) 28-week-old Asta plant. Note that the old leaves of Asta plants become progressively green.
Figure 2 with 1 supplement
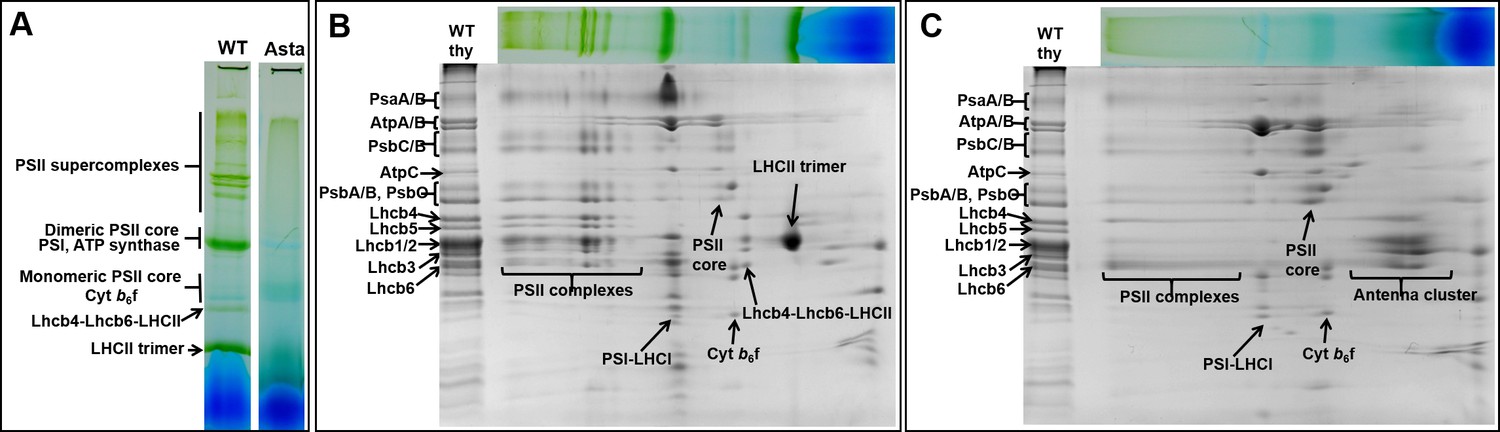
Protein composition and supramolecular organization of the photosynthetic complexes in WT and Asta plants.
(A) Thylakoids were solubilized with 1% α-DDM and loaded on a blue-native gel. Second dimension SDS-PAGE of the WT (B) and the Asta mutant (C). The immunoblotting analysis is shown in Figure 2—figure supplement 1.
Figure 2—figure supplement 1
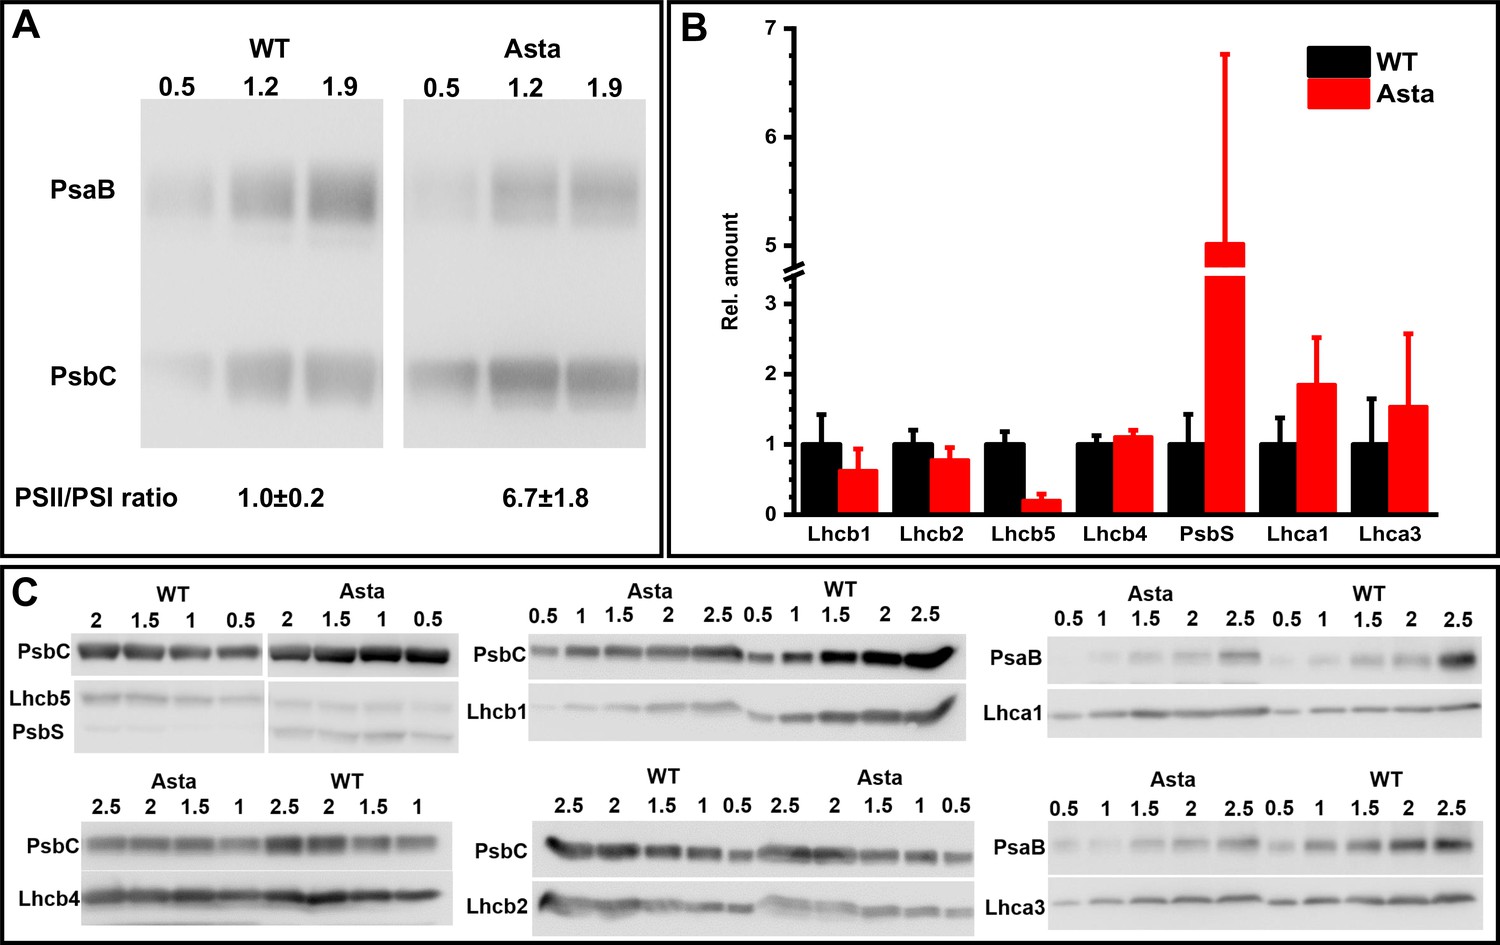
Comparison of the protein composition of WT and Asta plants.
(A) Immunoblot with antibodies against PsaB (PSI subunit) and PsbC (PSII subunit) to determine the PSI/PSII ratio. Thylakoids equivalent to 0.5, 1.2 and 1.9 μg (left to right) Chl were loaded in the three lanes. The PSII/PSI ratio in the mutant was normalized to the WT PSII/PSI ratio. (B) Relative amount of LHC. The amount of each Lhc was determined by the immunoblottings shown in (C). The values are normalized to one of the core proteins (PsbC for Lhcbs and PsaB for Lhcas that were used as internal standards in all blots) and then double normalized to their WT level (Average values ± SD are shown, n = 3 or four technical replicas). (C) Thylakoid membranes containing 0.5–2.5 μg of Chl were loaded in each lane. The Lhc and the core proteins were detected on the same membrane that were developed with the two antibodies. Saturated signals were excluded from the analysis.
Figure 3 with 5 supplements
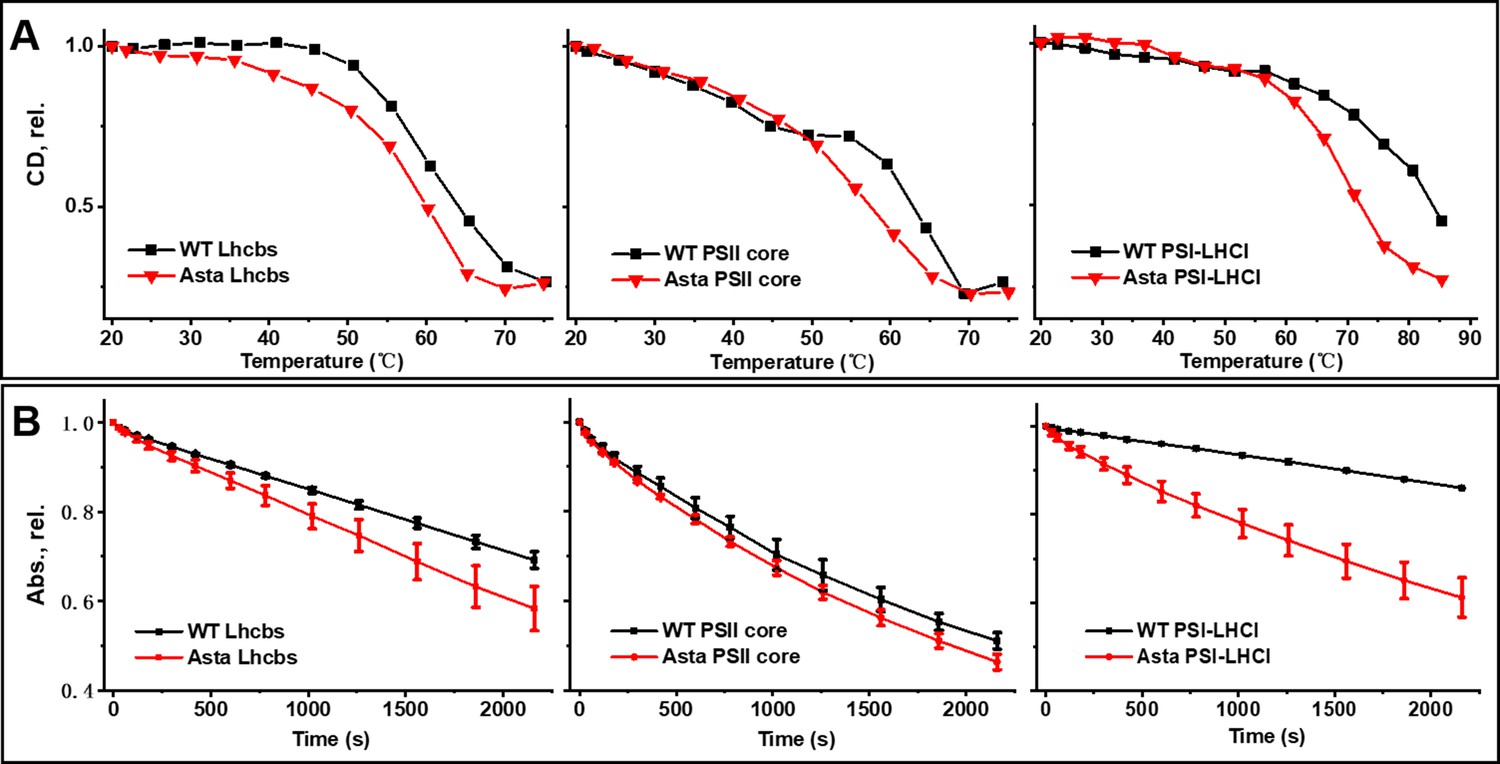
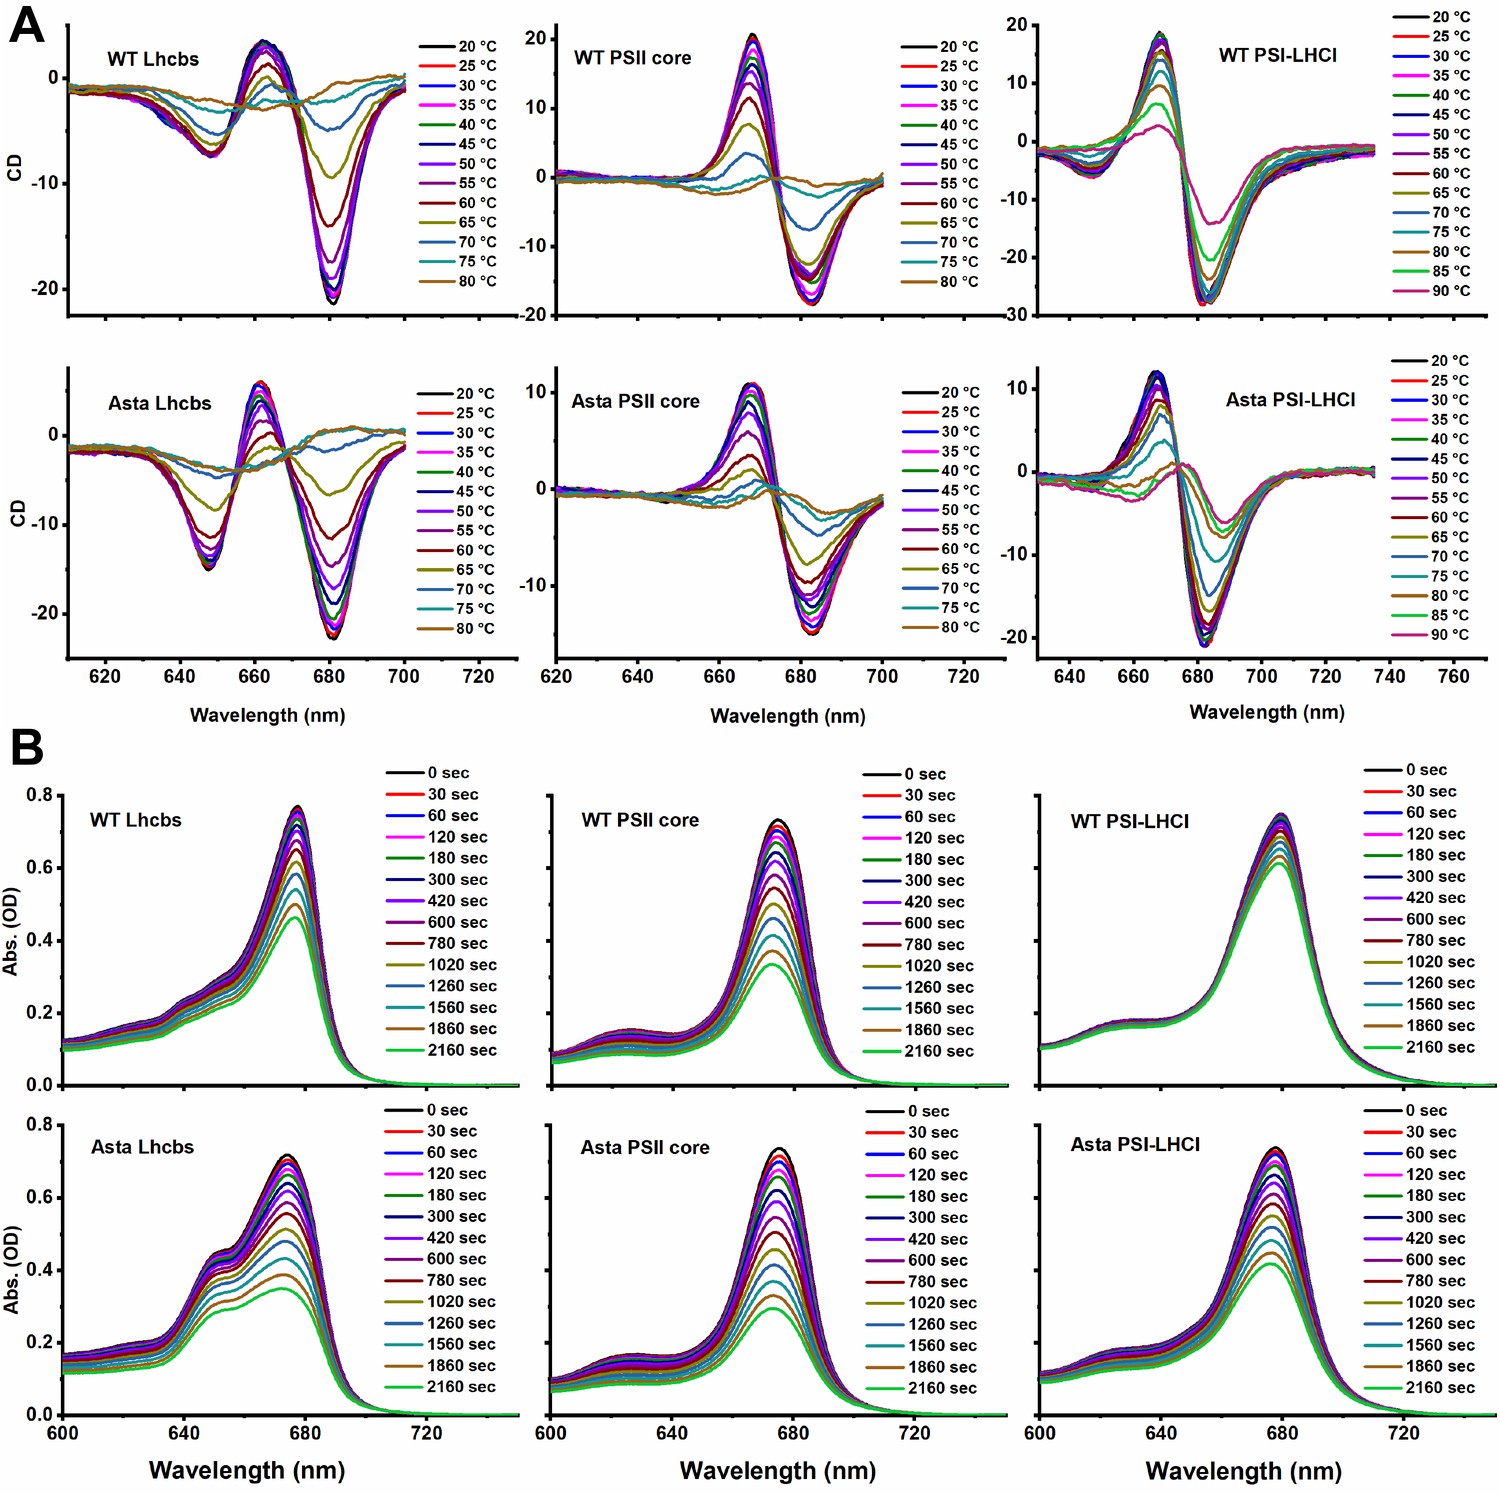
Thermal and photo-stability of photosynthetic complexes.
(A) Thermal denaturation was monitored by following the CD signals in the Qy (Lhcb: 610–700 nm, PSII core: 640–700 nm, PSI-LHCI: 675–735 nm) region at increasing temperature. (B) Photobleaching is measured as the decrease in absorption of the area in the Qy region (600–750 nm) as a function of the length of the high light treatment (Average values ± SD are shown for n = 3 technical replicas.). The purification of the complexes is shown in Figure 3—figure supplement 1. The pigment analysis of the purified complexes is shown in Figure 3—figure supplement 2. The absorption, CD, and fluorescence emission spectra of the complexes are shown in Figure 3—figure supplement 3 for comparison the fluorescence spectra of the thylakoids are shown in Figure 3—figure supplement 4. The raw data used for this figure are provided in Figure 3—figure supplement 5.
Figure 3—figure supplement 1
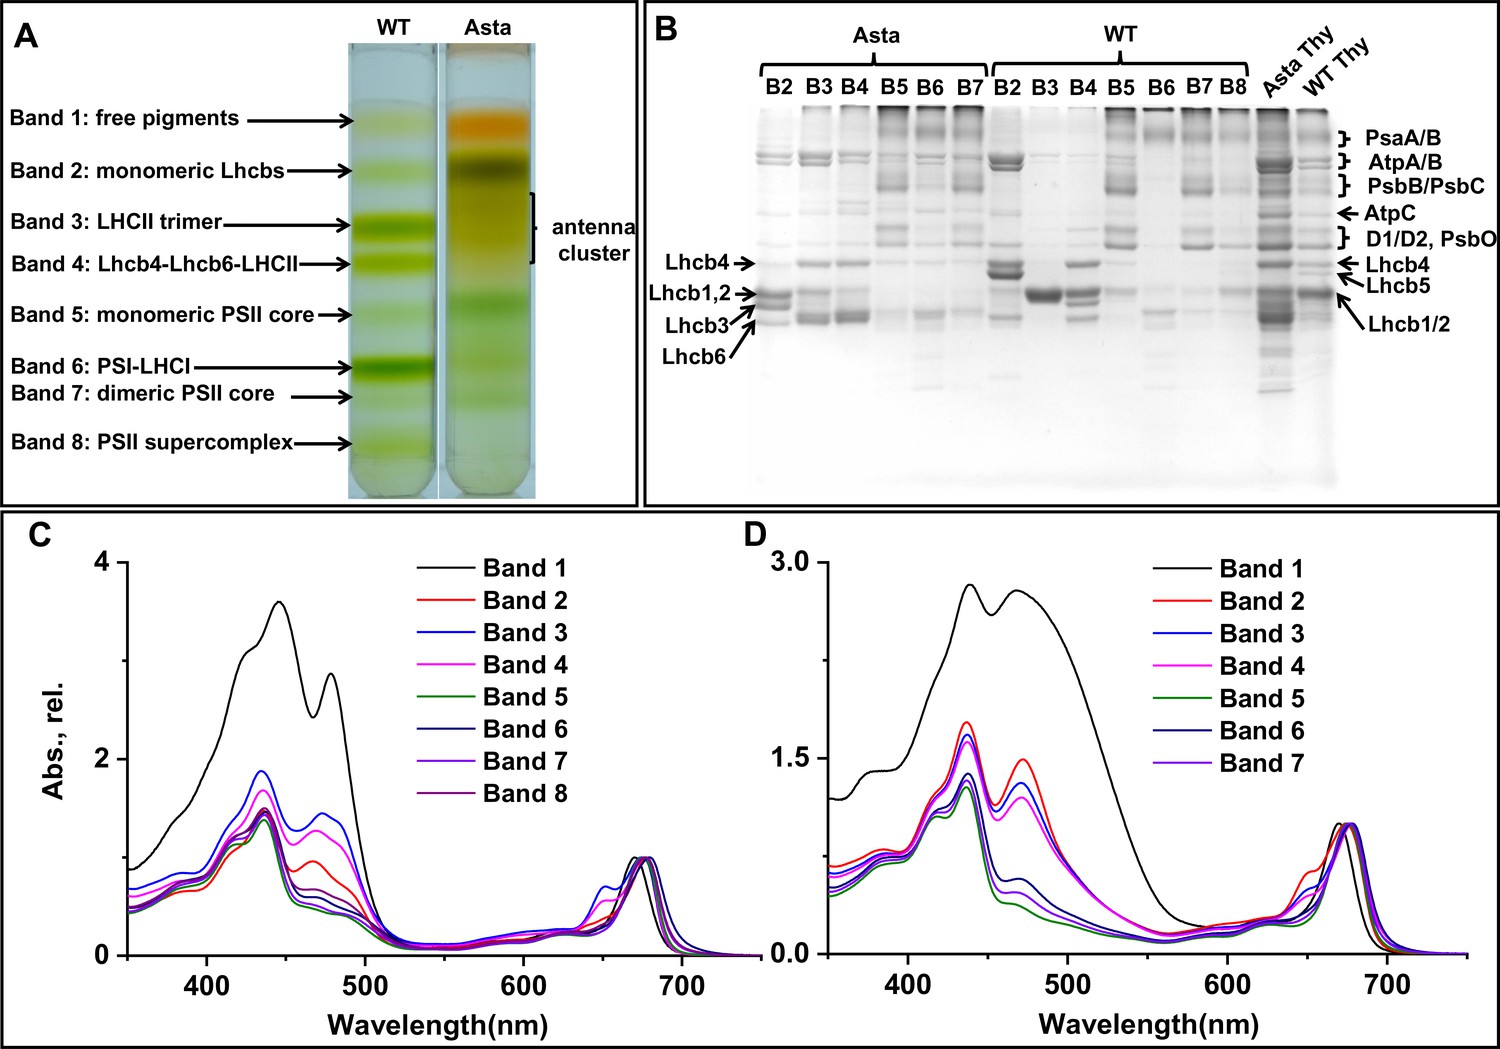
Isolation of photosynthetic complexes.
(A) Thylakoids equivalent to 0.2 mg total Chl were solubilized with 0.6% α-DDM, loaded on a sucrose density gradient and separated by centrifugation. (B) SDS-PAGE analysis of the bands from the sucrose gradients. Absorption spectra of all bands from WT (C) and Asta (D). The spectra are normalized to the maximum in the Qy region.
Figure 3—figure supplement 2
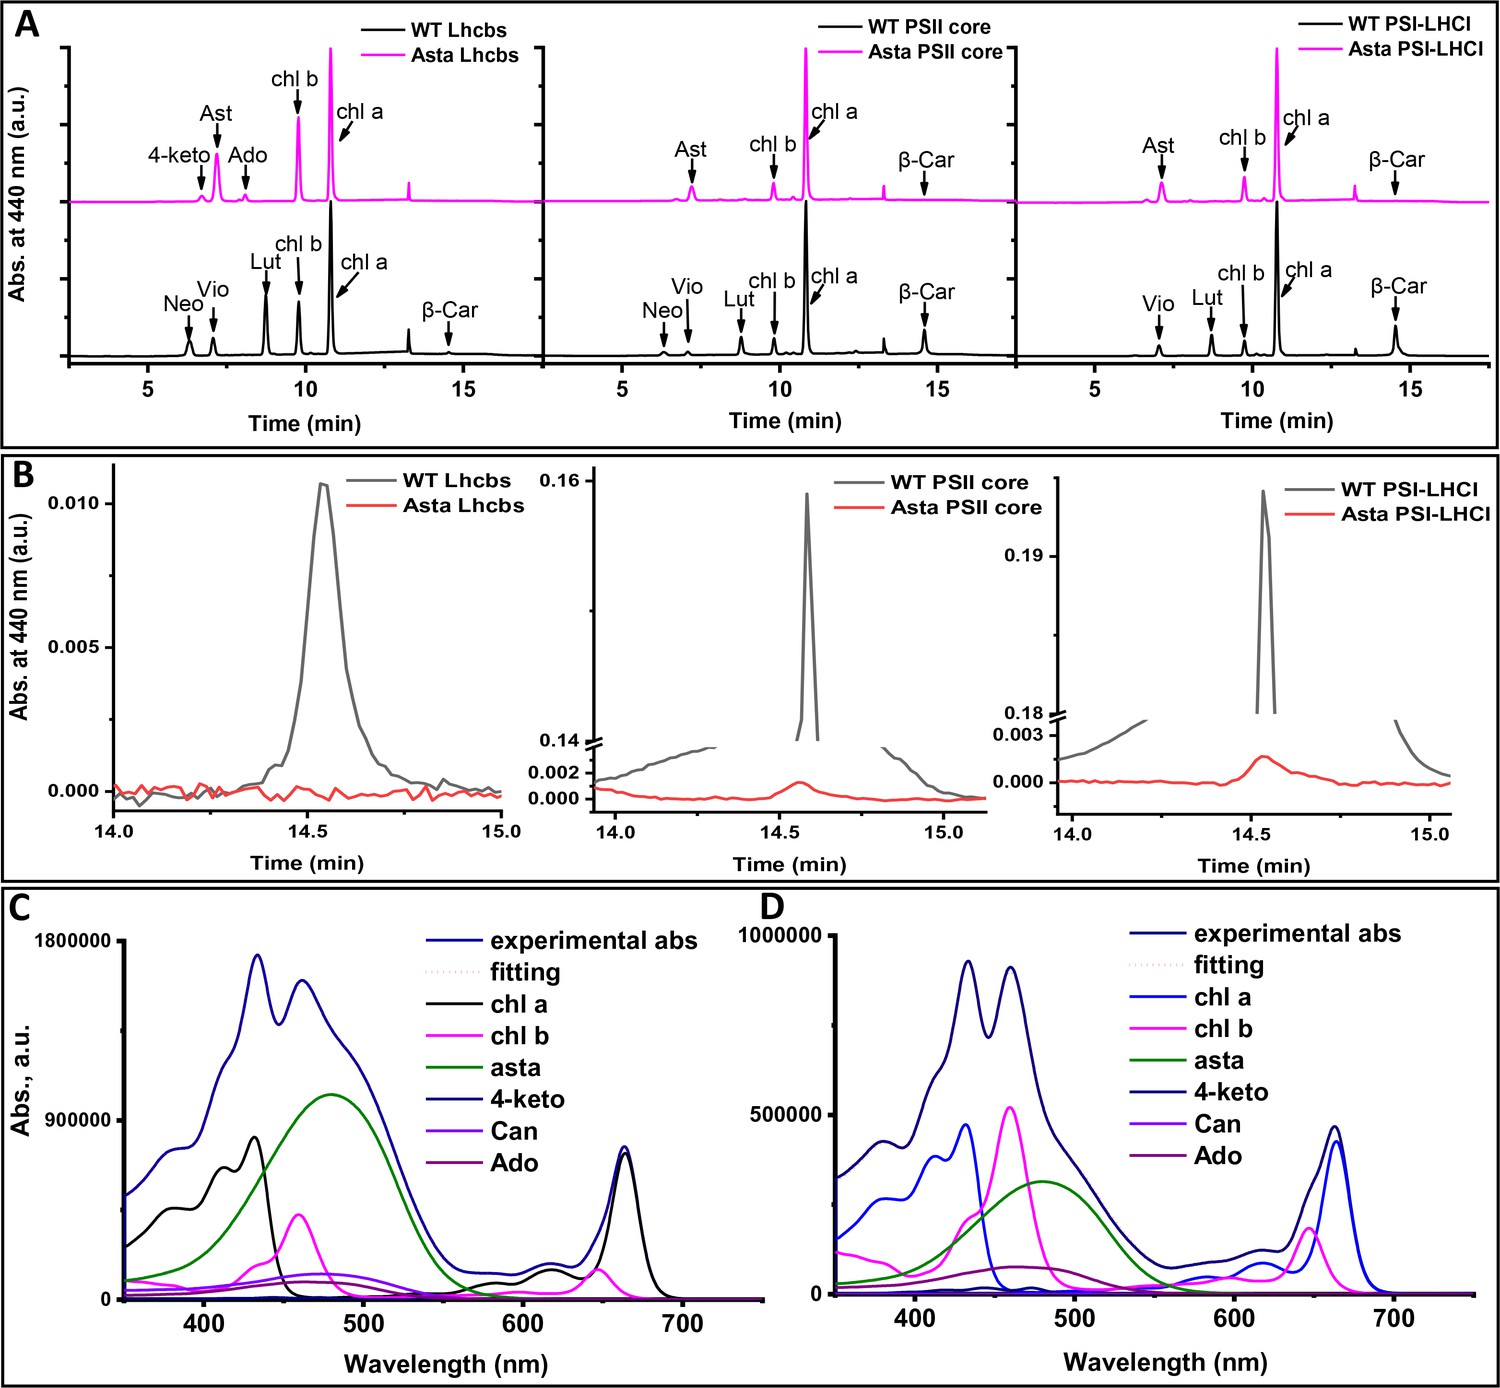
Pigment analysis.
(A) The chromatographic profiles were recorded at 440 nm with 4 nm of bandwidth and normalized to the Chl a peak. (Neo: neoxanthin, Vio: violaxanthin, Lut: lutein, β-Car: β-carotene, 4-keto: 4-ketoantheraxanthin, Ast: astaxanthin, Ado: adonixanthin, Can: canthaxanthin). The presence of Chl b in the PSII core is the result of some contamination form Lhcbs in the preparation. (B) Zoom in the β-Car area of panel A. Note the difference in scale between the chromatogram of the WT and that of the mutant for PSI and PSII complexes. (C and D) Examples of fitting of the absorption spectrum of the acetone extract with the spectra of the individual pigments. (C) Thylakoids from young leaves of the mutant. (D) Asta-LHCs. The spectra measured in 80% acetone.
Figure 3—figure supplement 3
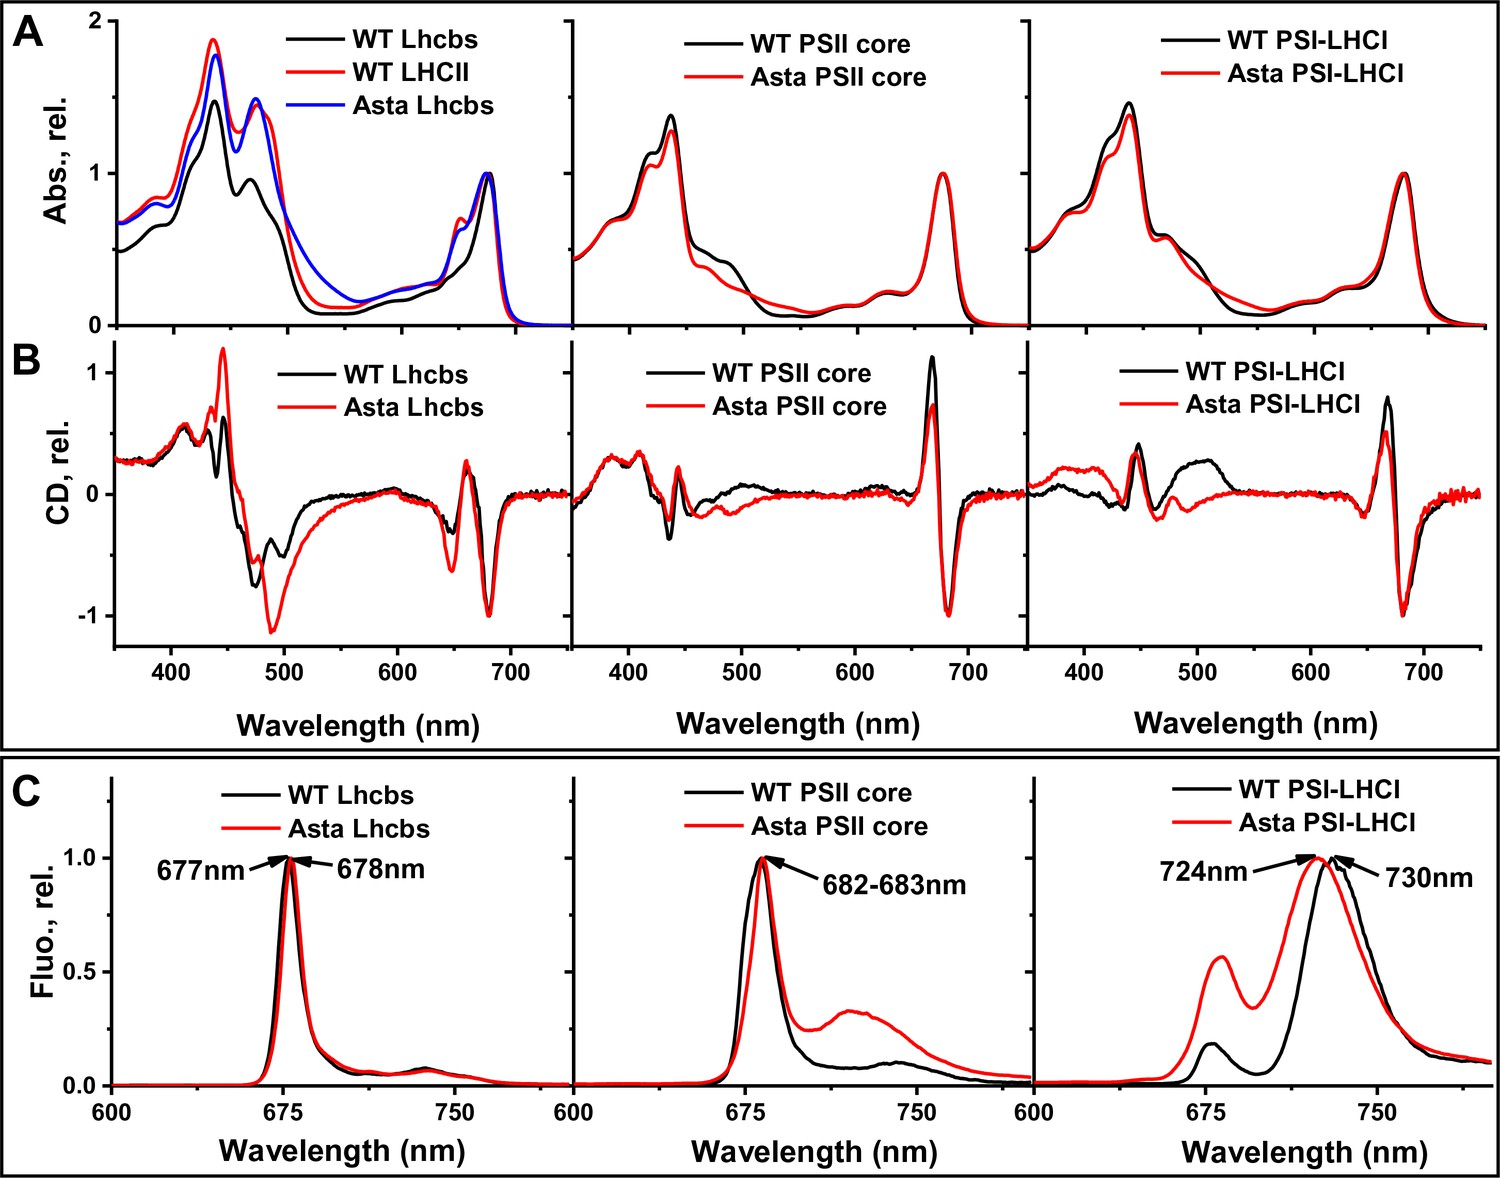
Absorption, CD, and 77K fluorescence spectra of isolated complexes from WT (black) and Asta (red).
(A) Absorption spectra of Lhcb, PSII core, and PSI. The spectra are normalized to the maximum in the Qy region. (B) CD spectra of monomeric Lhcb, PSII core, and PSI-LHCI. (C) Fluorescence emission of monomeric Lhcb, PSII core, and PSI-LHCI at 77 K. All the spectra are very similar in the region dominated by the absorption of the Chls (600–800 nm), while they differ in the region dominated by the carotenoid absorption (450–550 nm) due to the different spectroscopic properties of astaxanthin compared to the carotenoids present in the WT. The small differences around 650 nm in the spectra of the Lhcb are due to the presence of a higher amount of LHCII in the Lhcb monomeric fraction from Asta plants as compared to the WT . Since LHCII has a relatively higher content in Chl b as compared to the minor antennae, the signal due to Chl b (650 nm) is more intense. The differences in the emission spectra of PSII and PSI are due to contamination, namely the presence of a small amount of PSI in the PSII preparation, and of PSII in the PSI preparation, which is visible also in the SDS-PAGE (Figure 2—figure supplement 1).
Figure 3—figure supplement 4
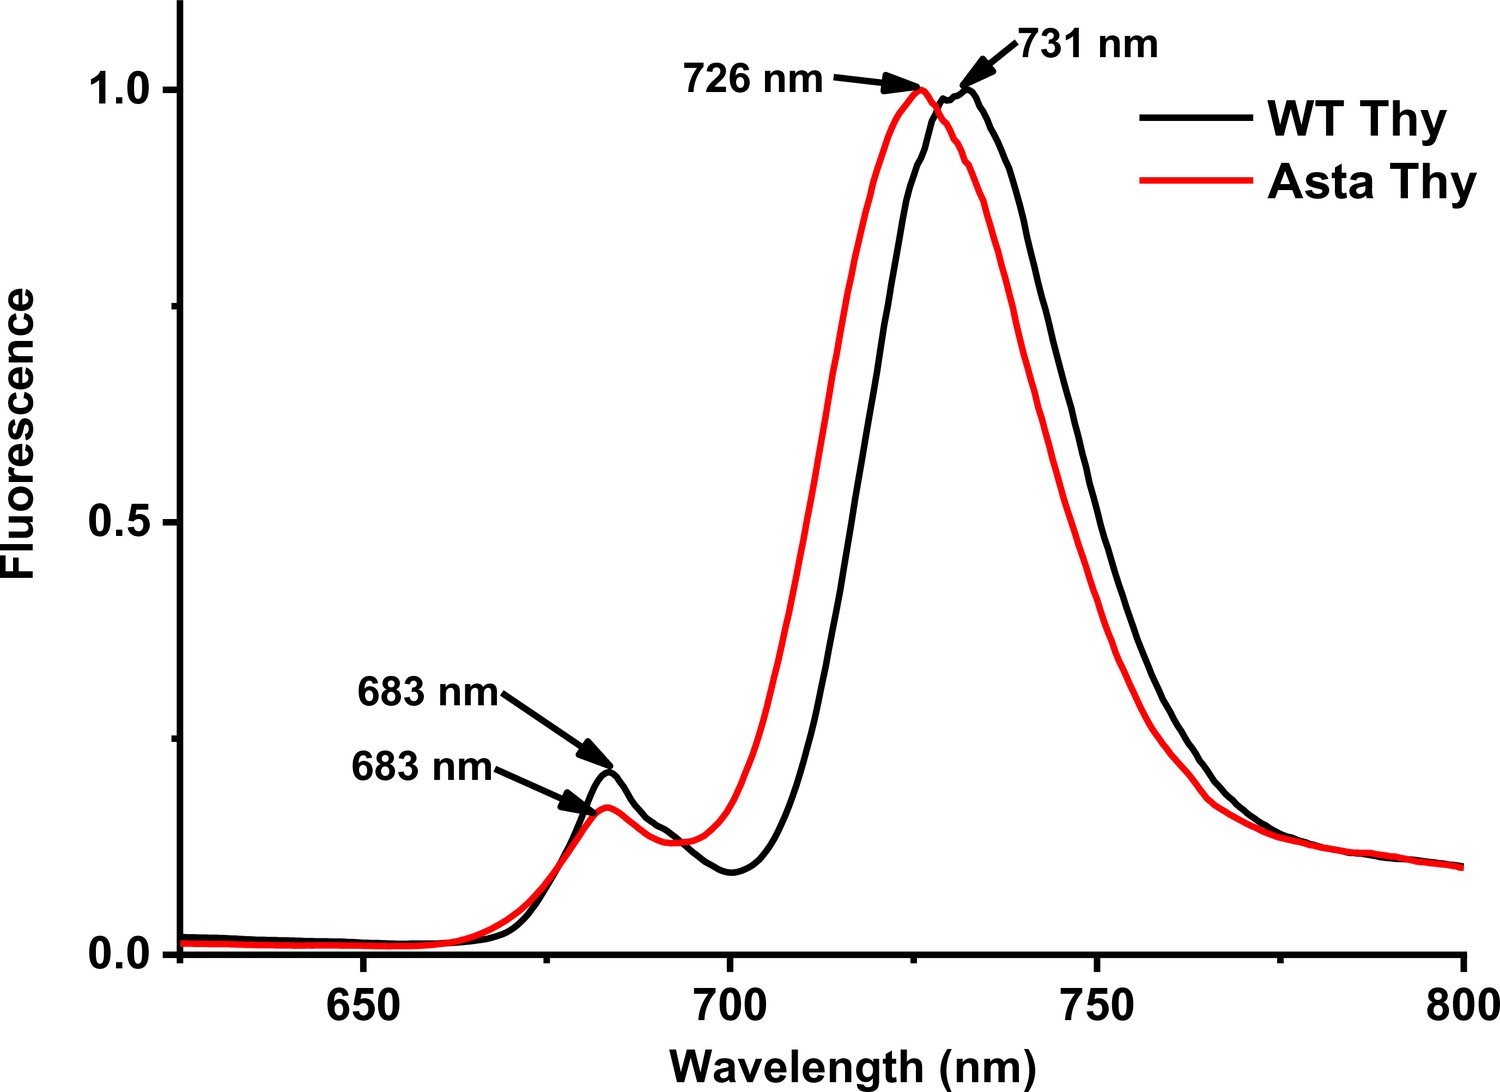
Fluorescence emission spectra of thylakoids at 77 K.
The spectra are normalized to the maximum.
Figure 3—figure supplement 5
Original CD (A) and absorption (B) spectra.
(A) Denaturation and (B) photobleaching.
Figure 4 with 2 supplements
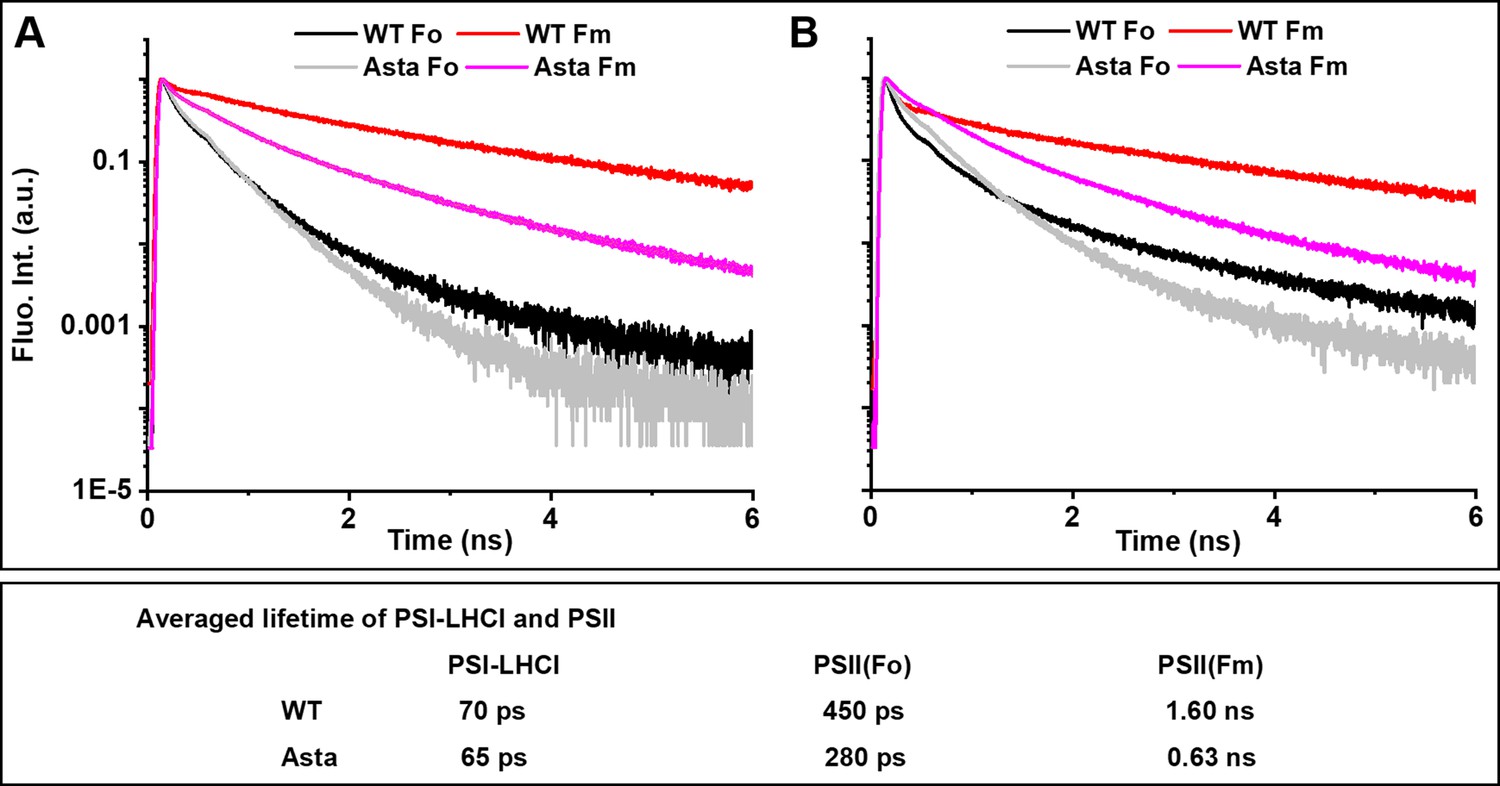
Normalized fluorescence decay traces measured at room temperature on WT and Asta leaves in the presence (F0) or absence (FM) of photochemistry.
Fluorescence was detected at (A) λ = 685 nm and (B) λ = 720 nm. respectively. Note that, although the decay at 680 nm is dominated by PSII and at 720 nm by PSI, both complexes contribute to the decay at both wavelengths (see Figure 4—figure supplement 1 for the analysis of the complete data set with spectral resolution). The fluorescence decay and analysis of the purified LHCII are shown in Figure 4—figure supplement 2.
Figure 4—figure supplement 1
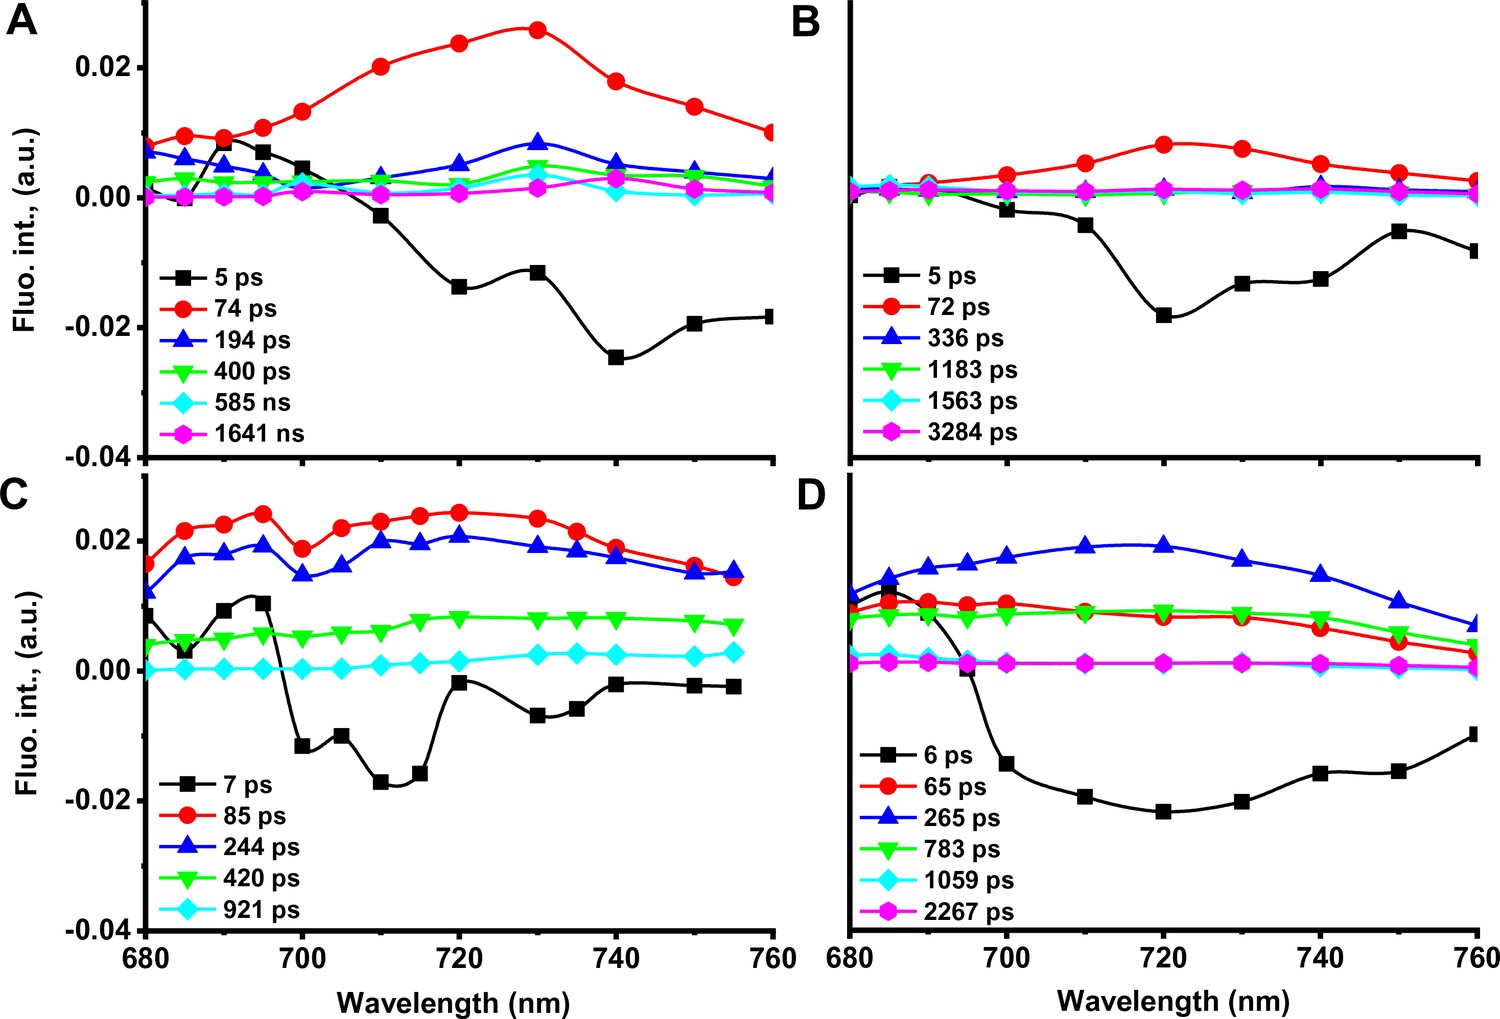
Results of time-resolved fluorescence of leaves from WT (A and B) and Asta (C and D).
Tobacco leaves were measured in two different fluorescence states: in the presence (corresponding to FO state; A, C) and in the absence (FM state; B, D) of photochemistry. (A, B) Decay-associated spectra (DAS) of WT leaves. (C, D) DAS of Asta leaves.
Figure 4—figure supplement 2
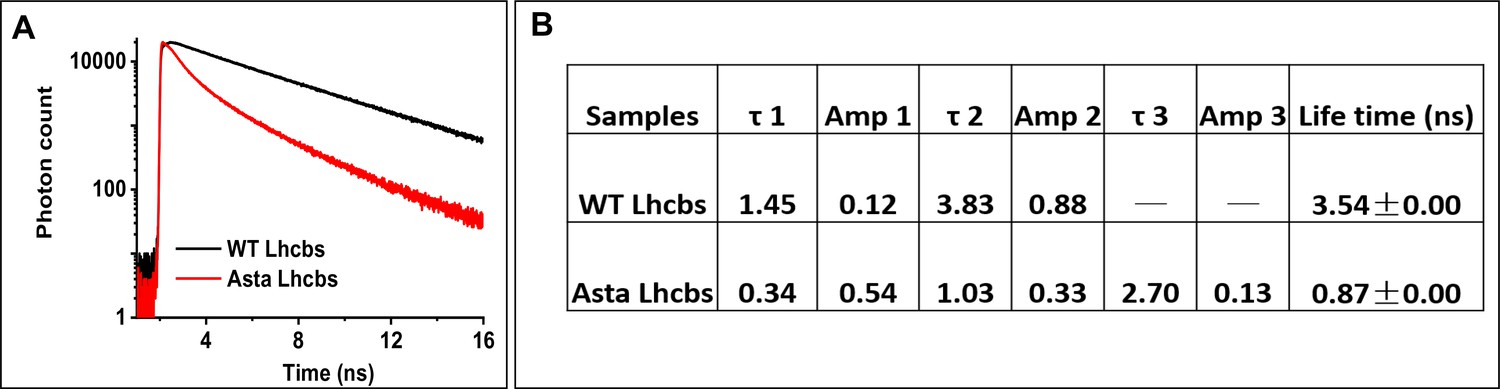
Time-resolved fluorescence decay traces of Lhcb.
(A) Fluorescence decay curves of WT Lhcb (black) and Asta-Lhcb (red) upon excitation at 468 nm and detection at 680 nm. (B) Lifetimes of monomeric Lhcs from WT and mutant plants. (Average values ± SD are shown for n = 3 technical replicas.).
Figure 5 with 7 supplements
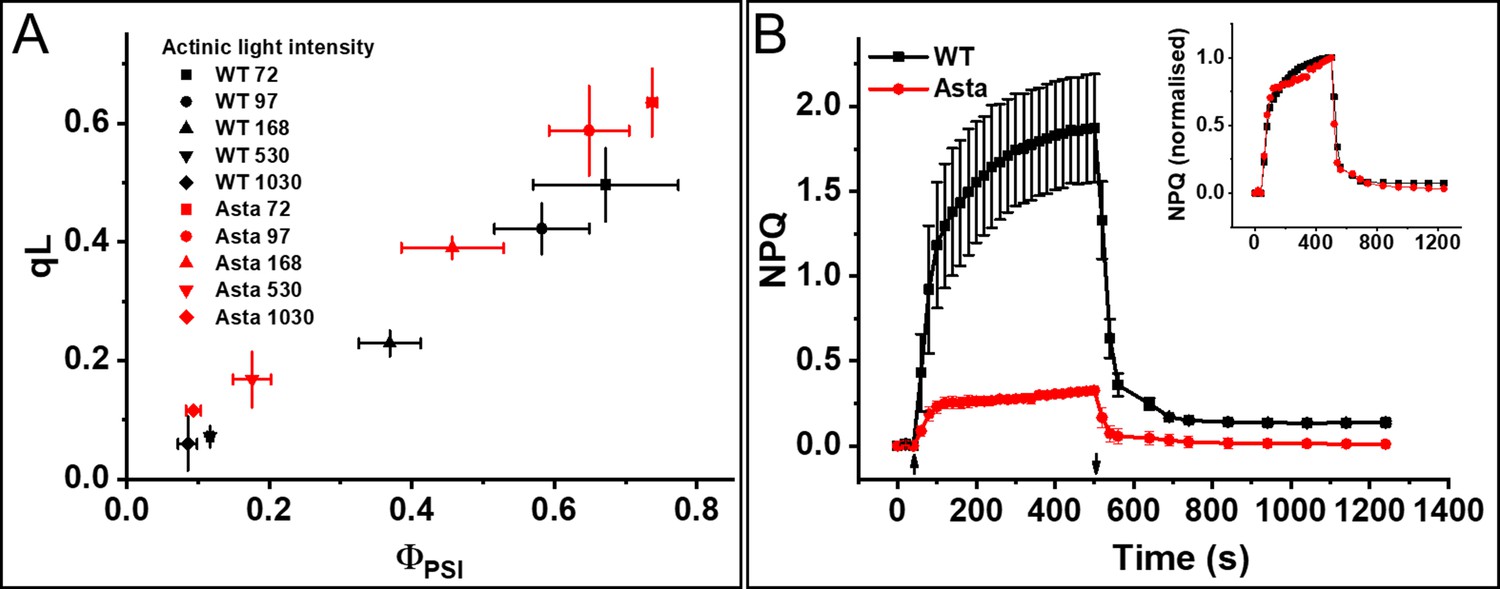
Photosynthetic performance and photoprotection.
(A) Relation between qL and ΦPSI measured at various light intensities (70–1030 μmol photons m−2 s−1). (B) NPQ kinetics upon transition from the dark-to-light (upward arrow,) and subsequent relaxation in the dark (downward arrow). Average values ± SD are shown for n = 3 leaves/plants. The inset shows amplitude-normalized kinetics. See also Figure 5—figure supplements 1–7.
Figure 5—figure supplement 1
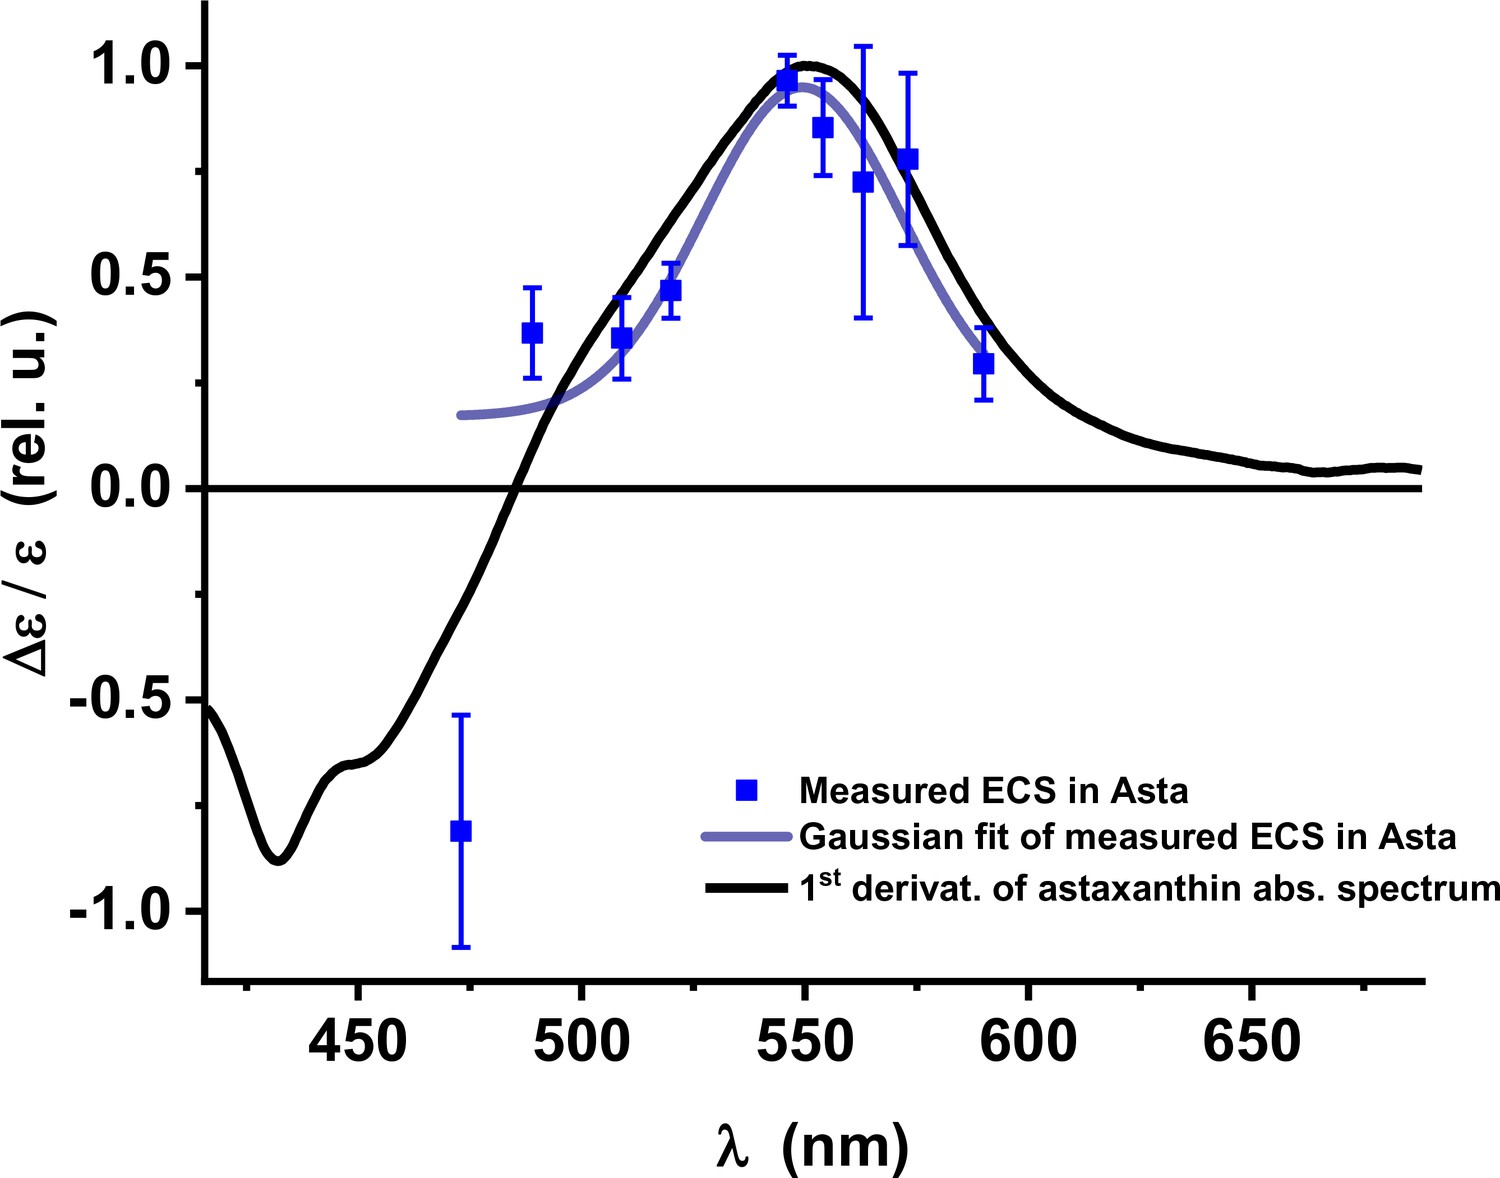
Electrochromic shift: absorption changes induced by the formation of a trans-thylakoid electric field (Δψ) in vivo in Asta plants.
The peak at ~550 nm is red-shifted compared to seed plants and algae . (Average values ± SD are shown for n = 3 leaves, biological replicas.).
Figure 5—figure supplement 2
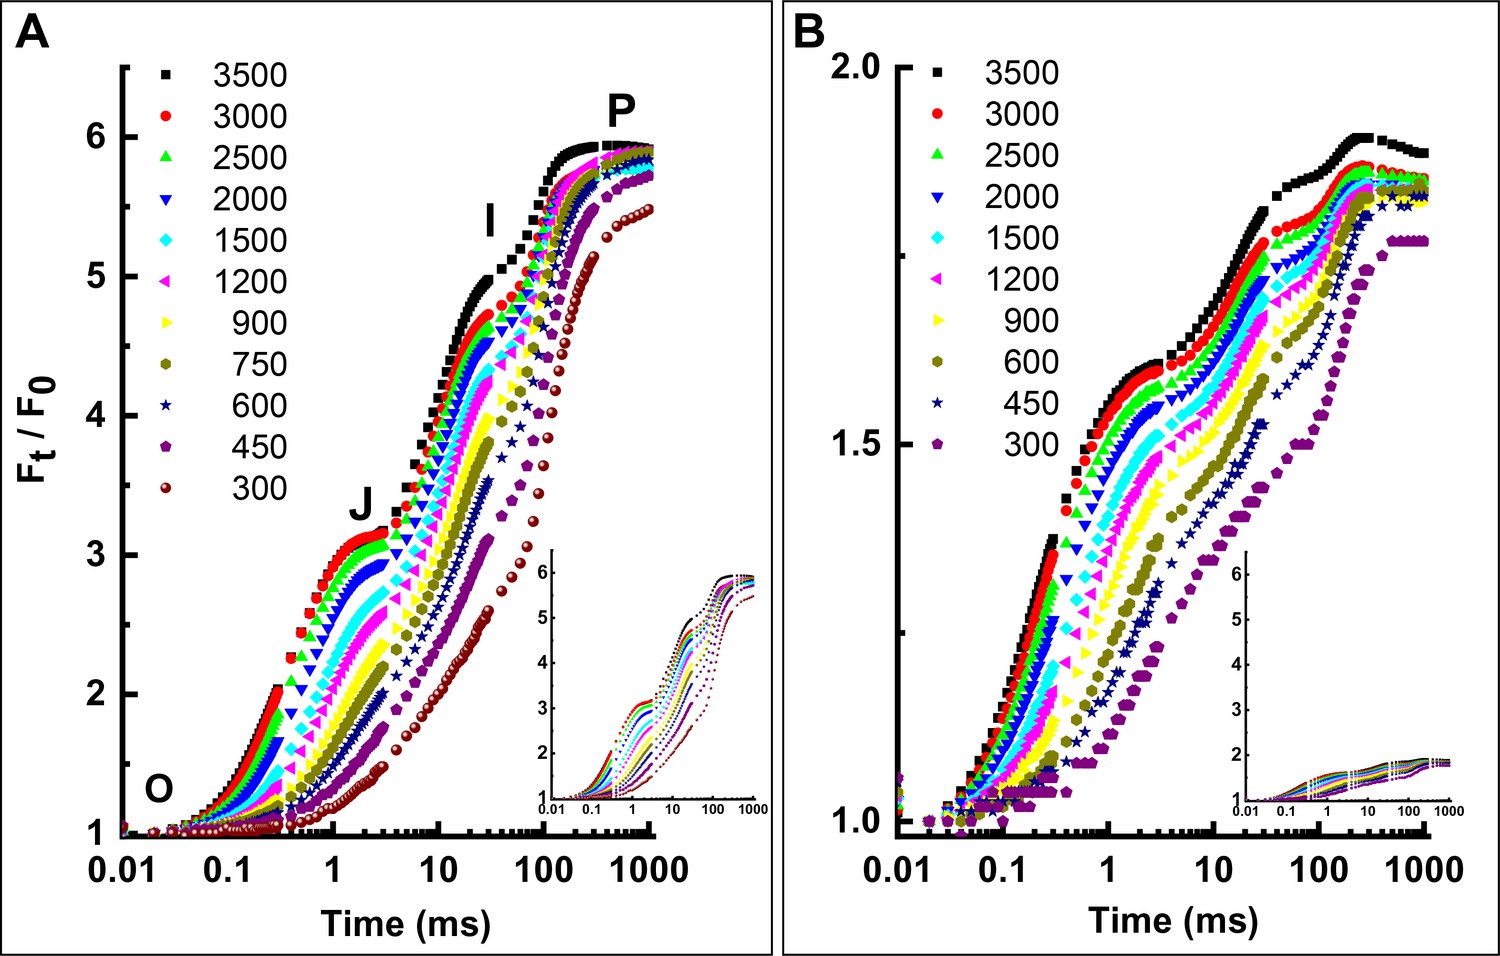
Light-intensity dependence (µE m−2 s−1 red light) of the OJIP transients of three types of tobacco leaves.
(A) WT. (B) Asta. The insets show the same data but on comparable scales to illustrate the dramatic effect of the presence of astaxanthin on the variable fluorescence intensity. All transients have been normalized to F0. The F0 values of the leaves were approximately the same. The Asta mutant exhibits all the characteristic points of the OJIP curve, has a similar light dependence of the kinetics of PSII and shows comparable area above the normalized fluorescence traces. All these observations indicate that the function of PSII and the characteristics of the photosynthetic electron transport chain are largely similar to the WT. However, due to the light-harvesting differences between the WT and the mutant, quantitative comparison of these traces is impossible, as the functional antenna size is altered. Also, the quantity of PSII electron acceptors and the structure of thylakoid membranes were not measured in Asta plants, and both parameters will also influence the OJIP curves. The functional antenna size of PSII (Table 3 in the main text) was measured as the slope of the light intensity dependence of the 300 µs timepoint and normalized to the initial fluorescence value (F300µs/F0) .
Figure 5—figure supplement 3
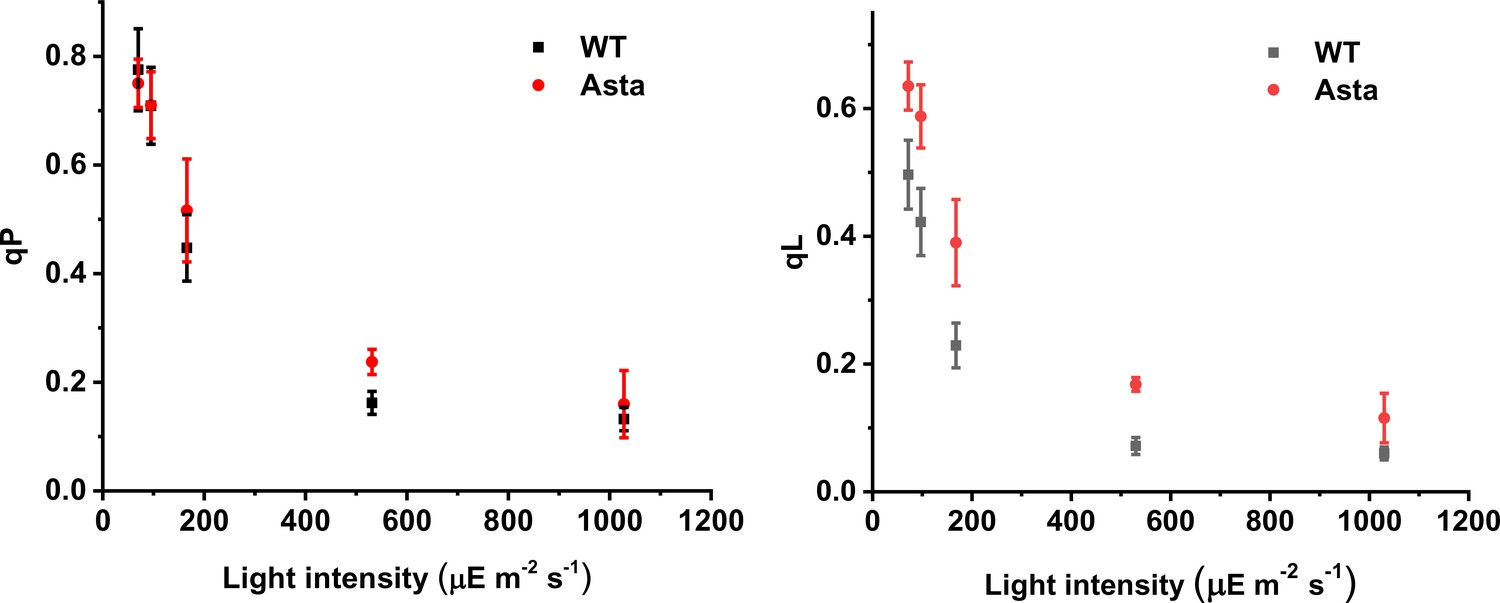
qP (A) and qL (B) as a function of light intensity in WT and Asta leaves.
(Average values ± SD are shown for n = 3 leaves/plants, biological replicas.).
Figure 5—figure supplement 4
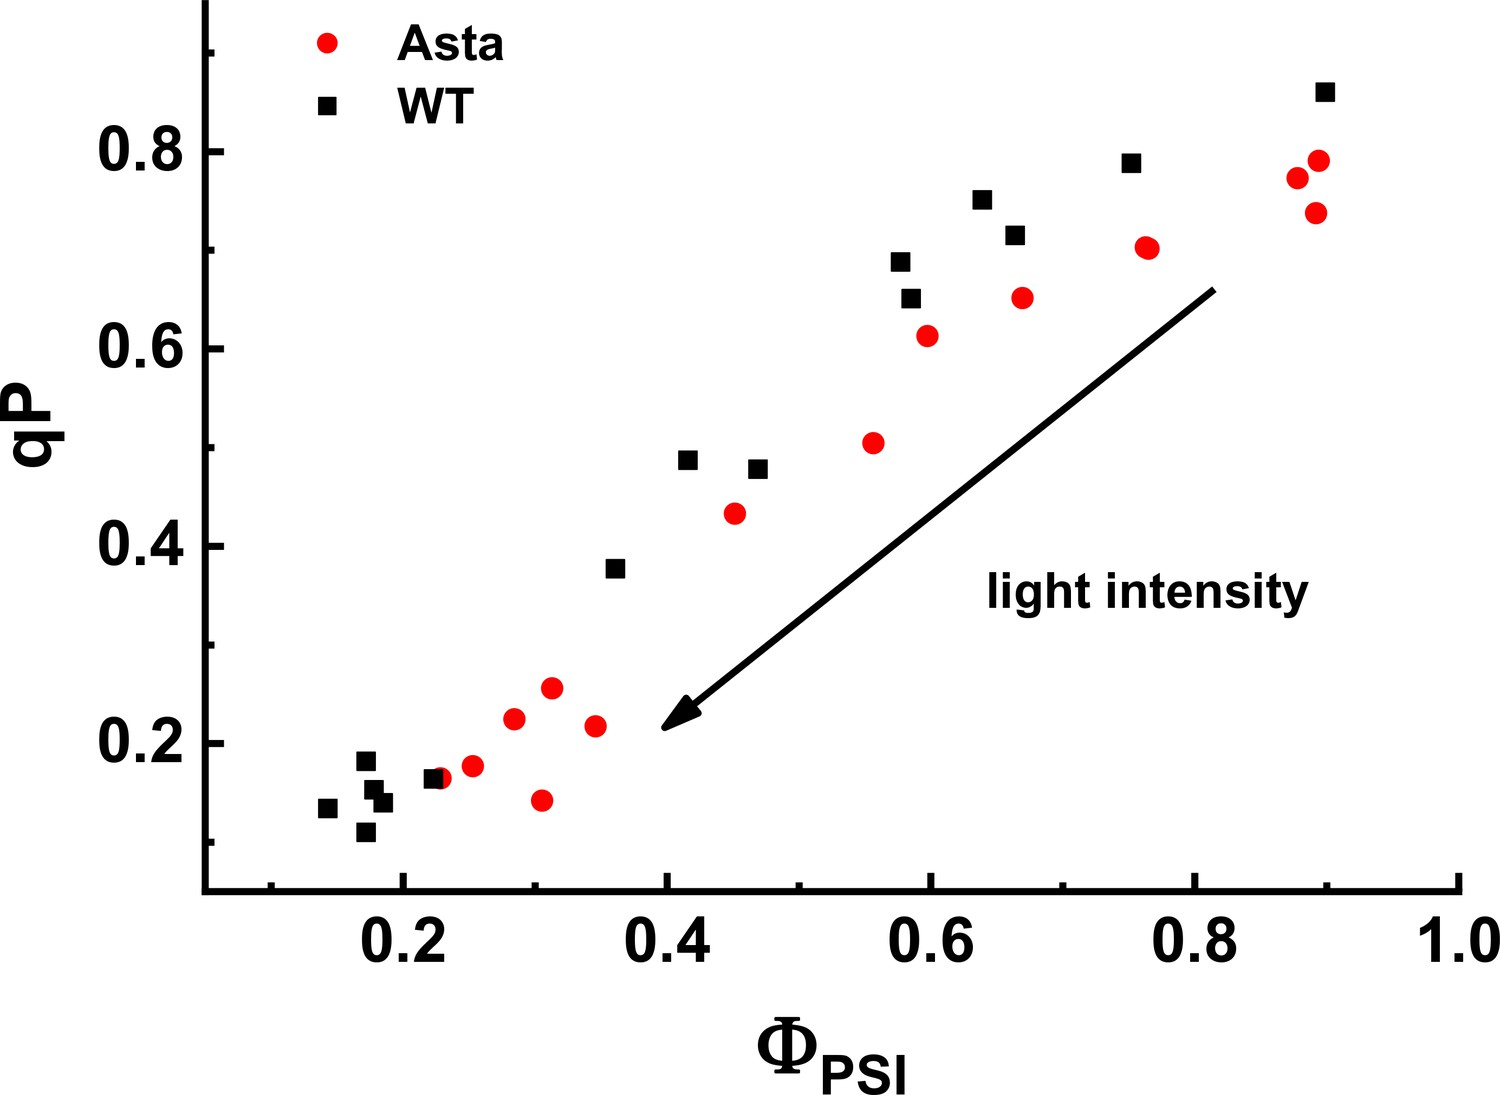
Relation between photochemical quenching (qP) and ΦPSI measured at various light intensities (70–1030 μmol photons m−2 s−1).
Figure 5—figure supplement 5

QA- reoxidation kinetics.
The figure shows the time course of the reoxidation of the primary stable PSII electron acceptor, QA-, during the dark period following a saturating pulse. The fluorescence was probed between 0.1 and 600 s of darkness following a 500 ms exposure to 3500 µE m−2 s−1 red light. The decrease of fluorescence was recalculated to represent the QA- concentration (see Materials and methods for details).
Figure 5—figure supplement 6
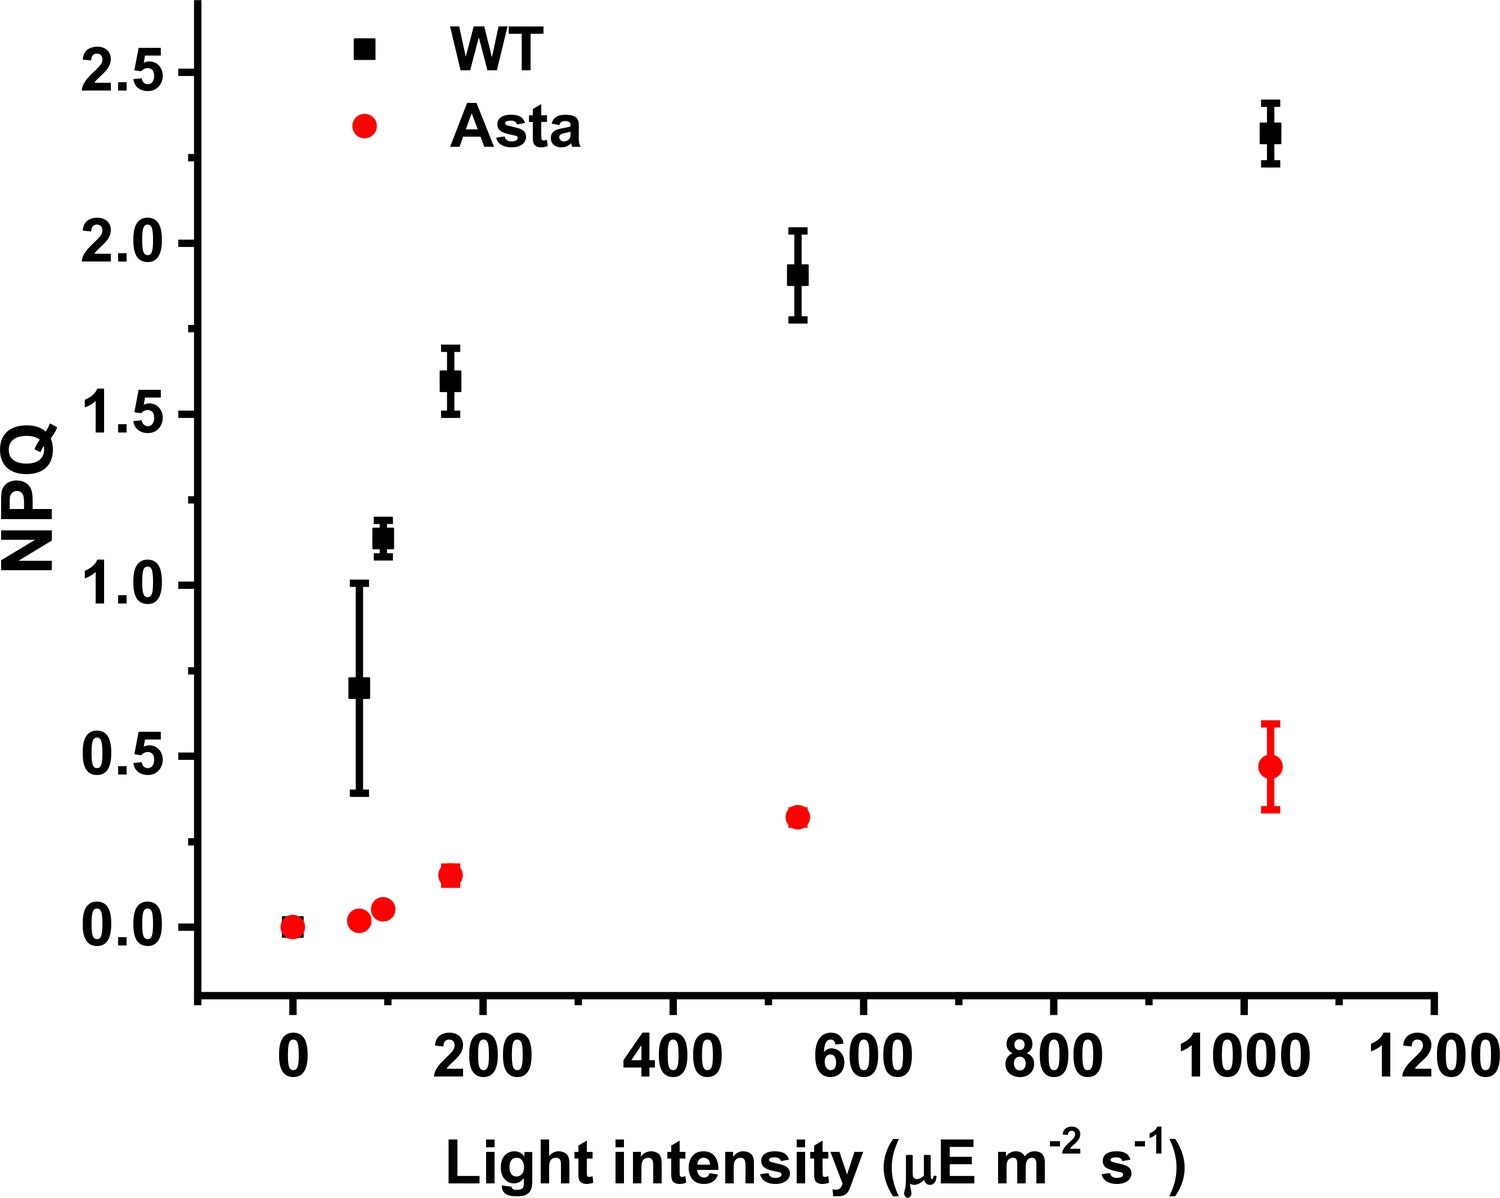
Light dependence of NPQ.
Steady-state NPQ (10 min of illumination at each light intensity) is plotted as a function of actinic light intensity for both WT and Asta plants. Both lines show a similar sigmoidal shape of the NPQ capacity bar for the amplitude of light-induced NPQ, which is vastly decreased in mutant plants. (Average values ± SD are shown for n = 3 leaves/plants, biological replicas.).
Figure 5—figure supplement 7
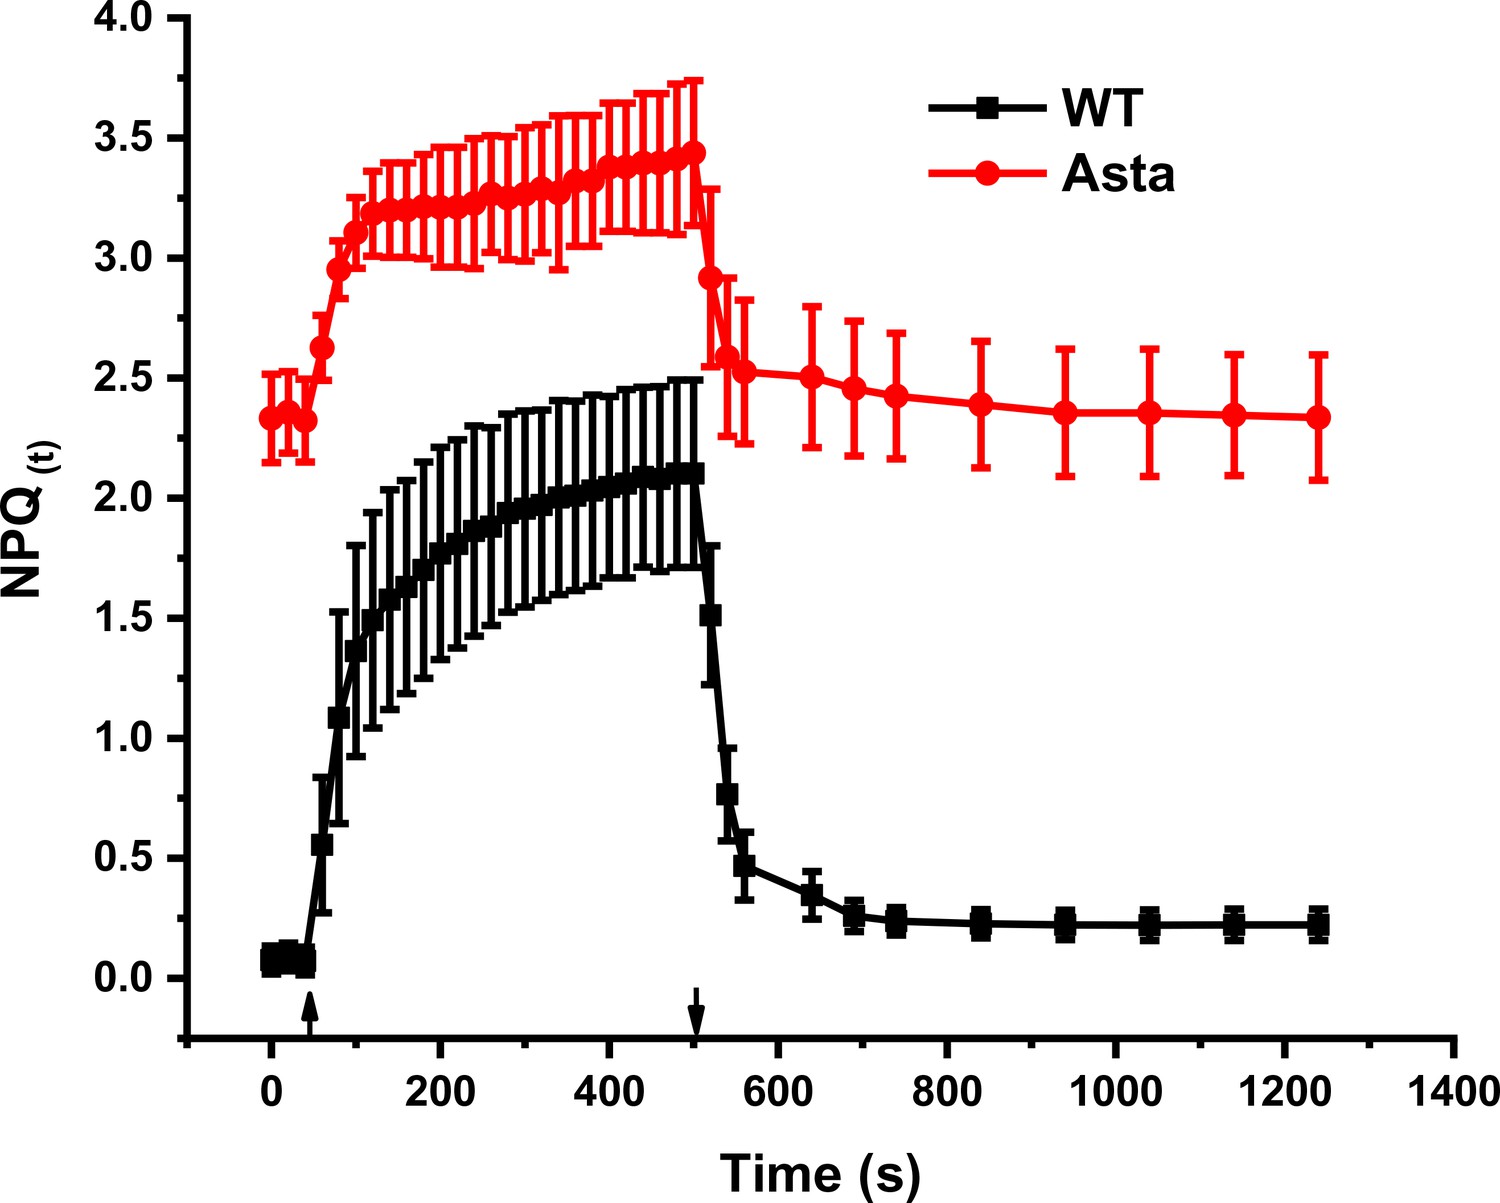
NPQ(t) in WT and Asta mutant.
NPQ values from Figure 5b were used to calculate NPQ(T) (Tietz et al., 2017), a parameter which corrects the apparent NPQ amplitude for the presence of a constitutive quencher. The rate of this constitutive quenching is derived from the FV/FM value decrease in the mutant, assuming that the entirety of the effect on FV/FM is due to this extra energy dissipation. Note that a small amount of QA reduced in darkness leads to overestimation of F0 and significantly lowers the NPQ(T) amplitude (n = 3 biological replicas).
Tables
Table 1
Pigment composition of leaves.
| Samples | Chl a/b | Chl/car | Chl/fresh wt (mg/g) | Chl/leaf area # (mg) |
|---|---|---|---|---|
| WT | 3.79 ± 0.09 | 4.21 ± 0.20 | 2.63 ± 0.39 | 0.0312 ± 0.0026 |
| Asta mature leaves | 3.01 ± 0.10 | 3.02 ± 0.22 | 0.58 ± 0.07 | 0.0062 ± 0.0008 |
| Asta young leaves | 3.16 ± 0.19 | 0.76 ± 0.13 | 0.55 ± 0.09 | 0.0049 ± 0.0011 |
-
(#50 mm2; Average values ± SD are shown. n = 10 biological replicas).
Table 2
Pigment composition of isolated thylakoidal complexes.
| Samples | Chl a/b | Chl/car | Lute+neo+viola | β-caro | Asta and its bypass products | Total chls* |
|---|---|---|---|---|---|---|
| WT Lhcb Monomers | 2.41 ± 0.01 | 4.1 ± 0.03 | 2.86 ± 0.01 | 0.06 ± 0.01 | n.d. | 12 |
| WT LHCII trimer | 1.40 ± 0.00 | 3.60 ± 0.01 | 3.90 ± 0.01 | n.d. | n.d. | 14 |
| Asta-Lhcb mon | 1.48 ± 0.01 | 4.50 ± 0.03 | n.d. | n.d. | 3.1 ± 0.02 | 14 |
| WT PSII | 8.88 ± 0.12 | 5.00 ± 0.02 | 3.47 ± 0.08 | 3.93 ± 0.08 | n.d. | 37 |
| Asta PSII | 7.74 ± 0.27 | 8.90 ± 0.17 | n.d. | 0.03 ± 0.01 | 4.12 ± 0.01 | 37 |
| WT PSI-LHCI | 9.29 ± 0.12 | 4.60 ± 0.02 | 14.37 ± 0.16 | 19.56 ± 0.16 | n.d. | 156 |
| Asta-PSI-LHCI | 5.44 ± 0.19 | 8.10 ± 0.18 | n.d. | 0.15 ± 0.03 | 19.11 ± 0.03 | 156 |
-
*Total Chls are based on values reported in the literature for the WT complexes (Qin et al., 2015; Su et al., 2017). The chromatograms are shown in Figure 3—figure supplement 2. (Average values ± SD are shown. n ≥ 3 biological replicas, n.d. = not detected).
Table 3
In vivo photosystem II parameters.
| FV/FM* | PSII:PSI ratio (ECS)# | PSII:PSI antenna size (ECS)# | Relative PSII antenna size (fluorescence)§§ | |
|---|---|---|---|---|
| WT | 0.82 ± 0.01 | 1.09 ± 0.12 | 1 ± 0.59 | 1 ± 0.04 |
| Asta | 0.43 ± 0.03 | 2.6 ± 0.33 | 0.33 ± 0.05 | 0.33 ± 0.02 |
-
(Average values ± SD are shown. *n = 15, #n = 4, §§n = 3 leaves/plants).
Additional files
Download links
A two-part list of links to download the article, or parts of the article, in various formats.
Downloads (link to download the article as PDF)
Open citations (links to open the citations from this article in various online reference manager services)
Cite this article (links to download the citations from this article in formats compatible with various reference manager tools)
Photosynthesis without β-carotene
eLife 9:e58984.
https://doi.org/10.7554/eLife.58984


