Lysosomal protein surface expression discriminates fat- from bone-forming human mesenchymal precursor cells
- Departments of Pathology, Johns Hopkins University, United States
- Departments of Orthopaedics, Johns Hopkins University, United States
- Department of Oral and Maxillofacial Surgery, School of Stomatology, China Medical University, China
- UCLA and Orthopaedic Hospital Department of Orthopaedic Surgery and the Orthopaedic Hospital Research Center, United States
- Departments of Plastic Surgery, Johns Hopkins University, United States
- Center For Cardiovascular Science and Center for Regenerative Medicine, University of Edinburgh, United Kingdom
Figures
Figure 1 with 3 supplements
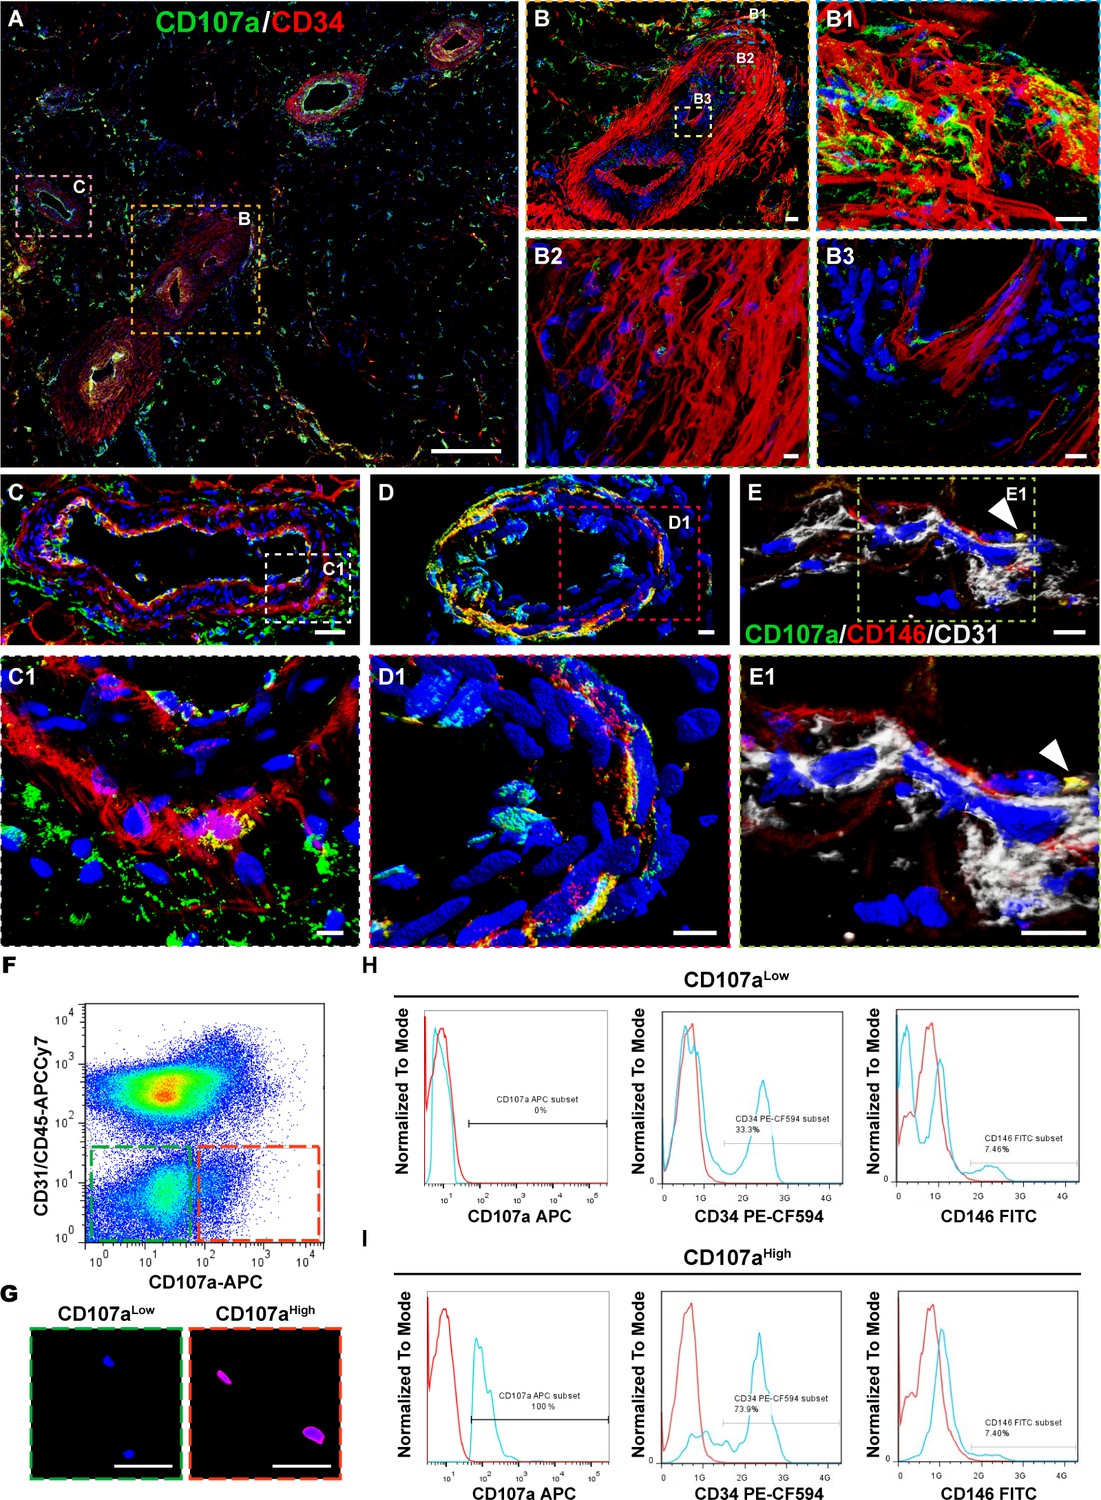
Perivascular CD107a expression typifies a subset of perivascular cells within human subcutaneous white adipose tissue (WAT).
Immunofluorescent staining of CD107a (green) and CD34 (red) in human adipose tissue. (A) Tile scan. (B) Larger artery in cross-section, including (B1) outer tunica adventitia, (B2) inner tunica adventitia, and (B3) tunica media and intima. (C) Larger vein in cross-section, including (C1) high magnification of vessel wall. (D) Smaller caliber artery in cross-section, including (D1) high magnification of vessel wall. (E) Capillary in longitudinal cross-section, and (E1) high magnification. (F) Representative FlowJo plot to demonstrate partitioning CD107alowCD31-CD45- and CD107ahighCD31-CD45- fractions from human stromal vascular fraction (SVF). Frequency of CD107alow/high cells across samples is shown in Supplementary file 1 (N = 8 samples). (G) Confirmatory immunofluorescent staining of FAC-sorted CD107alow and CD107ahigh mesenchymal cells (CD31-CD45-PI- cells). (H,I) Representative flow cytometry analysis of freshly isolated CD107alow and CD107ahigh mesenchymal cells, including CD107a, CD34, and CD146. Frequency of expression is shown in relation to isotype control (blue vs. red lines). Frequency of CD34+ and CD146+ cells across all samples is shown in Supplementary file 2, 3 (N = 4 samples). Scale bars: 500 μm (A), 50 μm (B,C,G) and 10 μm (B1–B3,C1,D,D1,E,E1).
Figure 1—figure supplement 1
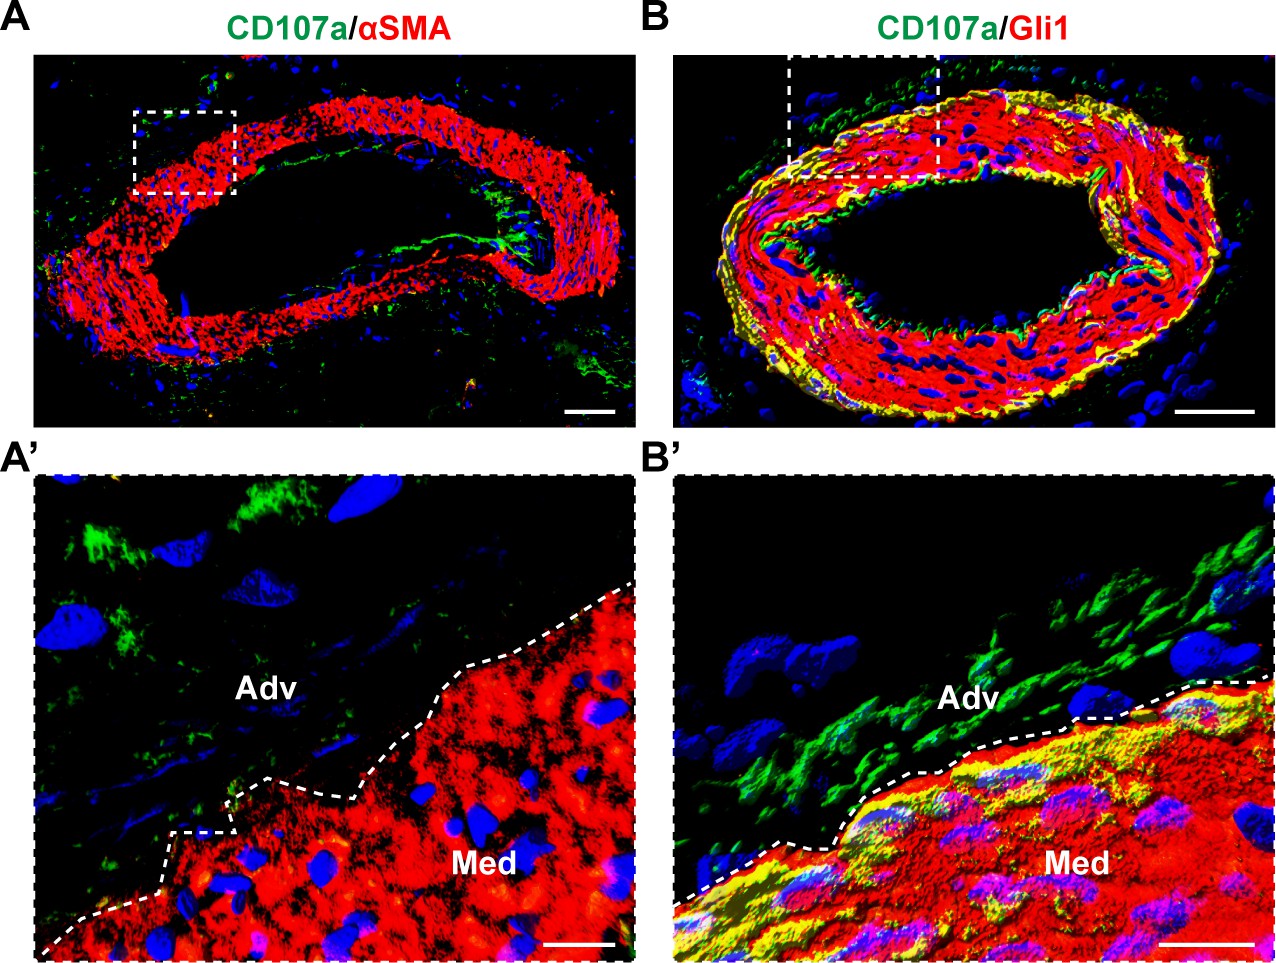
Comparison of CD107a expression with either αSMA or Gli1 in human adipose tissue.
(A) Co-immunostaining of CD107a (green) and αSMA (red). (A’) High magnification image of outer vessel wall. (B) Co-immunostaining of CD107a (green) with Gli1 (red). (B’) High Magnification image of outer vessel wall. Overlap appears yellow. White scale bar: 50 μm (upper panels) and 15 μm (lower panels). Med: Tunica media; Adv: Tunica adventitia. N = 3 human samples examined.
Figure 1—figure supplement 2
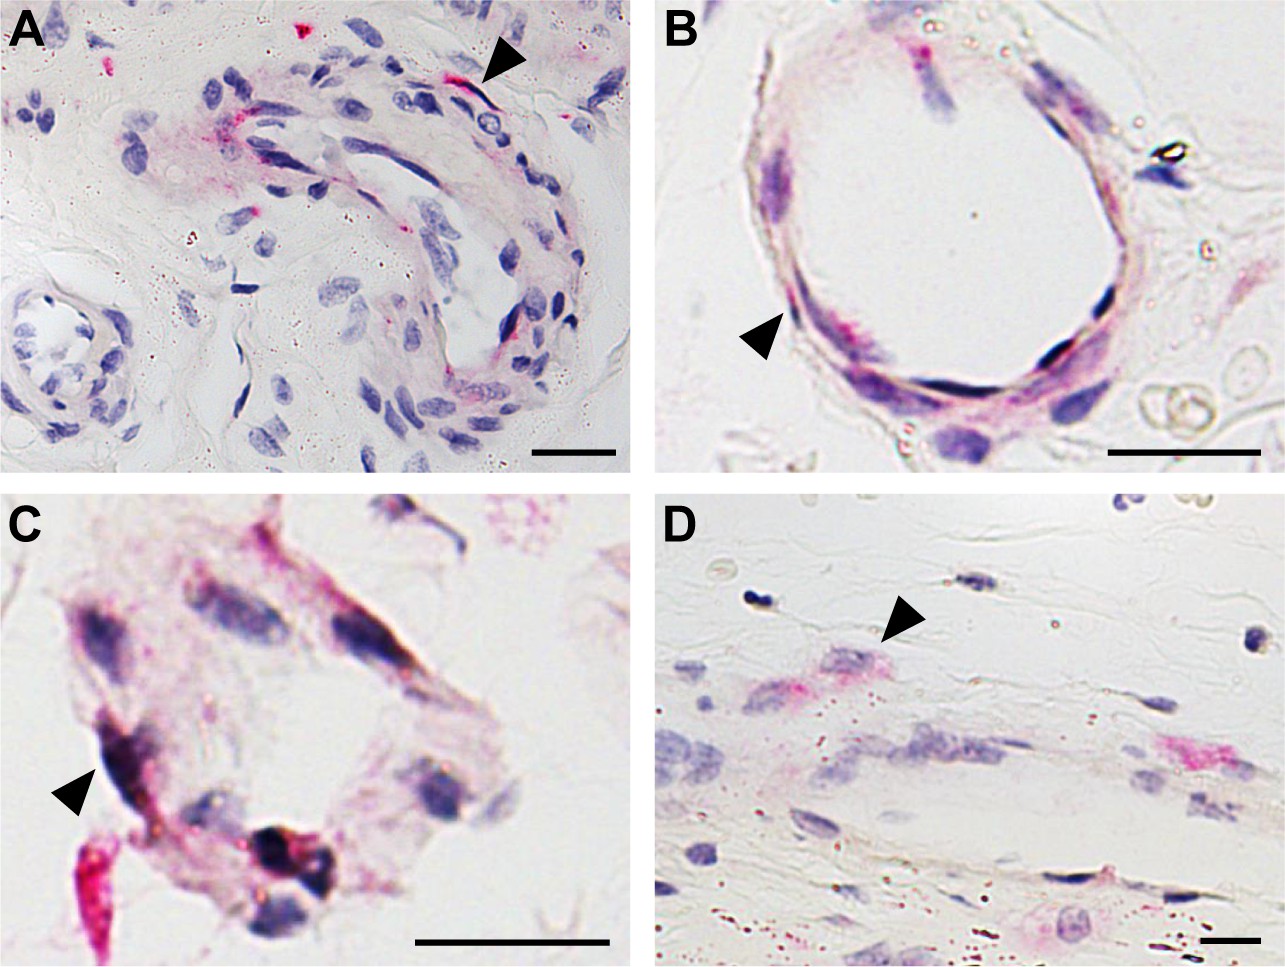
Perivascular CD107a immunohistochemical staining in diverse human adipose tissues.
(A) Visceral pericardial fat, (B) visceral perigonadal fat, (C) visceral perirenal fat, and (D) omental fat. CD107a positive staining appears red (black arrowheads). N = 3 human samples per tissue depot examined. Black scale bar: 20 μm.
Figure 1—figure supplement 3
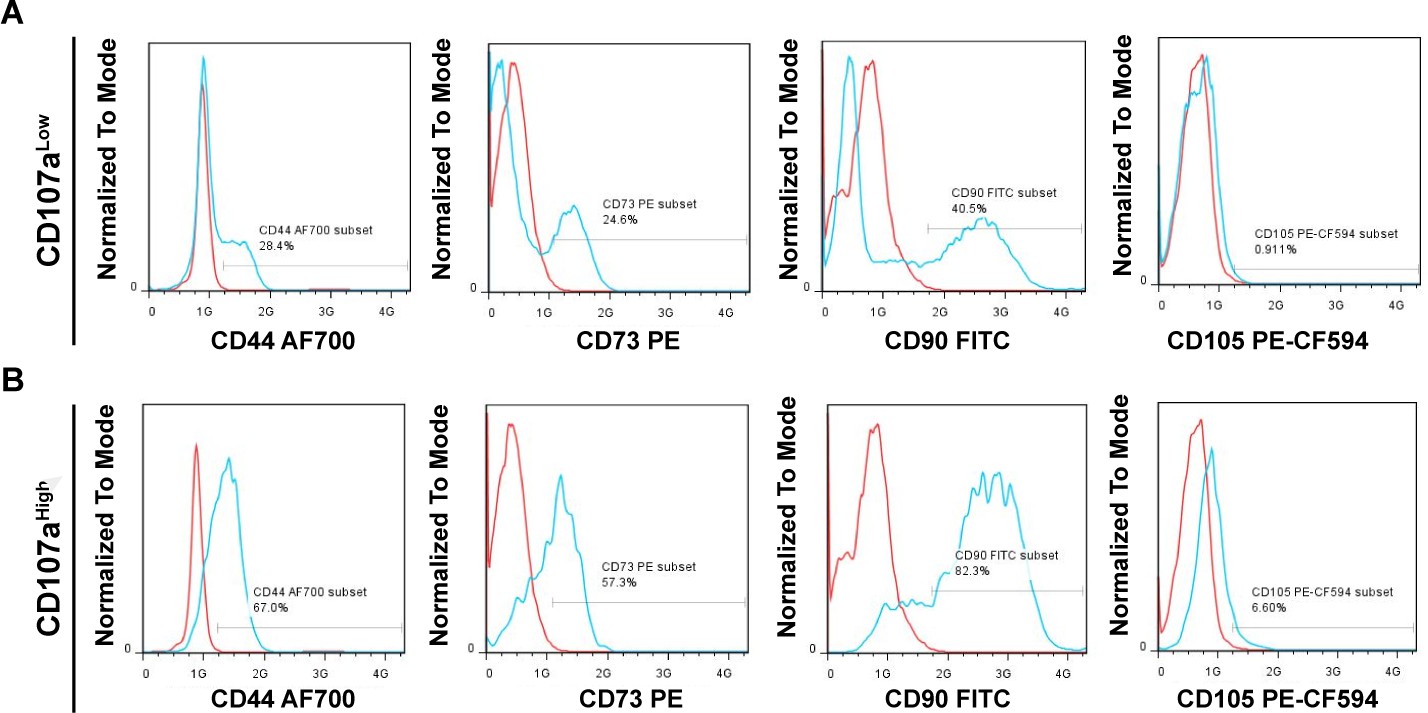
Flow cytometry of canonical human mesenchymal stem cell (MSC) markers among freshly isolated CD107alow/high cells from a representative patient sample.
(A, B) Expression of CD44, CD73, CD90, and CD105 within (A) CD107alow and (B) CD107ahigh cells. Frequency of expression is shown in relation to isotype control antibody (blue vs. red lines). Corresponding tabular data from N = 3 human samples is shown in Supplementary file 4.
Figure 2 with 1 supplement
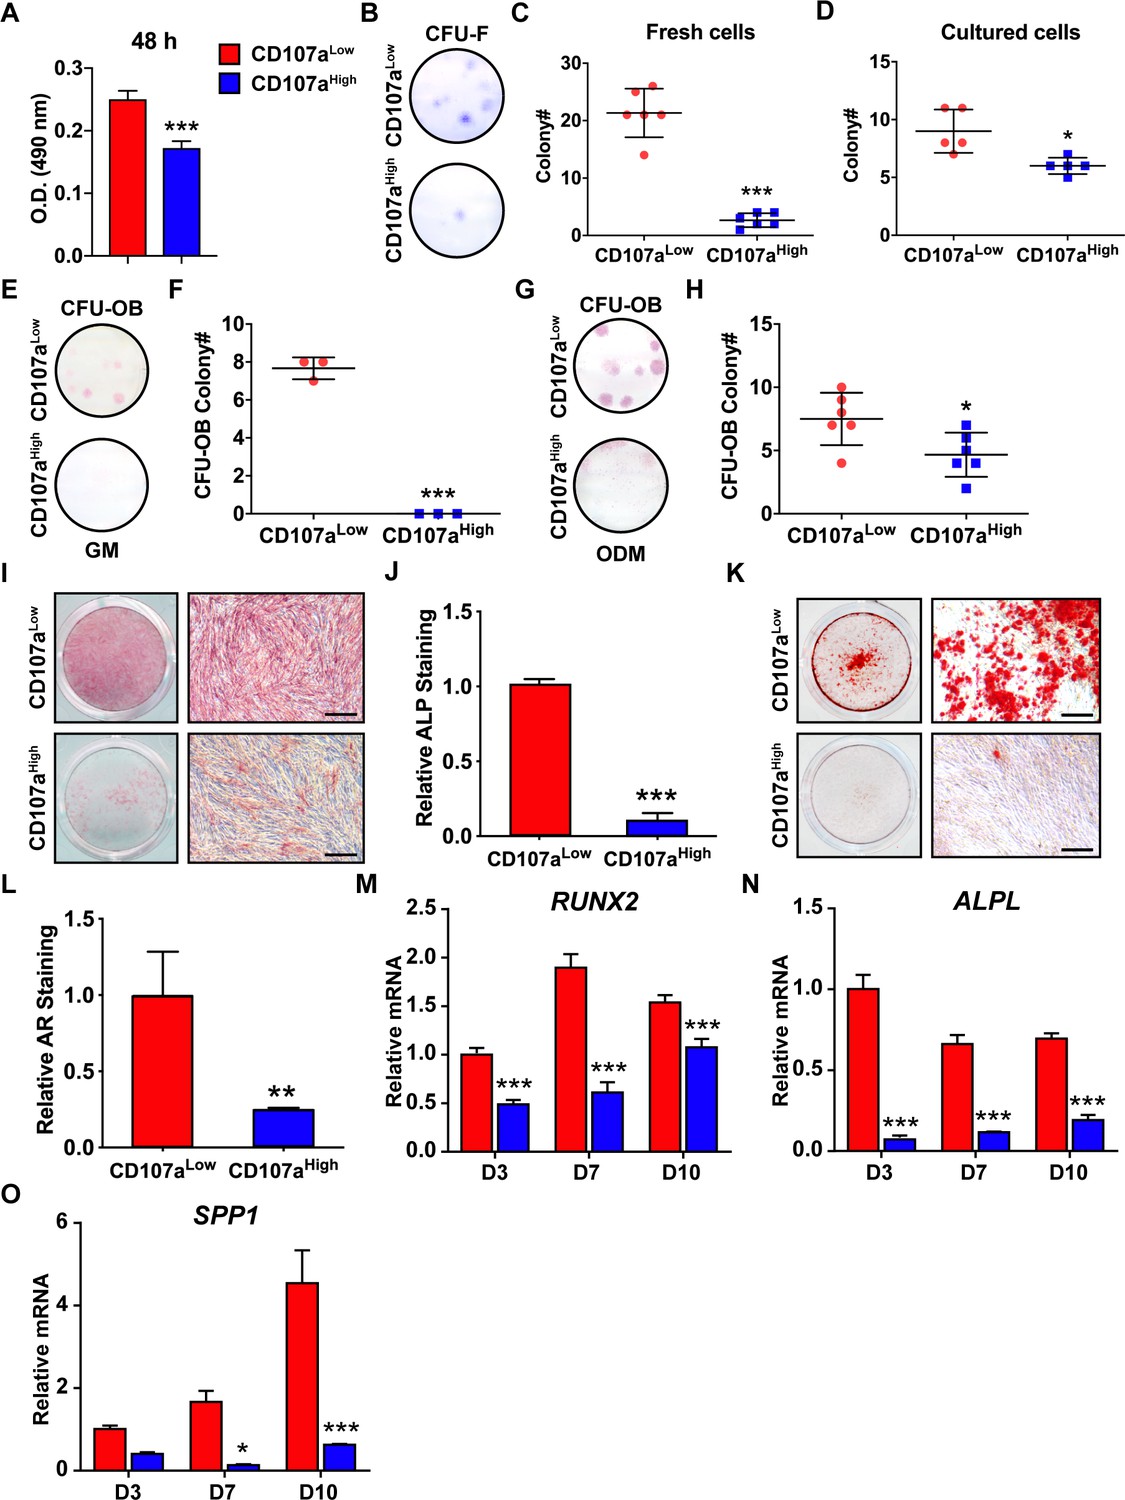
Stem/osteoprogenitor cell identity of CD107alow mesenchymal cells.
CD107alowCD31-CD45- and CD107ahighCD31-CD45- cells derived from the same sample of human subcutaneous WAT were exposed to the indicated growth or osteogenic conditions. (A) Cell proliferation among CD107alow and CD107ahigh mesenchymal cells, by MTS assays at 48 hr. (B–D) Fibroblastic colony formation frequency (CFU-F) among human CD107alow and CD107ahigh mesenchymal cells, shown by (B) representative images among freshly isolated cells, (C) CFU-F quantification among freshly isolated cells, (D) CFU-F quantification among passage 4 cells. Whole well images are shown. (E–H) Osteoblastic colony formation frequency (CFU-OB) detected in human CD107alow and CD107ahigh cells. Experiments performed in growth medium (GM) (E,F) or osteogenic differentiation medium (ODM) (G,H). Whole well images are shown. (I,J) Alkaline phosphatase (ALP) staining and photometric quantification at d 10 of osteogenic differentiation among human CD107alow and CD107ahigh cells. Representative whole well and high magnification images are shown. (K,L) Alizarin red (AR) staining and photometric quantification at d 10 of osteogenic differentiation among human CD107alow and CD107ahigh cells. Representative whole well and high magnification images are shown. (M–O) Osteogenic gene expression among human CD107alow and CD107ahigh cells by qRT-PCR at d 3, 7, and 10 of differentiation, including (M) Runt related transcription factor 2 (RUNX2), (N) ALPL, and (O) Osteopontin (SPP1). Osteogenic differentiation examined in N = 3 human cell preparations, and at least experimental triplicate. Dots in scatterplots represent values from individual wells, while mean and one SD are indicated by crosshairs and whiskers. In column graphs, mean values and one SD are shown. *p<0.05; **p<0.01; ***p<0.01 in relation to corresponding CD107alow cell population. Statistical analysis was performed using a two-tailed Student t-test (A–L) or two-way ANOVA followed by Sidak’s multiple comparisons test (M–O). Experiments performed in at least biologic triplicate. Scale bars: 200 μm.
Figure 2—figure supplement 1
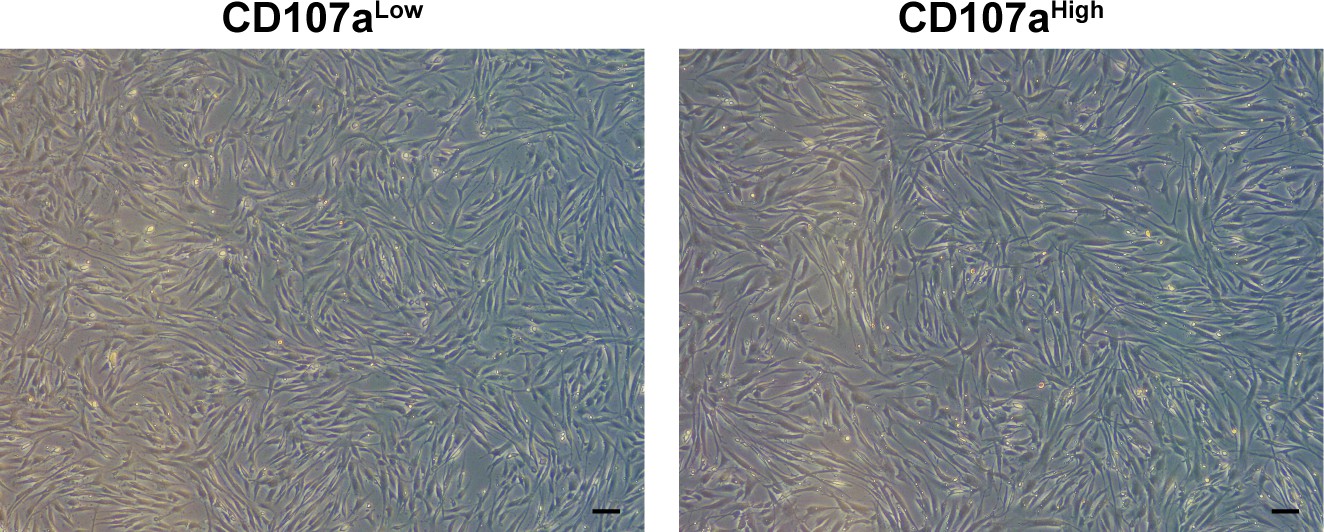
Representative morphology of confluent human CD107alow and CD107ahigh cells.
Passage 4. N = 8 samples examined. Black scale bar: 100 μm.
Figure 3 with 4 supplements
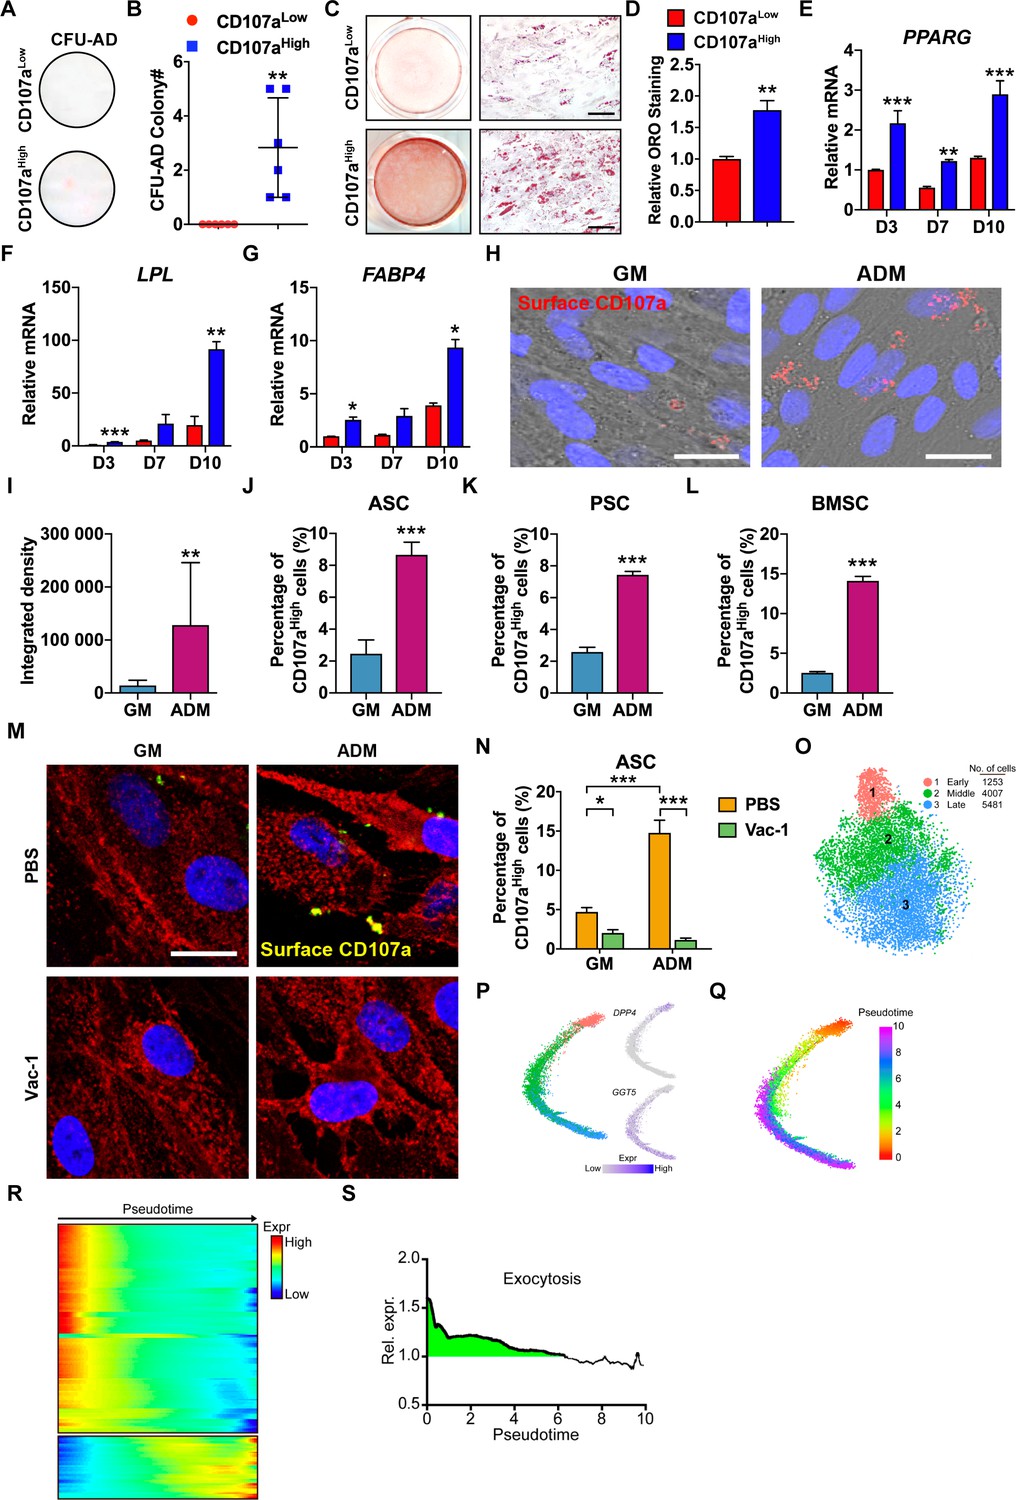
Adipoprogenitor cell identity of CD107ahigh human mesenchymal cells and correlation to exocytosis during early adipogenic differentiation.
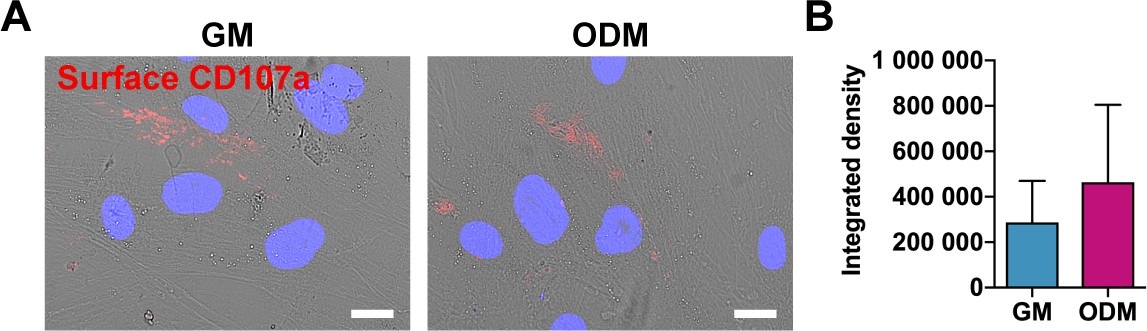
(A–G) CD107alowCD31-CD45- and CD107ahighCD31-CD45- cells derived from human subcutaneous WAT were exposed to adipogenic differentiation conditions. (A,B) Adipocyte colony formation frequency (CFU-AD) detected in human CD107alow and CD107ahigh cells. Whole well images shown. (C,D) Oil red O (ORO) staining and photometric quantification at d7 of adipogenic differentiation among human CD107alow and CD107ahigh cells. Representative whole well and high magnification images shown. (E–G) Adipogenic gene expression among human CD107alow and CD107ahigh cells by qRT-PCR at d 3, 7, and 10 of differentiation, including (E) Peroxisome proliferator-activated receptor-γ (PPARG), (F) Lipoprotein lipase (LPL), and (G) Fatty acid-binding protein 4 (FABP4). (H) Immunocytochemical staining of membranous CD107a in the presence of growth medium (GM) or adipogenic differentiation medium (ADM) after 3 d using human, culture-defined adipose-derived stem cells (ASCs). CD107a immunoreactivity appears red, nuclear counterstain appears blue. (I) Photographic quantification of membranous CD107a immunofluorescence under GM or ADM conditions. (J–L) Induction of membranous CD107a expression after adipogenic differentiation across cell types, including (J) culture-defined human ASCs, (K) FACS-purified human perivascular stem cells (PSC), and (L) culture-defined human BMSCs, assessed by flow cytometry after 3 d under GM or ADM conditions. (M,N) Trafficking of CD107a to the cell surface during adipogenesis was inhibited after treatment with Vacuolin-1 (Vac-1, 1 μM), assessed by CD107a immunostaining (M) and flow cytometry (N) after 3 d under GM and ADM conditions. The cell membrane was labeled using Wheat Germ Agglutinin Conjugates (red), while overlap with CD107a immunostaining appears yellow, and DAPI nuclear counterstain appears blue. (O) Dimensional reduction and unsupervised clustering of human stromal vascular fraction (SVF) adipogenic lineage from subcutaneous WAT revealed three cell groups. (P) Trajectory analyses of human SVF adipogenic lineage, colored based on their unsupervised clustering identity. DPP4 (early) and GGT5 (late) expression were used to identify trajectory origin. (Q) Pseudotemporal cell ordering along differentiation trajectories. Pseudotime is depicted from red to purple. (R) Expression heatmap across pseudotime of genes associated with exocytosis. (S) Combined, normalized expression of exocytosis genes shows enrichment (>1) in early progenitors (green shaded area), while more differentiated cells show reduced average expression. Dots in scatterplots represent values from individual wells, while mean and one SD are indicated by crosshairs and whiskers. In column graphs, mean values and one SD are shown. *p<0.05; **p<0.01; ***p<0.001. Statistical analysis was performed using a two-tailed Student t-test (B,D,I–L) or two-way ANOVA followed by Sidak’s multiple comparisons test (E–G,N). Experiments performed in at least biologic triplicate. Black scale bar: 100 μm; white scale bar: 20 μm.
Figure 3—figure supplement 1
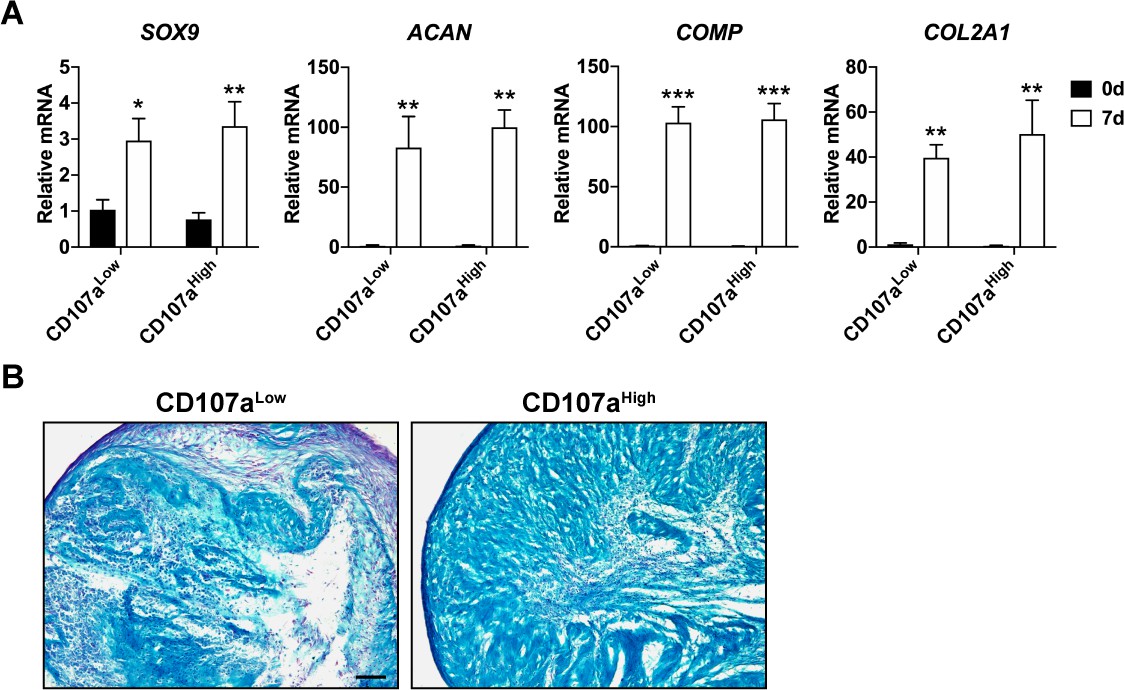
Chondrogenic differentiation among human CD107alow and CD107ahigh cells.
(A) Chondrogenic gene expression among human CD107alow and CD107ahigh mesenchymal cells, including SRY-Box transcription factor 9 (SOX9), Aggrecan (ACAN), Cartilage oligomeric matrix protein (COMP), and Collagen type 2 A1 (COL2A1), assessed by qRT-PCR at 0 and 7 d of differentiation. (B) Chondrogenic differentiation, as assessed by alcian blue staining at 28 d of differentiation in high-density micromass culture. Black scale bar: 100 μm. *p<0.05; **p<0.01; ***p<0.001 in relation to corresponding 0 d sample. Statistical analysis was performed using a two-way ANOVA followed by Sidak’s multiple comparisons test. Data repeated in experimental triplicates.
Figure 3—figure supplement 2
No change in membranous CD107a during osteogenic differentiation among human ASCs.
(A) Immunocytochemical staining for membranous CD107a expression in the absence or presence of osteogenic differentiation medium for 3 d of differentiation. CD107a immunoreactivity appears red, DIC appears white. White scale bar: 20 μm. (B) Photometric quantification of membranous CD107a immunofluorescence with or without osteogenic differentiation. GM: Growth medium; ODM: Osteogenic differentiation medium. Data repeated in experimental triplicate. Statistical analysis was performed using a two-tailed Student t- test.
Figure 3—figure supplement 3
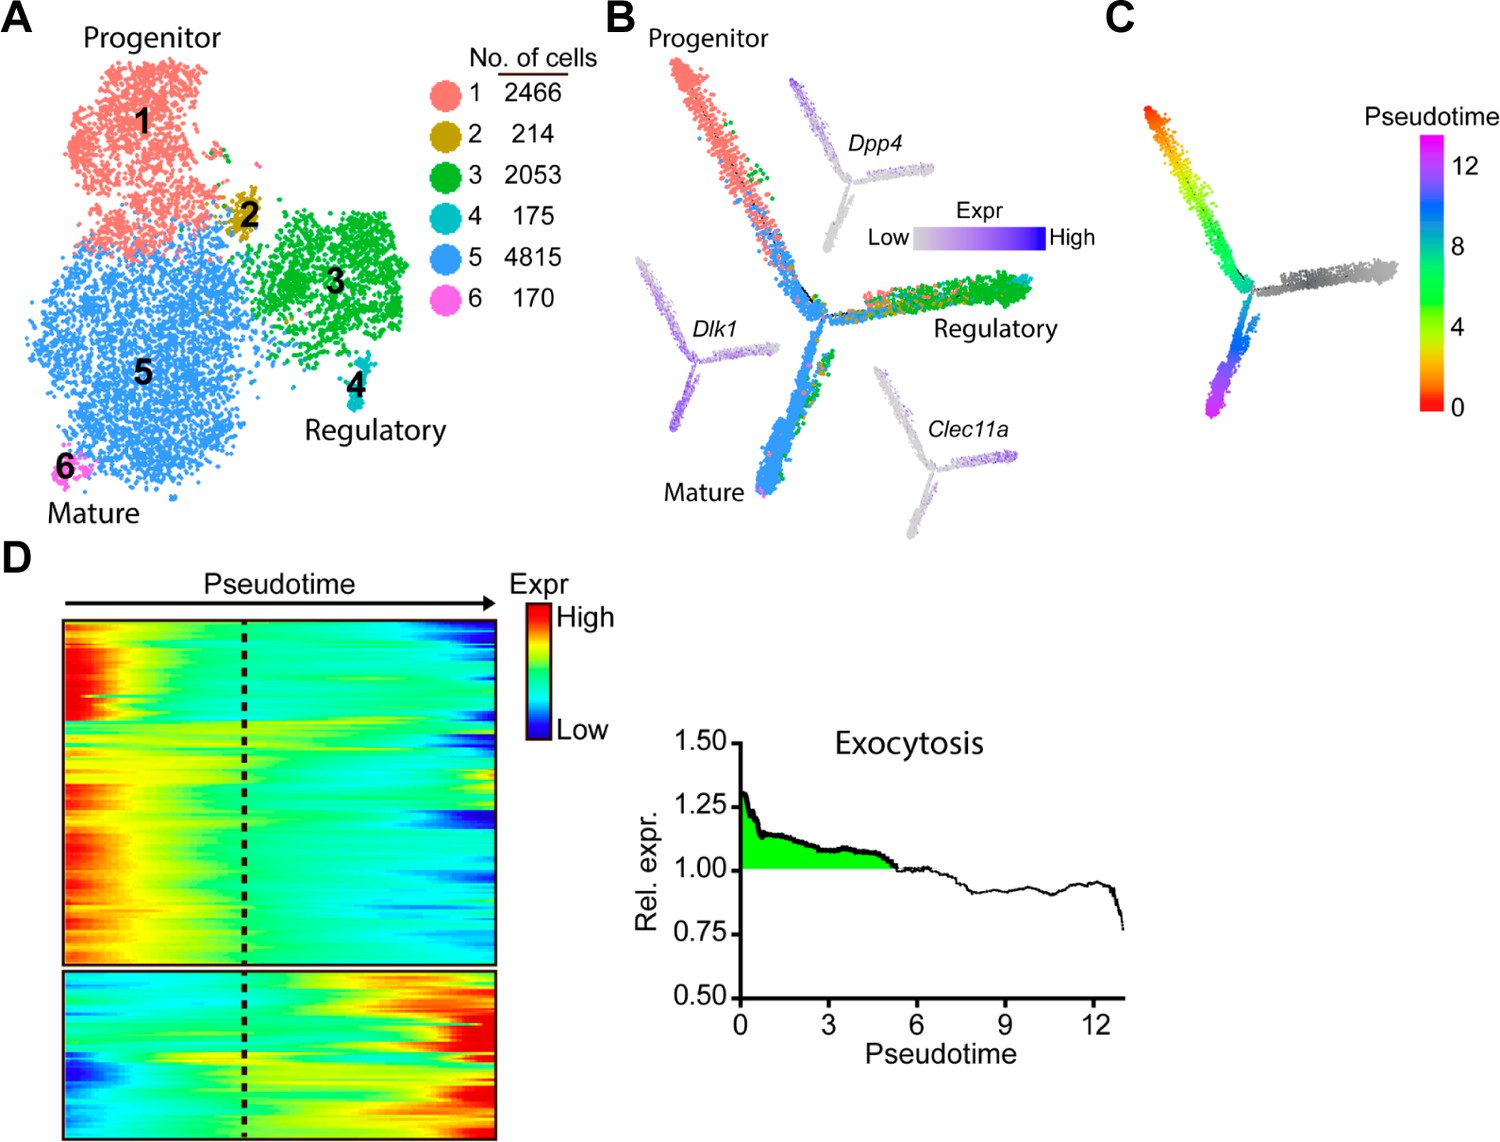
Single-cell RNA sequencing and cell trajectory analysis delineate exocytosis of adipocyte progenitors in mouse subcutaneous white adipose tissue (WAT).
Re-analysis performed using publicly available data (GEO dataset # GSM3717977) (Merrick et al., 2019). (A) Unsupervised clustering of cells from the subcutaneous WAT confirmed six distinct cell groups represented on a tSNE map. (B) Trajectory analyses, color coded based on clustering from panel ‘A’. In similarity to original report (Merrick et al., 2019), Dpp4+ progenitor cells, Clec11a+ regulatory cells, and Dlk1+ pre-adipocytes. Branch identities were confirmed using marker gene expression. (C) Pseudotemporal cell ordering of adipocytes along differentiation trajectories. Clec11a+ regulatory cells (gray) were not included for downstream analyses. (D) Pseudotemporal expression heatmap of genes previously linked to activating/promoting exocytosis. Dotted line denotes branch point between mature and regulatory adipocyte populations. (E) Combined, normalized expression of pro-exocytosis genes shows enrichment (>1) in early progenitors (green shaded area), while more differentiated cells show below average expression.
Figure 3—figure supplement 4
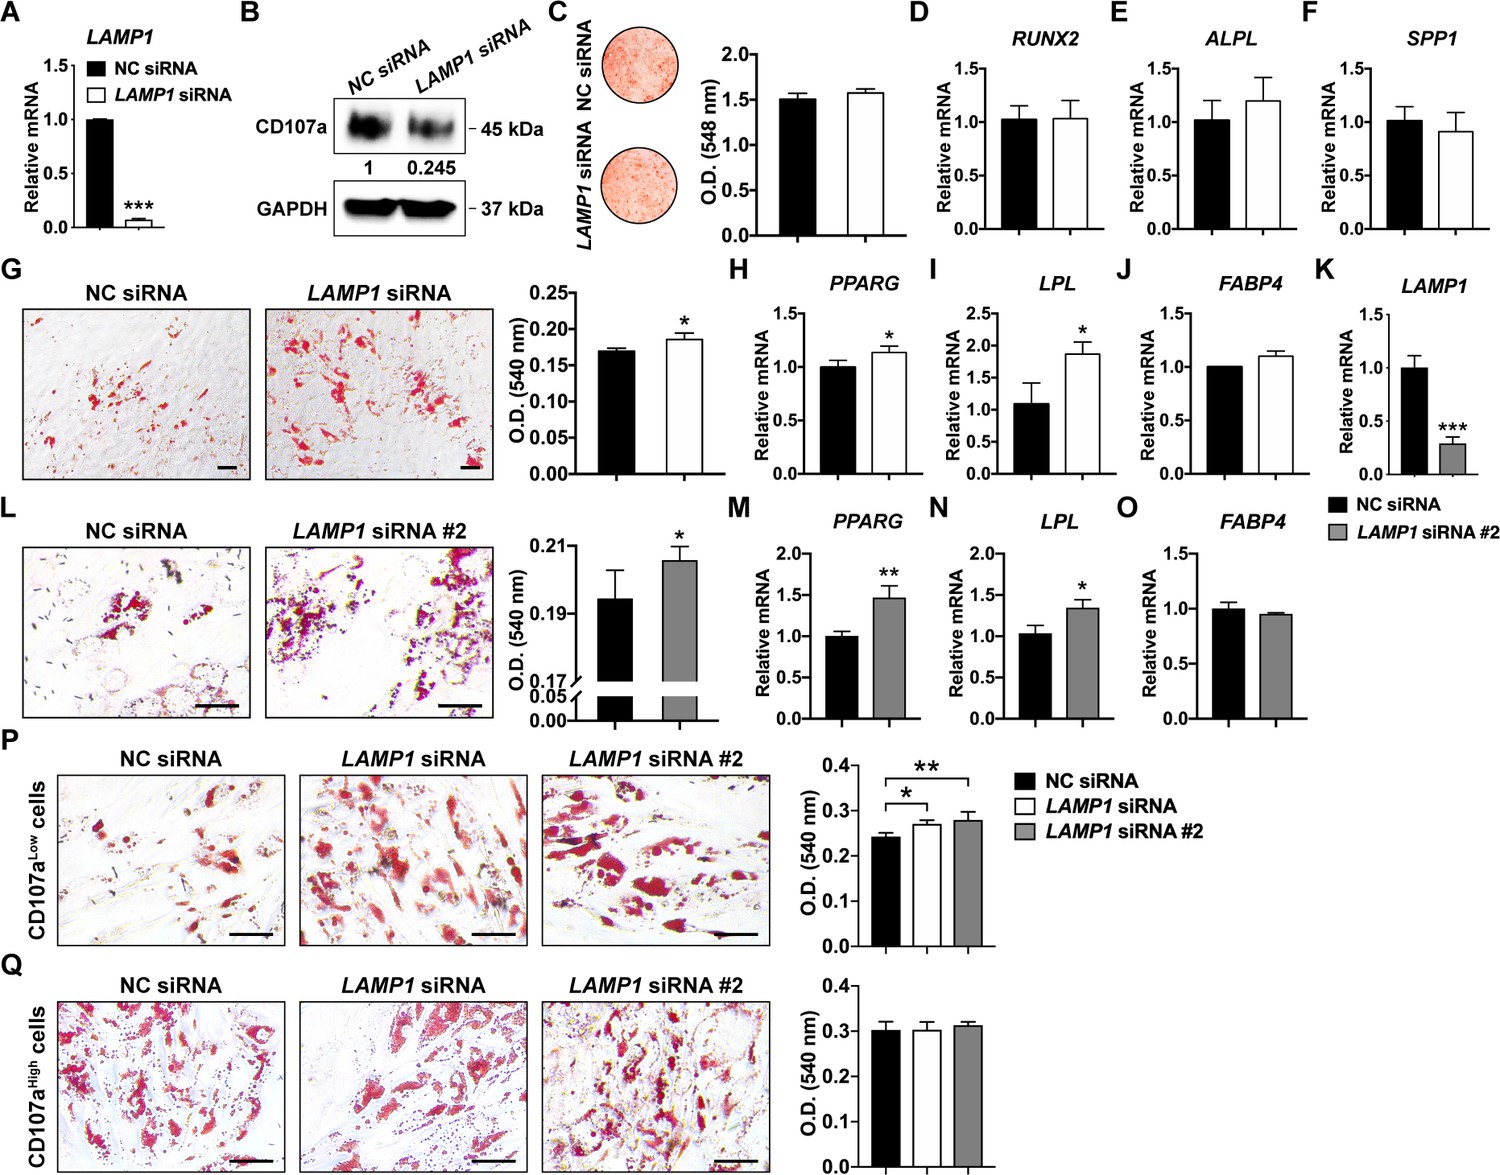
Effect of LAMP1 knockdown (encoding CD107a) on osteogenic and adipogenic differentiation in human ASCs and CD107alow/high cells.
(A) Gene expression of LAMP1 as assessed by qRT-PCR after siRNA-mediated knockdown. (B) Western blotting analyses of CD107a expression in human ASCs after siRNA-mediated knockdown. (C) Alizarin red (AR) staining (left) and photometric quantification (right) at d 7 of osteogenic differentiation with or without LAMP1 siRNA. Whole well shown. (D–F) Osteogenic gene expression with or without LAMP1 siRNA assessed by qRT-PCR, including (D) Runt related transcription factor 2 (RUNX2), (E) Alkaline phosphatase (ALPL), and (F) Osteopontin (SPP1). Gene expression assessed at 7 d of osteogenic differentiation. (G) Oil red O (ORO) staining (left) and photometric quantification (right) at d 7 of adipogenic differentiation with or without LAMP1 siRNA. (H–J) Adipogenic gene expression with or without LAMP1 siRNA, including (H) Peroxisome proliferator-activated receptor-γ (PPARG), (I) Lipoprotein lipase (LPL), and (J) Fatty acid-binding protein 4 (FABP4). Gene expression assessed at 7 d of adipogenic differentiation. NC, negative control. (K) Gene expression of LAMP1 as assessed by qRT-PCR after #2 siRNA-mediated knockdown. (L) ORO staining (left) and photometric quantification (right) at d 7 of adipogenic differentiation with or without LAMP1 siRNA #2. (M–O) Adipogenic gene expression (7 d) with or without LAMP1 siRNA #2, including (M) PPARG, (N) LPL, and (O) FABP4. (P,Q) ORO staining (left) and photometric quantification (right) at d 7 of adipogenic differentiation with or without LAMP1 siRNA in (P) CD107alow and (Q) CD107ahigh cells. Black scale bar: 50 μm. Data repeated in experimental triplicate wells. *p<0.05; **p<0.01; ***p<0.001. Statistical analysis was performed using a two-tailed Student t-test or a one-way ANOVA followed by Tukey’s post hoc test.
Figure 4 with 2 supplements
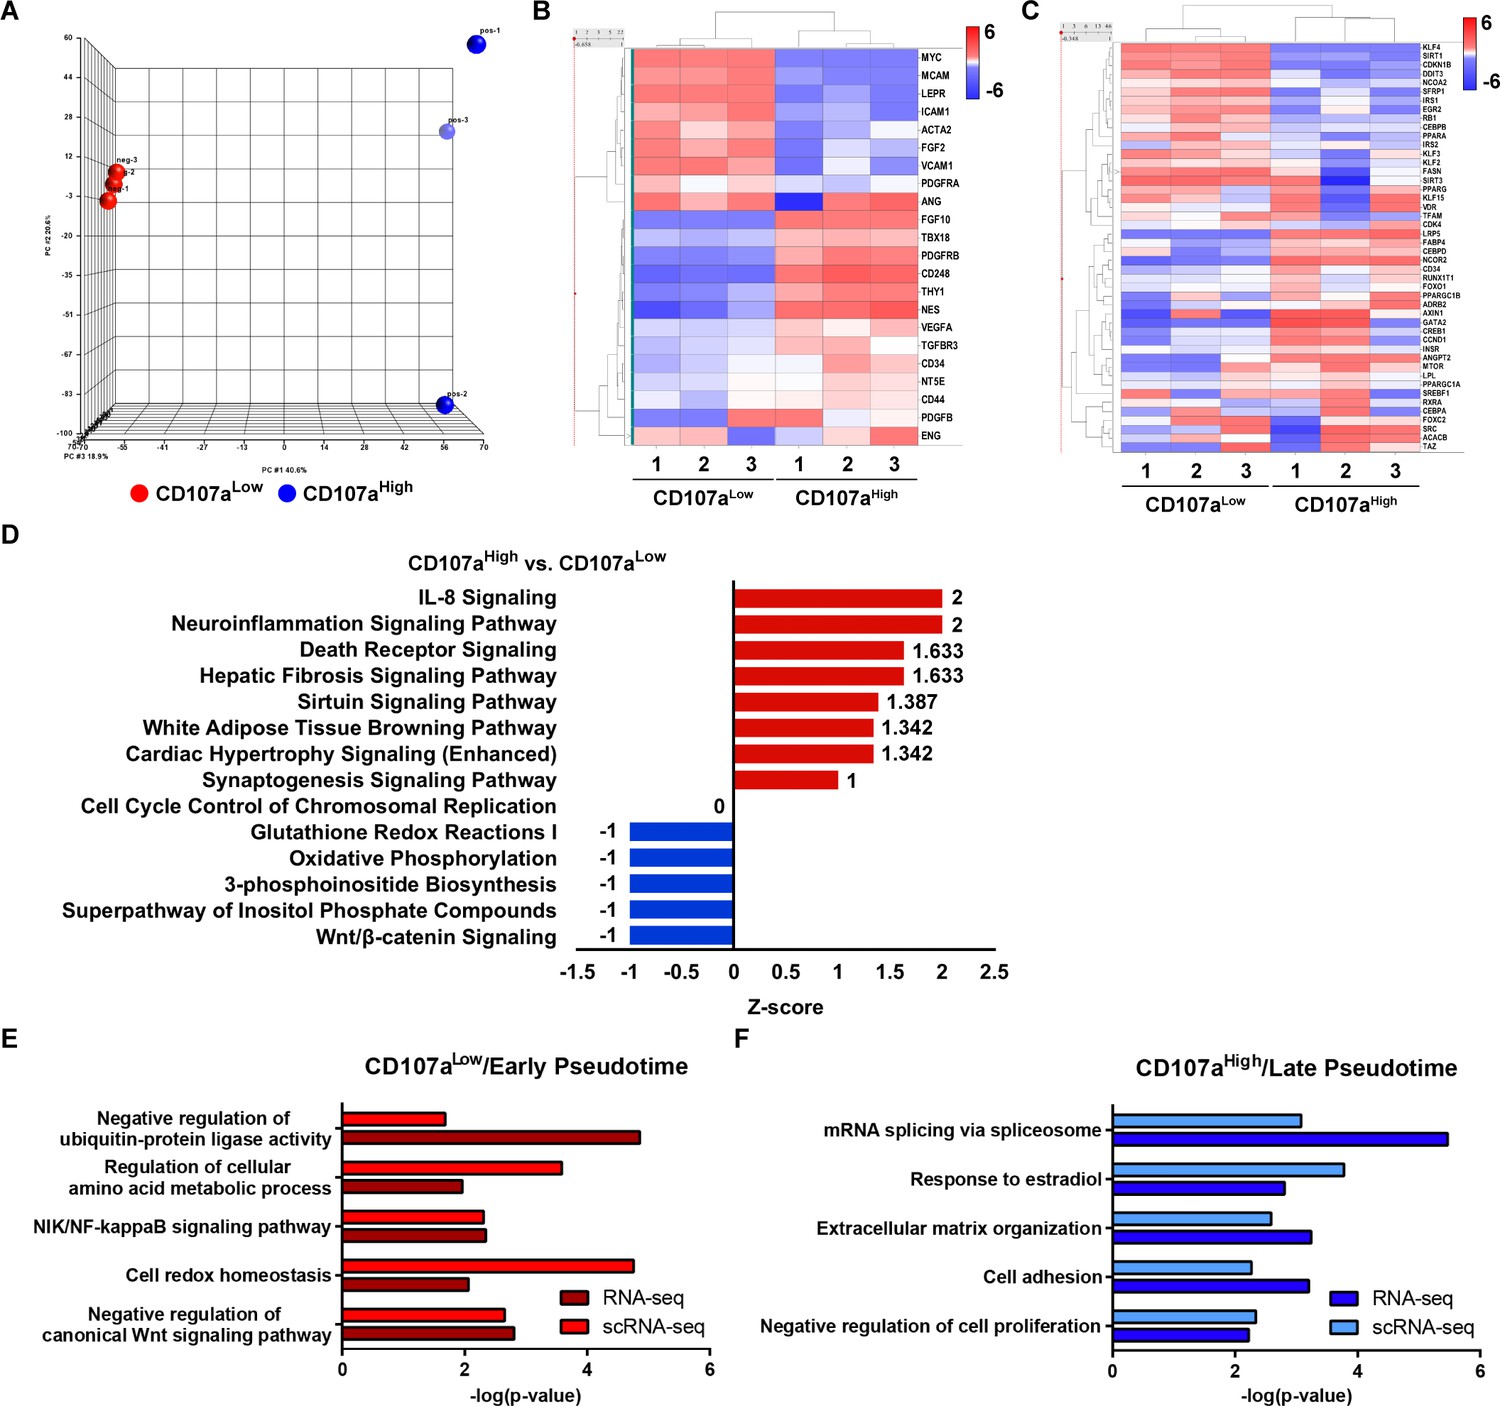
Bulk RNA sequencing among uncultured CD107alow and CD107ahigh mesenchymal cells and relationship to putative adipose cell hierarchy.
(A–F) Total RNA sequencing comparison of CD107alowCD31-CD45- and CD107ahighCD31-CD45- mesenchymal cells from a single human subcutaneous WAT sample. (A) Principal component analysis among CD107alowCD31-CD45- and CD107ahighCD31-CD45- cells. (B) Heat map demonstrating mRNA expression levels of stemness-related markers and perivascular cell markers among CD107alowCD31-CD45- and CD107ahighCD31-CD45- mesenchymal cells. (C) Expression of adipogenic gene markers among CD107alowCD31-CD45- and CD107ahighCD31-CD45- mesenchymal cells, shown in heat map. (D) Ingenuity pathway analysis (IPA) identified representative pathways that were upregulated (Z-score >0; red color) or downregulated (Z-score <0; blue color) in CD107ahighCD31-CD45- compared with CD107alowCD31-CD45- mesenchymal cells. (E,F) Comparison of CD107ahigh/low bulk sequencing data to human SVF single-cell sequencing data (see again Figure 3O–Q). (E) Pathways enriched in both CD107alow bulk RNA-seq and early pseudotime genes derived from scRNA-seq. (F) Pathways enriched in both CD107ahigh bulk RNA-seq and late pseudotime genes derived from scRNA-seq.
Figure 4—figure supplement 1
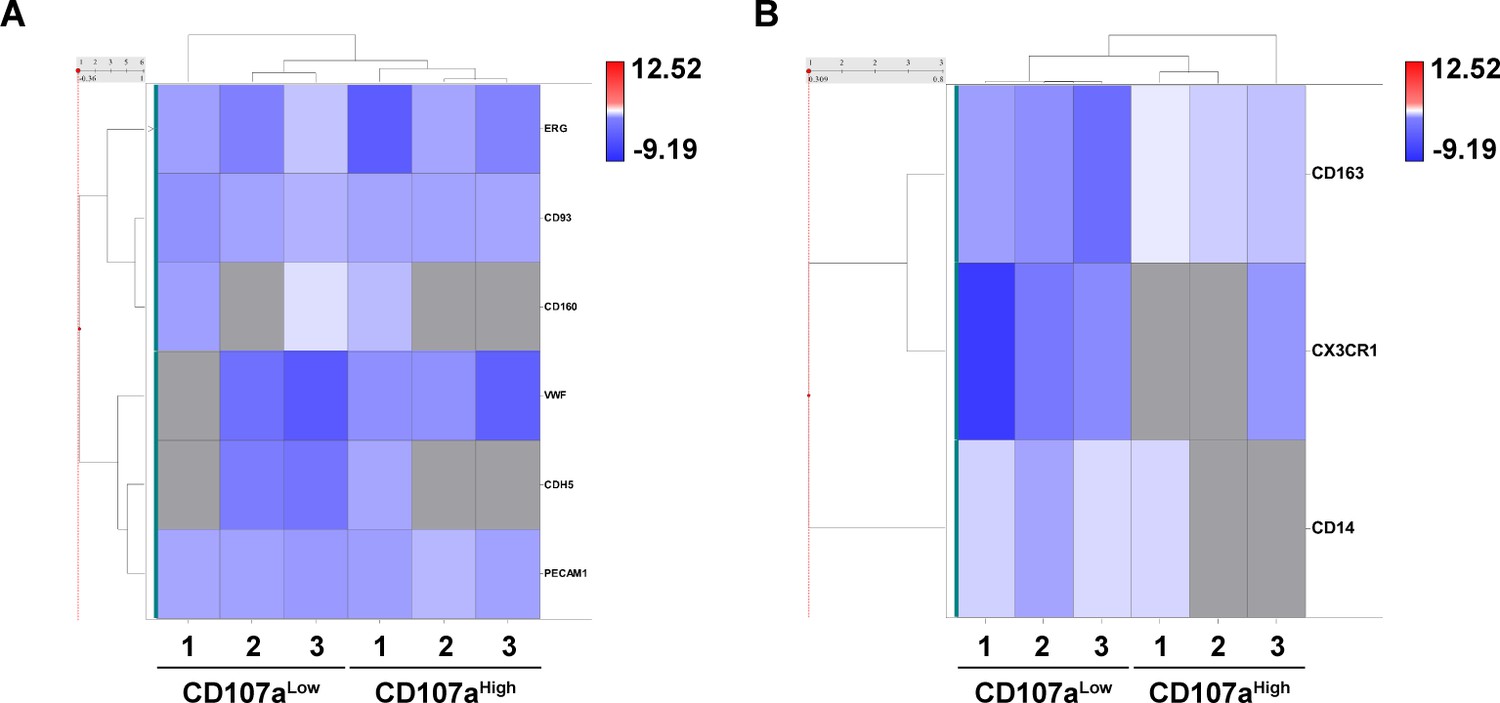
Additional RNA sequencing analysis of CD107alow and CD107ahigh mesenchymal cells.
(A,B) Heat map demonstrating mRNA expression levels of endothelial markers (A) and inflammatory markers (B) among CD107alowCD31-CD45- and CD107ahighCD31-CD45- mesenchymal cells.
Figure 4—figure supplement 2
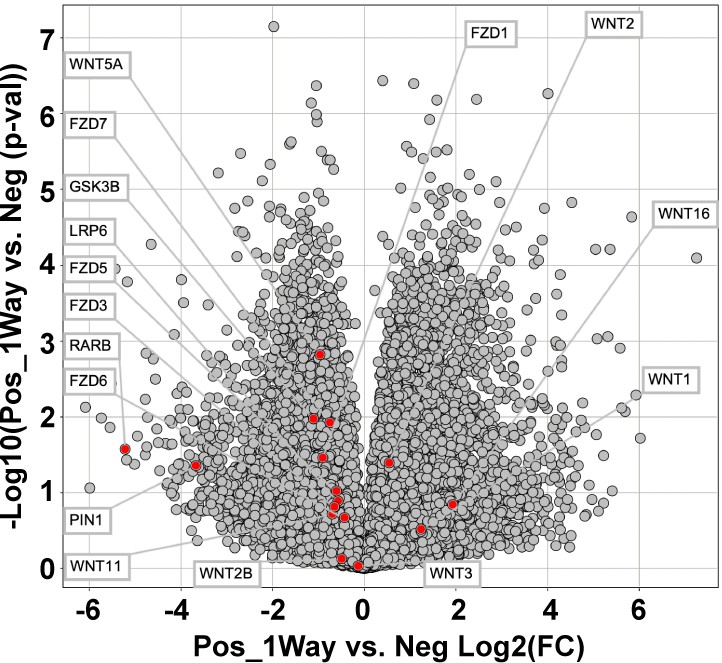
Expression of wnt-related genes among CD107alowCD31-CD45- and CD107ahighCD31-CD45- mesenchymal cells.
Data were shown in volcano plot. All transcripts are shown in light gray, while the transcripts of interest are shown in red.
Figure 5 with 1 supplement
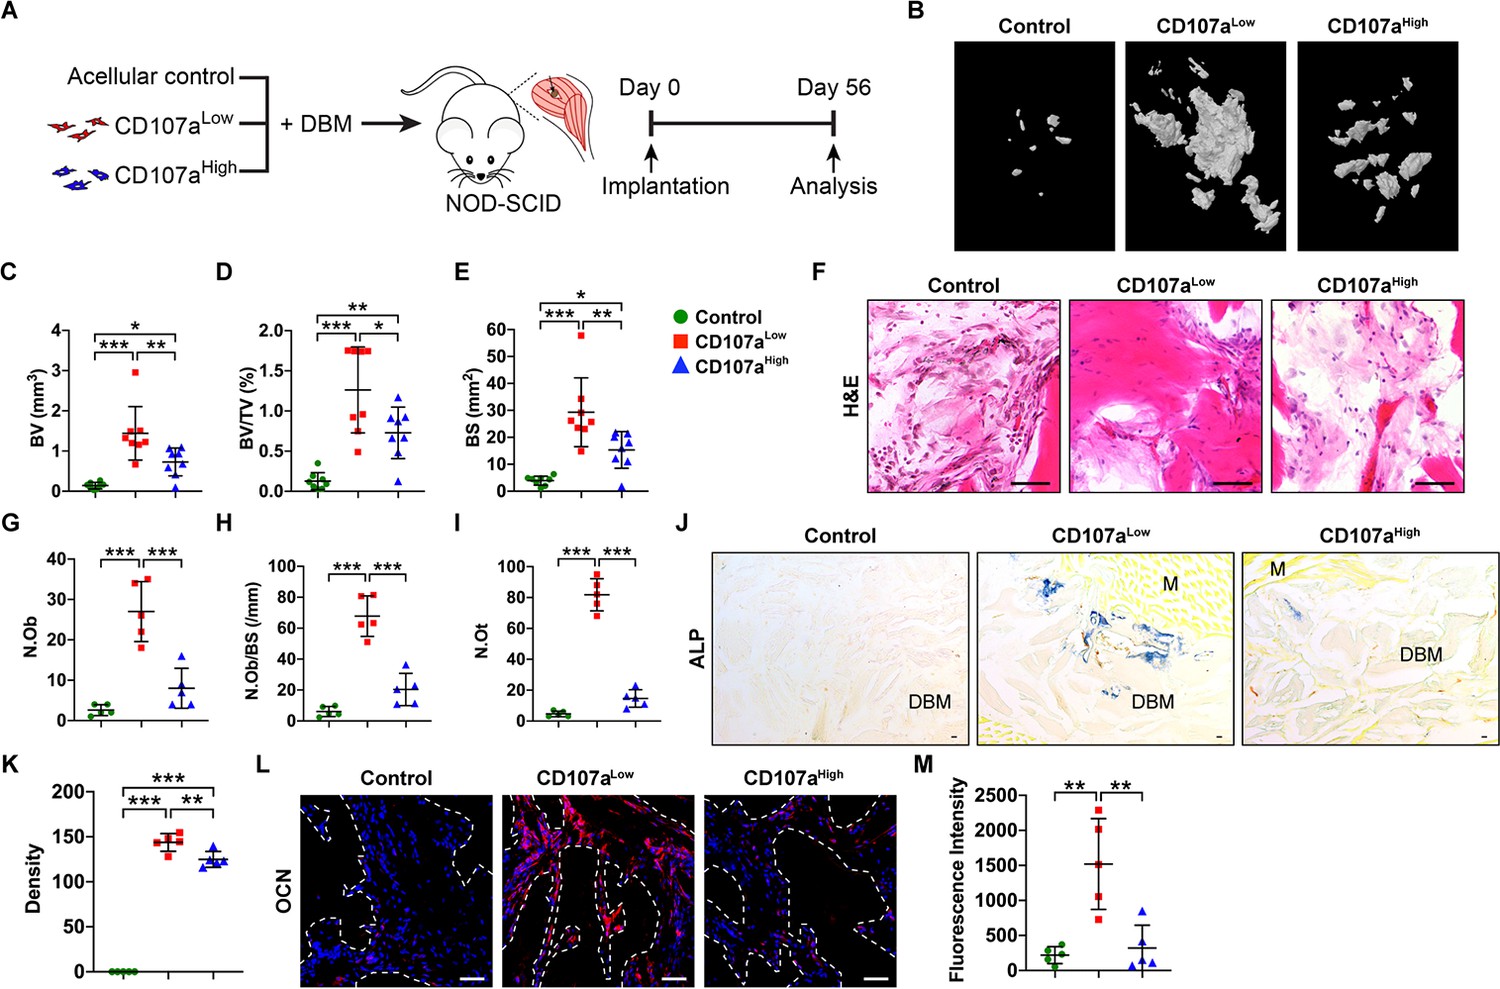
CD107alow mesenchymal cells promote ectopic bone formation in vivo.
(A) FACS-purified CD107alowCD31-CD45- and CD107ahighCD31-CD45- mesenchymal cells from the same human subcutaneous WAT sample were implanted intramuscularly in equal numbers in the hindlimbs of NOD-SCID mice. A demineralized bone matrix (DBM) carrier was used, and an acellular control used as a further comparison. Bone formation was assayed after eight wks. Further details on implant composition and animal allocation are found in Supplementary file 5. (B) Representative micro-computed tomography (μCT) reconstruction images of the implant site among control (DBM only), CD107alow, and CD107ahigh cell grafts. Mineralized bone appears gray. (C–E) μCT based quantification of ectopic bone formation, including (C) Bone volume (BV), (D) fractional Bone volume (BV/TV), and (E) bone surface (BS). (F) Representative histologic appearance by routine H and E of the implant sites among control (DBM only), CD107alow, and CD107ahigh cell grafts. (G–I) Bone histomorphometric measurements among each treatment group, including (G) osteoblast number (N.Ob), (H) osteoblast number per bone surface (N.Ob/BS), and (I) osteocyte number (N.Ot). (J,K) Representative alkaline phosphatase (ALP) staining appearing blue (J), and photographic quantification (K). (L,M) Representative Osteocalcin (OCN) immunohistochemical staining (L), and photographic quantification (M). OCN immunostaining appears red, while DAPI nuclear counterstain appears blue. Dots in scatterplots represent values from individual implants, while mean and one SD are indicated by crosshairs and whiskers. M, muscle. *p<0.05; **p<0.01; ***p<0.001. Statistical analysis was performed using a one-way ANOVA followed by Tukey’s post hoc test. N = 8 implants per group. Black and white scale bars: 50 μm.
Figure 5—figure supplement 1
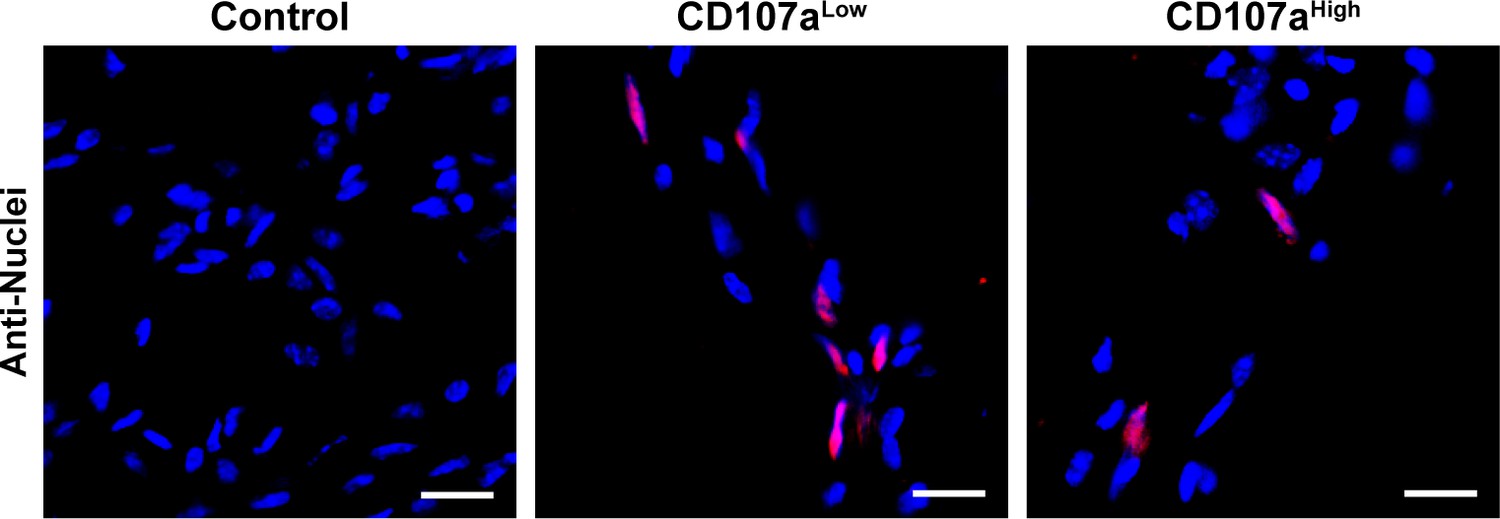
Persistence of human CD107alow and CD107ahigh cells within intramuscular implants within NOD-SCID mice.
Sections were obtained at 8 weeks post-implantation, and immunofluorescence staining of human-specific nuclei performed within CD107alow or CD107ahigh laden implants, in comparison to acellular control. White scale bar: 20 μm. N = 8 implants analyzed per treatment group.
Figure 6 with 2 supplements
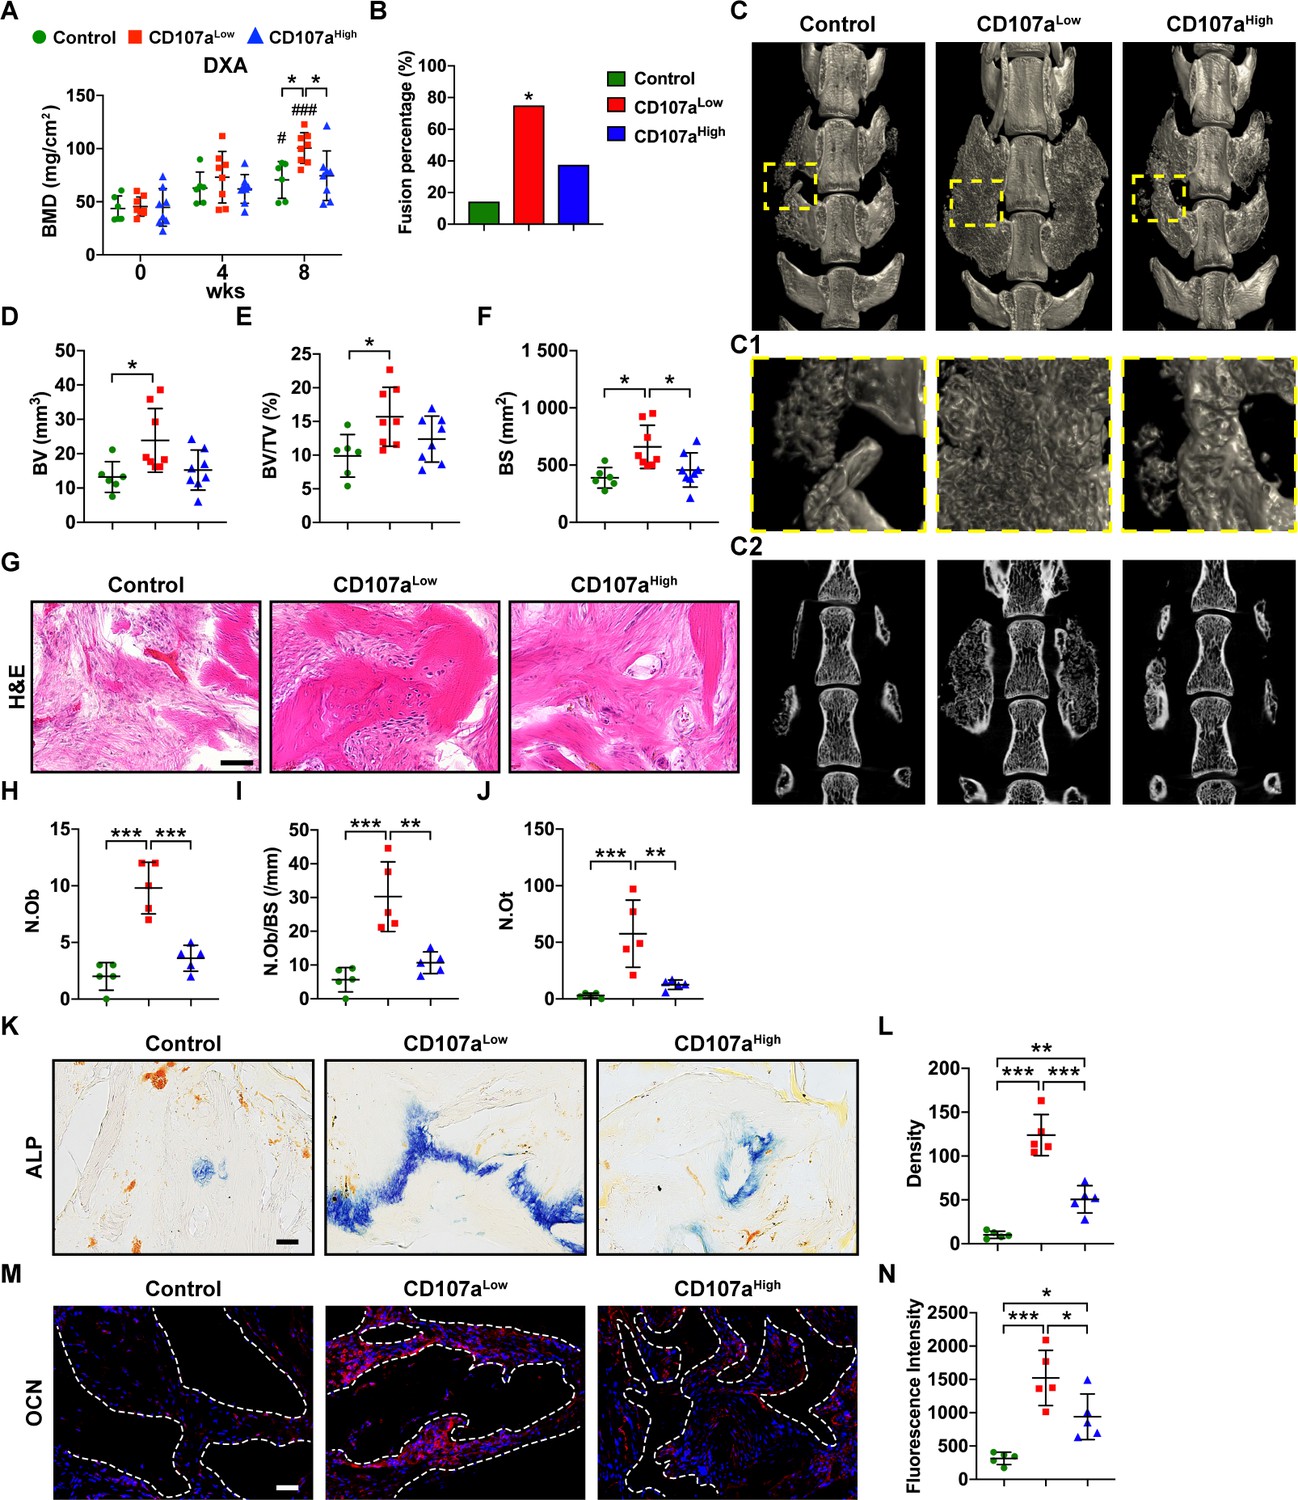
CD107alow mesenchymal cells induce spine fusion in vivo.
FACS-purified CD107alowCD31-CD45- and CD107ahighCD31-CD45- mesenchymal cells from the same human subcutaneous WAT sample were implanted in equal numbers in a posterolateral spinal fusion model in athymic rats. A demineralized bone matrix (DBM) carrier was used, and an acellular control used as a further comparison. Animals were analyzed at up to eight wks post-operatively. (A) Bone mineral density (BMD) assessed by DXA (dual-energy X-ray absorptiometry) within the lumbar implantation site, at 0, 4, and 8 wks. (B) Spine fusion rate, assessed by manual palpation after eight wks. *: CD107alow compared with acellular control. (C) Representative micro-computed tomography (μCT) reconstruction images of the spine fusion site among CD107alow and CD107ahigh treated samples, in comparison to acellular control. Images are shown from the dorsal aspect. (C1) Corresponding high magnification μCT reconstruction of the fusion site. (C2) Corresponding coronal μCT cross-sectional image. (D–F) μCT-based quantification of bone formation within the spine fusion site, including (D) Bone volume (BV), (E) fractional Bone volume (BV/TV), and (F) bone surface (BS). (G) Representative histologic appearance by routine H and E of the implant sites among control (DBM only), CD107alow, and CD107ahigh cell grafts within the spine fusion site. (H–J) Bone histomorphometric measurements among each treatment group, including (H) osteoblast number (N.Ob), (I) osteoblast number per bone surface (N.Ob/BS), and (J) osteocyte number (N.Ot). (K,L) Representative alkaline phosphatase (ALP) staining appearing blue (K), and photographic quantification within the spine fusion site (L). (M) Representative Osteocalcin (OCN) immunohistochemical staining (M), and photographic quantification within the spine fusion site (N). OCN immunostaining appears red, while DAPI nuclear counterstain appears blue. Dots in scatterplots represent values from individual animal measurements, while mean and one SD are indicated by crosshairs and whiskers. #p<0.05 and ###p<0.001 in relation to corresponding 0 wk timepoint; *p<0.05; **p<0.01; ***p<0.001. Statistical analysis was performed using a two-way ANOVA (A) or one-way ANOVA followed by Tukey’s post hoc test (D–N). N = 6–8 animals per group. Black and white scale bars: 50 μm.
Figure 6—figure supplement 1
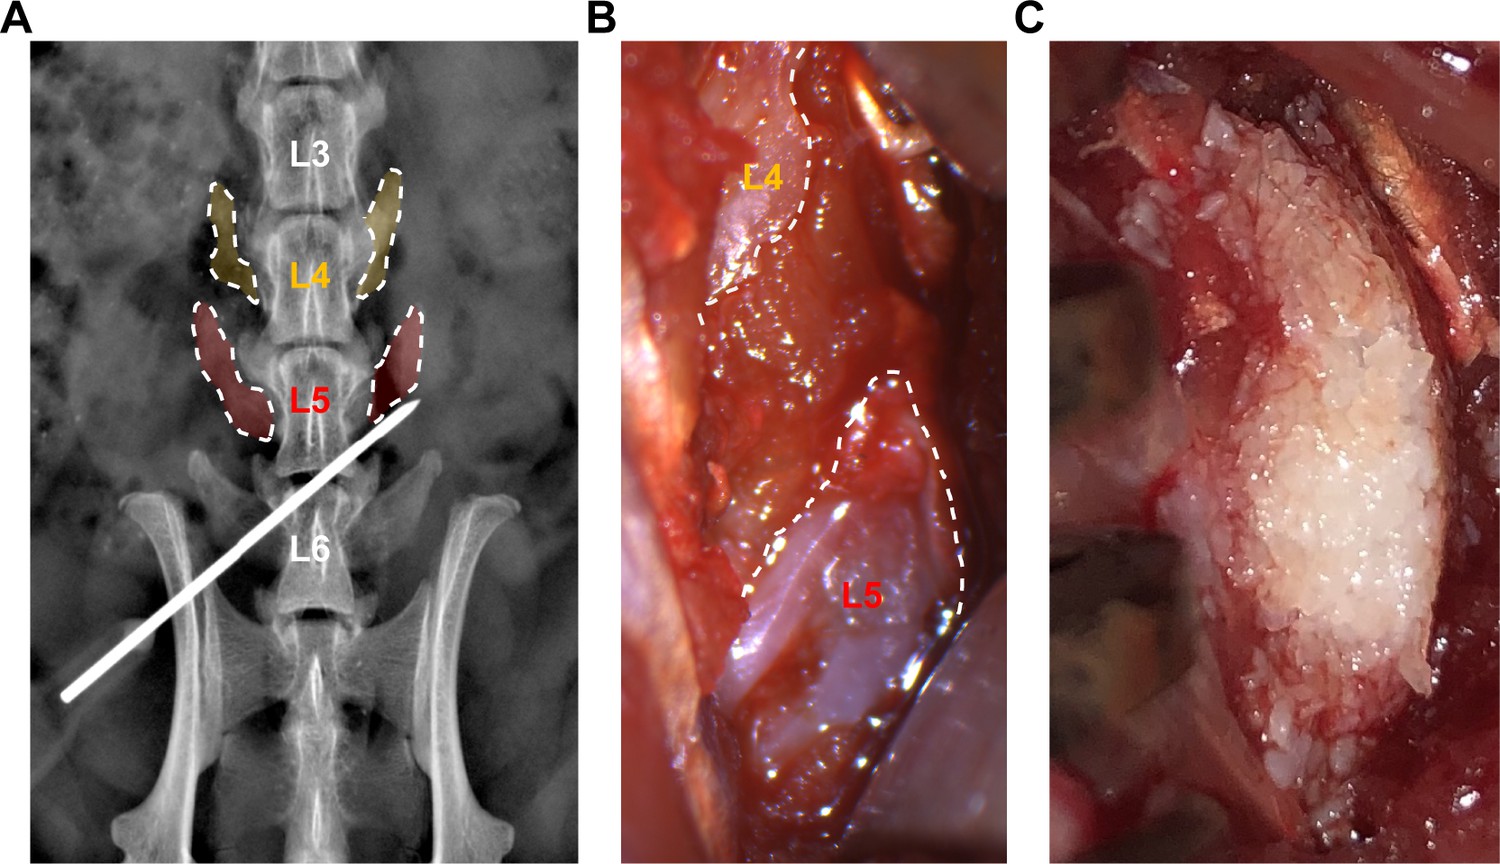
Illustration of procedure for posterolateral lumbar spine fusion in athymic rats.
(A) Intraoperative postero-anterior high-resolution x-ray to confirm the bony landmarks. The needle is indicating the base of L5 right transverse process. (B) Intraoperative microsurgical image of the right paraspinal space after decortication of L5 transverse process. (C) Appropriate place and shape of the bone graft substitute in the area encompassing the L4-L5 transverse processes. See Supplementary file 6 for animal allocation.
Figure 6—figure supplement 2

High-resolution roentgenography (XR) demonstrates ossification of spinal fusion implants within CD107alow treated sites.
Representative postero-anterior XR images of the lumbar spine post-operatively (far left), 4 weeks (middle left), and 8 weeks (middle and far right) after implantation. See Supplementary file 6 for animal allocation.
Author response image 1
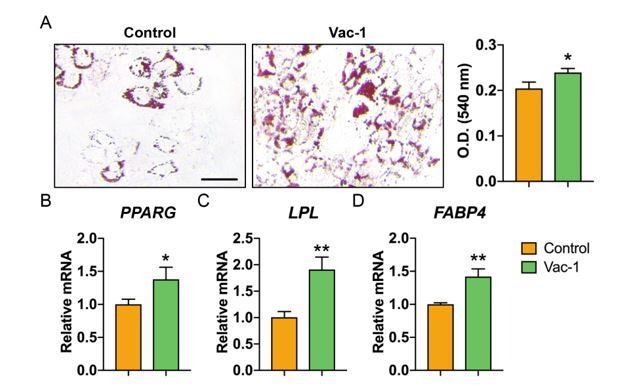
Inhibition of exocytosis with Vacuolin-1 moderately promotes adipogenic differentiation of human ASCs.
(A) Oil red O (ORO) staining (left) and photometric quantification (right) at d7 of adipogenic differentiation with or without Vacuolin-1 treatment (Vac-1, 1 μM). Black scale bar: 50 μm. (B-D) Adipogenic gene expression with or without Vac-1 (1 μM) treatment, including (B) Peroxisome proliferator-activated receptor-γ (PPARG), (C) Lipoprotein lipase (LPL), and (D) Fatty acid binding protein 4 (FABP4). Gene expression assessed at 7 d of adipogenic differentiation. Data repeated in experimental triplicate. *P<0.05; **P<0.01. Statistical analysis was performed using a two-tailed Student t-test.
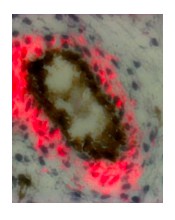
Author response image 2
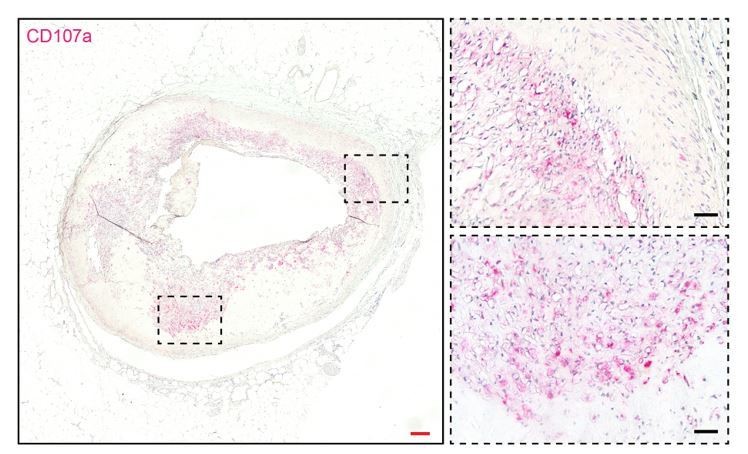
CD107a immunohistochemical staining in human atherosclerotic vessel.
CD107a positive staining appears red. Red scale bar: 200 μm; black scale bar: 50 μm.
Author response image 3

No change in lysosome immunohistochemical staining among human CD107alow and CD107ahigh cells.
Lysosome positive staining appears green. White scale bar: 20 μm.
Author response image 4
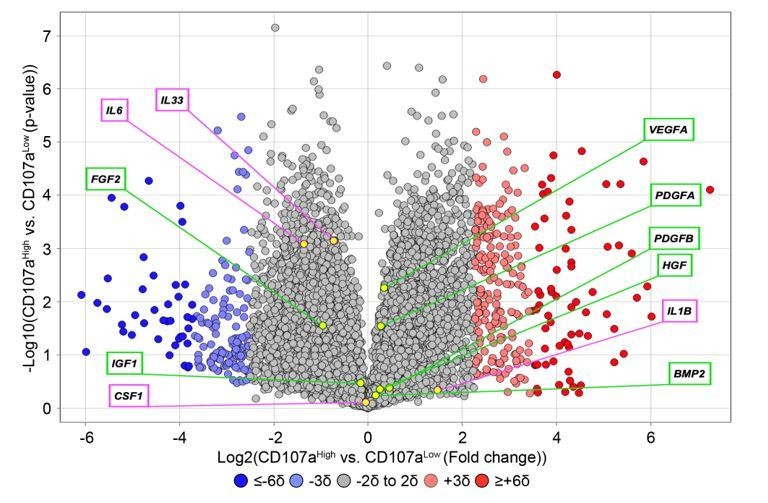
Expression of inflammatory cytokines and common growth and differentiation factors among human CD107alowCD31-CD45- and CD107ahighCD31-CD45- mesenchymal cells.
Data shown in volcano plot. X-axis represents Log2 fold change for each gene. Y-axis represents -Log10 p value. Red dots indicate >2SD increase among CD107ahigh mesenchymal cells. Blue dots indicate >2SD increase among CD107alow mesenchymal cells. Inflammatory cytokines are shown in purple box, while growth factors are shown in green box.
Author response image 5
CD107a immunohistochemical staining in human fetal skeletal muscle.
CD107a positive staining appears red, while CD31 positive staining appears black.
Tables
Table 1
Surface antigens expressed within human adventitial cells versus pericytes.
Results derived from Lyoplate analysis of CD34+CD146-CD45-CD31- adventitial cells or CD146+CD34-CD45-CD31- pericytes.
| CD marker | Protein name | Frequency in adventitial cells (CD34+CD146-CD45-CD31-) | Frequency in pericytes (CD146+CD34-CD45-CD31-) |
|---|---|---|---|
| CD90 | Thy-1 | 97% | 70% |
| CD91 | Low-density lipoprotein-related receptor | 97% | 61% |
| CD95 | Fas receptor (TNFRSF6) | 42% | 22% |
| CD98 | Large neutral amino acid transporter (LAT1) | 17% | 65% |
| CD105 | Endoglin | 47% | 14% |
| CD107a | Lysosomal-associated membrane protein 1 (LAMP1) | 32% | 82% |
| CD107b | Lysosomal-associated membrane protein 2 (LAMP2) | 13% | 46% |
| CD130 | Interleukin six beta transmembrane protein | 39% | 61% |
| CD140a | Platelet-derived growth factor receptor alpha (PDGFRA) | 82% | 13% |
| CD140b | Platelet-derived growth factor receptor beta (PDGFRB) | 97% | 34% |
| CD142 | Tissue factor, PTF, Factor III, or thromboplastin | 47% | 75% |
| CD147 | Basigin (BSG) | 99% | 99% |
| CD151 | Raph blood group | 71% | 100% |
| CD164 | Sialomucin core protein 24 or endolyn | 91% | 97% |
| CD165 | AD2 | 77% | 21% |
| CD271 | Nerve growth factor receptor (NGFR) | 64% | 10% |
Appendix 1—key resources table
| Reagent type (species) or resource | Designation | Source or reference | Identifiers | Additional information |
|---|---|---|---|---|
| Strain, strain background (mouse) | NOD-SCID | Jackson Laboratory | Strain #001303, RRID:IMSR_JAX:001303 | Male, 8 week old |
| Strain, strain background (rat) | RNU Nude Rat | Charles River Laboratories Inc | Strain #316, RRID:RGD_2312499 | Male, 23 week old |
| Transfected construct (human) | Negative Control siRNA | ThermoFisher Scientific | Cat#4390843 | |
| Transfected construct (human) | LAMP1 siRNA | ThermoFisher Scientific | Cat#4392420 Assay ID s8082 | |
| Transfected construct (human) | LAMP1 siRNA 2# | ThermoFisher Scientific | Cat#4392420 Assay ID s8080 | |
| Antibody | anti-Human CD31-APC-Cy7 (Mouse monoclonal) | BD Pharmingen | Cat# 563653, RRID:AB_2738350 | FACS/Flow cytometry (1:100) |
| Antibody | anti-Human CD31 (Mouse monoclonal) | Abcam | Cat# ab24590, RRID:AB_448167 | Immunofluorescent staining (1:100) |
| Antibody | anti-Human CD31 (Rabbit polyclonal) | Abcam | Cat# ab28364, RRID:AB_726362 | Immunofluorescent staining (1:100) |
| Antibody | anti-Human CD34-PE-CF594 (Mouse monoclonal) | BD Pharmingen | Cat# 562383, RRID:AB_11154586 | Flow cytometry (1:60) |
| Antibody | anti-Human CD34 (Rabbit monoclonal) | Abcam | Cat# ab81289, RRID:AB_1640331 | Immunofluorescent staining (1:100) |
| Antibody | anti-Human CD44-AF700 (Mouse monoclonal) | BD Pharmingen | Cat# 561289, RRID:AB_10645788 | Flow cytometry (1:20) |
| Antibody | anti-Human CD45-APC-Cy7 (Mouse monoclonal) | BD Pharmingen | Cat# 557833, RRID:AB_396891 | FACS/Flow cytometry (1:30) |
| Antibody | anti-Human CD73-PE (Mouse monoclonal) | BD Pharmingen | Cat# 561014, RRID:AB_2033967 | Flow cytometry (1:5) |
| Antibody | anti-Human CD90-FITC (Mouse monoclonal) | BD Pharmingen | Cat# 555595, RRID:AB_395969 | Flow cytometry (1:20) |
| Antibody | anti-Human CD105-PE-CF594 (Mouse monoclonal) | BD Pharmingen | Cat# 562380, RRID:AB_11154054 | Flow cytometry (1:20) |
| Antibody | anti-Human CD107a-APC (Mouse monoclonal) | BD Pharmingen | Cat# 560664, RRID:AB_1727417 | FACS/Flow cytometry (1:20)/Immunocytochemistry (1:100) |
| Antibody | anti-Human CD107a (Mouse monoclonal) | R and D Systems | Cat# MAB4800, RRID:AB_10719137 | Immunofluorescent staining (1:100) |
| Antibody | anti-Human CD107a (Mouse monoclonal) | Abcam | Cat# ab25630, RRID:AB_470708 | Immunohistochemistry (1:100)/Western blot (1:1000) |
| Antibody | anti-Human CD107a (Rat monoclonal) | Abcam | Cat# ab25245, RRID:AB_449893 | Immunofluorescent staining (1:100) |
| Antibody | anti-Human CD146-FITC (Mouse monoclonal) | Bio-Rad | Cat# MCA2141F, RRID:AB_324069 | Flow cytometry (1:100) |
| Antibody | anti-Human CD146 (Rabbit monoclonal) | Abcam | Cat# ab75769, RRID:AB_2143375 | Immunofluorescent staining (1:100) |
| Antibody | anti-human GAPDH (Rabbit monoclonal) | Cell Signaling Technology | Cat# 5174, RRID:AB_10622025 | Western blot (1:1000) |
| Antibody | anti-human Gli1 (Rabbit polyoclonal) | Abcam | Cat# ab49314, RRID:AB_880198 | Immunofluorescent staining (1:100) |
| Antibody | anti-human Nuclei (Mouse monoclonal) | Sigma-Aldrich | Cat# MAB1281, RRID:AB_94090 | Immunofluorescent staining (1:500) |
| Antibody | anti-human Osteocalcin (Rabbit polyclonal) | Abcam | Cat# ab93876, RRID:AB_10675660 | Immunofluorescent staining (1:100) |
| Antibody | anti-human αSMA (Rabbit polyclonal) | Abcam | Cat# ab21027, RRID:AB_1951138 | Immunofluorescent staining (1:100) |
| Antibody | Anti-rabbit IgG, HRP-linked (Goat polyclonal) | Cell Signaling Technology | Cat# 7074, RRID:AB_2099233 | Western blot (1:5000) |
| Antibody | Anti-mouse IgG, HRP-linked (Horse polyclonal) | Cell Signaling Technology | Cat# 7076, RRID:AB_330924 | Western blot (1:5000) |
| Antibody | anti-mouse IgG H and L-AF488 (Goat polyclonal) | Abcam | Cat# ab150117, RRID:AB_2688012 | Immunofluorescent staining (1:200) |
| Antibody | anti-rabbit IgG H and L-AF488 (Goat polyclonal) | Abcam | Cat# ab150077, RRID:AB_2630356 | Immunofluorescent staining (1:200) |
| Antibody | anti-rabbit IgG H+L-DyLight 594 (Goat) | Vector Laboratories | Cat# DI-1594, RRID:AB_2336413 | Immunofluorescent staining (1:200) |
| Antibody | anti-goat IgG H and L-AF647 (Donkey polyclonal) | Abcam | Cat# ab150135, RRID:AB_2687955 | Immunofluorescent staining (1:200) |
| Antibody | anti-mouse IgG H and L-AF647 (Goat polyclonal) | Abcam | Cat# ab150119, RRID:AB_2811129 | Immunofluorescent staining (1:200) |
| Antibody | anti-rabbit IgG H and L-AF647 (Goat polyclonal) | Abcam | Cat# ab150079, RRID:AB_2722623 | Immunofluorescent staining (1:200) |
| Antibody | anti-rat IgG H and L-AF647 (Goat polyclonal) | Abcam | Cat# ab150167, RRID:AB_2864291 | Immunofluorescent staining (1:200) |
| Antibody | ImmPRESS-AP Anti-Mouse Reagent antibody (Horse) | Vector Laboratories | Cat# MP-5402, RRID:AB_2336535 | Immunohistochemistry (200 μl) |
| Sequence-based reagent | ACAN_F | This paper | PCR primers | AGGCTGGGGAGAGAACTGAAAAG |
| Sequenced-based reagent | ACAN_R | This paper | PCR primers | GCTCACAATGGGGTATCTGACAG |
| Sequenced-based reagent | ACTB_F | This paper | PCR primers | CTGGAACGGTGAAGGTGACA |
| Sequenced-based reagent | ACTB_R | This paper | PCR primers | AAGGGACTTCCTGTAACAATGCA |
| Sequenced-based reagent | ALPL_F | This paper | PCR primers | ACCACCACGAGAGTGAACCA |
| Sequenced-based reagent | ALPL_R | This paper | PCR primers | CGTTGTCTGAGTACCAGTCCC |
| Sequenced-based reagent | COL2A1_F | This paper | PCR primers | CCGCGGTGAGCCATGATTCG |
| Sequenced-based reagent | COL2A1_R | This paper | PCR primers | CAGGCCCAGGAGGTCCTTTGGG |
| Sequenced-based reagent | COMP_F | PMID:23382851 | PCR primers | CAACTGTCCCCAGAAGAGCAA |
| Sequenced-based reagent | COMP_R | PMID:23382851 | PCR primers | TGGTAGCCAAAGATGAAGCCC |
| Sequenced-based reagent | FABP4_F | This paper | PCR primers | ACGAGAGGATGATAAACTGGTGG |
| Sequenced-based reagent | FABP4_R | This paper | PCR primers | GCGAACTTCAGTCCAGGTCAAC |
| Sequenced-based reagent | GAPDH_F | PMID:31482845 | PCR primers | CTGGGCTACACTGAGCACC |
| Sequenced-based reagent | GAPDH_R | PMID:31482845 | PCR primers | AAGTGGTCGTTGAGGGCAATG |
| Sequenced-based reagent | LAMP1_F | This paper | PCR primers | GTCTTCTTCGTGCCGGCGT |
| Sequenced-based reagent | LAMP1_R | This paper | PCR primers | GCAGGTCAAAGGTCATGTTCTT |
| Sequenced-based reagent | LPL_F | This paper | PCR primers | TTGCAGAGAGAGGACTCGGA |
| Sequenced-based reagent | LPL_R | This paper | PCR primers | GGAGTTGCACCTGTATGCCT |
| Sequenced-based reagent | SPP1_F | This paper | PCR primers | CCTCCTAGGCATCACCTGTG |
| Sequenced-based reagent | SPP1_R | This paper | PCR primers | CCACACTATCACCTCGGCC |
| Sequenced-based reagent | RUNX2_F | PMID:31482845 | PCR primers | TGGTTACTGTCATGGCGGGTA |
| Sequenced-based reagent | RUNX2_R | PMID:31482845 | PCR primers | TCTCAGATCGTTGAACCTTGCTA |
| Sequenced-based reagent | PPARG_F | This paper | PCR primers | GACAGGAAAGACAACAGACAAATC |
| Sequenced-based reagent | PPARG_R | This paper | PCR primers | GGGGTGATGTGTTTGAACTTG |
| Sequenced-based reagent | RUNX2_F | This paper | PCR primers | TGGTTACTGTCATGGCGGGTA |
| Sequenced-based reagent | RUNX2_R | This paper | PCR primers | TCTCAGATCGTTGAACCTTGCTA |
| Sequenced-based reagent | SOX9_F | This paper | PCR primers | GAGGAAGTCGGTGAAGAACG |
| Sequenced-based reagent | SOX9_R | This paper | PCR primers | ATCGAAGGTCTCGATGTTGG |
| Commercial assay or kit | Leukocyte Alkaline Phosphatase Kit | Sigma-Aldrich | Cat#85L2-1KT | |
| Chemical compound, drug | Vacuolin-1 | Sigma-Aldrich | Cat#673000 | |
| Chemical compound, drug | TransIT-LT1 Transfection Reagent | Mirus Bio | Cat#MIR2300 | Transfection |
| Software, algorithm | FlowJo | FlowJo | RRID:SCR_008520 | |
| Software, algorithm | ImageJ | NIH | RRID:SCR_003070 | |
| Software, algorithm | Prism | GraphPad | RRID:SCR_002798 | |
| Software, algorithm | Seurat | Seurat | RRID:SCR_016341 | |
| Software, algorithm | Monocle 3 | Monocle | RRID:SCR_018685 | |
| Software, algorithm | Partek Genomics Suite | Partek | RRID:SCR_011860 | |
| Software, algorithm | Spotfire | Spotfire | RRID:SCR_008858 | |
| Software, algorithm | Ingenuity Pathway Analysis | QIAGEN | RRID:SCR_008653 | |
| Software, algorithm | SPSS | SPSS | RRID:SCR_002865 | |
| Other | DAPI stain | Vector Laboratories | Cat# H-1500, RRID:AB_2336788 | |
| Other | Vector Red Substrate Kit | Vector Laboratories | Cat# SK-5100, RRID:AB_2336847 |
Additional files
-
Supplementary file 1
Frequency of CD107alowCD31-CD45- or CD107ahighCD31-CD45- cells by FACS sorting.
Percentages are based on cell frequency within the PI- cell population.
- https://cdn.elifesciences.org/articles/58990/elife-58990-supp1-v1.docx
-
Supplementary file 2
CD34 frequency among freshly isolated CD107alow and CD107ahigh cells.
- https://cdn.elifesciences.org/articles/58990/elife-58990-supp2-v1.docx
-
Supplementary file 3
CD146 frequency among freshly isolated CD107alow and CD107ahigh cells.
- https://cdn.elifesciences.org/articles/58990/elife-58990-supp3-v1.docx
-
Supplementary file 4
Canonical mesenchymal stem cell (MSC) markers among freshly isolated CD107alow and CD107ahigh cells.
- https://cdn.elifesciences.org/articles/58990/elife-58990-supp4-v1.docx
-
Supplementary file 5
Animal allocation for intramuscular implantation using 12 NOD-SCID mice.
Implants were placed bilaterally, with each animal receiving the same treatment on either hindlimb.
- https://cdn.elifesciences.org/articles/58990/elife-58990-supp5-v1.docx
-
Supplementary file 6
Animal allocation for posterolateral lumbar spine fusion model in athymic rats.
Cell-augmented grafts were placed bilaterally on either side of the lumbar spine, with scaffold and cell numbers per side shown.
- https://cdn.elifesciences.org/articles/58990/elife-58990-supp6-v1.docx
-
Supplementary file 7
Antibodies used.
- https://cdn.elifesciences.org/articles/58990/elife-58990-supp7-v1.docx
-
Supplementary file 8
Primers used.
- https://cdn.elifesciences.org/articles/58990/elife-58990-supp8-v1.docx
-
Supplementary file 9
Uncropped versions of representative western blot images from Figure 3—figure supplement 4B.
- https://cdn.elifesciences.org/articles/58990/elife-58990-supp9-v1.docx
-
Transparent reporting form
- https://cdn.elifesciences.org/articles/58990/elife-58990-transrepform-v1.docx
Download links
A two-part list of links to download the article, or parts of the article, in various formats.
Downloads (link to download the article as PDF)
Open citations (links to open the citations from this article in various online reference manager services)
Cite this article (links to download the citations from this article in formats compatible with various reference manager tools)
Lysosomal protein surface expression discriminates fat- from bone-forming human mesenchymal precursor cells
eLife 9:e58990.
https://doi.org/10.7554/eLife.58990


