Pathway-specific dysregulation of striatal excitatory synapses by LRRK2 mutations
- Department of Pharmacology, Feinberg School of Medicine, Northwestern University, United States
- Department of Neurobiology, Northwestern University, United States
Figures
Figure 1 with 1 supplement

LRRK2 RC mutation increases synaptic glutamate receptor content in the striatum.
(A) Schematic diagram of LRRK2 protein highlighting the armadillo repeats (ARM), ankyrin (ANK) repeats, Ras of complex (ROC), C-terminal of ROC (COR), kin (KIN), and WD40 domains. Knock- in mice expressing the R1441C and G2019S mutations found in the ROC and kinase domains respectively, crossed with either Drd1-Tomato or Drd2-eGFP mouse lines. (B) Workflow schematic for subcellular fractionation of striatal homogenate for the enrichment of postsynaptic density fraction (PSD). (C) Representative western blot analysis of the subcellular fractionation results, showing supernatant (S1), crude synaptosomal preparation (P2), PSD, and Triton soluble fractions (TSF). (D) Western blot analysis of +/+, +/RC, and +/GS P2 striatal fractions probed for p-PKA substrates, pS845 GluA1, total GluA1, pT72Rab8A, total Rab8A, pT73Rab10, total Rab10, and PSD95. (E) Western blot analysis of +/+, +/RC, and +/GS mice probed for GluA1, p-PKA, and PSD95. S1 and PSD fractions are shown. (F-G) Quantification of GluA1 and p-PKA proteins in PSD fractions normalized to PSD95. Summary graphs reflect the mean, error bars reflect SEM. *p<0.05, Tukey post-hoc test following one-way ANOVA.
-
Figure 1—source data 1
Numerical data of the graphs in Figure 1.
- https://cdn.elifesciences.org/articles/58997/elife-58997-fig1-data1-v2.xlsx
Figure 1—figure supplement 1

LRRk2 mutations do not alter PSD95 levels.
(A–B) Supernatant (S1), crude synaptosomal preparation (P2), PSD, and Triton soluble fractions (TSF) of wild type, +/RC and +/GS striata were run on the same blot. Ponceau staining shows similar loading across genotypes at a given fraction. Western blot analysis of the fractions described in A, probed for PSD95 and Homer-1. (C) Quantification of PSD95 band intensities normalized to Homer-1. Summary graphs represent the mean, while error bars SEM. (D) Quantification of PSD95 band intensities expressed as a fraction of the intensity of PSD95 wild type in each one of the S1, P2, and PSD fractions.
-
Figure 1—figure supplement 1—source data 1
Numerical data of the graphs in Figure 1—figure supplement 1.
- https://cdn.elifesciences.org/articles/58997/elife-58997-fig1-figsupp1-data1-v2.xlsx
Figure 2 with 2 supplements
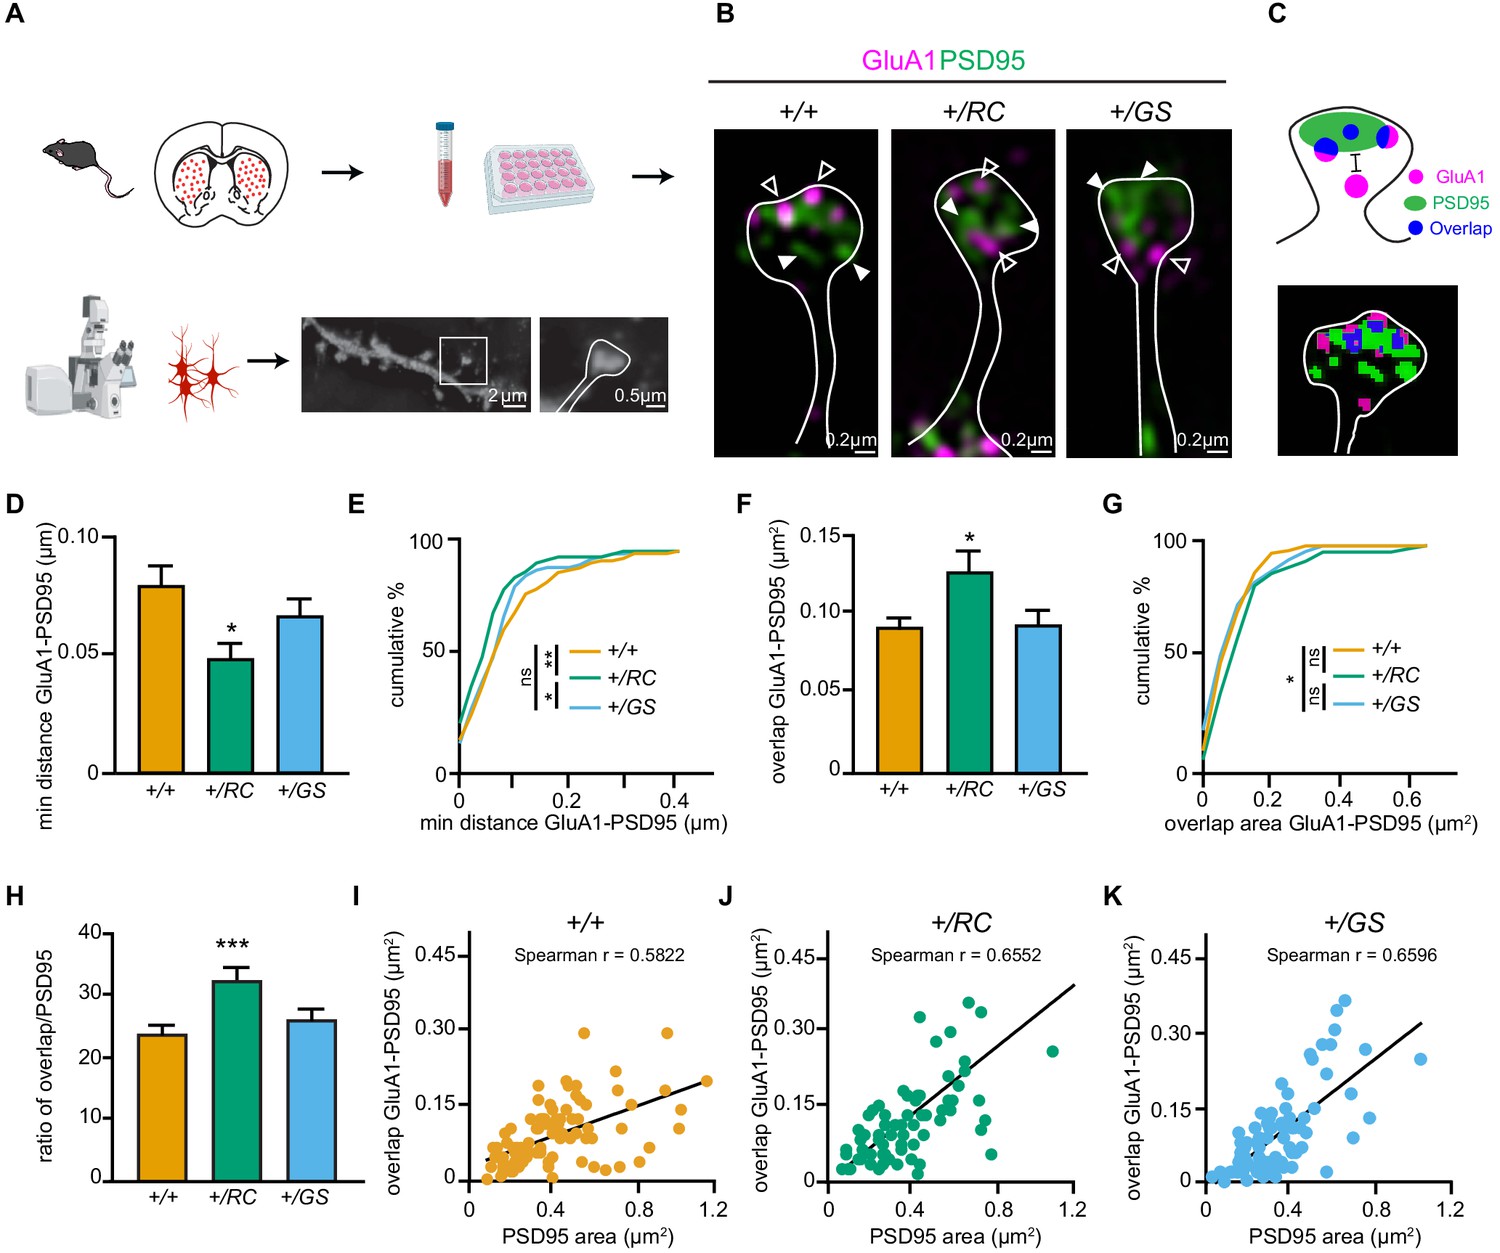
LRRK2 RC mutation restructures the nanoscale synaptic organization of dSPNs.
(A) Schematic depicting experimental design. (B) Structured Illumination super-resolution microscopy (SIM) image of dendritic spines on +/+, +/RC, and +/GS Drd1-Tomato expressing SPNs, labeled with antibodies to GluA1 (purple), and PSD95 (green). Open arrowheads, GluA1 nanodomains; arrowheads, PSD95 nanodomains. (C) Schematic diagram and object masks depicting GluA1, PSD95, and overlap nanodomains within a dendritic spine. Minimum distance between GluA1-PSD95 is measured from the closest edge of the two nanodomains, as shown. (D, E) Summary graphs and cumulative distribution of the minimum distance between GluA1 and PSD95 nanodomains. (F, G) Summary data and cumulative frequency for the overlap area of GluA1 and PSD95 nanodomains within dendritic spines. Asterisk in D and F reflect statistical significance for Tukey’s multiple comparison tests after one-way ANOVA, whereas asterisks in E and G show statistical significance for Bonferroni post-hoc comparisons after Kolmogorov-Smirnov tests. (H) Bar graphs showing the ratio of GluA1-PSD95 overlap area in E relative to PSD95 area, across genotypes. Data are represented as mean ± SEM. (I-K) Correlation plots of overlap in GluA1-PSD95 area versus PSD95 area for +/+, +/RC, and +/GS Drd1-Tomato expressing SPNs. *p<0.05, **p<0.01, ***p<0.001.
-
Figure 2—source data 1
Raw data plotted in graphs in Figure 2.
- https://cdn.elifesciences.org/articles/58997/elife-58997-fig2-data1-v2.xlsx
Figure 2—figure supplement 1

LRRK2 mutations alter postsynaptic density area of SPNs.
(A) Summary graph, PSD95 area across genotypes of dSPNs. Error bars reflect SEM. (B) Cumulative percentage of PSD95 area per dendritic spine across dSPN genotypes. (C) Summary graph, PSD95 area across genotypes of iSPNs. Error bars reflect SEM; asterisks, Tukey post-hoc comparisons after one-way ANOVA, +/+ vs. +/GS p<0.001 (D) Cumulative percentage of PSD95 areas per dendritic spine across iSPN genotypes.
-
Figure 2—figure supplement 1—source data 1
Numerical data of the graphs in Figure 2—figure supplement 1.
- https://cdn.elifesciences.org/articles/58997/elife-58997-fig2-figsupp1-data1-v2.xlsx
Figure 2—video 1
3D Reconstruction of dendritic spine of an RC dSPN.
GluA1 (purple), and PSD95 (green), overlap area (white), as in Figure 2B. A surface mask is added for a fraction of the video, enabling the visualization of GluA1 and PSD95 in spine head.
Figure 3
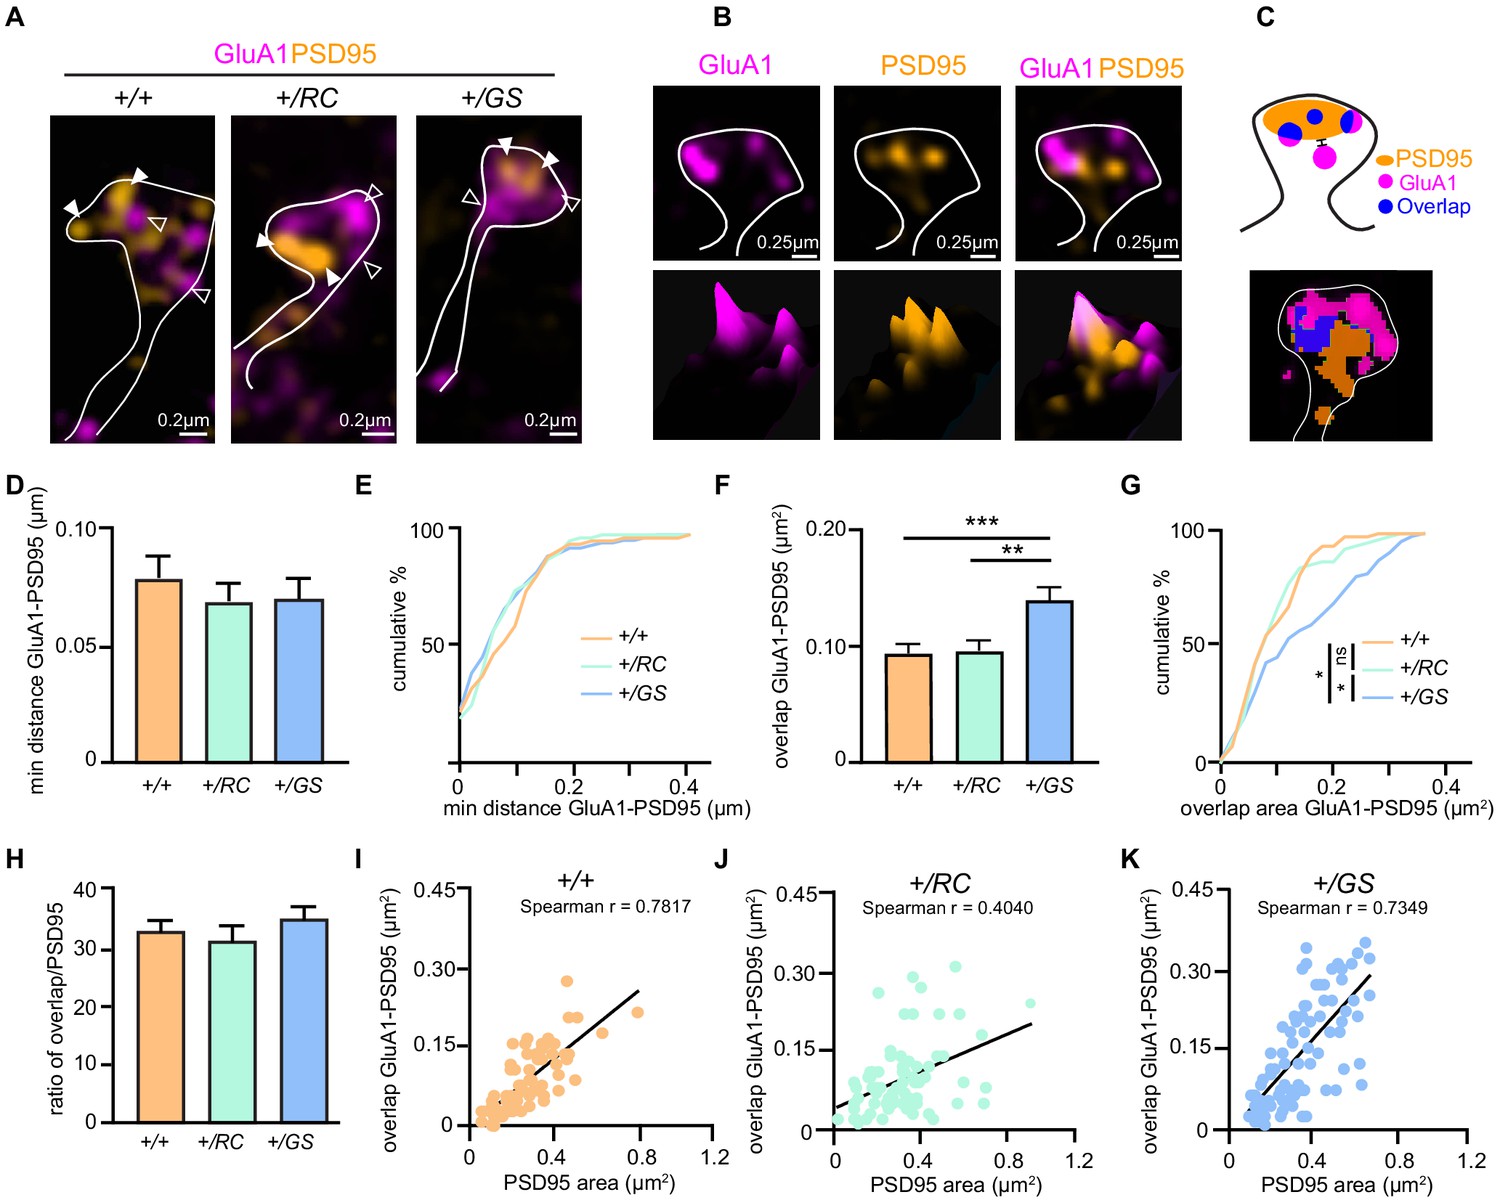
LRRK2 mutations alter the nanoscale synaptic organization of iSPNs.
(A) SIM image of +/+, +/RC, and +/GS Drd2-eGFP expressing SPNs immunostained with GluA1 (purple), and PSD95 (orange). Open arrowheads, GluA1 nanodomains; arrowheads, PSD95 nanodomains. GFP antibody was used to amplify the Drd2-eGFP signal. (B) Surface intensity through a dendritic spine head in an RC iSPN. (C) Schematic diagram and object masks depicting GluA1, PSD95, overlap nanodomains, and minimum distance between nanodomains within a dendritic spine head. (D) Bar graphs showing the minimum distance between GluA1 and PSD95 nanodomains. (E) Cumulative distribution of data shown in D. (F, G) Summary data and cumulative distribution of the overlap area between GluA1 and PSD95 nanodomains in dendritic spine heads across genotypes. Asterisks in F show statistical significance for Tukey’s multiple comparison tests after one-way ANOVA; asterisks in G reflect statistical significance for Bonferroni post-hoc comparisons after Kolmogorov-Smirnov tests. (H) The ratio of overlap area between GluA1 and PSD95 to the PSD95 area for +/+, +/RC, and +/GS iSPNs. (I-K) Correlation plots of overlap areas versus PSD95 area for iSPNs across genotypes. *p<0.05, **p<0.01, ***p<0.001.
-
Figure 3—source data 1
Numerica data represented as graphs in Figure 3.
- https://cdn.elifesciences.org/articles/58997/elife-58997-fig3-data1-v2.xlsx
Figure 4 with 1 supplement
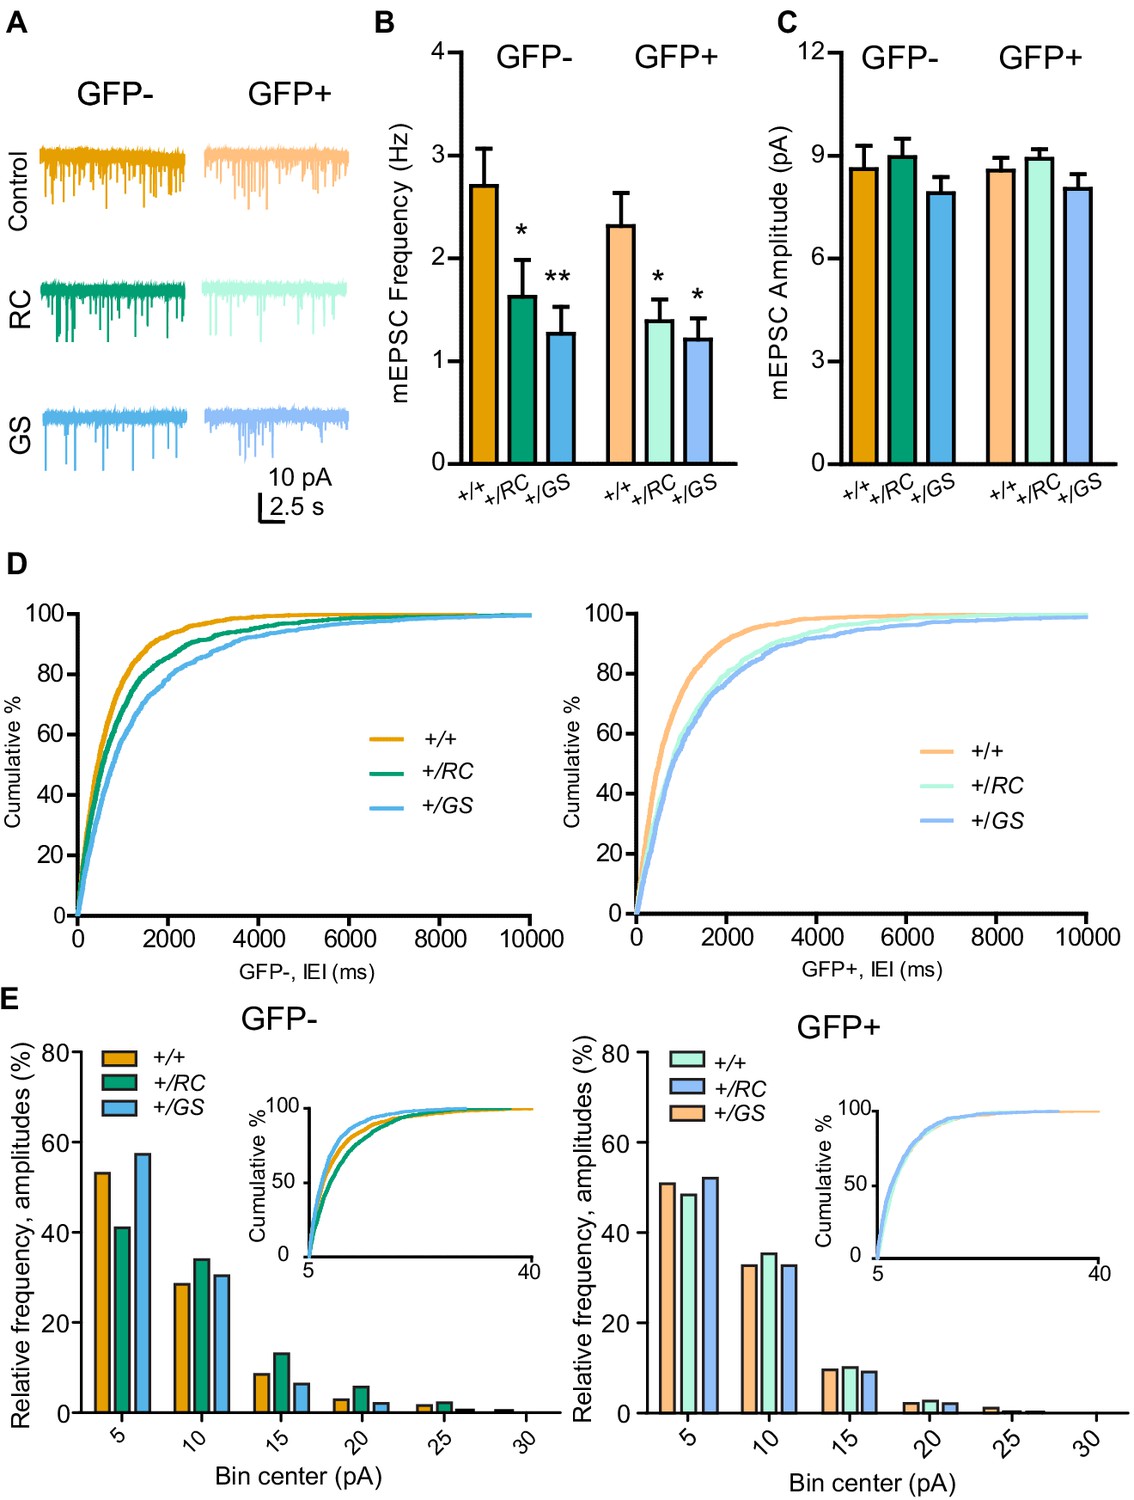
Pathway-specific functional alterations of SPN synapses in LRRK2 mutants.
(A) Example miniature excitatory postsynaptic current (mEPSC) traces from individual neurons of six genotype-pathway combinations. GFP-, dSPNs; GFP+, iSPNs; color, as defined in the figure. Scale bars, 10 pA and 2.5 s. (B) Summary graph showing the frequency of pharmacologically isolated mEPSCs, in GFP- and GFP+ SPNs in controls, compared to both RC and GS mutations. Asterisks reflect statistical significance for Bonferroni post hoc comparisons after two-way ANOVA. (C) Same as B, but for mEPSC amplitude. (D) Left, cumulative distribution of inter-event intervals (IEI) for mEPSCs across genotypes for GFP- SPNs. Right, same as left, but for GFP+ SPNs. (E) Binned histograms and cumulative distribution of mEPSC amplitude data. X axis starts at 5 pA, reflecting the amplitude threshold for mEPSC identification. *p<0.05, **p<0.01.
-
Figure 4—source data 1
Raw data of the graphs in Figure 4.
- https://cdn.elifesciences.org/articles/58997/elife-58997-fig4-data1-v2.xlsx
Figure 4—figure supplement 1

Analyses of mEPSC amplitude distributions.
Left, gamma curve fits to density histogram of mEPSC amplitudes by genotype and cell type (bin width, 1 pA). Gamma AIC for GFP- controls +/+, +/RC, and +/GS was 11813, 7721, and 4920. Gamma AIC for GFP+ controls +/+, +/RC, and +/GS was 9477, 6825, and 4881. Right, overlaid gamma curve fits by genotype and cell type. (B) Amplitudes estimates from GLM using the gamma family of curves, 95% confidence intervals in blue. Bonferroni corrected post-hoc pairwise comparisons, GPF- neurons, ***p<0.0001 for all comparisons; GFP+ neurons, p>0.7.
-
Figure 4—figure supplement 1—source data 1
Numerical data of Figure 4—figure supplement 1.
- https://cdn.elifesciences.org/articles/58997/elife-58997-fig4-figsupp1-data1-v2.xlsx
Figure 5 with 1 supplement

Pathway-specific analysis of dendritic spine morphology in LRRK2 mutants.
(A) Example confocal maximum projection image of a +/RC;Adora2a-Cre iSPN expressing AAV8/Flex-GFP. Representative dendritic fragment with dendritic spines and the corresponding 3D Imaris generated filament. (B) Summary graph showing the dendritic spine density in pathway-identified SPNs across genotypes. Quantification of dendritic spine head width (C), and dendritic spine length (D) in d- and iSPNs. (E) Confocal maximum projection image and the corresponding 3D Imaris generated filament with classified dendritic spines. Red, stubby; green, mushroom; purple, filopodia. (F) Left, summary data showing the density of each dendritic spine category in dSPNs. Right, same as left, but for iSPNs.
-
Figure 5—source data 1
Numerical data represented as graphs in Figure 5.
- https://cdn.elifesciences.org/articles/58997/elife-58997-fig5-data1-v2.xlsx
Figure 5—video 1
3D Reconstruction of an identified +/RC;Adora2a-Cre (Drdr1-, iSPN) neuron transduced with a Cre-dependent AAV eGFP virus (AAV8/Flex-GFP) in neonatal pups.
Figure 6

LRRK2 RC mutation increases glutamate uncaging-evoked currents in dSPNs.
(A) Schematic illustrating experimental design. (B) Example projection of a two-photon laser scanning microscopy stack showing an +/RC; GFP+ SPN (iSPN). Scale bar, 20 µm. (C) Close up images of representative dendrites from SPNs in the six genotype-pathway combinations, shown using inverse greyscale LUT. (D) Example single synapse AMPA-receptor-mediated currents, evoked by focal uncaging of MNI-glutamate. Scale bar, 20 pA and 100 ms. (E) Summary graph showing uncaging-evoked EPSCs (uEPSCs) for GFP-SPNs in controls, RC, and GS mutants. Asterisks reflect statistical significance for Tukey post-hoc comparisons after one-way ANOVA. (F) Same as E, but for GFP+ SPNs. (G) Summary schematic for the study, illustrating changes in synaptic content of glutamate receptors in LRRK2 mutations.
-
Figure 6—source data 1
Numerical data of the graphs shown in Figure 6.
- https://cdn.elifesciences.org/articles/58997/elife-58997-fig6-data1-v2.xlsx
Tables
Appendix 1—key resources table
| Reagent type (species) or resource | Designation | Source or reference | Identifiers | Additional information |
|---|---|---|---|---|
| Antibody | Phospho-PKA Substrate (RRXS*/T*) (100G7E) rabbit monoclonal | Cell Signaling Technology | RRID:AB_331817 | WB (1:1000) |
| Antibody | AMPA Receptor 1 (GluA1) (D4N9V) rabbit monoclonal | Cell Signaling Technology | RRID:AB_2732897 | WB (1:1000) |
| Antibody | Phospho-AMPA Receptor 1 (GluA1) (Ser845) (D10G5) rabbit monoclonal | Cell Signaling Technology | RRID:AB_10860773 | WB (1:1000) |
| Antibody | Synaptophysin rabbit polyclonal | Cell Signaling Technology | RRID:AB_1904154 | WB (1:1000) |
| Antibody | Anti-RAB8A antibody [EPR14873] rabbit monoclonal | Abcam | RRID:AB_2814989 | WB (1:1000) |
| Antibody | RAB8A (phospho T72) [MJF-R20] rabbit monoclonal | Abcam | RRID:AB_2814988 | WB (1:1000) |
| Antibody | Rab10 (D36C4) XP Rabbit mAb rabbit monoclonal | Cell signaling technology | RRID:AB_10828219 | WB (1:1000) |
| Antibody | Anti-RAB10 (phospho T73) antibody [MJF-R21] rabbit monoclonal | Abcam | RRID:AB_2811274 | WB (1:1000) |
| Antibody | HOMER1 polyclonal antibody rabbit polyclonal | Proteintech | RRID:AB_2295573 | WB (1:1000) |
| Antibody | GluA1/GluR1 glutamate receptor clone N355/1 mouse monoclonal | UC Davis/NIH NeuroMab Facility | RRID:AB_2315840 | IF (1:300) |
| Antibody | PSD-95 monoclonal (6G6-1C9) mouse monoclonal | Invitrogen | RRID:AB_325399 | WB (1:1000) IF (1:300) |
| Antibody | PSD-95 polyclonal rabbit polyclonal | Invitrogen | RRID:AB_87705 | IF (1:300) |
| Antibody | GFP chicken polyclonal | Invitrogen | RRID:AB_2534023 | IF (1:1000) |
| Antibody | mCherry (16D7) rat monoclonal | Invitrogen | RRID:AB_2536611 | IF (1:1000) |
| Antibody | Goat anti-Mouse IgG (H+L) Secondary Antibody, HRP | Invitrogen | RRID:AB_2533947 | WB (1:5000) |
| Antibody | Goat anti-Rabbit IgG (H+L) Secondary Antibody, HRP | Invitrogen | RRID:AB_2533967 | WB (1:5000) |
| Antibody | Donkey anti-Mouse IgG (H+L) Highly Cross-Adsorbed Secondary Antibody, Alexa Fluor 647 | Invitrogen | RRID:AB_162542 | IF (1:300) |
| Antibody | Donkey anti-Rabbit IgG (H+L) Highly Cross-Adsorbed Secondary Antibody, Alexa Fluor 568 | Invitrogen | RRID:AB_2534017 | IF (1:300) |
| Antibody | Goat anti-Rat IgG (H+L) Cross-Adsorbed Secondary Antibody, Alexa Fluor 568 | Invitrogen | RRID:AB_2534121 | IF (1:300) |
| Antibody | Goat anti-Chicken IgY (H+L) Secondary Antibody, Alexa Fluor 488 | Invitrogen | RRID:AB_2534096 | IF (1:300) |
| Antibody | Donkey anti-Rabbit IgG (H+L) Highly Cross-Adsorbed Secondary Antibody, Alexa Fluor 488 | Invitrogen | RRID:AB_2535792 | IF (1:300) |
| Other | Fetal Bovine Serum | Sigma-Aldrich | F0926 | 5% |
| Other | Horse Serum, heat inactivated, New Zealand origin | Gibco | 26050088 | 5% |
| Peptide, recombinant protein | Laminin Mouse Protein, Natural | Gibco | 23017015 | 10 μg/ml |
| Chemical compound, drug | Poly-D-lysine hydrobromide | Sigma | P0899 | 50 μg/ml |
| Chemical compound, drug | GlutaMAX Supplement (100x) | Gibco | 35050061 | |
| Chemical compound, drug | B-27 Supplement (50X), serum free | Gibco | 17504044 | |
| Chemical compound, drug | N-2 Supplement (100X) | Gibco | 17502001 | |
| Chemical compound, drug | Antibiotic Antimycotic Solution (100×), Stabilized | Sigma-Aldrich | A5955 | |
| Chemical compound, drug | Basal Medium Eagle | Sigma-Aldrich | B1522 | |
| Chemical compound, drug | Cytosine β-D-arabinofuranoside | Sigma-Aldrich | C1768 | 2.5 μM |
| Chemical compound, drug | PDS Kit, Papain Vial | Worthington Biochemical Corporation | LK003178 | |
| Chemical compound, drug | DNase Vial (D2) | Worthington Biochemical Corporation | LK003172 | |
| Chemical compound, drug | Sucrose | Sigma-Aldrich | S7903 | |
| Chemical compound, drug | HEPES solution | Sigma-Aldrich | H0887 | |
| Chemical compound, drug | UltraPure 1M Tris-HCI, pH 8.0 | Invitrogen | 15568025 | |
| Chemical compound, drug | MgCl2 | Sigma-Aldrich | M8266 | |
| Chemical compound, drug | Calcium chloride solution | Sigma-Aldrich | 21115 | |
| Chemical compound, drug | Triton X-100 | Sigma-Aldrich | X100 | |
| Chemical compound, drug | Ethylenediaminetetraacetic acid disodium salt solution | Sigma-Aldrich | E7889 | |
| Chemical compound, drug | Halt Protease and Phosphatase Inhibitor Cocktail, EDTA-free (100X) | Thermo Scientific | 78441 | |
| Chemical compound, drug | Tris Buffered Saline (10x) | Sigma-Aldrich | T5912 | |
| Chemical compound, drug | TWEEN 20 | Sigma-Aldrich | P1379 | |
| Chemical compound, drug | MNI-L-glutamate | Tocris | 1490 | |
| Chemical compound, drug | Alexa Fluor 594 | Thermo Fisher Scientific | A10438 | |
| Chemical compound, drug | Sodium chloride | Sigma-Aldrich | S3014 | |
| Chemical compound, drug | Potassium chloride | Sigma-Aldrich | P9541 | |
| Chemical compound, drug | Sodium bicarbonate | Sigma-Aldrich | S5761 | |
| Chemical compound, drug | Sodium phosphate monobasic | Sigma-Aldrich | S3139 | |
| Chemical compound, drug | Calcium chloride | Sigma-Aldrich | C5670 | |
| Chemical compound, drug | D-(+)-Glucose | Sigma-Aldrich | G7021 | |
| Chemical compound, drug | Cesium methanesulfonate | Sigma-Aldrich | C1426 | |
| Chemical compound, drug | Cesium chloride | Sigma-Aldrich | C3032 | |
| Chemical compound, drug | HEPES | Sigma-Aldrich | 54457 | |
| Chemical compound, drug | Ethylene glycol-bis(2-aminoethylether)-N,N,N’,N’-tetraacetic acid | Sigma-Aldrich | E3889 | |
| Chemical compound, drug | Gabazine/SR 95531 hydrobromide | Tocris | 1262 | |
| Chemical compound, drug | Scopolamine hydrobromide | Tocris | 1414 | |
| Chemical compound, drug | Phosphocreatine disodium salt hydrate | Sigma-Aldrich | P7936 | |
| Chemical compound, drug | QX-314 Chloride | Tocris | 2313 | |
| Chemical compound, drug | Adenosine 5’-triphosphate magnesium salt | Sigma-Aldrich | A9187 | |
| Chemical compound, drug | Guanosine 5’-triphosphate sodium salt hydrate | Sigma-Aldrich | 51120 | |
| Chemical compound, drug | (R)-CPP | Tocris | 0247 | |
| Chemical compound, drug | Tetrodotoxin | Tocris | 1078 | |
| Chemical compound, drug | Potassium gluconate | Sigma-Aldrich | 1550001 | |
| Commercial assay or kit | iBlot Transfer Stack, nitrocellulose, regular size | Invitrogen | IB301031 | |
| Commercial assay or kit | NuPAGE 4–12% Bis-Tris Protein Gels, 1.5 mm, 15-well | Invitrogen | NP0336BOX | |
| Commercial assay or kit | NuPAGE MES SDS Running Buffer (20X) | Invitrogen | NP0002 | |
| Commercial assay or kit | NuPAGE Antioxidant | Invitrogen | NP0005 | |
| Commercial assay or kit | NuPAGE Transfer Buffer (20X) | Invitrogen | NP0006 | |
| Commercial assay or kit | NuPAGE LDS Sample Buffer (4X) | Invitrogen | NP0008 | |
| Commercial assay or kit | NuPAGE Sample Reducing Agent (10X) | Invitrogen | NP0009 | |
| Commercial assay or kit | Pierce BCA Protein Assay Kit | Thermo Scientific | 23225 | |
| Commercial assay or kit | Restore Western Blot Stripping Buffer | Thermo Scientific | 21059 | |
| Other | ProLong Diamond Antifade Mountant with DAPI | Invitrogen | P36971 | |
| Other | BLUeye Prestained Protein Ladder | Sigma-Aldrich | 94964 | |
| Commercial assay or kit | Immobilon ECL Ultra Western HRP Substrate | Millipore | WBULS0500 | |
| Software, algorithm | GraphPad Prism 7 | GraphPad Software Inc | RRID:SCR_002798 | |
| Software, algorithm | NIS-elements 5.10 | Nikon Instruments Inc | RRID:SCR_014329 | |
| Software, algorithm | Imaris 9.21 | Bitplane Inc | RRID:SCR_007370 | |
| Software, algorithm | iBright Analysis Software | Thermo Scientific | RRID:SCR_017632 | |
| Software, algorithm | MATLAB | MathWorks | RRID:SCR_001622 | |
| Software, algorithm | FIJI | Schindelin et al., 2012 | http://fiji.sc/; RRID:SCR_002285 | |
| Strain, strain background | rAAV8/Flex-GFP | UNC GTC vector core | Lot, AV4910B |
Author response table 1
| Genotype/ Cell-type | Gaussian/ Normal AIC | Gamma AIC |
|---|---|---|
| BAC, GFP- | 13166.75 | 11812.54 |
| RC, GFP- | 8252.910 | 7721.240 |
| GS, GFP- | 5373.360 | 4919.803 |
| BAC, GFP+ | 10312.09 | 9476.535 |
| RC.GFP+ | 7324.117 | 6825.080 |
| GS, GFP+ | 5305.298 | 4880.877 |
Author response table 2
| Cell type | Genotype | Mean amplitude (pA) | SE | LCL* | UCL* |
|---|---|---|---|---|---|
| GFP- | +/+ (BAC) | 9.33 | 0.106 | 9.08 | 9.59 |
| +/GS | 8.26 | 0.138 | 7.95 | 8.61 | |
| +/RC | 10.11 | 0.143 | 9.78 | 10.47 | |
| GFP+ | +/+ (BAC) | 8.91 | 0.110 | 8.66 | 9.19 |
| +/GS | 8.69 | 0.148 | 8.35 | 9.06 | |
| +/RC | 8.89 | 0.128 | 8.60 | 9.21 |
Author response table 3
| Cell type | Comparison | Bonferroni corrected p-values |
|---|---|---|
| GFP- | +/+ vs GS | < 0.0001 |
| +/+ vs RC | < 0.0001 | |
| GS vs RC | < 0.0001 | |
| GFP+ | +/+ vs GS | 0.7070 |
| +/+ vs RC | 1.0000 | |
| GS vs RC | 0.9278 |
Additional files
Download links
A two-part list of links to download the article, or parts of the article, in various formats.
Downloads (link to download the article as PDF)
Open citations (links to open the citations from this article in various online reference manager services)
Cite this article (links to download the citations from this article in formats compatible with various reference manager tools)
Pathway-specific dysregulation of striatal excitatory synapses by LRRK2 mutations
eLife 9:e58997.
https://doi.org/10.7554/eLife.58997


