Activation of the archaeal ion channel MthK is exquisitely regulated by temperature
- Department of Anesthesiology, Washington University School of Medicine, United States
- Center for the Investigation of Membrane Excitability Diseases (CIMED), United States
Figures
Figure 1 with 2 supplements
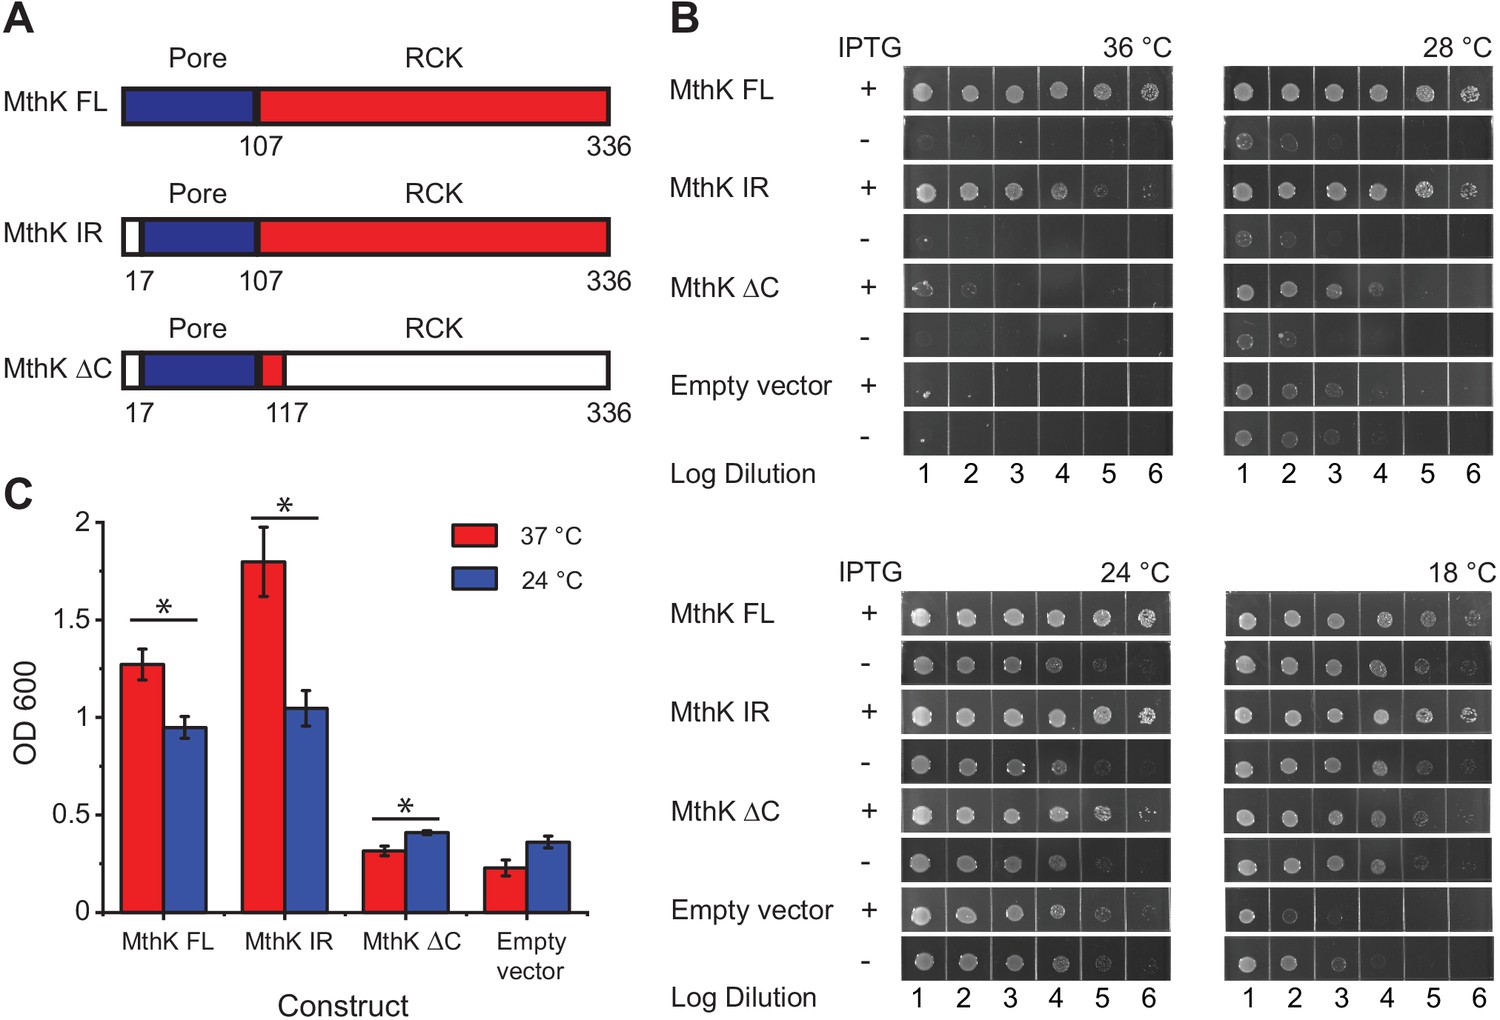
Temperature dependence of complementation of E. coli LB2003 strain by various MthK constructs.
(A) Schematic outlining the three different MthK constructs used in this study. The first 107 amino acids, which include the short cytoplasmic N-terminus (residues 2–17) and the two transmembrane helices are highlighted in deep blue. The C-terminus cytoplasmic region containing the RCK domain is shown in red. (B) Panels showing complementation of LB2003 by MthK constructs at different temperatures. Each column represents log10 dilution as indicated below. The plates were incubated for 18 hr at 36°C, 24 hr at 28°C, 48 hr at 24°C, and 96 hr at 18°C in order to compensate for differences in growth rate (see Materials and methods) (C) Complementation of LB2003 by MthK constructs at 37°C and 24°C in mini suspension cultures. Error bars represent SEM from n = 4 (MthK FL, 37°C), 3 (MthK FL, 24°C), 4 (MthK IR, 37°C and 24°C), 3 (MthK ΔC 37°C and 24°C), 3 (empty vector, 37°C), and 5 (empty vector, 24°C) independent experiments. Significance was determined by Student's two-sample T-test (* for p<0.05; ** for p<0.01).
-
Figure 1—source data 1
Source data for Figure 1C and student's two sample t-test analysis.
- https://cdn.elifesciences.org/articles/59055/elife-59055-fig1-data1-v1.xlsx
Figure 1—figure supplement 1
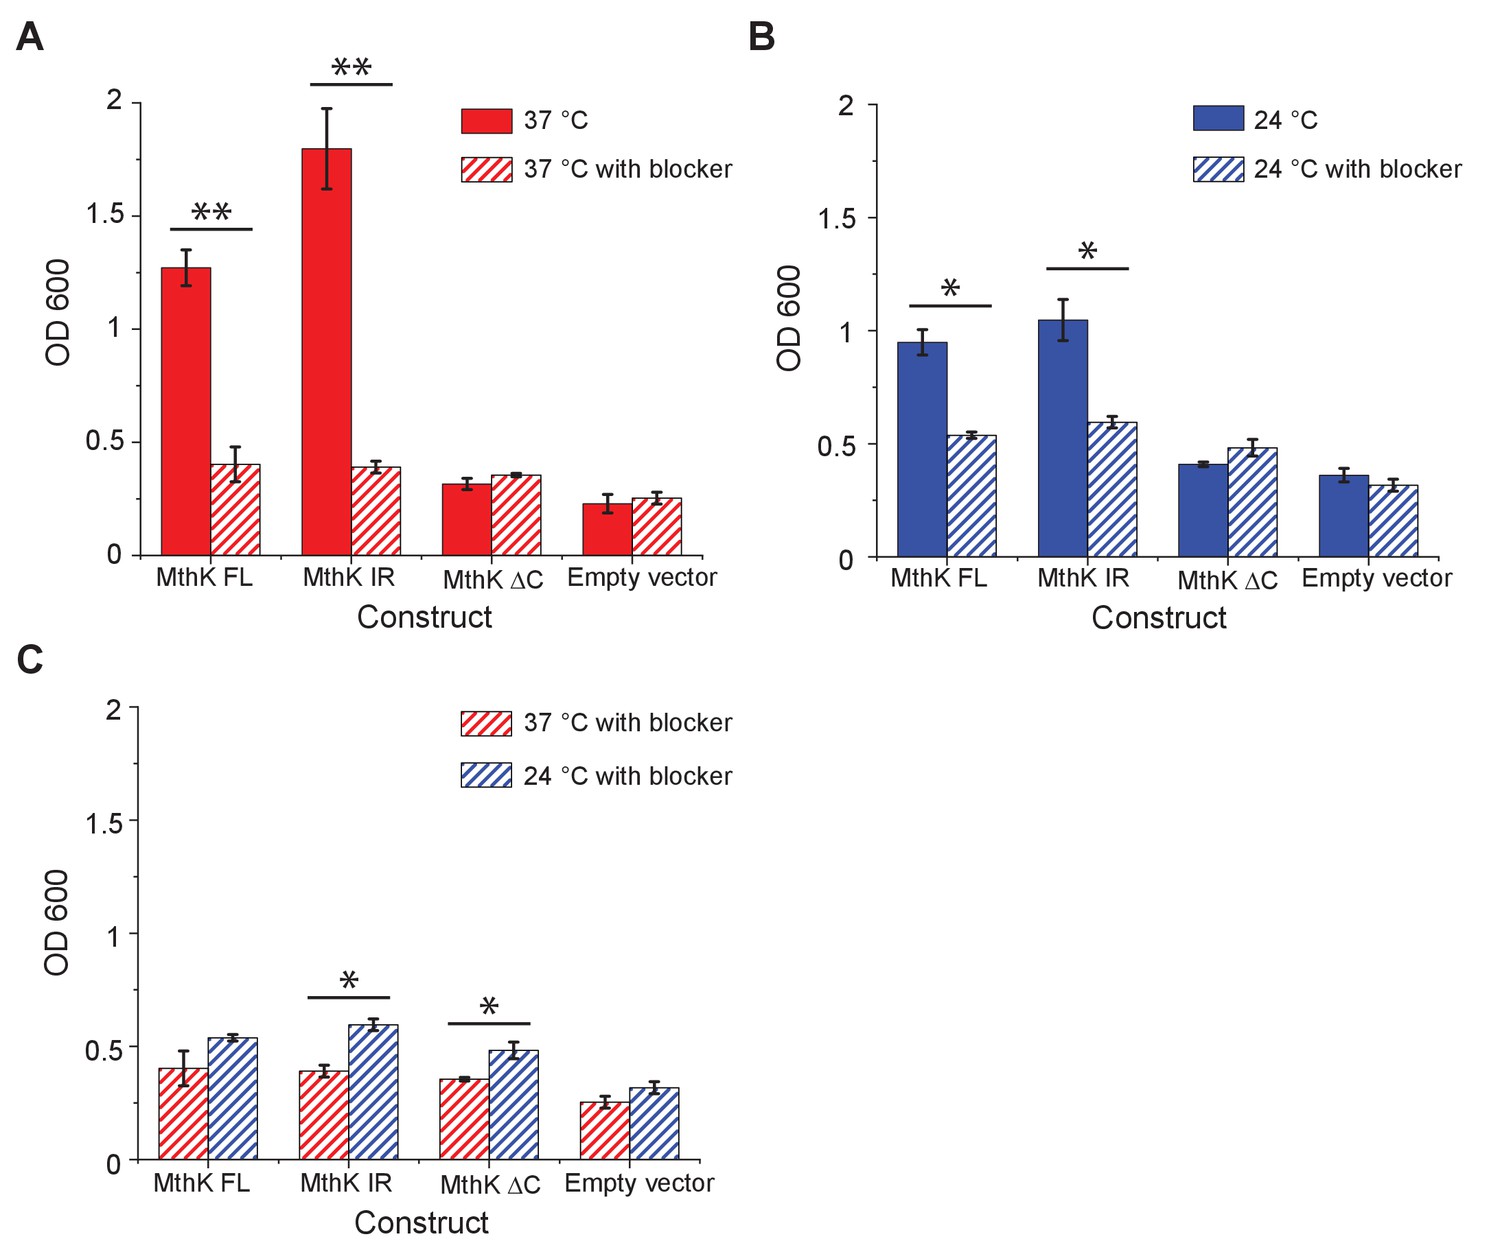
Complementation of LB2003 with MthK constructs at 37°C and 24°C.
OD600 of overnight mini suspension cultures was measured for LB2003 transformed with MthK construct or empty vector at 37°C (A) and 24°C (B) and plotted as bar graphs. 5 mM BaCl2 was used as blocker in the control experiment. (C) Comparison of the blocker results at 37°C and 24°C. Error bars indicate the SEM at each condition (n = 4 for MthK FL 37°C with and without blocker; n = 3 for MthK FL 24°C, n = 4 for with blocker; n = 4 for MthK IR 37°C and 24°C, both with and without blocker; n = 3 for MthK ΔC 37°C with and without blocker; n = 3 for MthK ΔC 24°C, n = 4 with blocker; n = 3 for empty vector at 37°C both with and without blocker and n = 5 for empty vector at 24°C both with and without blocker). Significance was determined by Student's two-sample T-test (* for p<0.05; ** for p<0.01).
-
Figure 1—figure supplement 1—source data 1
OD600 bacterial density measurements and student's two sample t-test analysis.
- https://cdn.elifesciences.org/articles/59055/elife-59055-fig1-figsupp1-data1-v1.xlsx
Figure 1—figure supplement 2
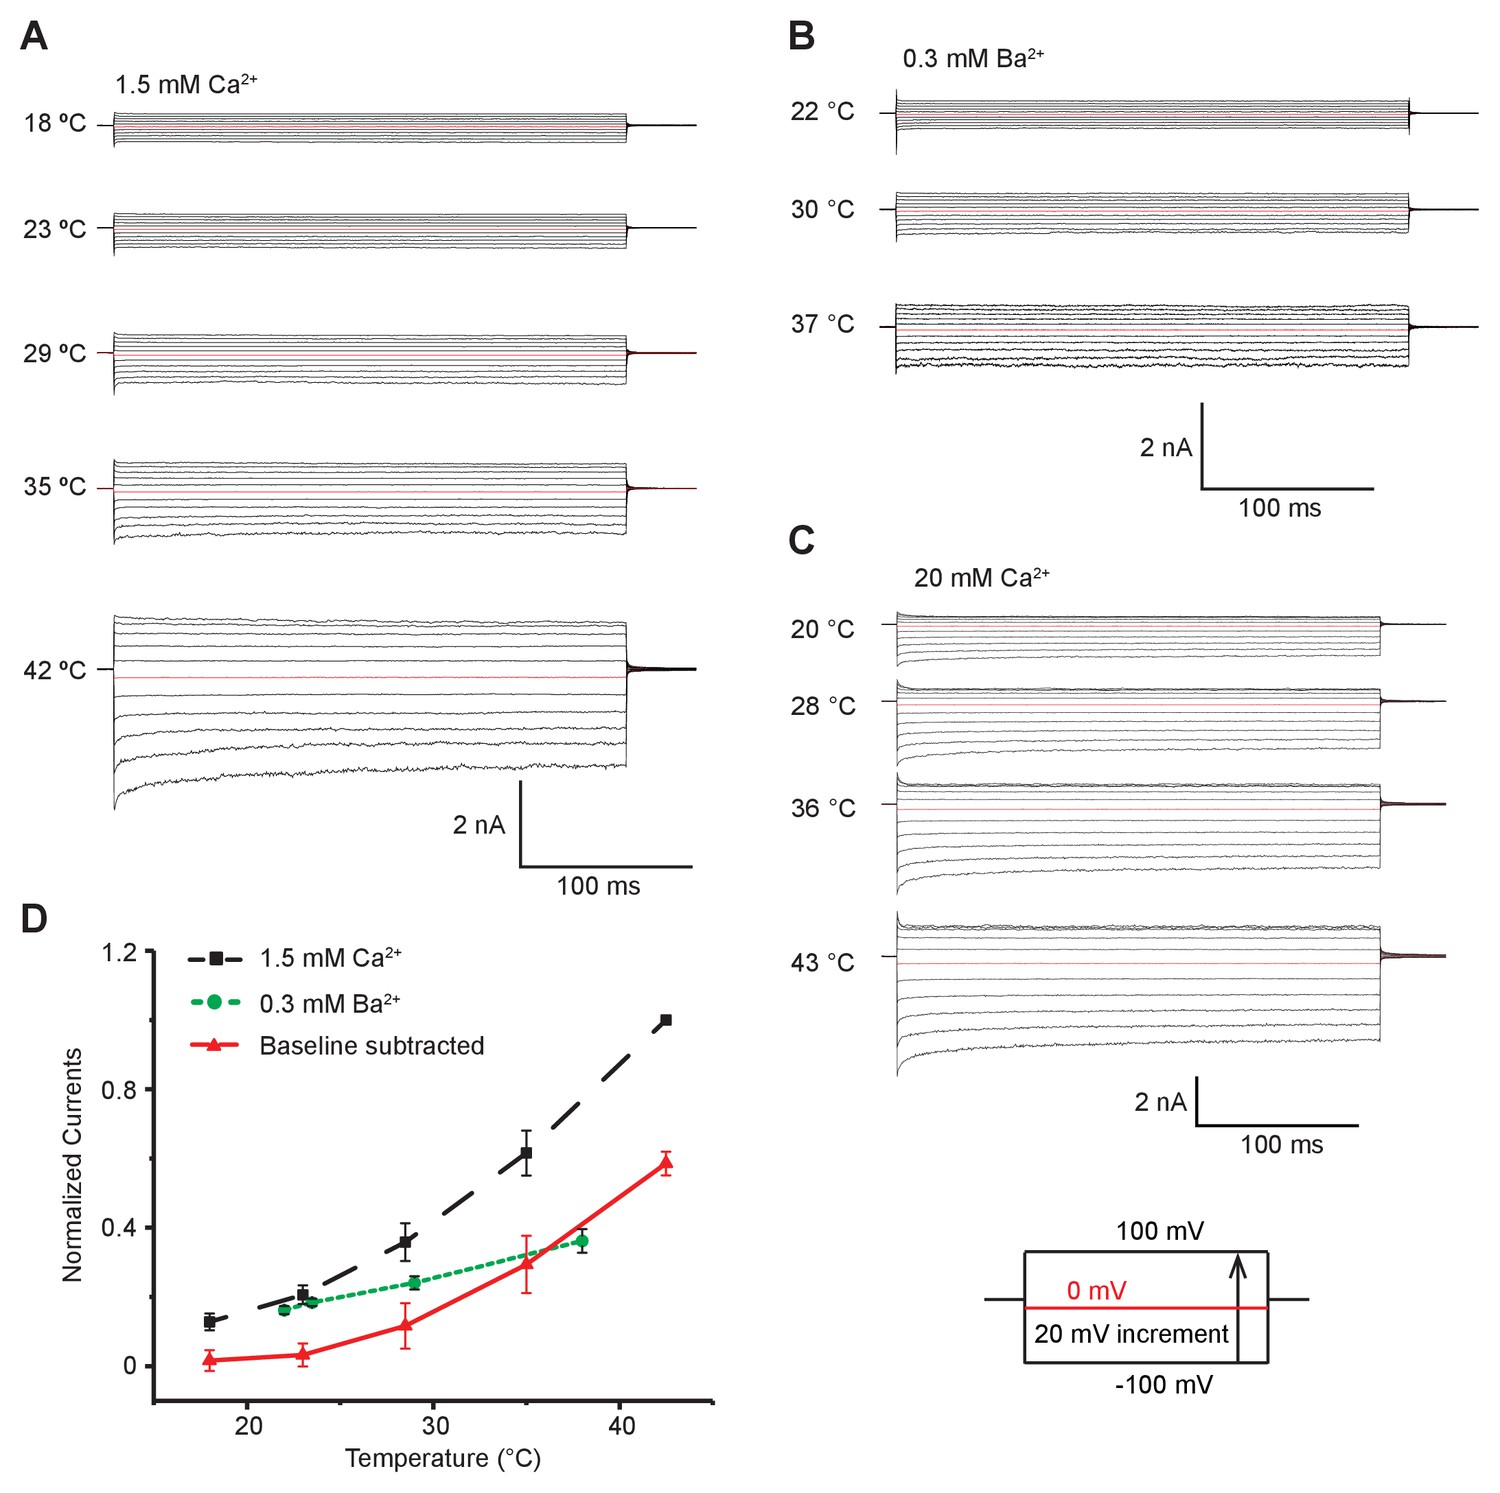
MthK IR expressed in bacterial membranes shows increased activity at higher temperatures.
(A) Representative inside-out patch clamp recordings of MthK IR in giant E. coli spheroplast with 1.5 mM calcium at various temperatures. All recordings in this panel were obtained from the same patch in 150 mM symmetrical potassium. (B) Representative macroscopic recordings of MthK IR in the presence of 0.3 mM barium. These recordings were obtained from the same patch as in A. (C) Representative macroscopic recordings of MthK IR channel in the presence of 20 mM calcium at various temperatures. (D) Normalized MthK IR currents plotted with respect to temperature. Baseline subtracted currents (red) were obtained by subtracting barium block currents (green) from total currents obtained in the presence of 1.5 mM calcium(black). Error bars are SEM from n = 4 independent measurements for 1.5 mM calcium and n = 3 independent measurements for 0.3 mM barium.
-
Figure 1—figure supplement 2—source data 1
Source data for Fig. 1-S2D normalized macroscopic currents.
- https://cdn.elifesciences.org/articles/59055/elife-59055-fig1-figsupp2-data1-v1.xlsx
Figure 2 with 3 supplements

MthK IR is intrinsically heat sensitive.
(A) Representative single-channel recordings of purified MthK IR reconstituted in soybean polar lipids with 0.1 mM calcium at various temperatures. All traces were recorded at −100 mV from the same patch. (B) Current amplitude histograms (left) and open-dwell time (right) of single-channel recordings with the same color scheme as in (A). Inset: The current amplitude histograms corresponding to open channels are enlarged for clarity. (C) Open-dwell time (solid black line) and unitary conductance (dashed blue line) of MthK IR plotted with respect to temperature. (D) Box graph of open probability at various temperatures. The boxes indicate 25–75 percentiles of the data; the whiskers show 5–95 percentiles of the data. Within each box, the line indicates the median value and red symbol marks the mean. Each individual data point is shown as circles. Error bars for (C) are SEM calculated from n = 10 (21°C), 4 (26°C), 4 (32°C), 5 (37°C) independent measurements.
-
Figure 2—source data 1
Source data for each open probability, open dwell time and condctance data point in the presence of 0.1 mM Ca2+.
- https://cdn.elifesciences.org/articles/59055/elife-59055-fig2-data1-v1.xlsx
Figure 2—figure supplement 1

Purification and single-channel recordings of MthK IR.
(A) Size exclusion chromatography (SEC) profile of MthK IR in Superdex 200 column. (B) SDS-PAGE analysis of the peak SEC fraction. (C) Extended single-channel recordings of MthK IR at 0.1 mM calcium. The two arrows mark the region shown in Figure 2A.
-
Figure 2—figure supplement 1—source data 1
Source data for gel filtration profile of MthK IR.
- https://cdn.elifesciences.org/articles/59055/elife-59055-fig2-figsupp1-data1-v1.xlsx
Figure 2—figure supplement 2
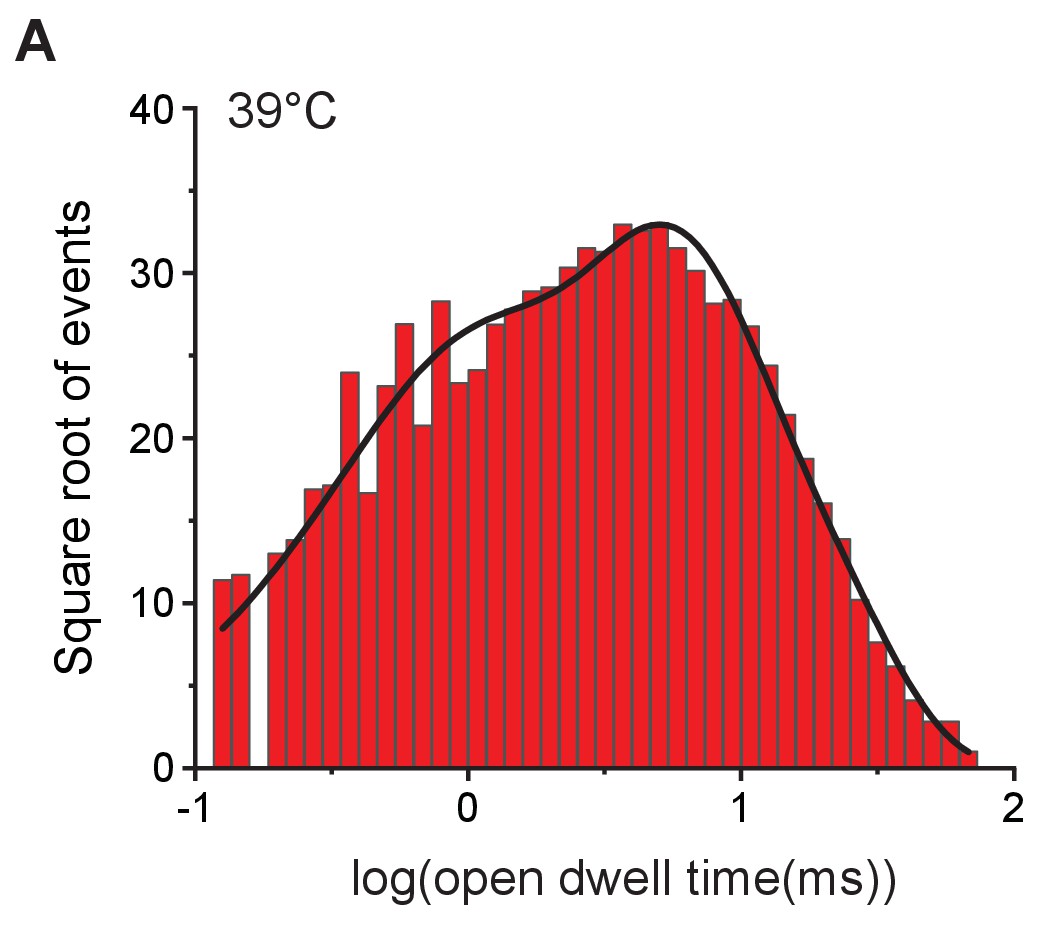
Open-dwell time histogram fitted with exponentials.
(A) The open-dwell time of MthK IR recorded at 39°C shown in Figure 2B was fitted using Clampfit. Based on the most likelihood method, the best fitting model is three term exponential with time constants: , , and .
-
Figure 2—figure supplement 2—source data 1
Source data for bin plot of open dwell time.
- https://cdn.elifesciences.org/articles/59055/elife-59055-fig2-figsupp2-data1-v1.xlsx
Figure 2—figure supplement 3
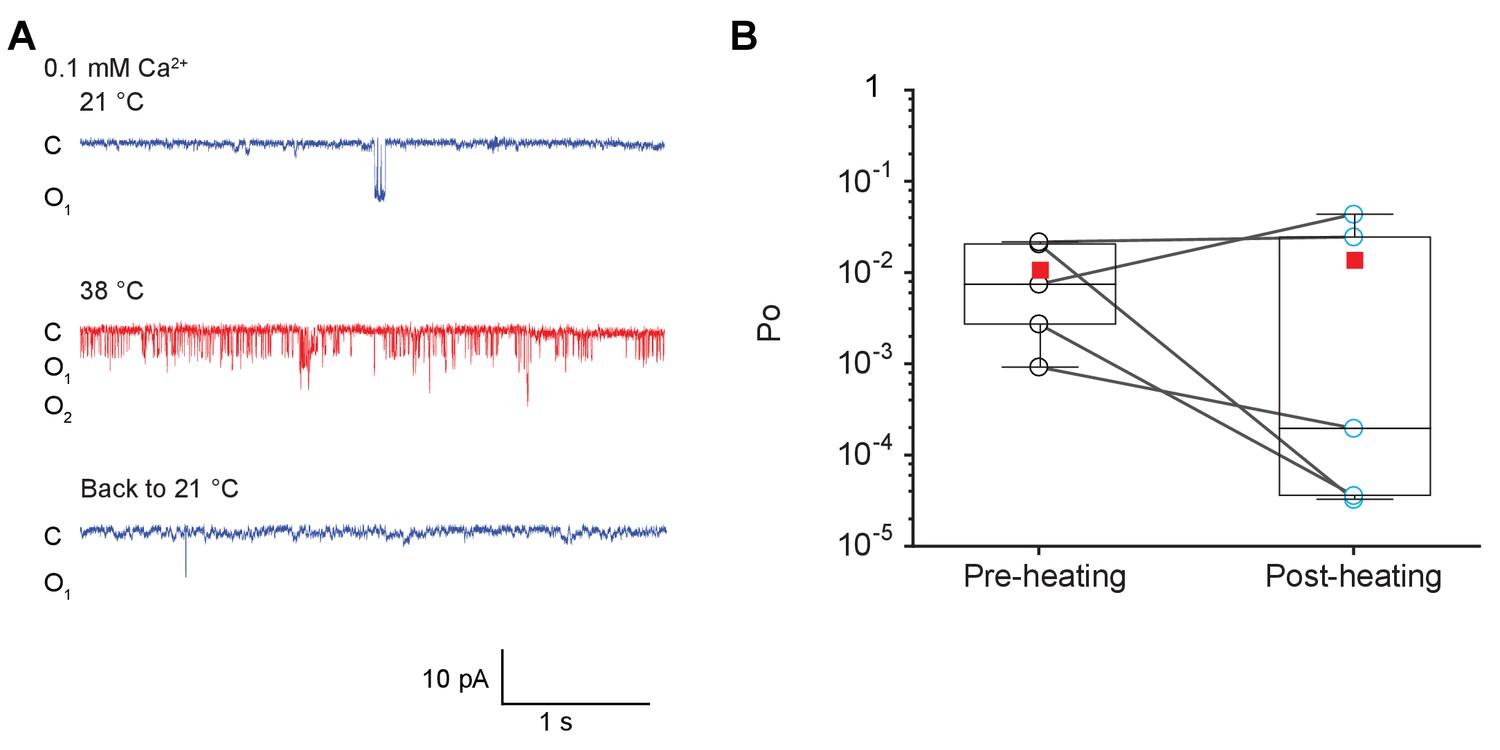
Heat activation of MthK channel is reversible.
(A) Representative single-channel recordings of temperature reversibility of purified MthK IR reconstituted in soybean polar lipids with 0.1 mM calcium. All traces were recorded at −100 mV from the same patch. (B) Box graph of open probability of MthK IR at 21°C before and after heat activation. The boxes represent 25–75 percentiles of the data; the whiskers indicate 5–95 percentiles of the data. Within each box, the line indicates the median value and red symbol marks the mean. Each individual data point is shown as circles, black for pre-heating and blue for post-heating. .
-
Figure 2—figure supplement 3—source data 1
Source data for reversibility of MthK IR.
- https://cdn.elifesciences.org/articles/59055/elife-59055-fig2-figsupp3-data1-v1.xlsx
Figure 3 with 1 supplement

Ablation of RCK domain reduces the temperature-dependence of MthK.
(A) Representative single-channel recordings of purified MthK PO reconstituted in soybean polar lipids with 1 mM calcium at 20°C (blue) and 36°C (red). Inset shows the enlarged traces. nPo values are shown below each trace; the errors were calculated as SEM from bootstrapping the whole recordings. (B) Open-dwell time histograms at the two different temperatures. (C) Plot of open-dwell times (solid black) and unitary conductance (dashed blue) of MthK PO with respect to temperature. Error bars represents SEM calculated from n = 5 independent patches.
-
Figure 3—source data 1
Source data for Figure 3B and C.
- https://cdn.elifesciences.org/articles/59055/elife-59055-fig3-data1-v1.xlsx
Figure 3—figure supplement 1
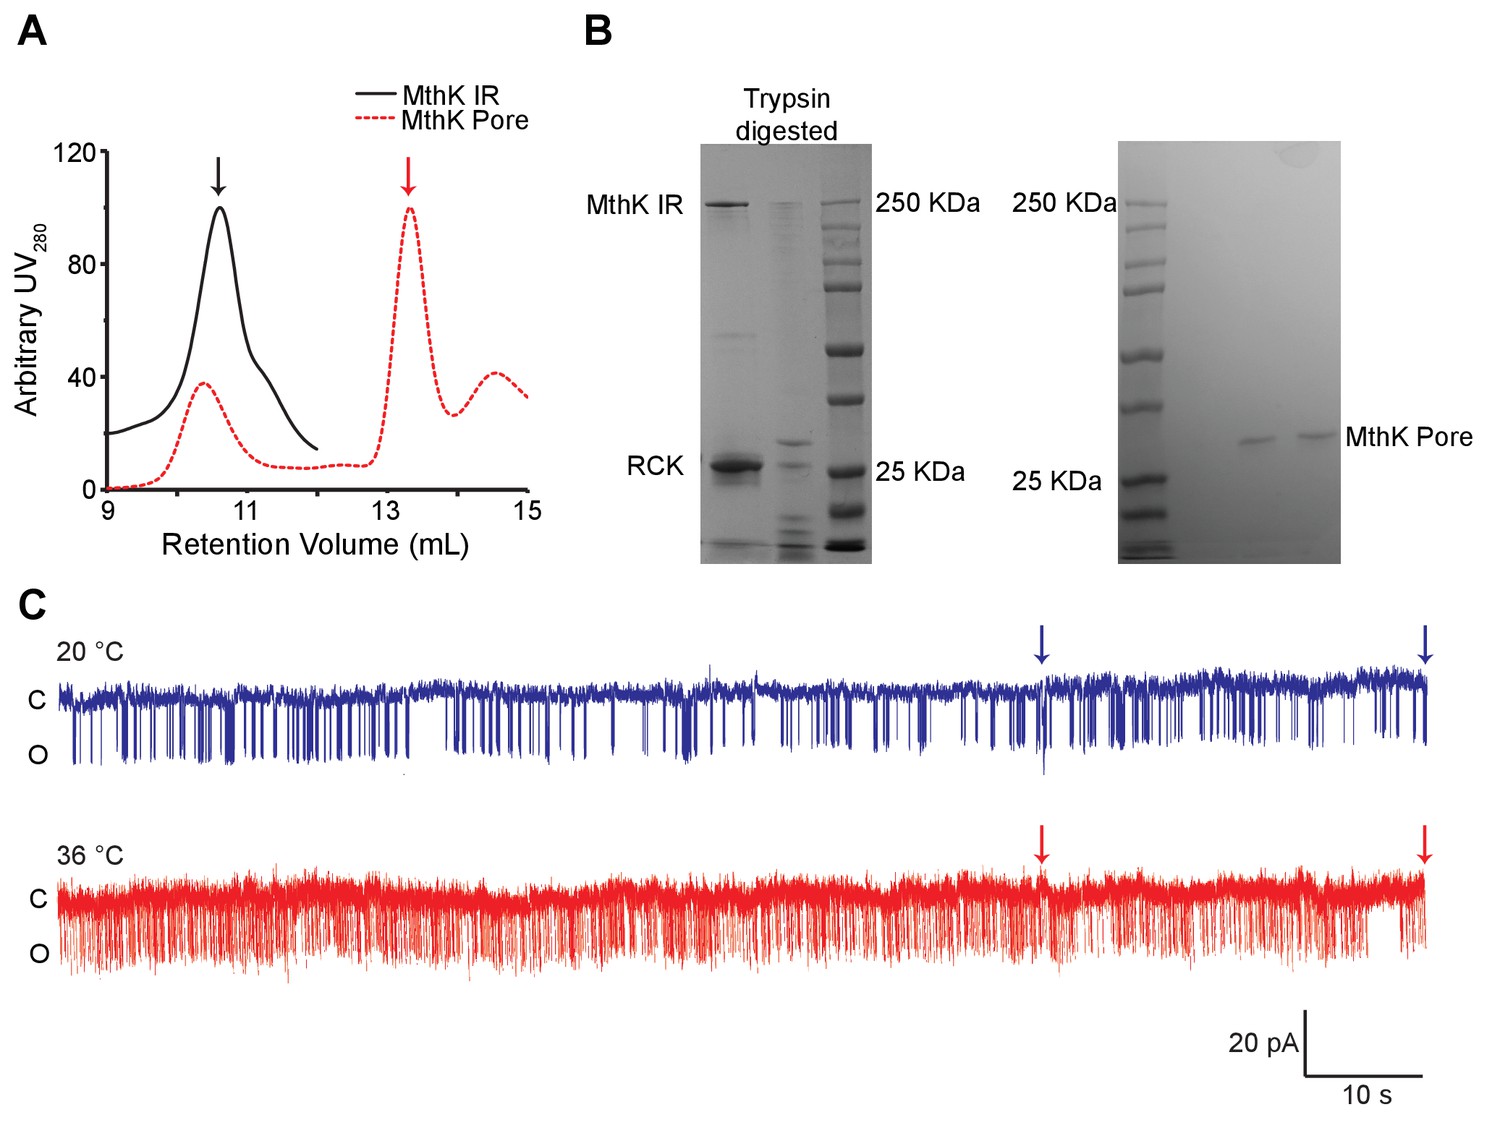
Purification and single-channel recordings of MthK PO.
(A) SEC profile of MthK IR (black) and MthK PO (red) obtained using Superdex 200 column. Black and red arrowheads mark the peaks for MthK IR and MthK PO respectively. (B) SDS-PAGE analysis of MthK IR before and after trypsin digestion is shown on the left, whereas the peak fraction from SEC of MthK PO is on the right. (C) Extended single-channel recordings of MthK PO at 1 mM calcium. The two arrows mark the region shown in Figure 3A.
-
Figure 3—figure supplement 1—source data 1
Source data for gel filtration profile comparision of MthK IR and MthK Pore.
- https://cdn.elifesciences.org/articles/59055/elife-59055-fig3-figsupp1-data1-v1.xlsx
Figure 4 with 1 supplement
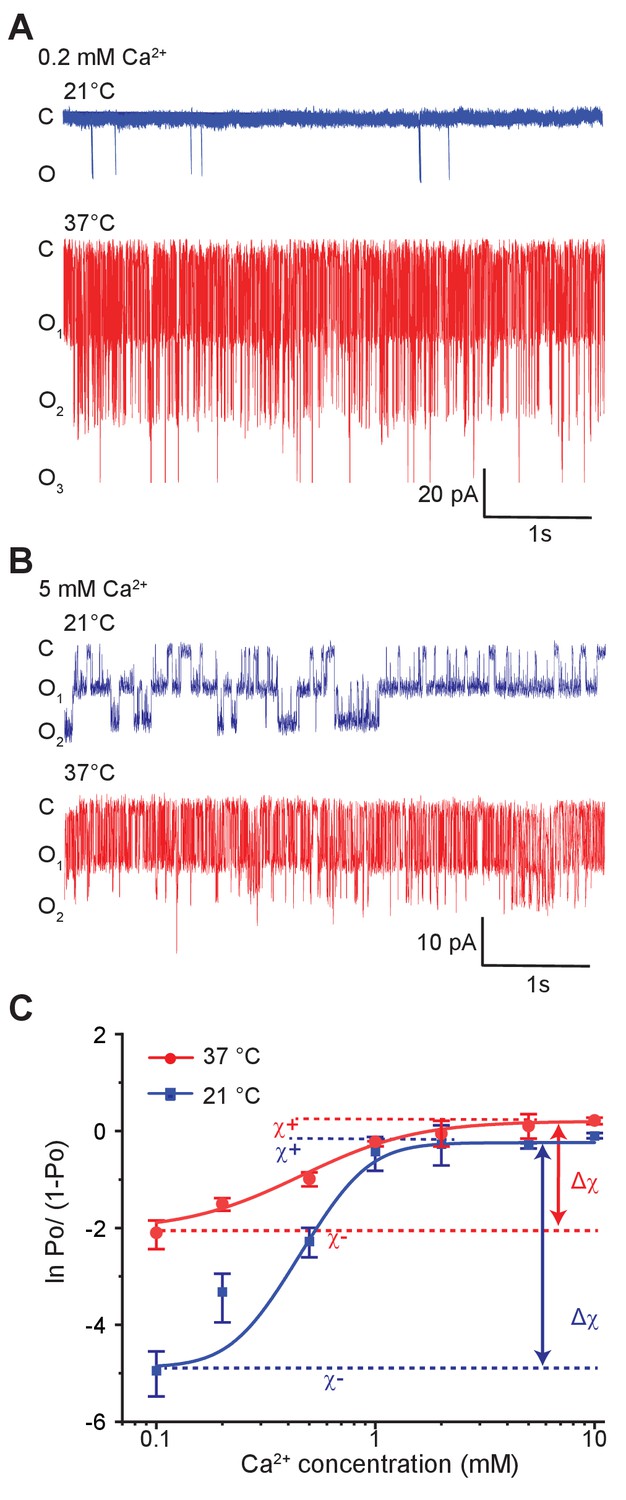
Temperature alters the coupling energy between the RCK and pore domain.
Representative single-channel recordings in the presence of 0.2 mM calcium (A) and 5 mM calcium (B) at two different temperatures. For a particular calcium concentration, the recordings were obtained from the same patch. (C) Hill plot of ln [Po/(1-Po)] versus calcium concentration. Low-temperature data are shown in blue while high-temperature data are in red. The limiting asymptotes for each curve are depicted as dotted lines. values at each temperature correspond to the difference between asymptotes at those temperatures (indicated by double-headed arrows). Error bars represent SEM calculated from n = 10 (0.1 mM Ca2+, 21°C), 3 (0.2 mM Ca2+, 21°C), 5 (0.5 mM Ca2+, 21°C), 6 (1 mM Ca2+, 21°C), 4 (2 mM Ca2+, 21°C), 4 (5 mM Ca2+, 21°C), 5 (10 mM Ca2+, 21°C), 4 (0.1 mM Ca2+, 37°C), 3 (0.2 mM Ca2+, 37°C), 4 (0.5 mM Ca2+, 37°C), 3 (1 mM Ca2+, 37°C), 4 (2 mM Ca2+, 37°C), 3 (5 mM Ca2+, 37°C), and 3 (10 mM Ca2+, 37°C) independent recordings.
-
Figure 4—source data 1
Source data for Figure 4C.
- https://cdn.elifesciences.org/articles/59055/elife-59055-fig4-data1-v1.xlsx
Figure 4—figure supplement 1
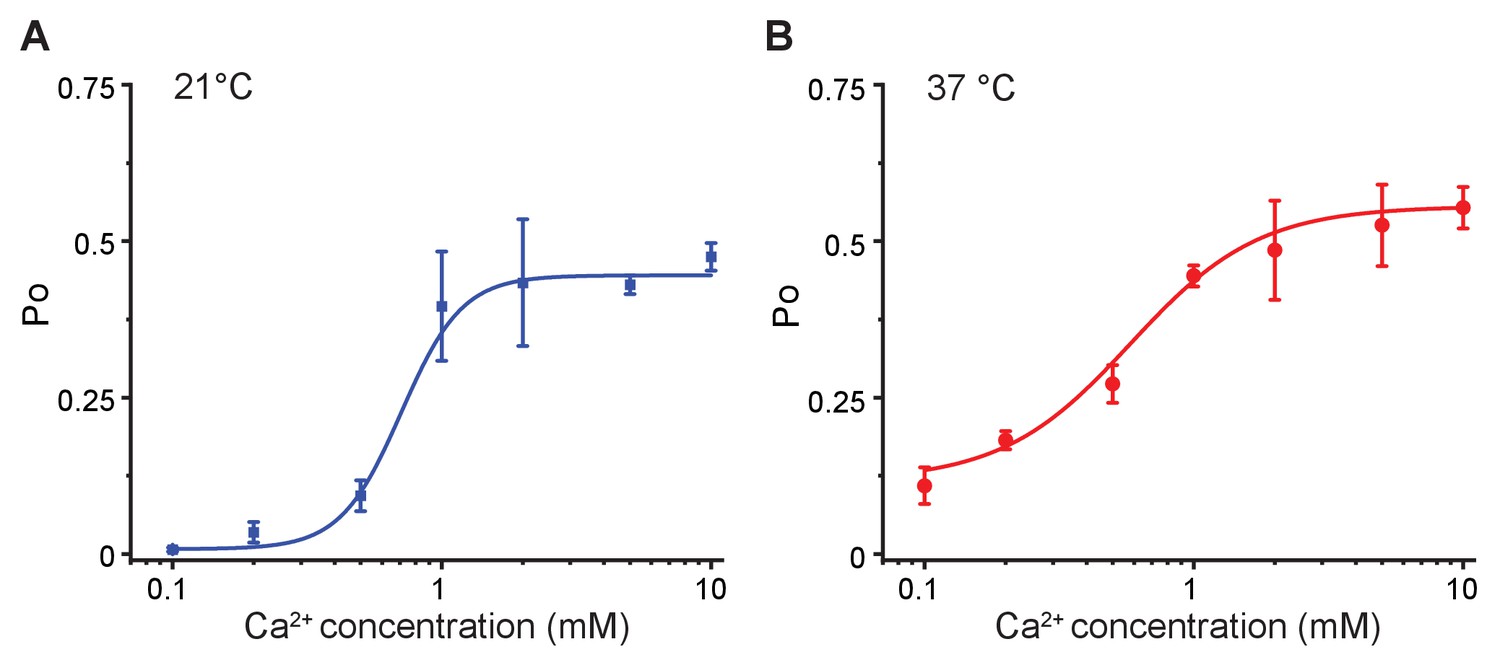
Hill-plots of the calcium dose-response curves.
The open probability of MthK IR with varied calcium concentrations from single channel recordings at 21°C (A) and 37°C (B) were fitted using Hill equation: . These parameters were further used to create the Hill plot of ln [Po/(1-Po)] versus calcium concentration in Figure 4C. Error bars represent SEM calculated from n = 10 (0.1 mM Ca2+, 21°C), 3 (0.2 mM Ca2+, 21°C), 5 (0.5 mM Ca2+, 21°C), 6 (1 mM Ca2+, 21°C), 4 (2 mM Ca2+, 21°C), 4 (5 mM Ca2+, 21°C), 5 (10 mM Ca2+, 21°C), 4 (0.1 mM Ca2+, 37°C), 3 (0.2 mM Ca2+, 37°C), 4 (0.5 mM Ca2+, 37°C), 3 (1 mM Ca2+, 37°C), 4 (2 mM Ca2+, 37°C), 3 (5 mM Ca2+, 37°C), and 3 (10 mM Ca2+, 37°C) independent recordings.
-
Figure 4—figure supplement 1—source data 1
Source data for calcium activation curve at 21°C and 37°C.
- https://cdn.elifesciences.org/articles/59055/elife-59055-fig4-figsupp1-data1-v1.xlsx
Figure 5 with 4 supplements
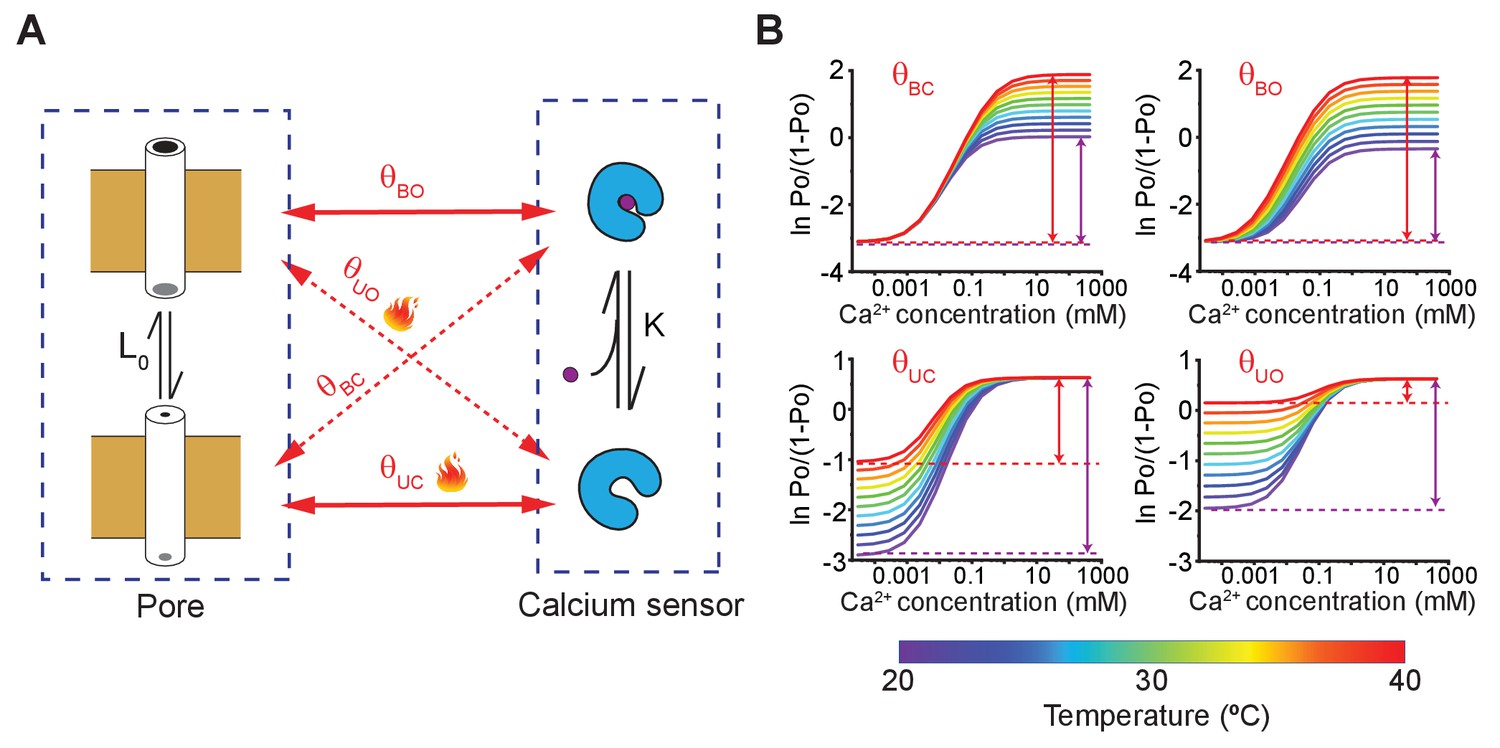
A simple allosteric model for temperature activation of MthK.
(A) Four state binary elements model of MthK activation. The intrinsic equilibrium constant of pore opening is L0 and the calcium-binding affinity is K. The state-dependent interactions between the pore and calcium sensor are represented by , where X indicates the conformation of the calcium sensor (X = bound (B) or unbound (U)) and Y indicates the conformation of the Pore (Y = open (O) or closed (C)). Solid lines indicate the interactions between 'like' states and the dotted lines highlight interactions between 'unlike' states. (B) Using the model of MthK channel gating, described in A, we simulated the Hill-plot of MthK (i.e. ln [Po/(1-Po)] vs. Ca2+) at different temperatures for various model parameters. In each graph, all parameters, except the state-dependent interaction terms shown in each sub-panel, were kept constant across different temperatures. For all simulations, the values of the parameters used were: L0 = 0.1; K = 20000 M−1; 8; 18; 150; 8. For temperature-dependent simulations of , we use the following equation: , where -71 kJ and -220 J/K. Similarly, ( 81 kJ and 310 J/K), ( -71 kJ and -220 J/K) and ( 80 kJ and 300 J/K) were calculated.
-
Figure 5—source data 1
Source data for simulated hill plot for various coupling parameters.
- https://cdn.elifesciences.org/articles/59055/elife-59055-fig5-data1-v1.xlsx
Figure 5—figure supplement 1
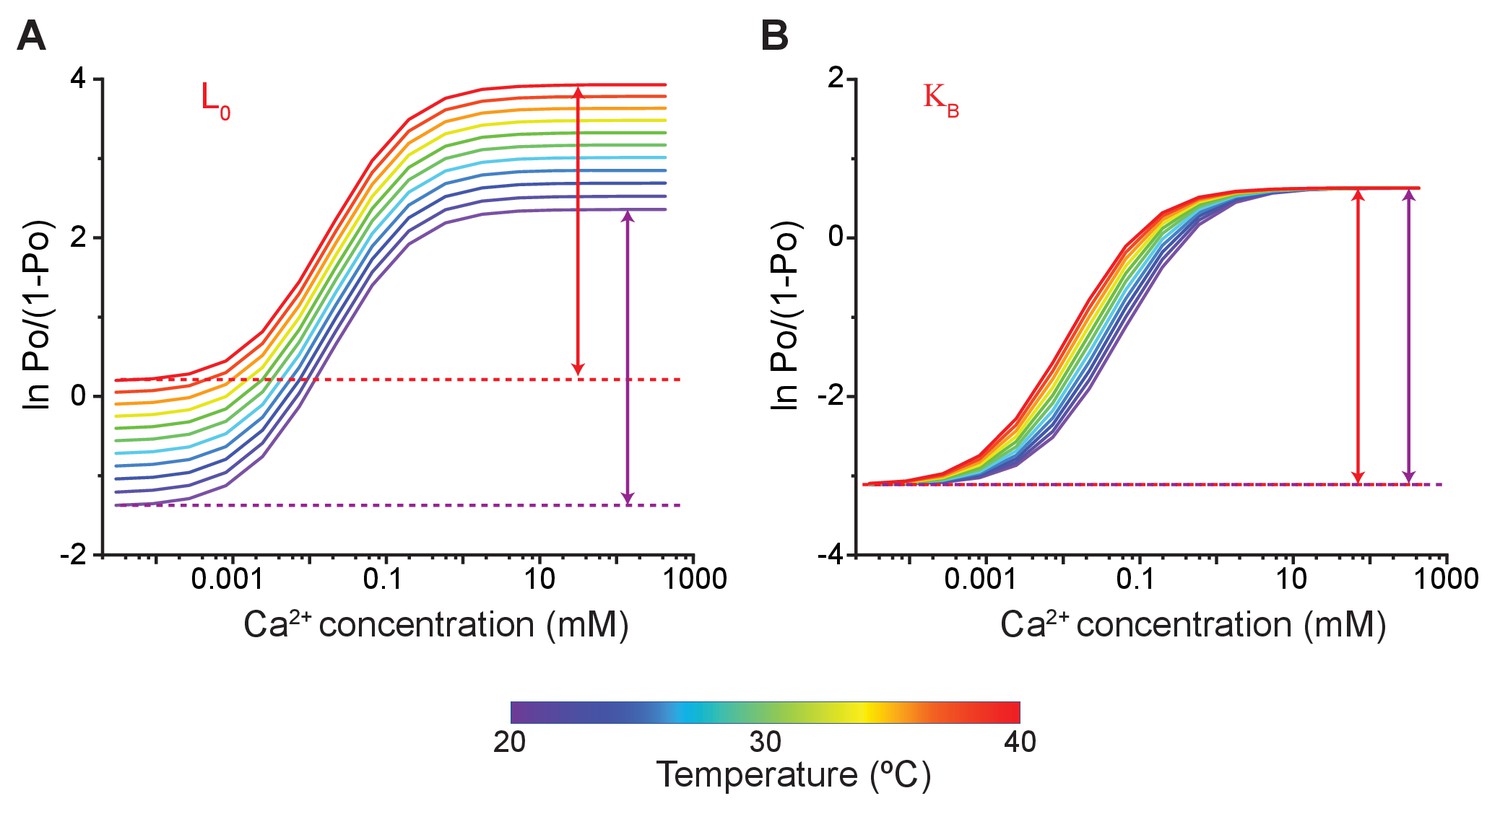
Effect of temperature-dependent parameters on simulated Hill-plots of calcium-dependent gating of MthK.
Using the model of MthK channel gating, described in Figure 5A, we simulated the Hill-plot of MthK channel (i.e. ln [Po/(1-Po)] vs. Ca2+) at different temperatures. (A) All parameters, except were kept constant across the different temperatures. This represents the case where the pore opening is innately temperature sensitive. The simulations show that the Hill-plots symmetrically translate vertically with a change in temperature but there is no change in values. (B) When the binding affinity of calcium is temperature-dependent, the Hill curves are displaced horizontally along with the calcium concentration, again with no change in . For all the simulations, the values of the parameters used were: L0 = 0.1; K = 20000 M−1; 8; 18; 150; 8. For temperature-dependent simulations of in panel A, HL = 60 kJ and SL = 200 J/K and the at each temperature was directly calculated as: . Similarly, for temperature-dependent simulations of shown in panel B, HK = 60 KJ and SK = 220 J/K, respectively.
-
Figure 5—figure supplement 1—source data 1
Source data for simulated hill plot for pore intrinsic equilibrium L0 and binding affinity KB.
- https://cdn.elifesciences.org/articles/59055/elife-59055-fig5-figsupp1-data1-v1.xlsx
Figure 5—figure supplement 2
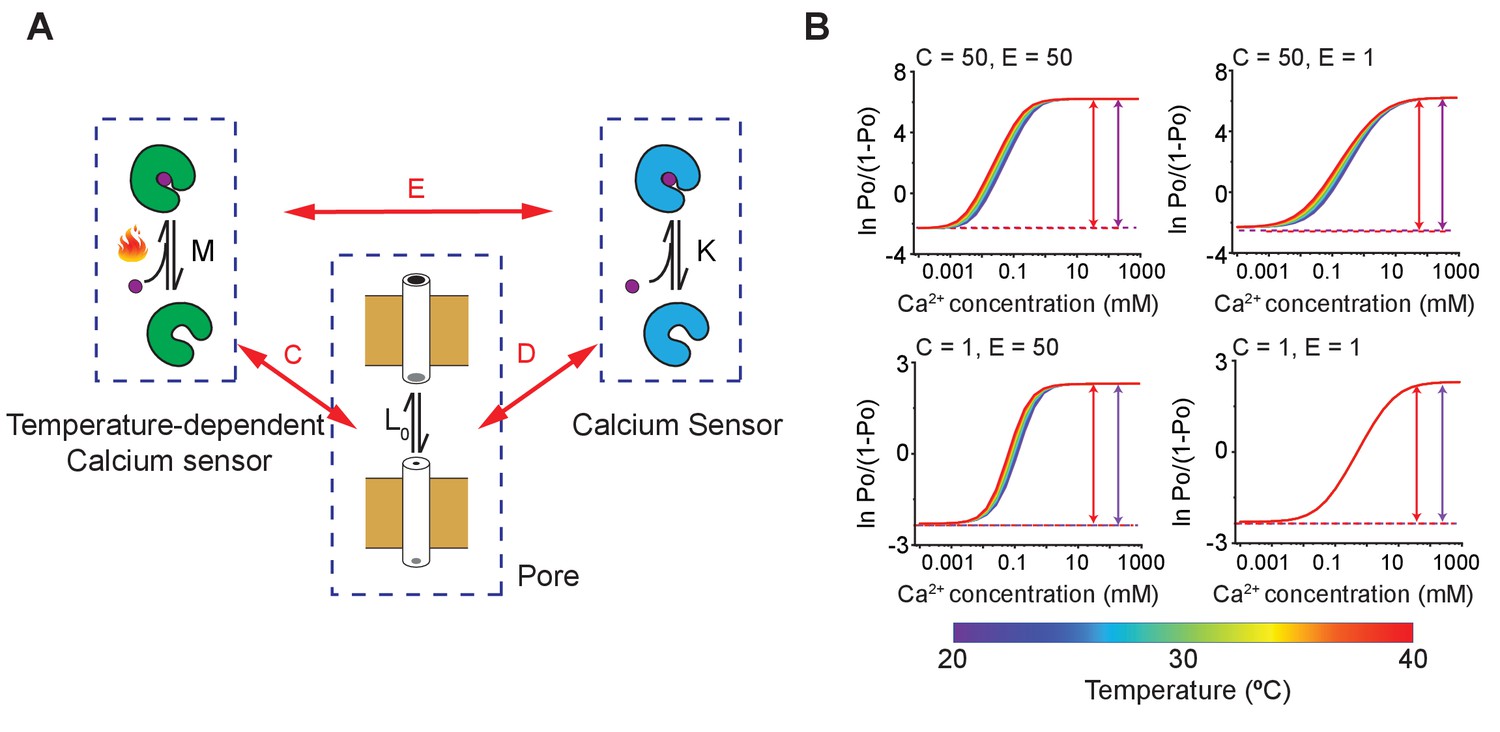
MthK activation involving multiple calcium binding sites with differing temperature-dependence.
(A) A schematic of MthK with two calcium binding sites, one of which is temperature-dependent, whereas the other is not. The intrinsic equilibrium constant for pore opening is , the binding affinity of calcium to the temperature-independent calcium sensor is , and the intrinsic temperature-dependent constant of the calcium sensor is . Each of the three binary elements are allosterically coupled to each other. The coupling constants are indicated as D, C, and E shown in the diagram. (B) Hill plots of model simulations at different temperatures for various values of parameters C and E, as indicated in the inset. The remaining parameters were kept constant: L0 = 0.1, K = 200, and D = 100. All the parameters, except , were assumed to be temperature independent. For the temperature sensor, HM = 60 kJ and SM = 200 J/K, respectively.
-
Figure 5—figure supplement 2—source data 1
Source data for simulated hill plot for multiple temperature binding sites with various temperature dependence.
- https://cdn.elifesciences.org/articles/59055/elife-59055-fig5-figsupp2-data1-v1.xlsx
Figure 5—figure supplement 3
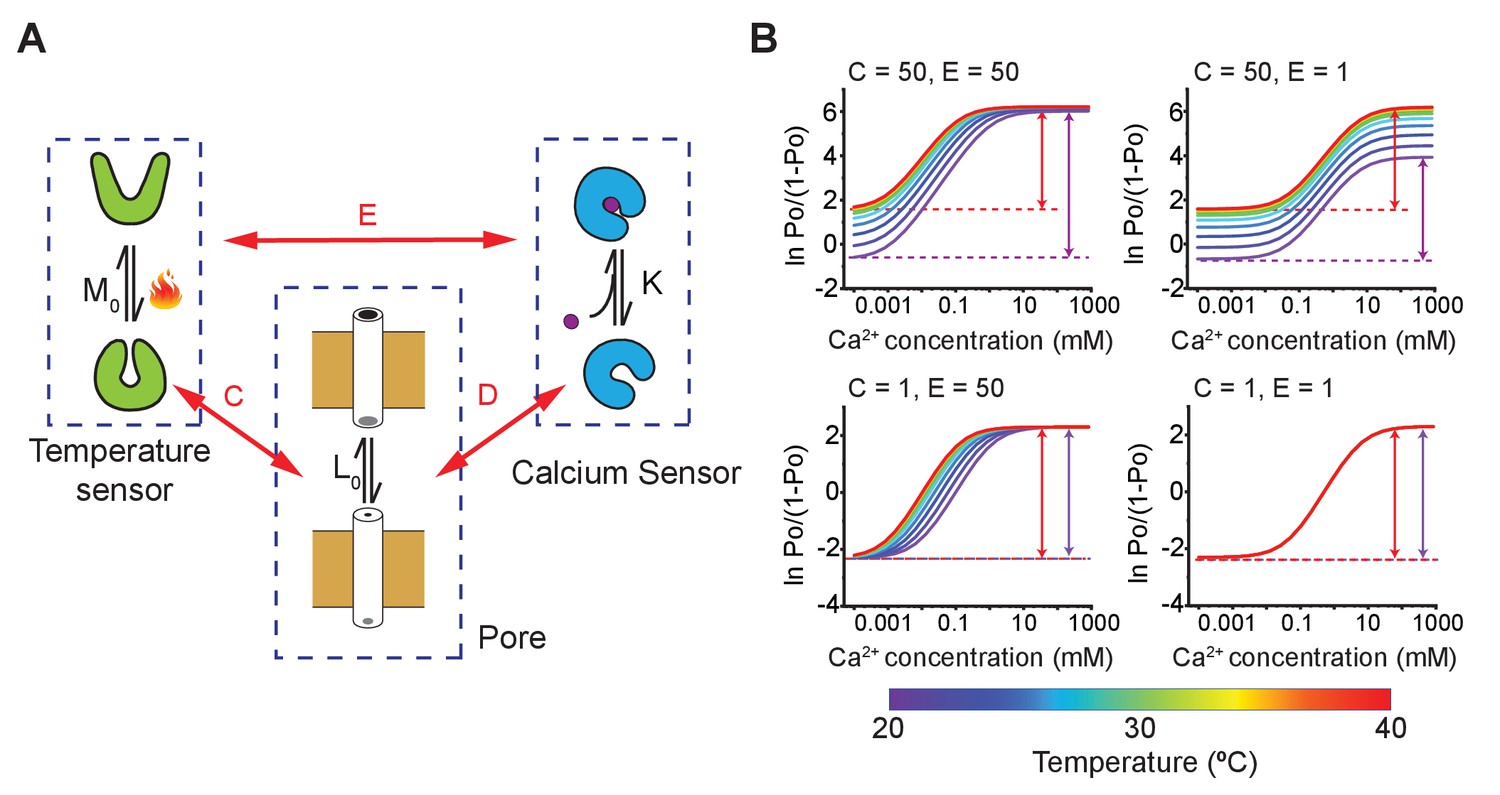
An alternate allosteric model of MthK activation involving independent calcium and temperature sensing domains.
(A) Schematic model depicting pore domain, calcium-binding domain, and temperature sensing domain each of which undergoes a change between active and passive forms. The intrinsic equilibrium constant for pore opening is , the binding affinity of calcium to the RCK domain is , and the intrinsic temperature-dependent activation constant of the thermosensor is . Each of the three binary elements are allosterically coupled to each other. D, C, and E indicate the coupling constants as shown in the diagram. This model is an adaptation of the nested MWC model of BK channel (Horrigan and Aldrich, 2002). (B) Hill plots of model simulations at different temperatures for various values of parameters C and E, as indicated in the inset. The remaining parameters were kept constant: L0 = 0.1, K = 200, and D = 100. All the parameters, except , were assumed to be temperature independent. For the temperature sensor, HM = 60 kJ and SM = 200 J/K, respectively.
-
Figure 5—figure supplement 3—source data 1
Source data for simulated hill plot for a model with independent calcium binding domian and temperature sensor.
- https://cdn.elifesciences.org/articles/59055/elife-59055-fig5-figsupp3-data1-v1.xlsx
Figure 5—figure supplement 4
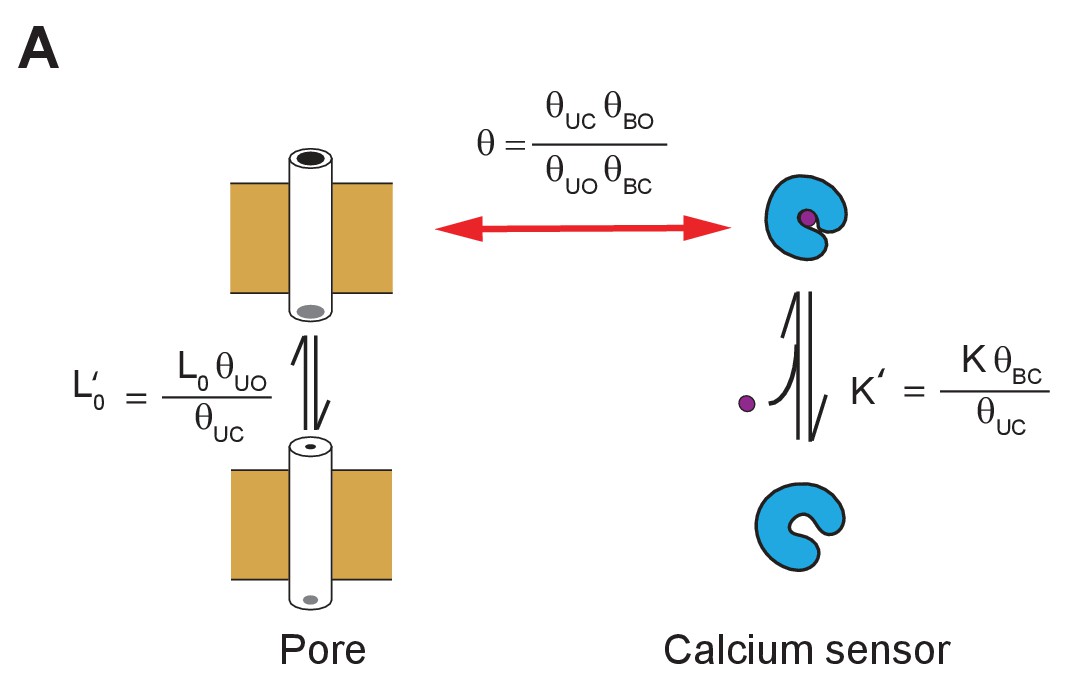
Renormalization of state-dependent interaction parameters.
The model shown in Figure 5A can be described by a reduced set of parameters, as is common in classical representations of allosteric models. The reduced parameters correspond to experimentally determined from linkage analysis of the intact protein. The apparent equilibrium constants of pore opening and ligand binding ( and ) and the global coupling parameter, , are now dependent on the state-dependent coupling parameters. This model and that in Figure 5A thus represent the same process, but the significance of the parameters is different. The intrinsic equilibrium constants and K can be extracted only and only if the pore activation and calcium binding to the calcium sensor is measured in isolation. Thus, these intrinsic parameters will be different from and terms obtained by allosteric analysis of intact channels if there is any state-dependent interaction between the two allosteric domains.
Figure 6
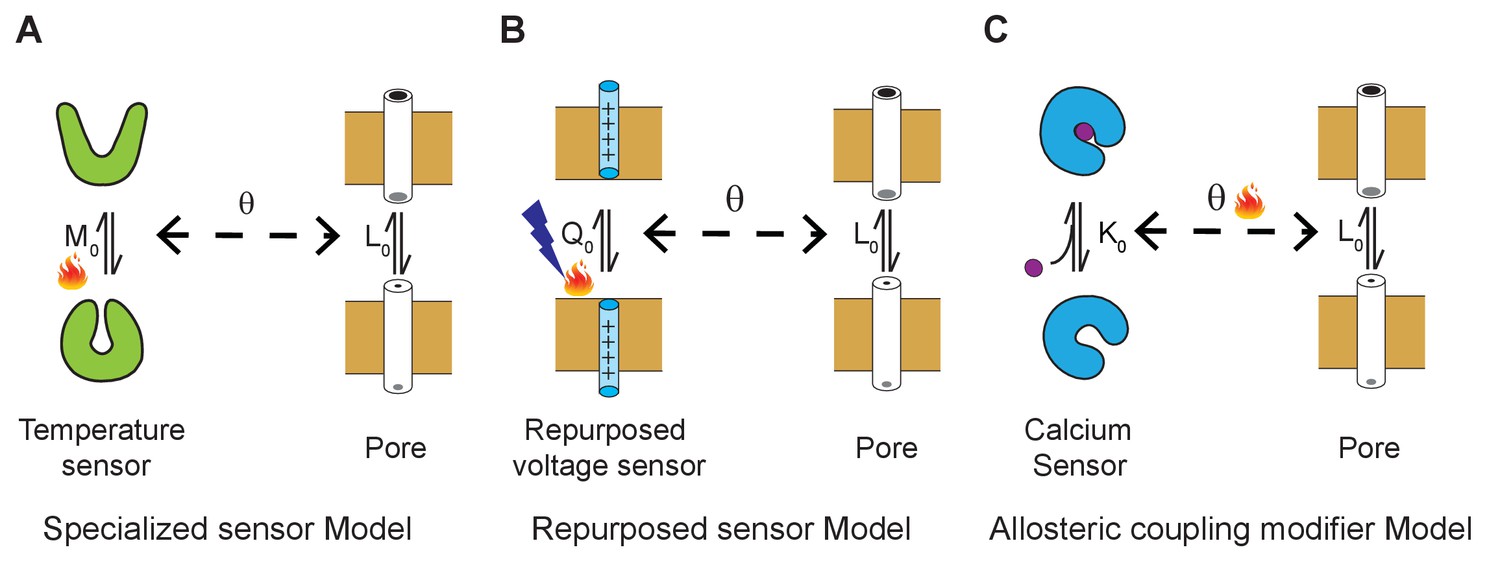
Three general allosteric mechanisms of temperature regulation.
(A) Specialized sensor model. A classical allosteric model where the pore domain is allosterically coupled to a specialized domain whose conformation is temperature-dependent. defines the intrinsic temperature-dependent equilibrium constant for activation of a dedicated thermosensing domain. is the intrinsic equilibrium for pore opening and is the coupling interaction between the thermosensor and pore. Examples of specialized temperature sensors include bacterial sodium channels and Hv1 channels. (B) Polymodal sensor model. A variant of the classical allosteric model wherein the ligand or voltage-sensing domain is also sensitive to temperature. In this example, is the voltage-dependent equilibrium constant whose voltage-dependent activation is also sensitive to temperature. In the engineered temperature-sensitive Shaker mutants, the mutations likely alter the temperature-dependence of voltage-sensor movement. (C) Allosteric modifier model. Here, defines the calcium binding affinity of the calcium sensor and the primary effect of temperature is to alter the allosteric coupling interaction between the ligand-sensing domain and pore domain.
Tables
Key resources table
| Reagent type (species) or resource | Designation | Source or reference | Identifiers | Additional information |
|---|---|---|---|---|
| Strain, strain background (Escherichia coli) | XL1-Blue | Agilent | 200236 | |
| Strain, strain background (Escherichia coli) | LB2003 | Parfenova et al., 2006 This paper | From Dr. I. Hänelt lab | |
| Strain, strain background (Escherichia coli) | OverExpress C43(DE3) | Lucigen | 60446–1 | |
| Recombinant DNA construct | MthK FL (M. thermoautotrophicum) | This paper | UniProtKB-O27564 | From Dr. B. S. Rothberg lab |
| Recombinant DNA construct | MthK IR construct | This paper | Delete the DNA region corresponds N-terminal 2–17 amino acid in MthK full length | |
| Recombinant DNA construct | MthK ∆C construct | This paper | A stop codon was introduced after H117 in MthK IR background | |
| Peptide, recombinant protein | Thrombin | GE Healthcare | 27084601 | |
| Peptide, recombinant protein | Trypsin type I | Sigma-Aldrich | T8003 | |
| Peptide, recombinant protein | Trypsin inhibitor type II-O | Sigma-Aldrich | T9253 | |
| Peptide, recombinant protein | Ready-Lyse Lysozyme solutions | Lucigen | R1804M | |
| Peptide, recombinant protein | OmniCleave Endonuclease | Lucigen | OC7850K | |
| Chemical compound, detergent | n-Decyl-β-D- maltopyranoside (DM) | Anatrace | D322 | |
| Chemical compound, detergent | n-Dodecyl β-D- maltoside (DDM) | Anatrace | D310 | |
| Chemical compound, lipids | Soybean Polar Lipid Extract | Avanti | 541602C |
Additional files
Download links
A two-part list of links to download the article, or parts of the article, in various formats.
Downloads (link to download the article as PDF)
Open citations (links to open the citations from this article in various online reference manager services)
Cite this article (links to download the citations from this article in formats compatible with various reference manager tools)
Activation of the archaeal ion channel MthK is exquisitely regulated by temperature
eLife 9:e59055.
https://doi.org/10.7554/eLife.59055


