GAS5 protects against osteoporosis by targeting UPF1/SMAD7 axis in osteoblast differentiation
- Department of Orthopedics, The Eighth Affiliated Hospital, Sun Yat-sen University, China
- Department of Orthopedics, Sun Yat-sen Memorial Hospital, Sun Yat-sen University, China
- Department of Orthopedics, Zhujiang Hospital, Southern Medical University, China
- Center for Biotherapy,The Eighth Affiliated Hospital, Sun Yat-sen University, China
- Center for Biotherapy, Sun Yat-sen Memorial Hospital, Sun Yat-sen University, China
Figures
Figure 1 with 2 supplements
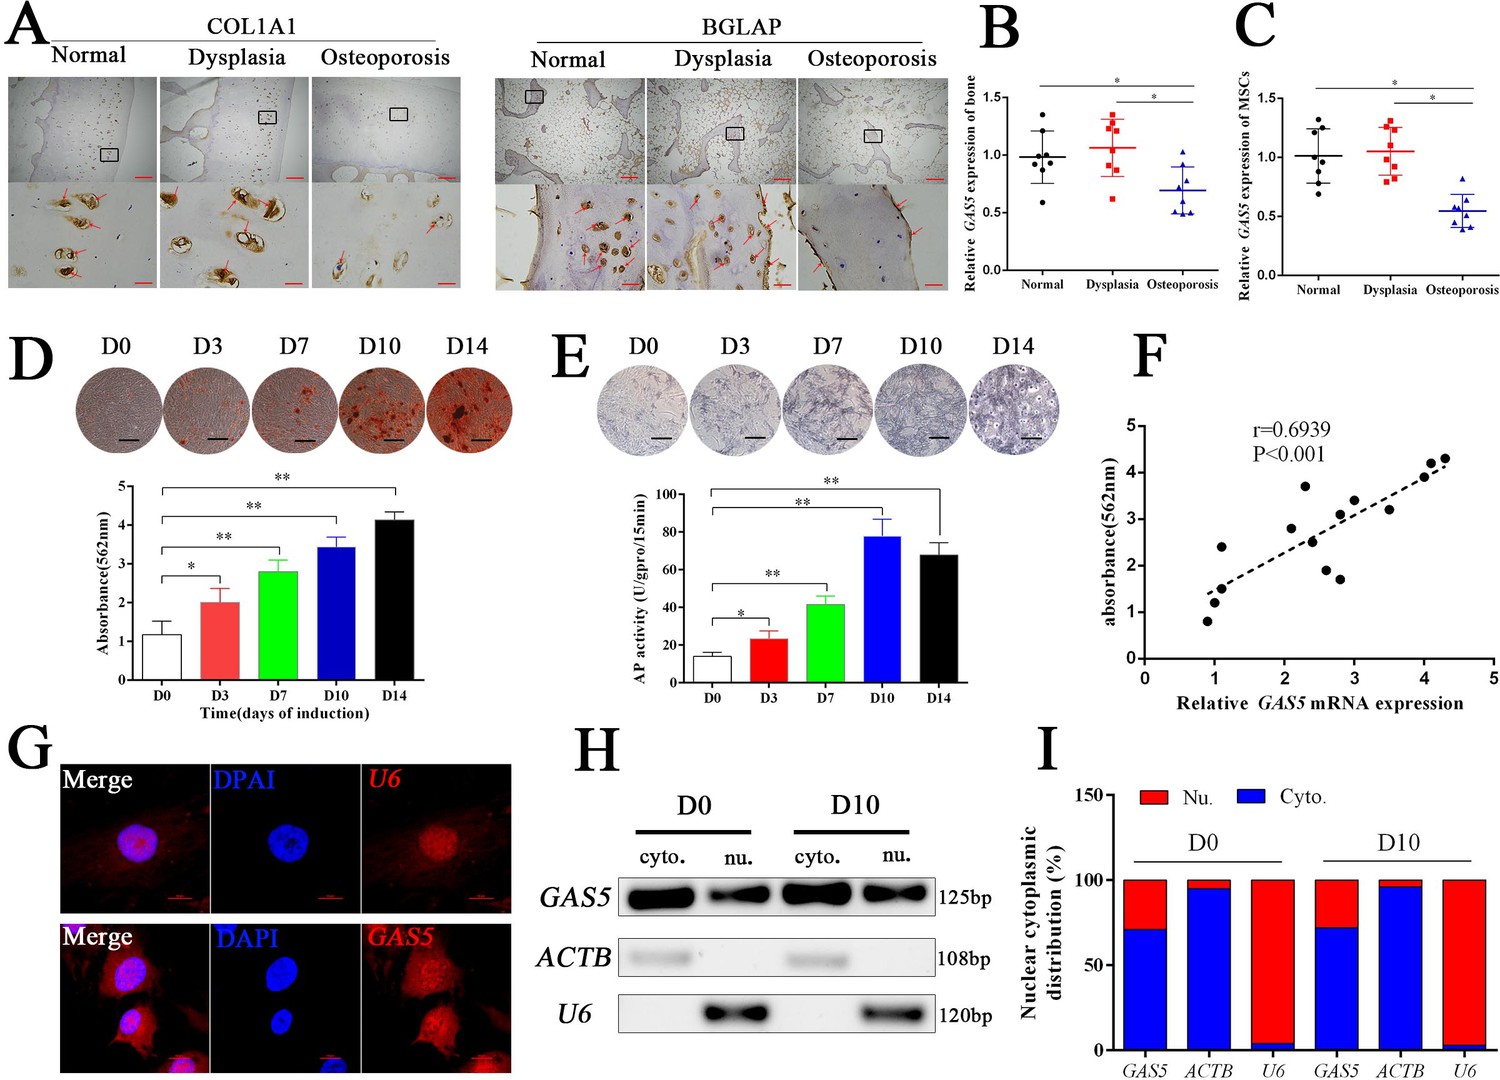
GAS5 decreased in osteoporosis and positively correlated with the osteoblast differentiation.
(A) COL1A1 and BGLAP immunohistochemical staining of the femur head from hip dysplasia and osteoporosis patients. The red arrow shows typical staining. Scale bar, (upper, 500 µm; lower, 50 µm). (B) qRT-PCR analysis of GAS5 isolated from cancellous bone between eight patients with postmenopausal osteoporosis and eight patients with hip dysplasia (n = 8). (C) GAS5 mRNA expression level in BMSCs isolated from hip dysplasia and osteoporosis patients (n = 8). (D) ARS staining during the osteogenic differentiation of MSCs (top). Alizarin red staining quantification during the osteogenic differentiation of MSCs. (bottom) (n = 15). (E) ALP staining and ALP assays in the osteoblast differentiation. (F) The relation of GAS5 and Alizarin red staining quantification in the osteoblast differentiation (n = 15). (G) GAS5 RNA FISH in BMSCs. U6 as the positive control. Scale bar, 50 µm. (H, I) Nuclear and cytoplasmic fractionation assay following agarose gel electrophoresis and analysis of GAS5 in the osteoblast differentiation. ACTB (actin β) and U6 were used as the positive controls.
Figure 1—figure supplement 1

Gene marker expression of BMSCs osteoblast differentiation.
Relative mRNA expression of GAS5, BGLAP, ALPL, and RUNX2 along with the day of human BMSCs osteogenic differentiation.
Figure 1—figure supplement 2
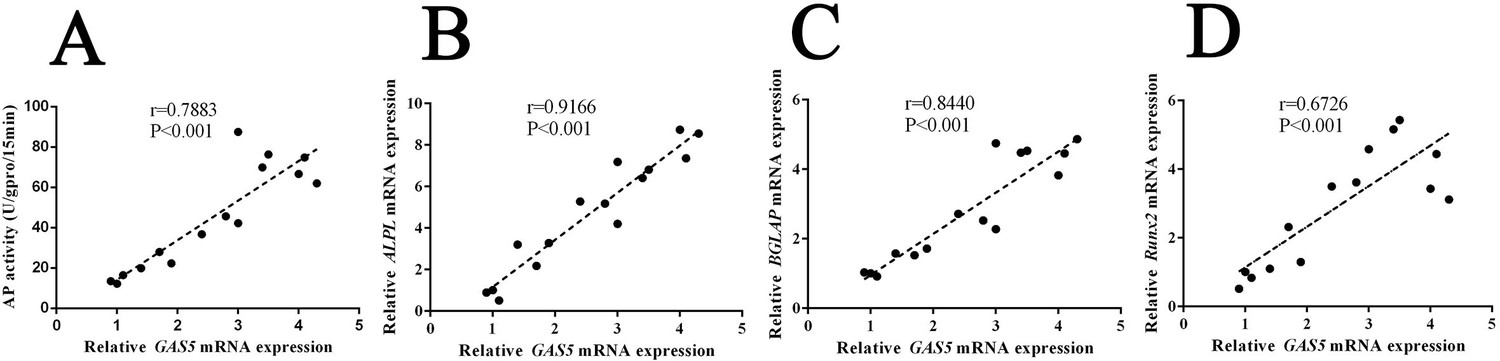
The relation of GAS5 and the other makers of MSCs in the osteoblast differentiation.
(A) The correlation of GAS5 and ALP assay during osteogenic differentiation of MSCs (n = 15). (B, C, D) The correlation of GAS5 and ALPL, BGLAP, and RUNX2 during osteogenic differentiation of MSCs (n = 15).
Figure 2 with 2 supplements
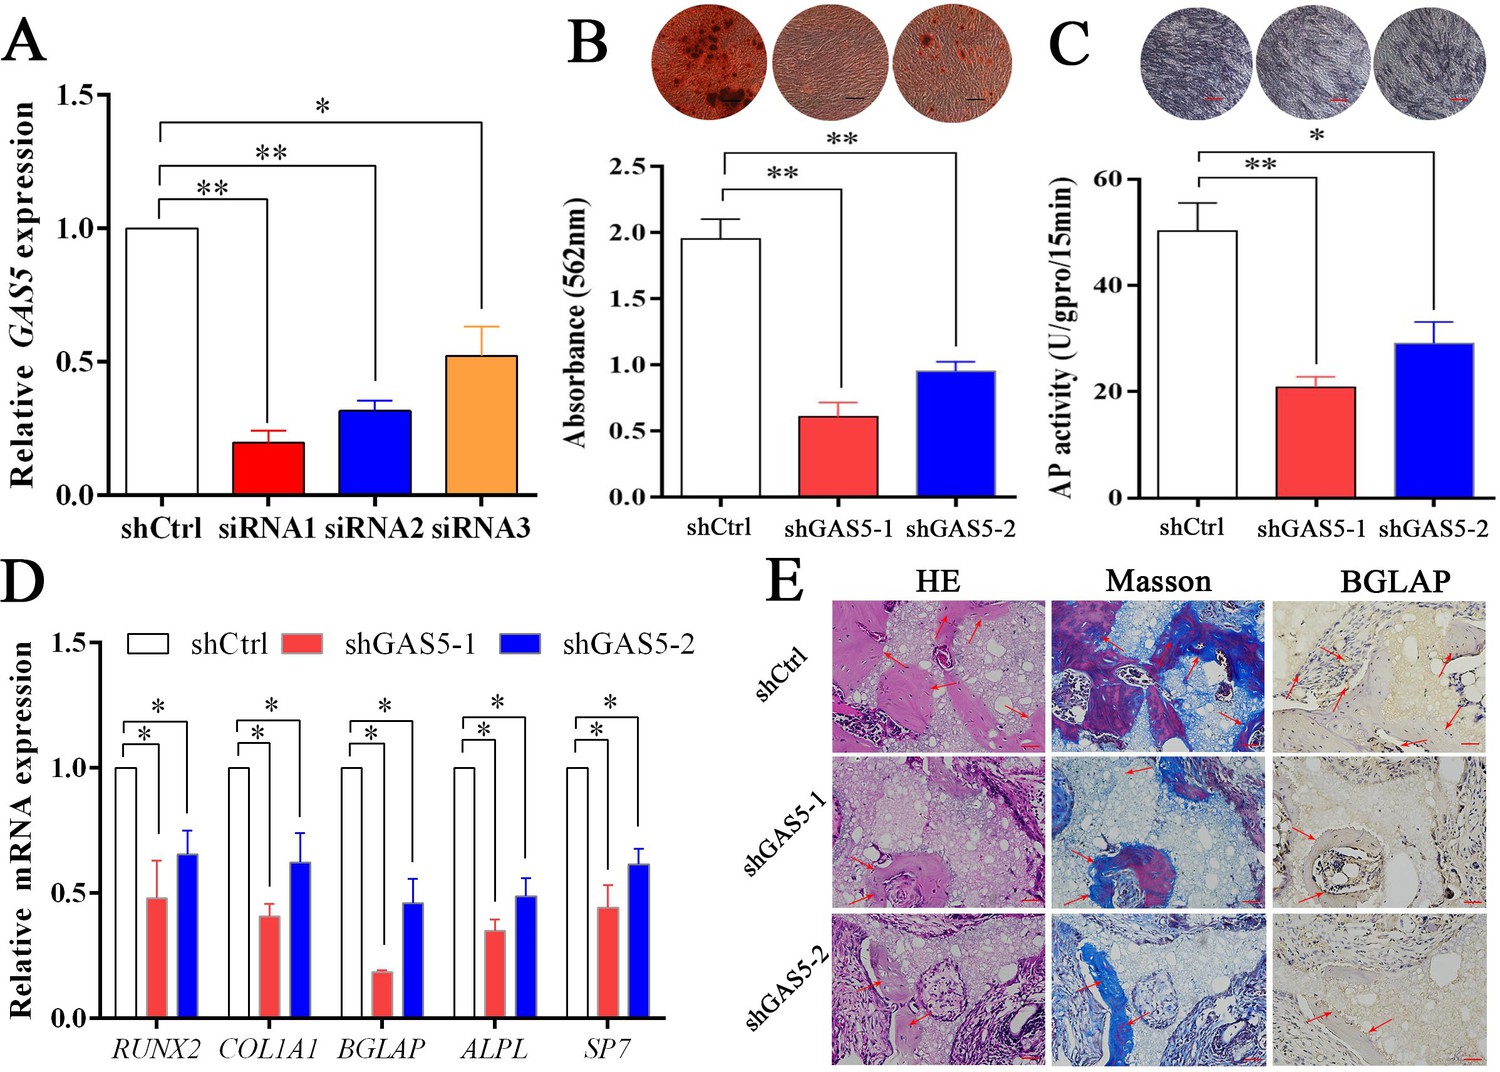
Decreasing GAS5 inhibited the osteoblast differentiation in vitro and in vivo.
(A) GAS5 siRNA knockdown efficiency tested by qRT-PCR. (B) ARS staining and quantification in the GAS5 knockdown or control group. Scale bar, 500 µm. (C) ALP staining and ALP tests in the GAS5 knockdown or control group. Scale bar, 500 µm. (D) Relative RUNX2, ALPL, BGLAP, COL1A1, and SP7 expression in the GAS5 knockdown or control group. (E) H and E staining, Masson staining and Bglap immunohistochemical staining of HA/TCP in the GAS5 knockdown or control group. The red arrow shows typical bone formation. Scale bar, 100 µm; n = 5. Each cellular experimental group was repeated at least three times.
Figure 2—figure supplement 1
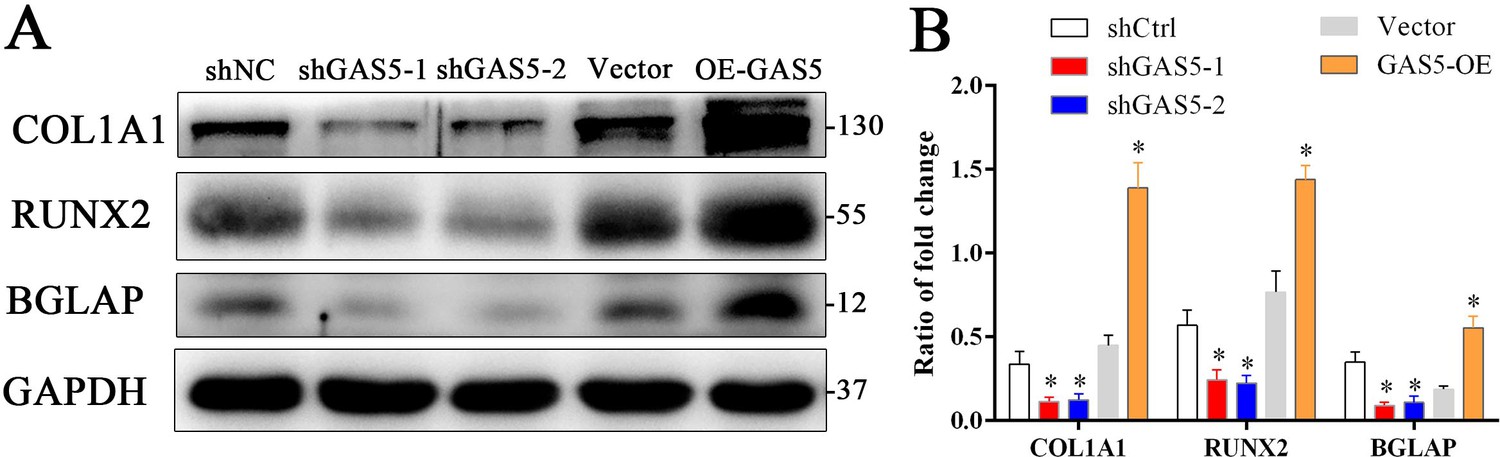
Western blot analysis and quantification of osteogenesis markers.
(A) Western blot analysis and quantification of osteogenesis markers (COL1A1, RUNX2, BGLAP) in GAS5 knockdown or overexpression conditions. (B) Quantification of Western blot of osteogenesis markers (COL1A1, RUNX2, BGLAP) in GAS5 knockdown or overexpression conditions.
Figure 2—figure supplement 2
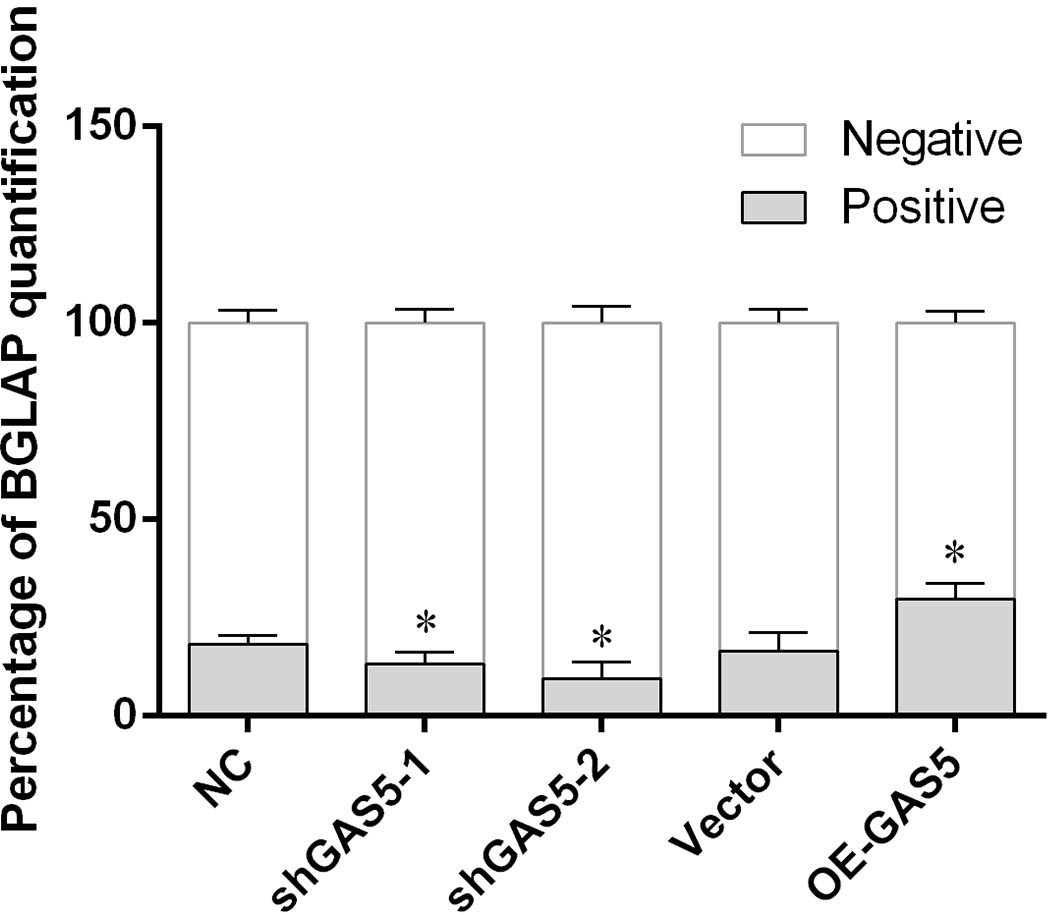
The quantification of BGLAP immunohistochemical staining.
The quantification of BGLAP immunohistochemical staining of in vivo bone formation tests in GAS5 knockdown or overexpression treatment.
Figure 3 with 2 supplements
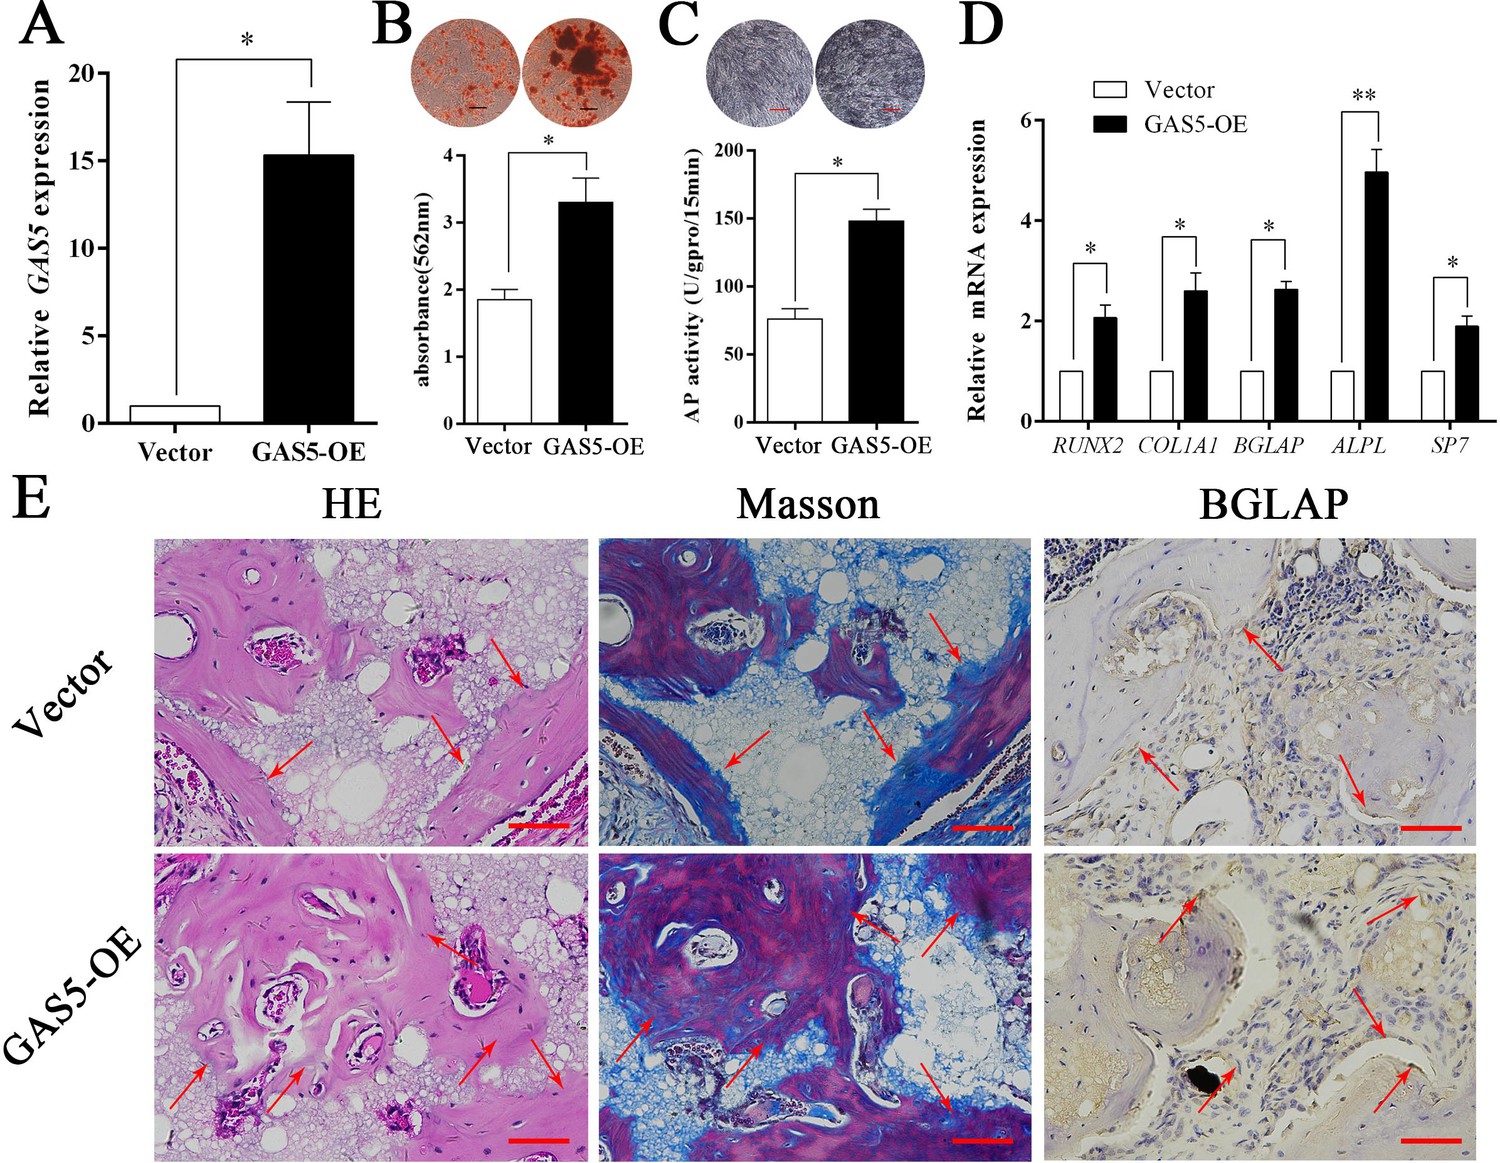
Increasing GAS5 in BMSCs promotes osteoblast differentiation in vitro and in vivo.
(A) Relative GAS5 expression in the overexpression and control groups. (B) ARS staining and quantification in the GAS5 overexpression or control group. Scale bar, 50 µm. (C) ALP staining and ALP tests in the GAS5 overexpression or control group. (D) Relative RUNX2, ALP, BGLAP, COL1A1, and SP7 expression in the GAS5 overexpression or control group. (E) H and E, Masson staining and BGLAP immunohistochemical staining of HA/TCP in the GAS5 overexpression or control group. The red arrow shows typical bone formation. Scale bar, 100 µm; n = 5. Each cellular experimental group was repeated at least three times.
Figure 3—figure supplement 1

Western blot analysis and quantification of osteogenesis markers.
(A) Western blot analysis and quantification of osteogenesis markers (COL1A1, RUNX2, BGLAP) in GAS5 knockdown or overexpression conditions. (B) Quantification of western blot of osteogenesis markers (COL1A1, RUNX2, BGLAP) in GAS5 knockdown or overexpression conditions.
Figure 3—figure supplement 2

The quantification of BGLAP immunohistochemical staining.
The quantification of BGLAP immunohistochemical staining of in vivo bone formation tests in GAS5 knockdown or overexpression treatment.
Figure 4 with 2 supplements
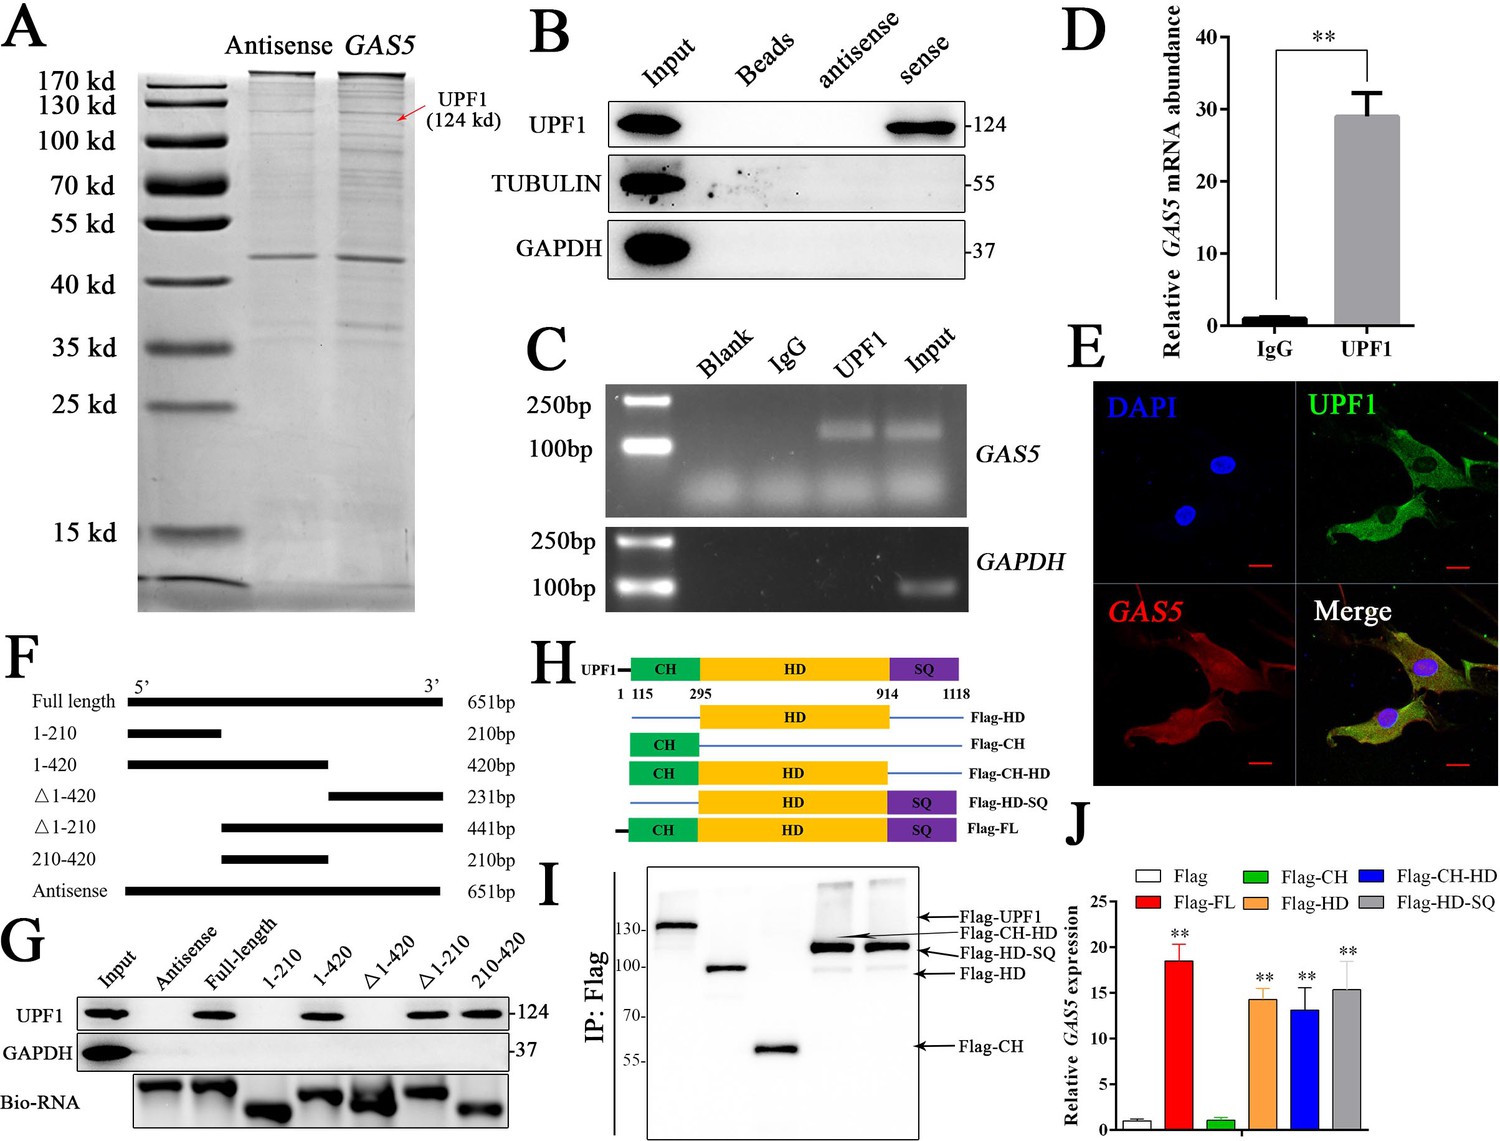
GAS5 functions by interacting with the UPF1 protein.
(A) Coomassie brilliant blue staining of RNA pull-down proteins in the GAS5 sense or antisense group. (B) The interaction between GAS5 and UPF1 was confirmed by Western blotting. (C, D) RIP assay analysis using the anti-UPF1 antibody revealed that GAS5 interacted with UPF1 in BMSCs, with GAPDH as a negative control. (E) GAS5 RNA FISH was performed in BMSCs and showed that GAS5 could partly colocalize with UPF1. Scale bar, 50 µm. (F) GAS5 truncation sequence diagram. (G) RNA pull-down assay with GAS5 truncation sequences and analyzed by Western blot. (H) UPF1 truncation diagram in a Flag tail. (I) Western blot analysis of the expression efficiency of UPF1 truncations. (J) RIP assay used UPF1 truncations and was analyzed by qRT-PCR. Each cellular experimental group was repeated at least three times.
Figure 4—figure supplement 1
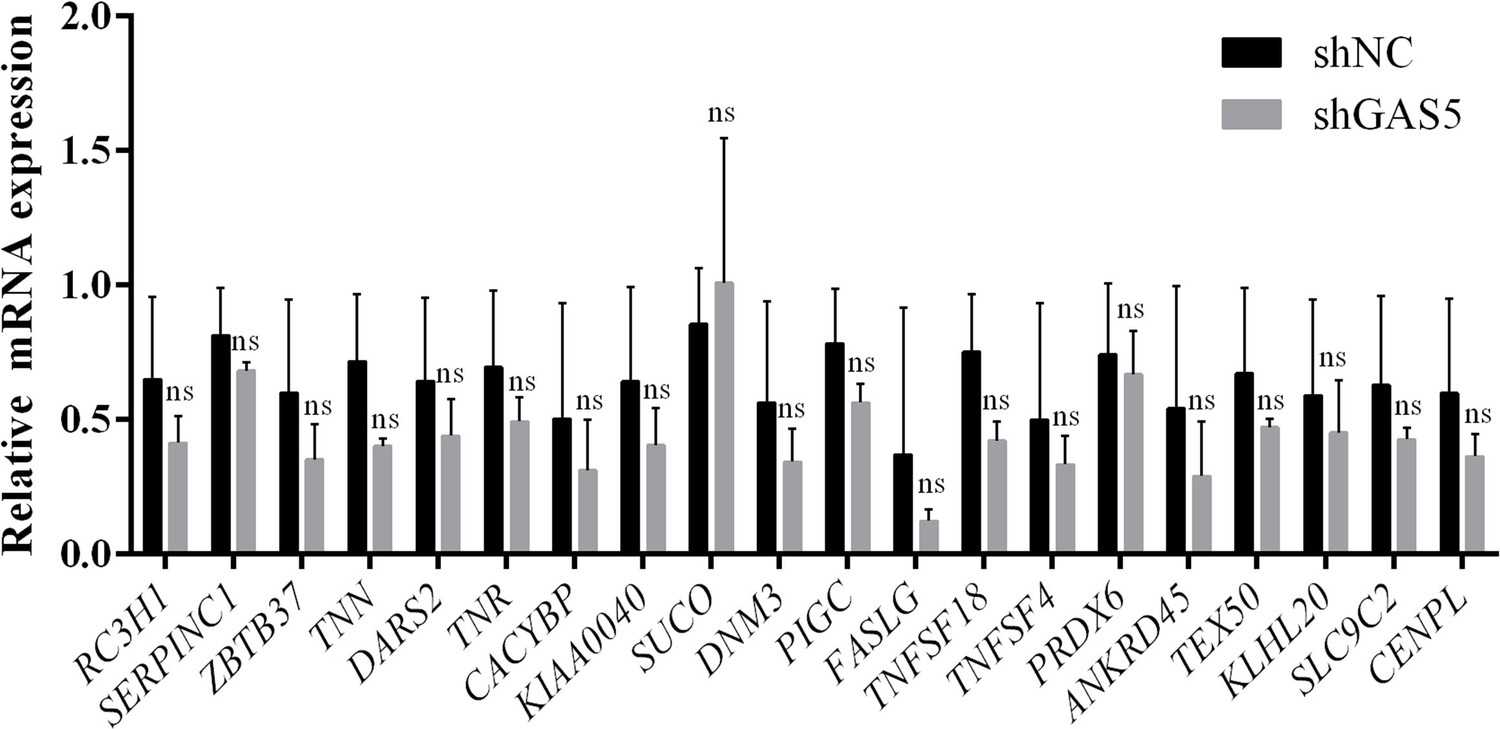
QRT-PCR analysis of the GAS5 adjacent genes in GAS5 knockdown conditions.
ZBTB37 (zinc finger and BTB domain containing 37), RC3H1 (ring finger and CCCH-type domains 1), SERPINC1 (serpin family C member 1), ZBTB37 (zinc finger and BTB domain containing 37), TNN (tenascin N), DARS2 (aspartyl-tRNA synthetase 2, mitochondrial), TNR (tenascin R), CACYBP (calcyclin-binding protein), KIAA0040 (KIAA0040), SUCO (SUN domain containing ossification factor), DNM3 (dynamin 3), PIGC (phosphatidylinositol glycan anchor biosynthesis class C), FASLG (Fas ligand), TNFSF18 (TNF superfamily member 18), TNFSF4 (TNF superfamily member 4), PRDX6 (peroxiredoxin 6), ANKRD45 (ankyrin repeat domain 45), TEX50 (testis expressed 50), KLHL20 (kelch like family member 20), SLC9C2 (solute carrier family nine member C2 (putative)), CENPL (centromere protein L).
Figure 4—figure supplement 2
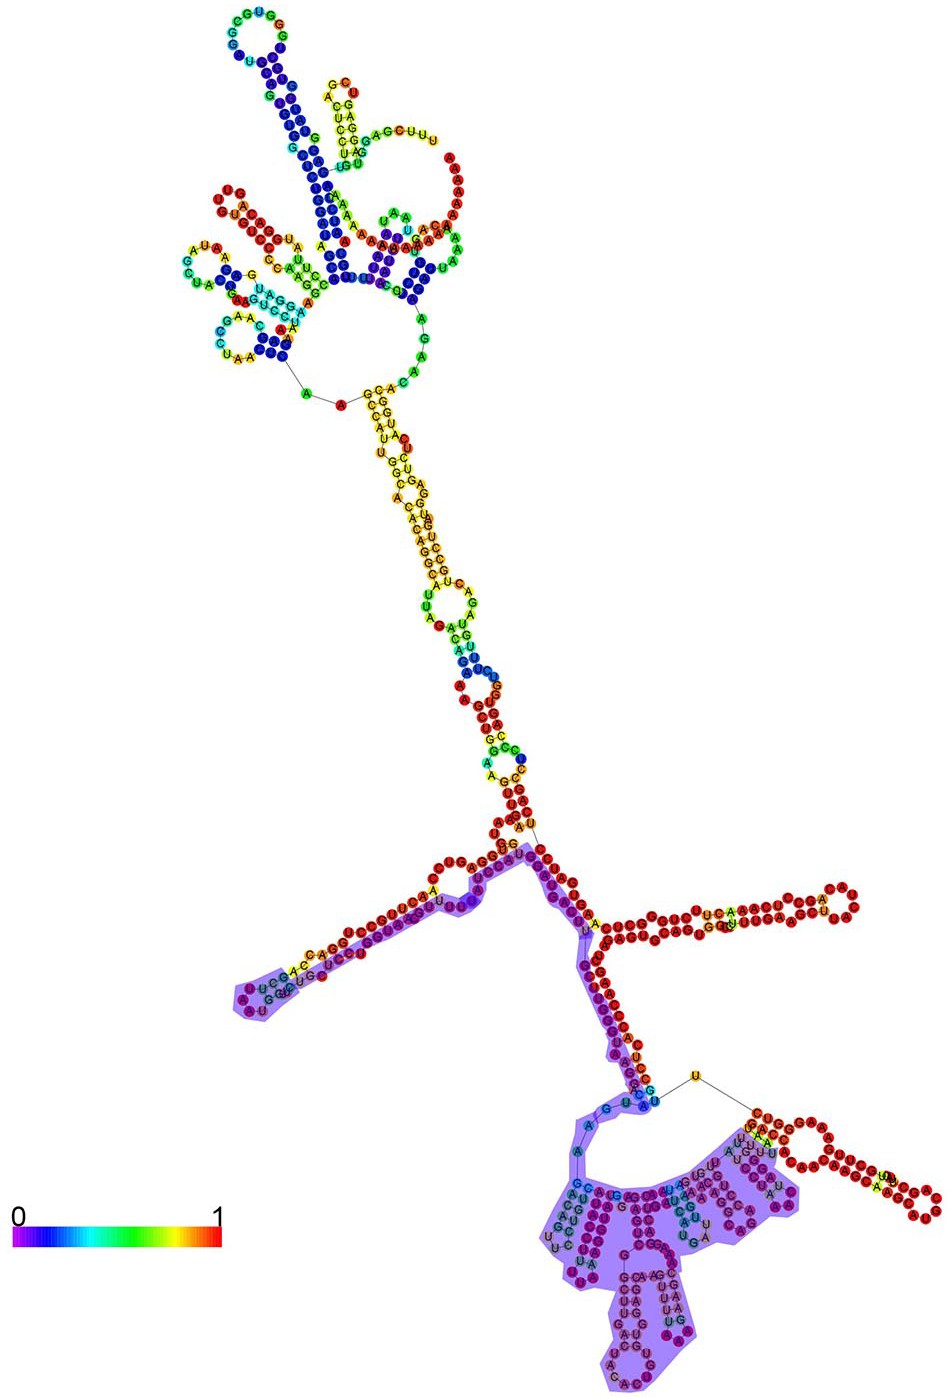
RNA fold model of GAS5.
The model was predicted on the RNAfold web server website (http://rna.tbi.univie.ac.at//cgi-bin/RNAWebSuite/RNAfold.cgi). The rainbow color means the base-pair probabilities of the predicted folded RNA. The area of GAS5 combined with UPF1 was painted with lavender.
Figure 5 with 2 supplements
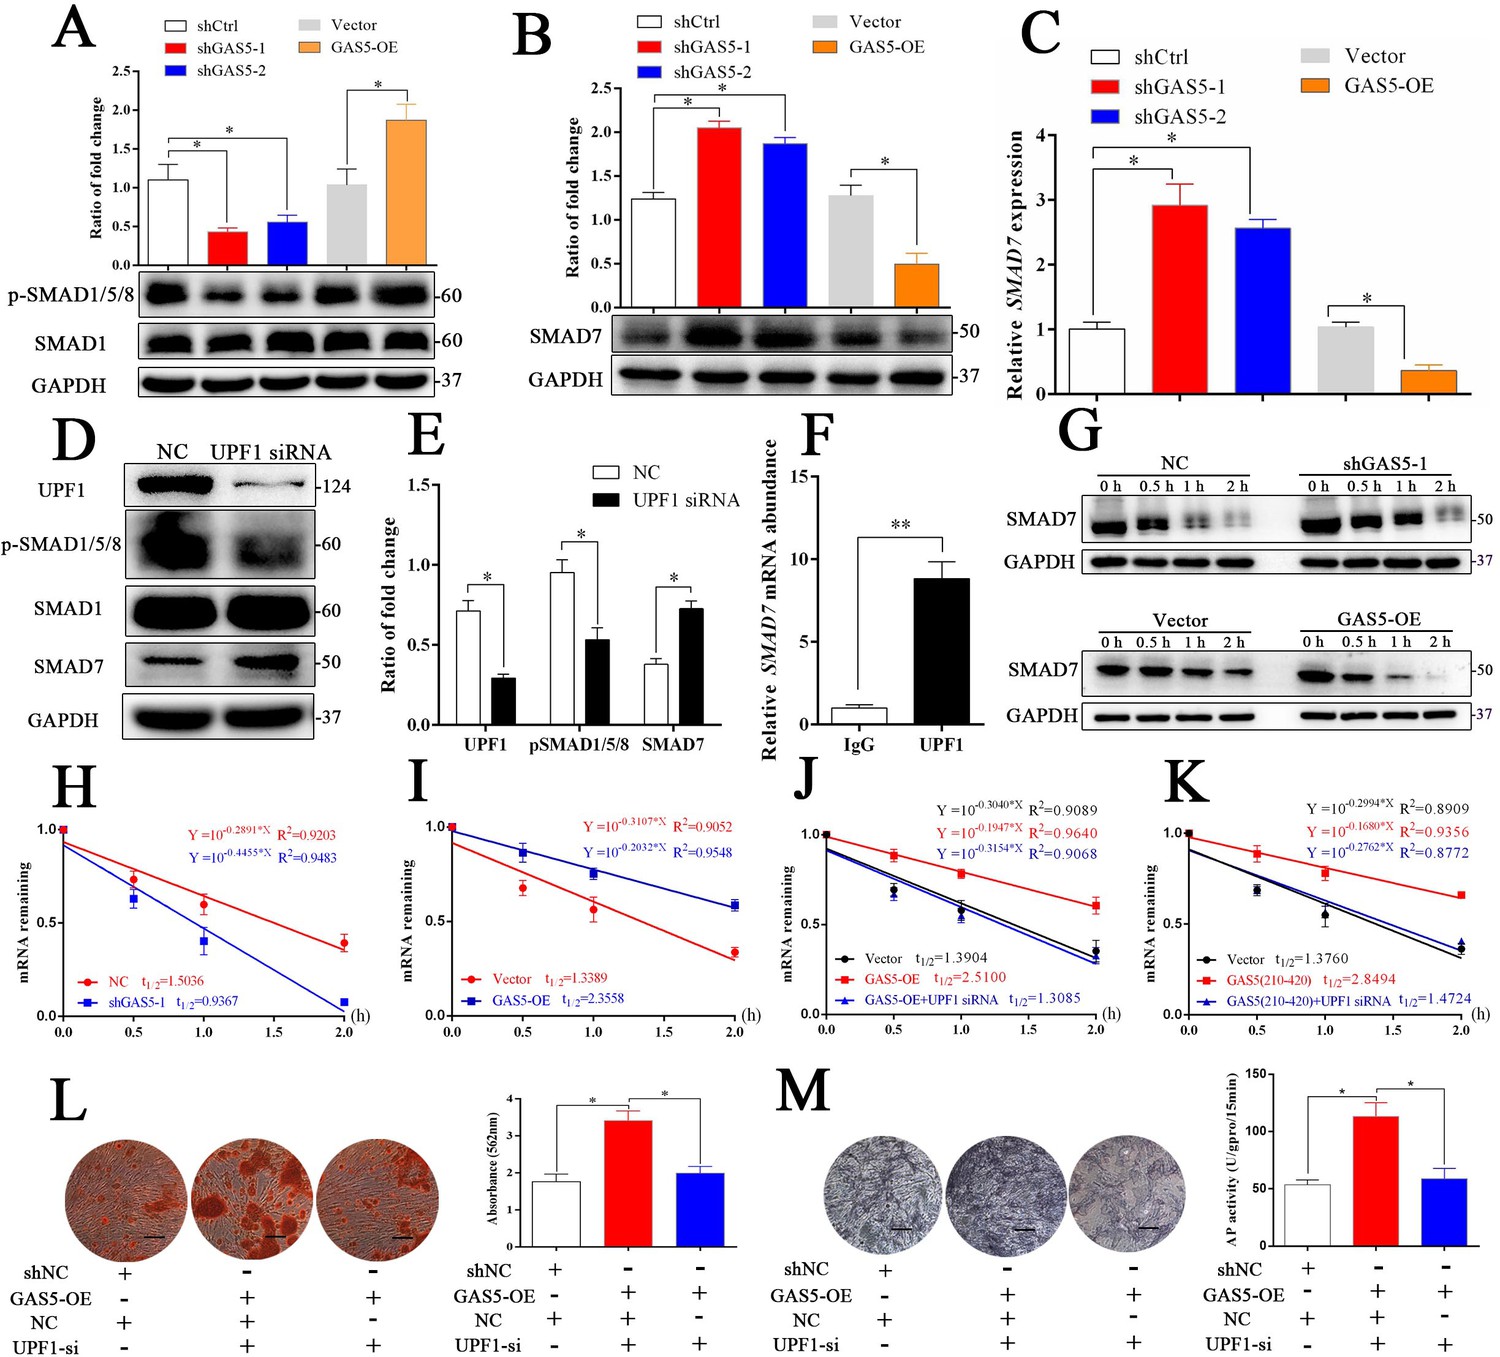
GAS5 interacts with UPF1 to accelerate SMAD7 decay.
(A) Western blot analysis of the activation pathway (pSMAD1/5/8, SMAD1) in GAS5 knockdown or overexpression conditions. (B) SMAD7 was regulated by GAS5 knockdown or overexpression by western blot. (C) Relative SMAD7 mRNA levels in GAS5 knockdown or overexpression cells tested by qRT-PCR. (D, E) Western blot analysis and quantification of pSMAD1/5/8/SMAD1 and SMAD7 in the UPF1 knockdown and control groups. (F) RIP assay with anti-UPF1 showed the binding of UPF1 and SMAD7 mRNA. (G) Western blot analysis in the GAS5 knockdown, overexpression and control groups after actinomycin D treatment. NC means the negative control siRNA transfected group. It was also be treated by Actinomycin D but as the control of GAS5 shRNA-1. (H) Relative SMAD7 mRNA expression in the GAS5 knockdown and control groups by actinomycin D treatment tested by qRT-PCR. (I) Relative SMAD7 mRNA expression in the GAS5 overexpression and control groups by actinomycin D treatment tested by qRT-PCR. (J, K) Relative SMAD7 mRNA expression by actinomycin D treatment under the condition of UPF1 siRNA, overexpression of a truncated form of GAS5 or GAS5 full-length. (L) ARS staining and quantification in the GAS5 overexpression and UPF1 siRNA groups. Scale bar, 500 µm. (M) ALP staining and ALP tests in the GAS5 overexpression and UPF1 siRNA groups. Scale bar, 500 µm. Each cellular experimental group was repeated at least three times.
Figure 5—figure supplement 1
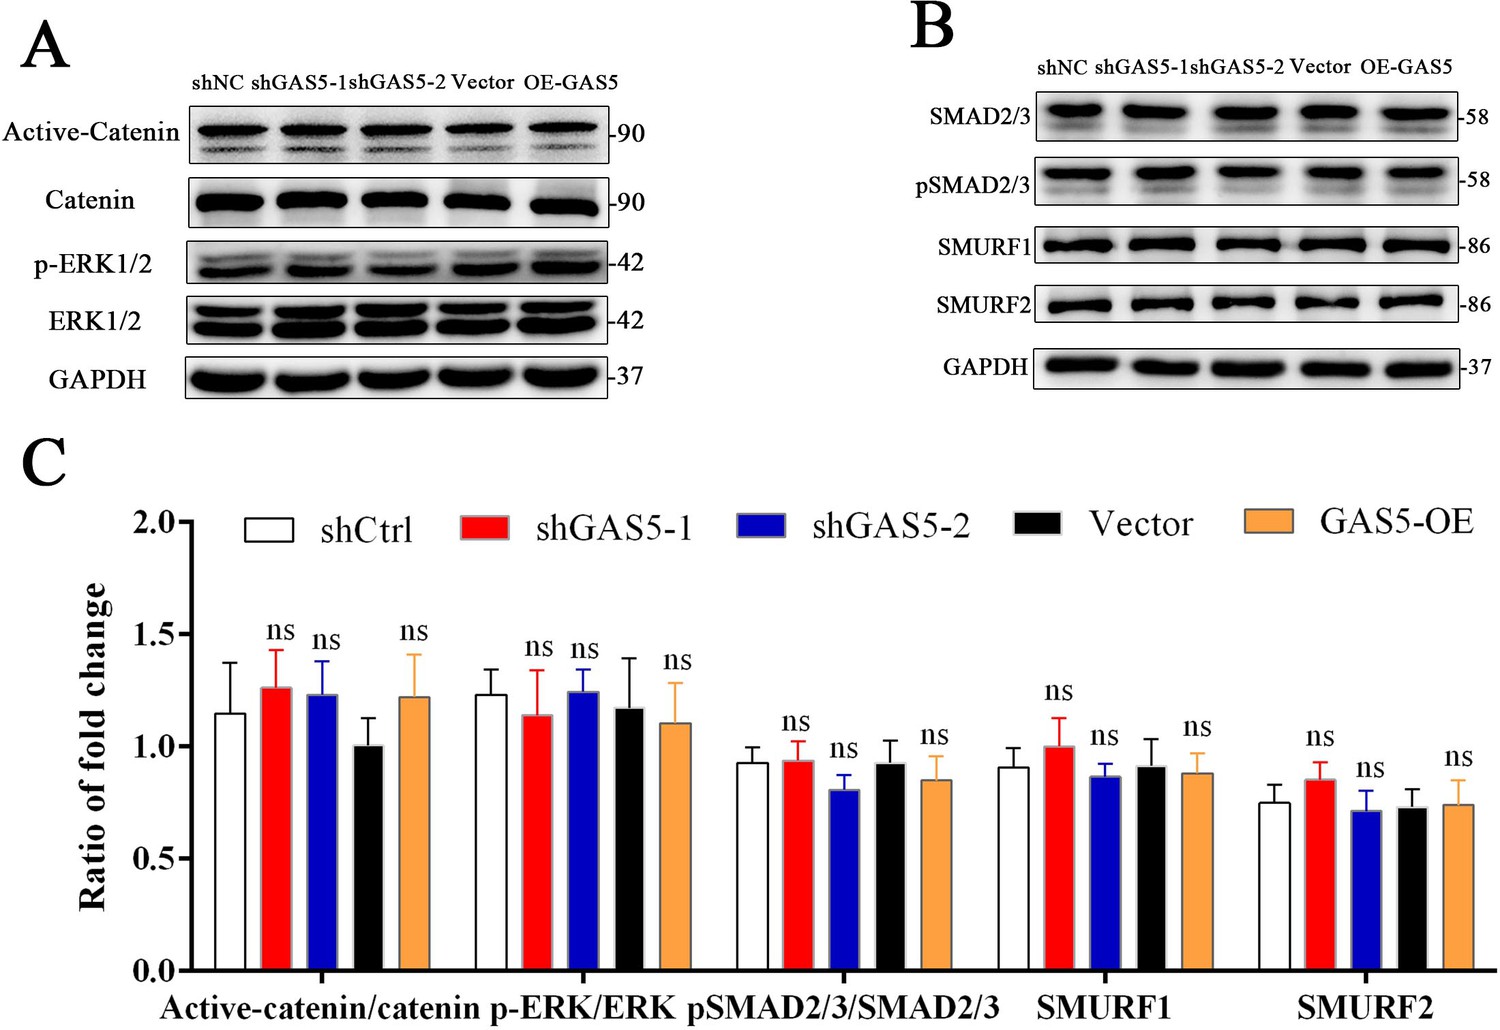
Western blot analysis of the pathway.
(A, B) Western blot analysis and quantification of the pathway (catenin, ERK, SMAD2/3, SMURF1, SMURF2) in GAS5 knockdown or overexpression conditions. (C) Quantification for western blot analysis of β-catenin, ERK, SMAD2/3, SMURF1, and SMURF2.
Figure 5—figure supplement 2
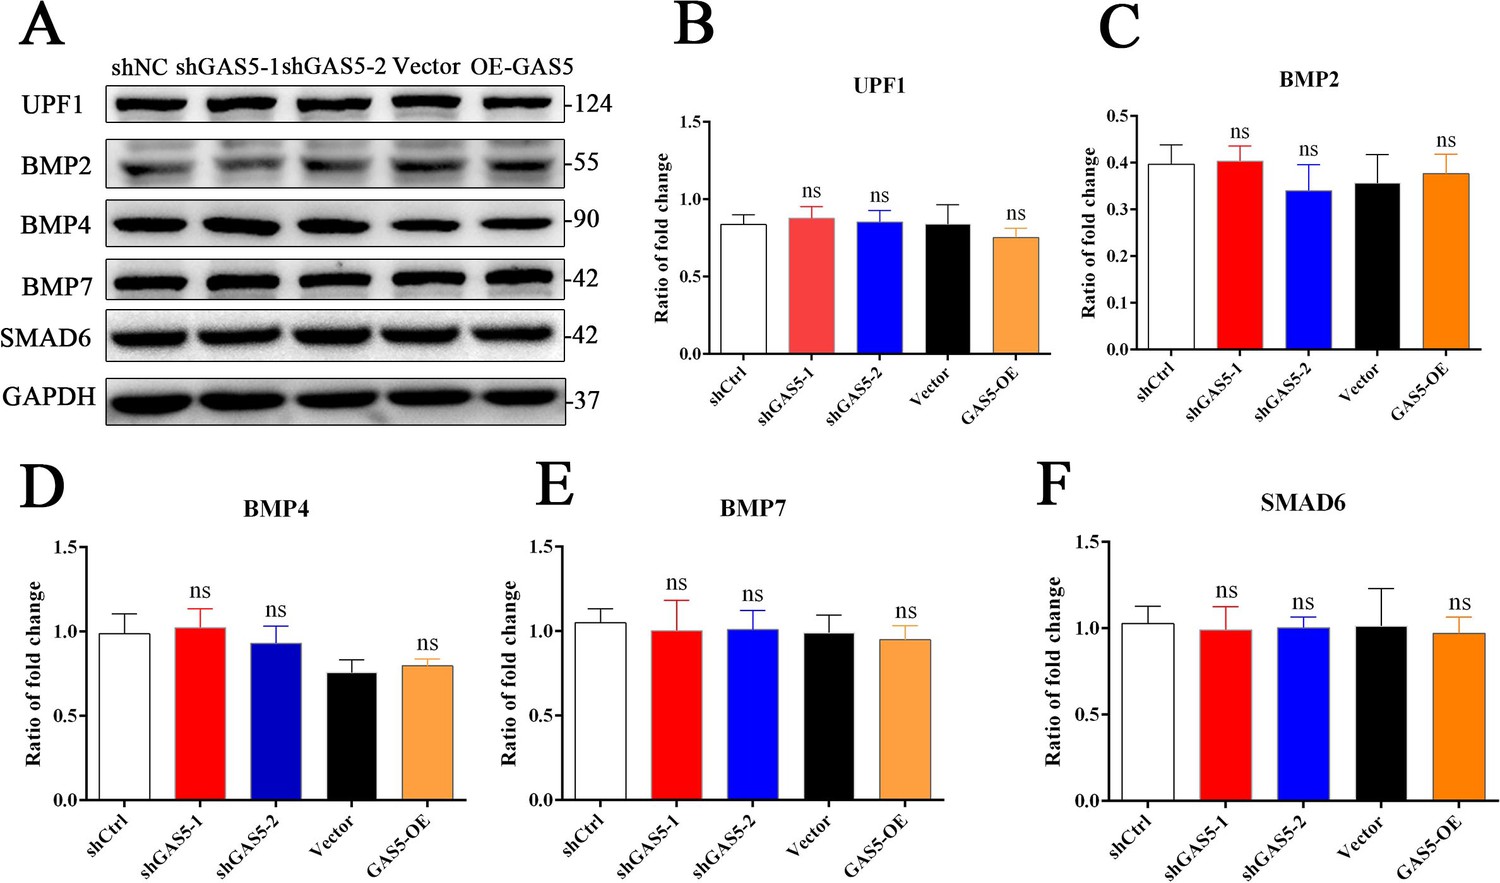
Western blot analysis of the molecular in BMP pathway.
(A, B, C, D, E, F) Western blot analysis and quantification of BMP2, BMP4, BMP7, and SMAD6 in GAS5 knockdown or overexpression conditions.
Figure 6 with 3 supplements
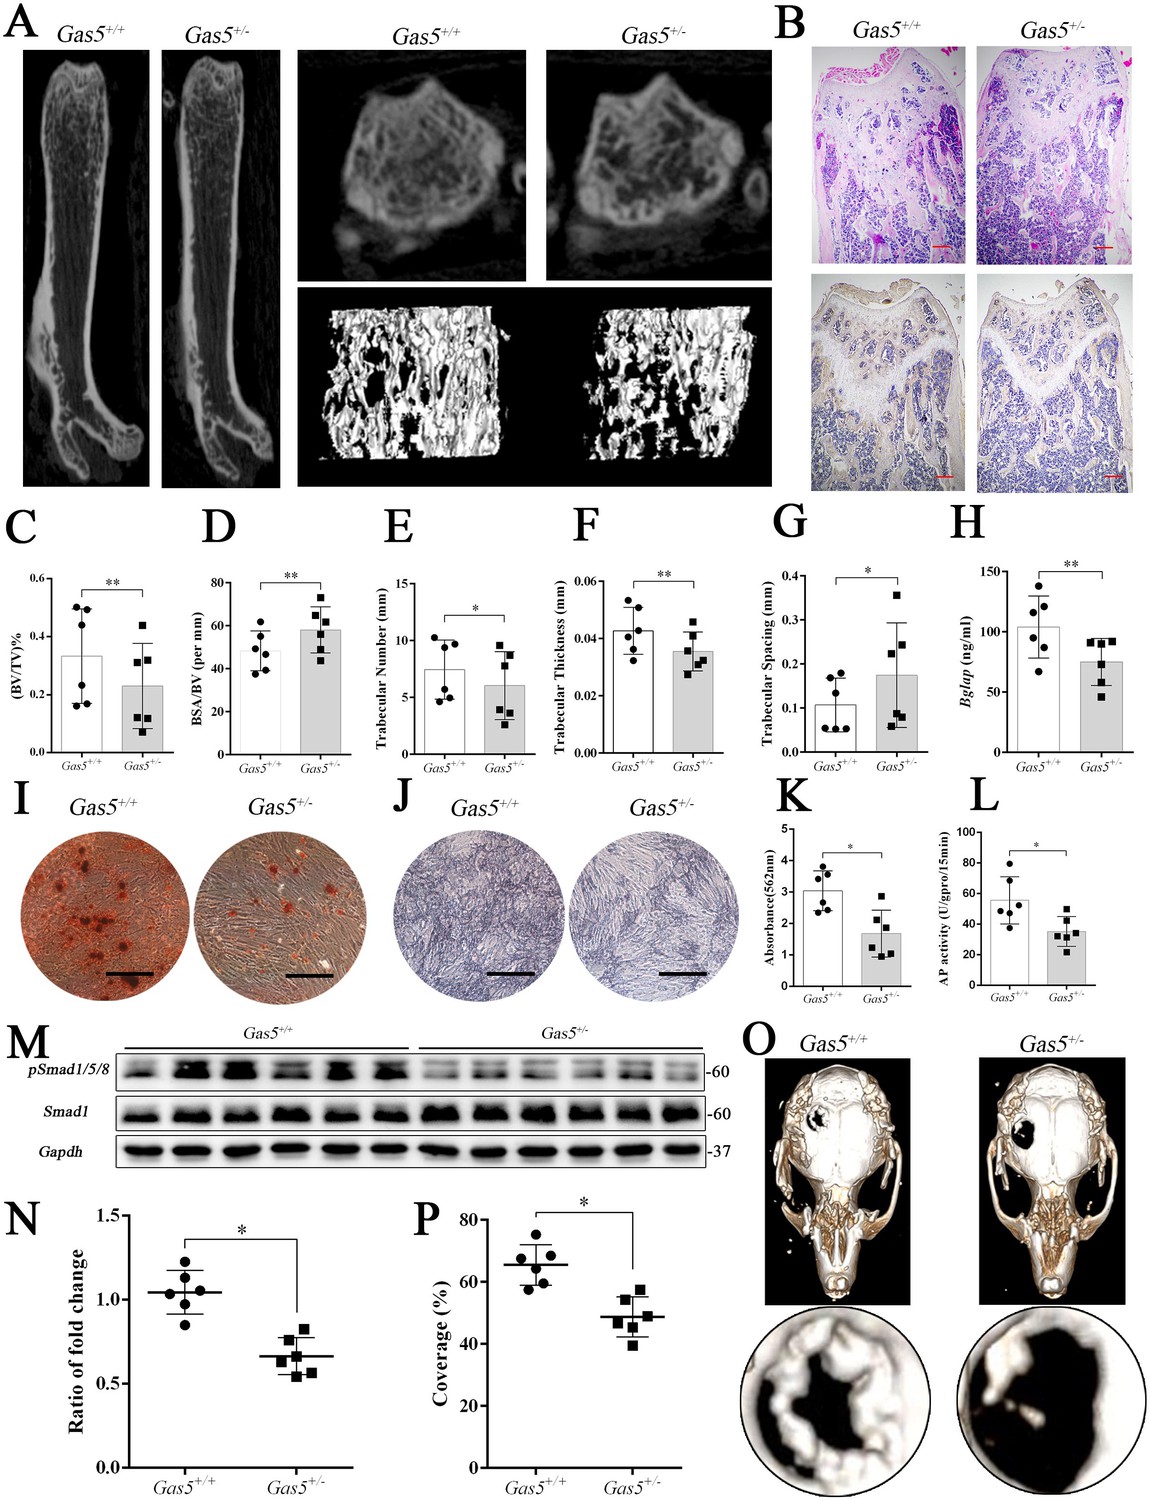
Gas5 heterozygous mice exhibit an osteoporotic phenotype and impaired bone repair capacity.
(A) Representative micro-CT analysis of the three-dimensional reconstruction graph for Gas5+/- (n = 6) and WT mice (n = 6). (B) Representative H and E staining (upper) and Bglap immunohistochemical staining (down) of the terminal femur of Gas5+/- (n = 6) and WT mice (n = 6). Scale bar, 500 µm. (C, D, E, F, G) BV/TV, BA/BV, trabecular thickness, trabecular number and trabecular spacing analysis of Gas5+/- (n = 6) and WT mice (n = 6). (H) Serum Bglap detection by ELISA in Gas5+/- (n = 6) and WT mice (n = 6). (I, K) ARS staining ARS and quantification of MSCs from Gas5+/- (n = 6) and WT mice (n = 6) Scale bar, 500 µm. (J) ALP staining of MSCs from Gas5+/- (n = 6) and WT mice (n = 6). (L) ALP tests of MSCs from Gas5+/- (n = 6) and WT mice (n = 6). Scale bar, 500 µm. (M, N) Western blot analysis for pSmad1/5/8/Smad1 in protein isolated from tibia of Gas5+/- (n = 6) and WT mice (n = 6). (O) Micro-CT three-dimensional images of cranial defects in Gas5+/- (n = 6) and WT mice (n = 6). (P) Bone recovery area analysis in Gas5+/- (n = 6) and WT mice (n = 6). Each cellular experimental group was repeated at least three times.
Figure 6—figure supplement 1
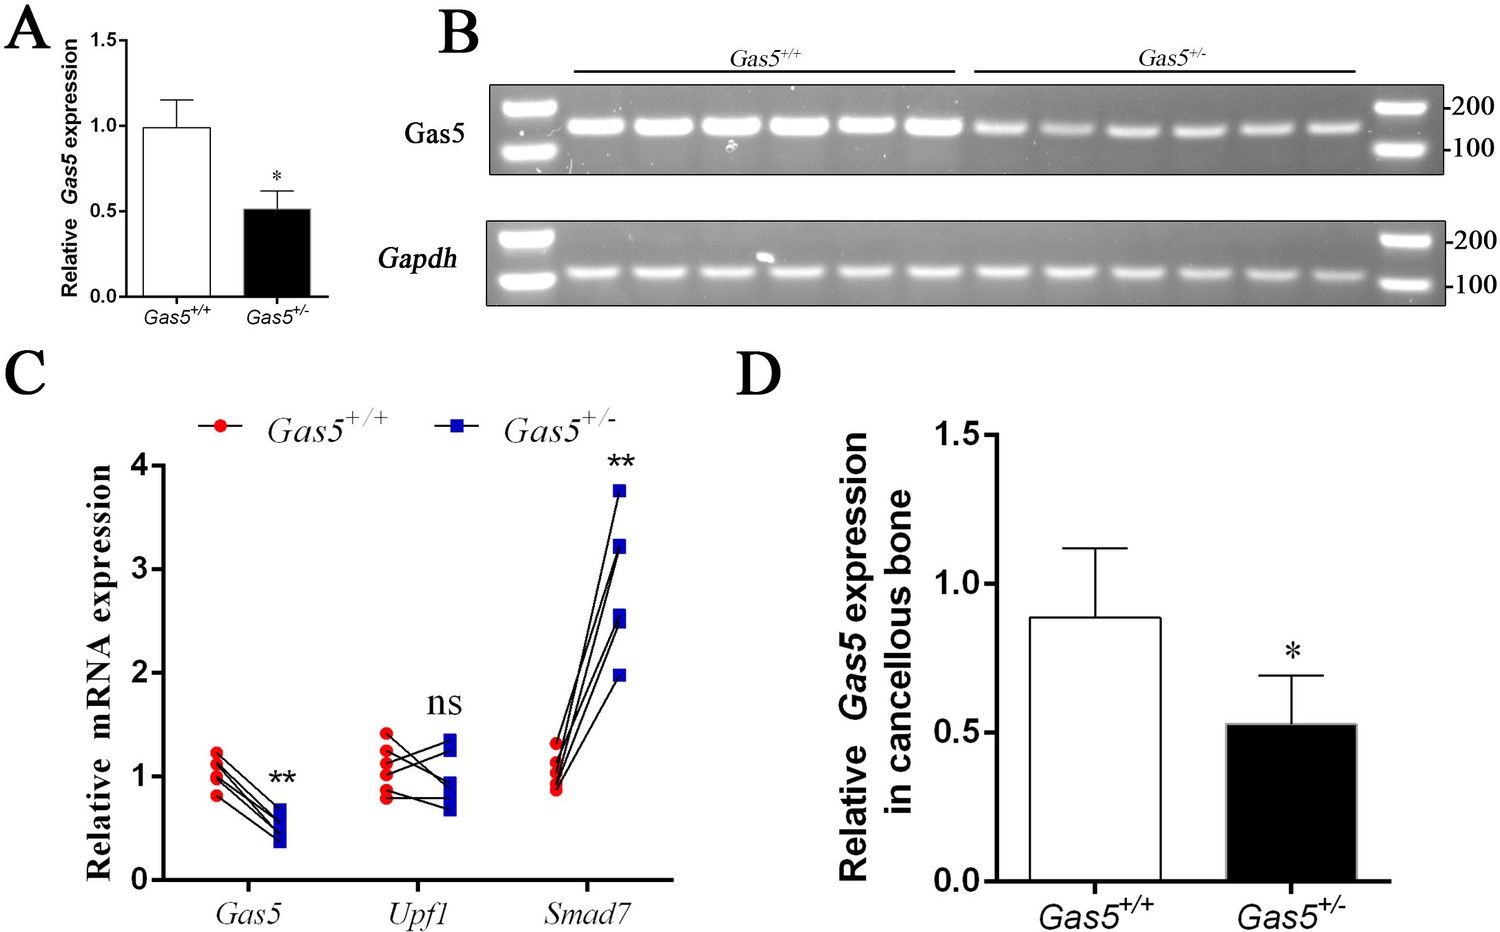
Relative gene expression in mouse.
(A, B) Relative Gas5 expression in the tails of Gas5+/+ (n = 6) and Gas5+/- (n = 6) mice analyzed by qRT-PCR and agarose gel electrophoresis. (C) Relative mRNA expression of Gas5, Upf1 and Smad7 in BMSC of Gas5+/- and WT mice (n = 6). (D) The mRNA level of Gas5 in cancellous bone of Gas5+/-mice and WT mice.
Figure 6—figure supplement 2
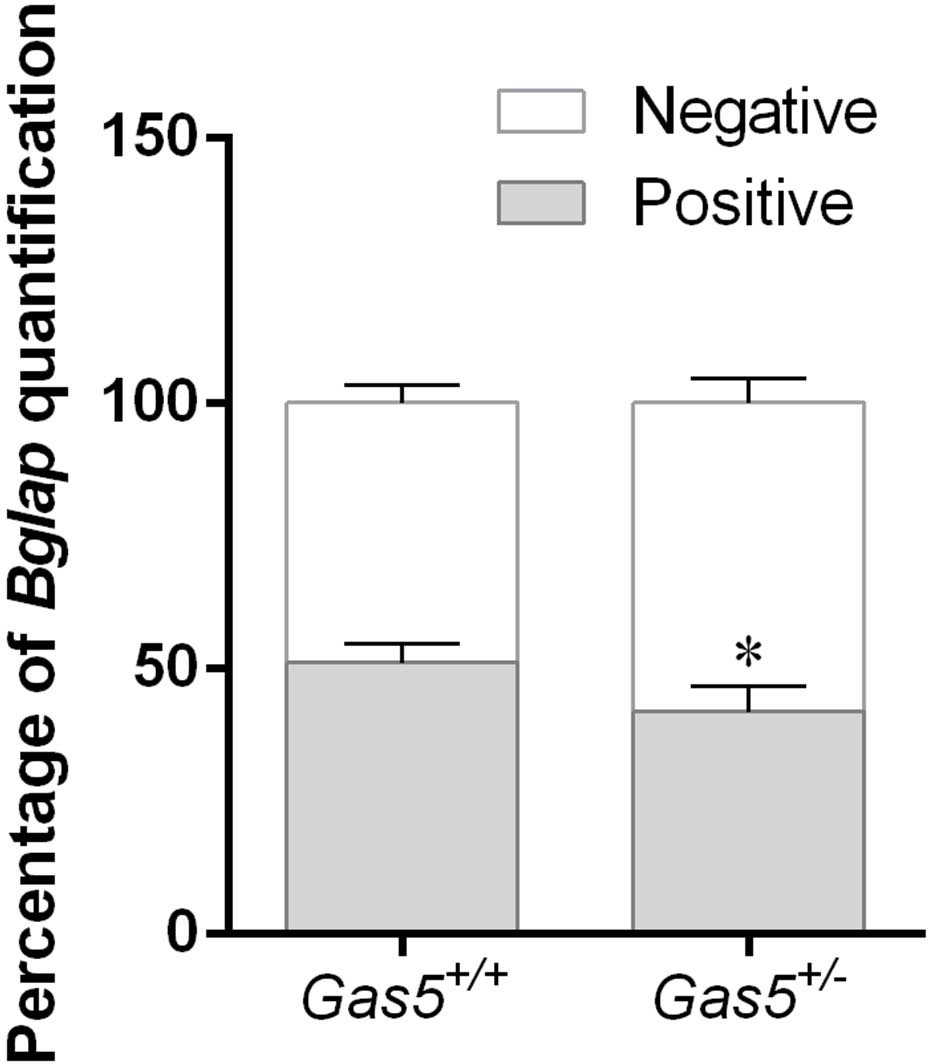
The quantification of Bglap immunohistochemical staining.
The quantification of Bglap immunohistochemical staining of Gas5+/-mice and WT mice.
Figure 6—figure supplement 3
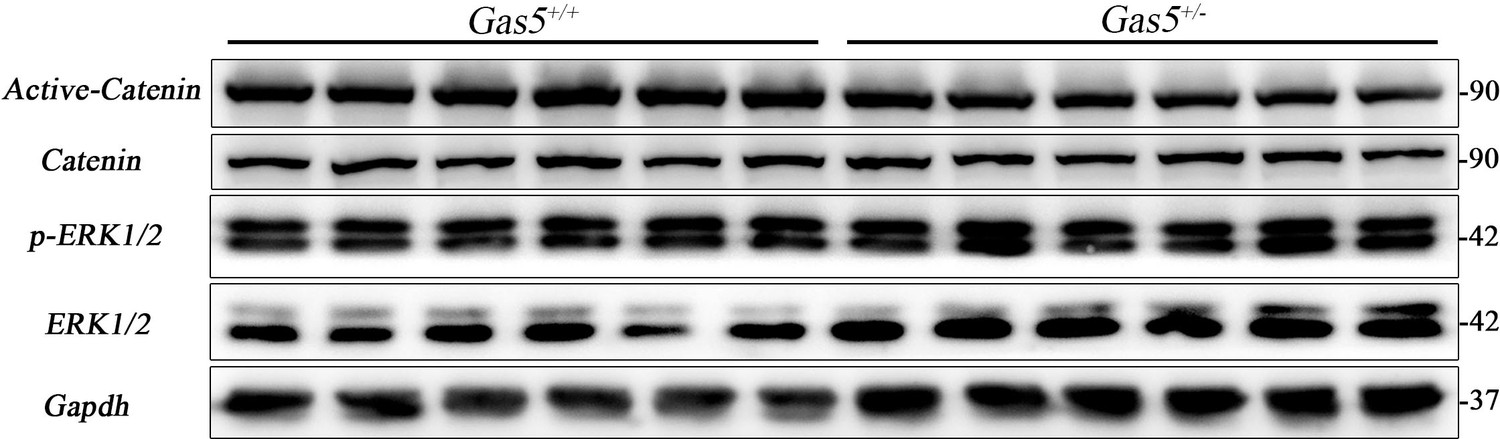
Western blot analysis of the pathway.
Western blot analysis of the pathway (β-catenin, ERK) in the protein from the tibia of Gas5+/+ (n = 6) and Gas5+/- mice (n = 6).
Figure 7 with 1 supplement
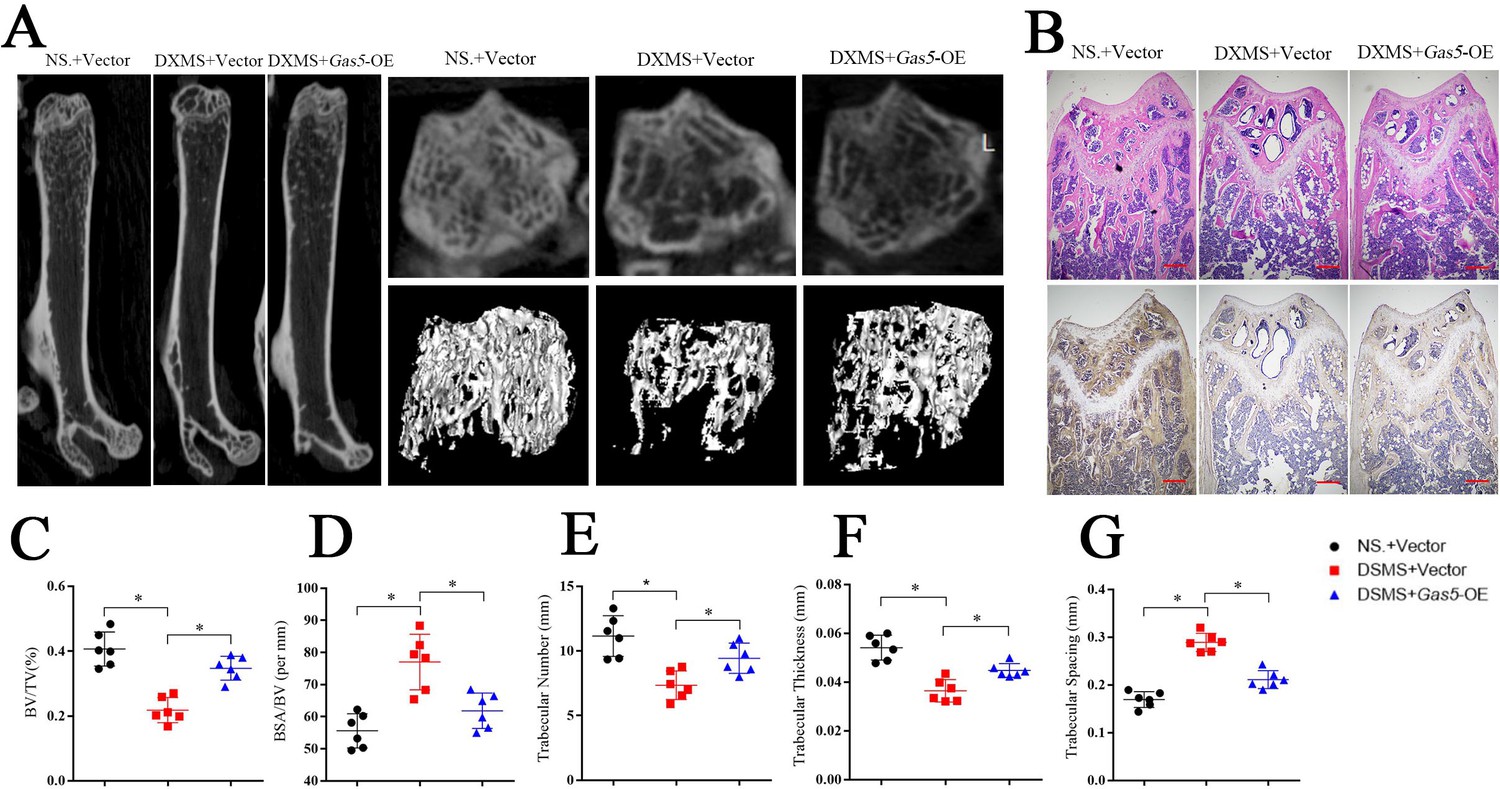
Systemic transfection (tail vein injection) of Gas5-overexpressing adenoviruses alleviated bone loss in osteoporosis.
(A) Micro-CT analysis of the control mice (n = 6), osteoporosis mouse model (n = 6) or Gas5-overexpressing adenovirus-treated mice (n = 6). (B) H and E staining and Bglap immunohistochemical staining of the terminal femur of the control mice (n = 6), osteoporosis mouse model (n = 6) or Gas5-overexpressing adenovirus-treated mice (n = 6). Scale bar, 500 µm. (C, D, E, F, G) BV/TV, BA/BV, trabecular thickness, trabecular number, and trabecular spacing analysis for the control mice (n = 6), osteoporosis mouse model (n = 6) or Gas5-overexpressing adenovirus-treated group (n = 6). DXMS: dexamethasone.
Figure 7—figure supplement 1
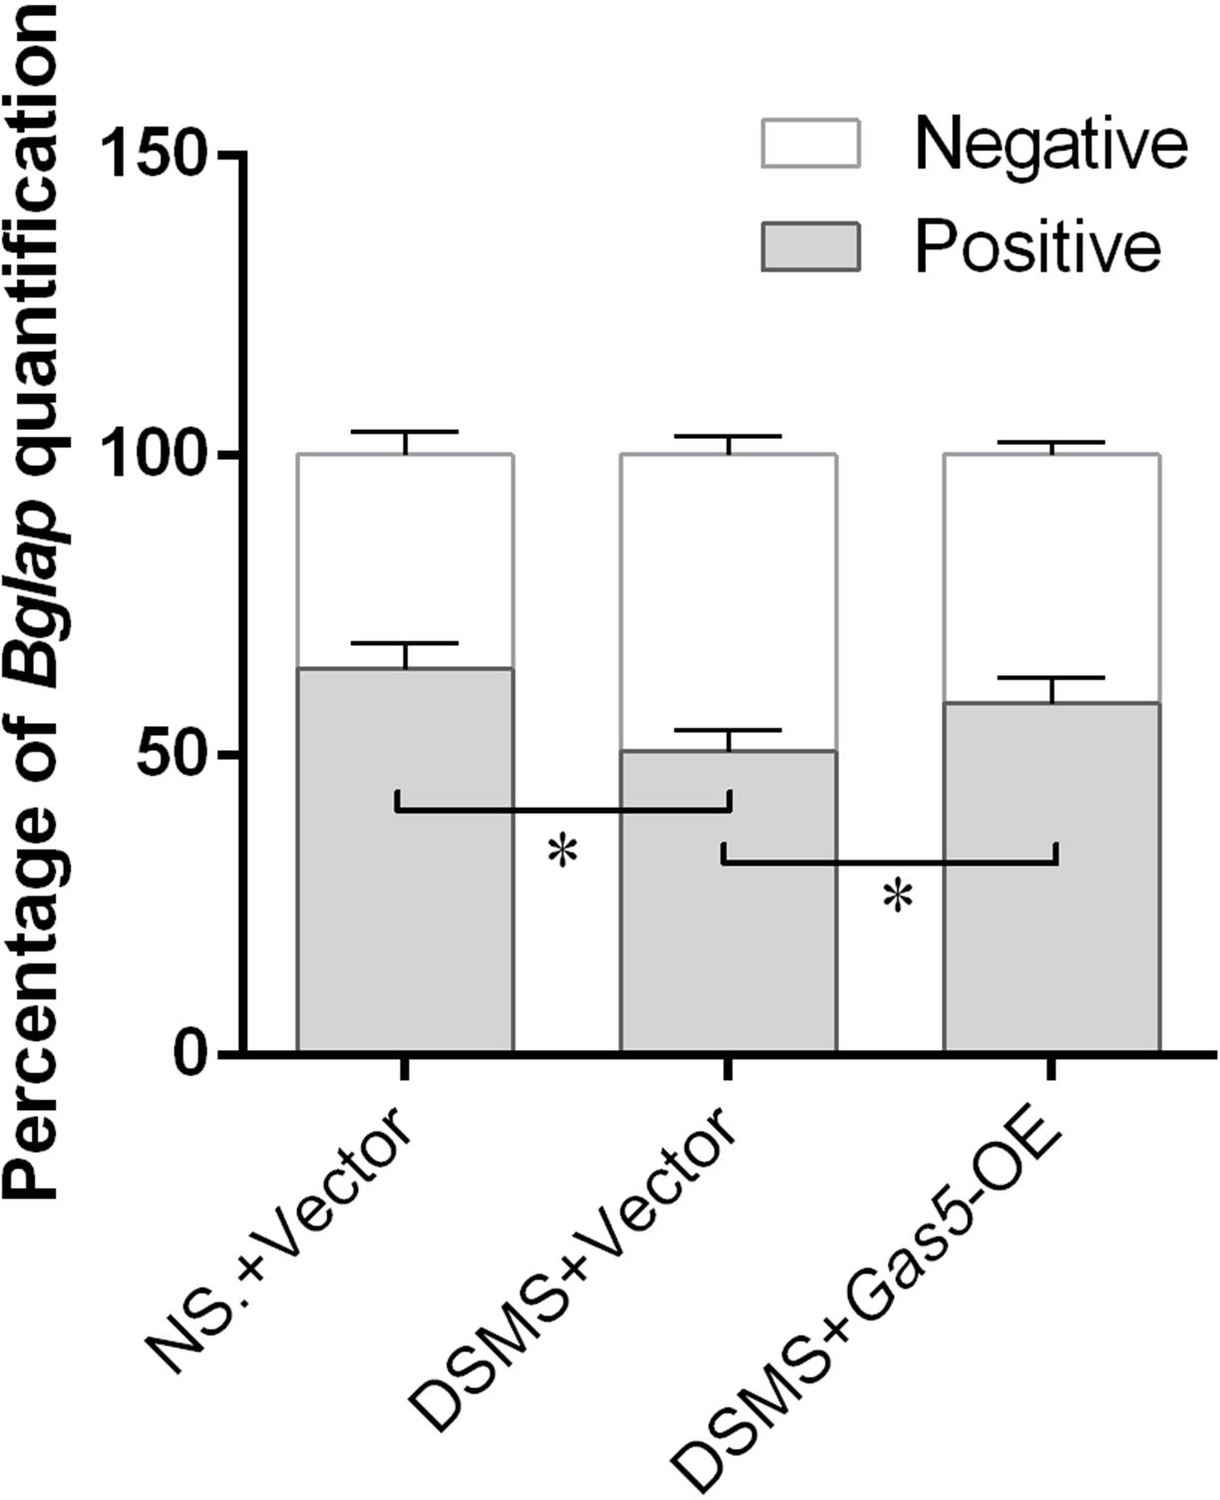
The quantification of Bglap immunohistochemical staining.
The quantification of Bglap immunohistochemical staining of the control mice (n = 6), osteoporosis mouse model (n = 6) or Gas5-overexpressing adenovirus-treated mice.
Author response image 1
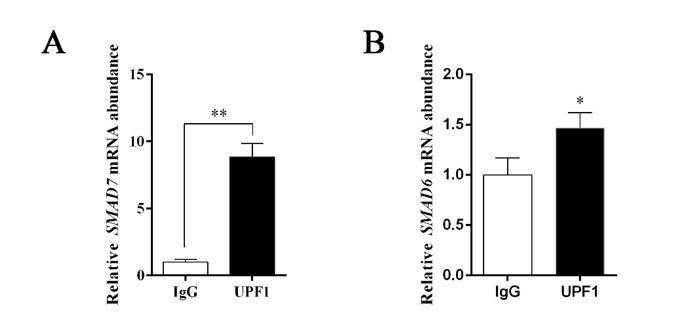
(A)The SMAD7 mRNA abundance by RIP assay with anti-UPF1 antibody; (B) the SMAD6 mRNA abundance by RIP assay with anti-UPF1 antibody.
Author response image 2
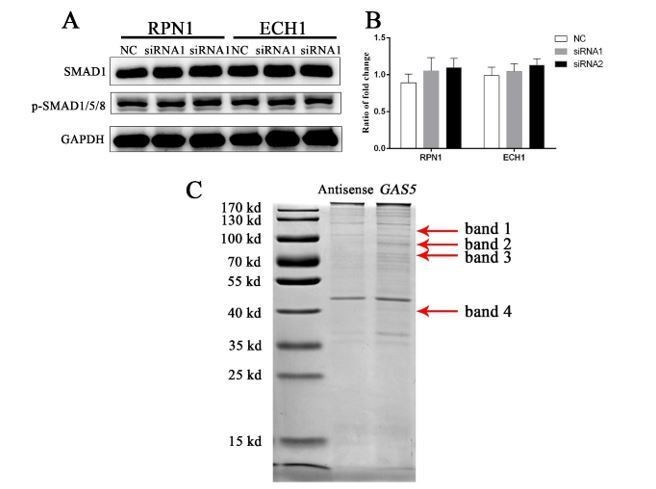
Functional verification of 2 genes and 4 bands in the MMS.
A) SMAD1/5/8 pathway changes after siRNA knockdown of the two selected proteins. B) Quantification of western blot for two proteins. C) The bands which selected for the mass spectrum (red arrow). RPN1: ribophorin I. ECH1: enoyl-CoA hydratase 1.
Additional files
-
Supplementary file 1
Primers of the analyzed genes.
- https://cdn.elifesciences.org/articles/59079/elife-59079-supp1-v2.docx
-
Supplementary file 2
The siRNA sequences of the analyzed genes.
- https://cdn.elifesciences.org/articles/59079/elife-59079-supp2-v2.docx
-
Supplementary file 3
Characteristics of the study subjects.
- https://cdn.elifesciences.org/articles/59079/elife-59079-supp3-v2.docx
-
Supplementary file 4
Characteristics of the 15 healthy donors from Center for Biotherapy, Sun Yat-sen Memorial Hospital.
- https://cdn.elifesciences.org/articles/59079/elife-59079-supp4-v2.docx
-
Supplementary file 5
Data of mass spectrometry.
- https://cdn.elifesciences.org/articles/59079/elife-59079-supp5-v2.xlsx
-
Transparent reporting form
- https://cdn.elifesciences.org/articles/59079/elife-59079-transrepform-v2.pdf
Download links
A two-part list of links to download the article, or parts of the article, in various formats.
Downloads (link to download the article as PDF)
Open citations (links to open the citations from this article in various online reference manager services)
Cite this article (links to download the citations from this article in formats compatible with various reference manager tools)
GAS5 protects against osteoporosis by targeting UPF1/SMAD7 axis in osteoblast differentiation
eLife 9:e59079.
https://doi.org/10.7554/eLife.59079


