Pituitary stem cells produce paracrine WNT signals to control the expansion of their descendant progenitor cells
- Centre for Craniofacial and Regenerative Biology, King’s College London, United Kingdom
- Skin Research Institute of Singapore, Agency for Science, Technology and Research, Singapore
- Lee Kong Chian School of Medicine, Nanyang Technological University, Singapore
- Department of Medicine III, University Hospital Carl Gustav Carus, Technische Universität Dresden, Germany
- Institute of Functional Genomics (IGF), University of Montpellier, CNRS, France
- Howard Hughes Medical Institute, Stanford University School of Medicine, Department of Developmental Biology, Stanford University School of Medicine, United States
- Department of Medicine and Liver Center, University of California San Francisco, United States
- Developmental Biology and Cancer, Birth Defects Research Centre, UCL GOS Institute of Child Health, United Kingdom
- Université Côte d'Azur, Inserm, CNRS, France
Figures
Figure 1 with 2 supplements
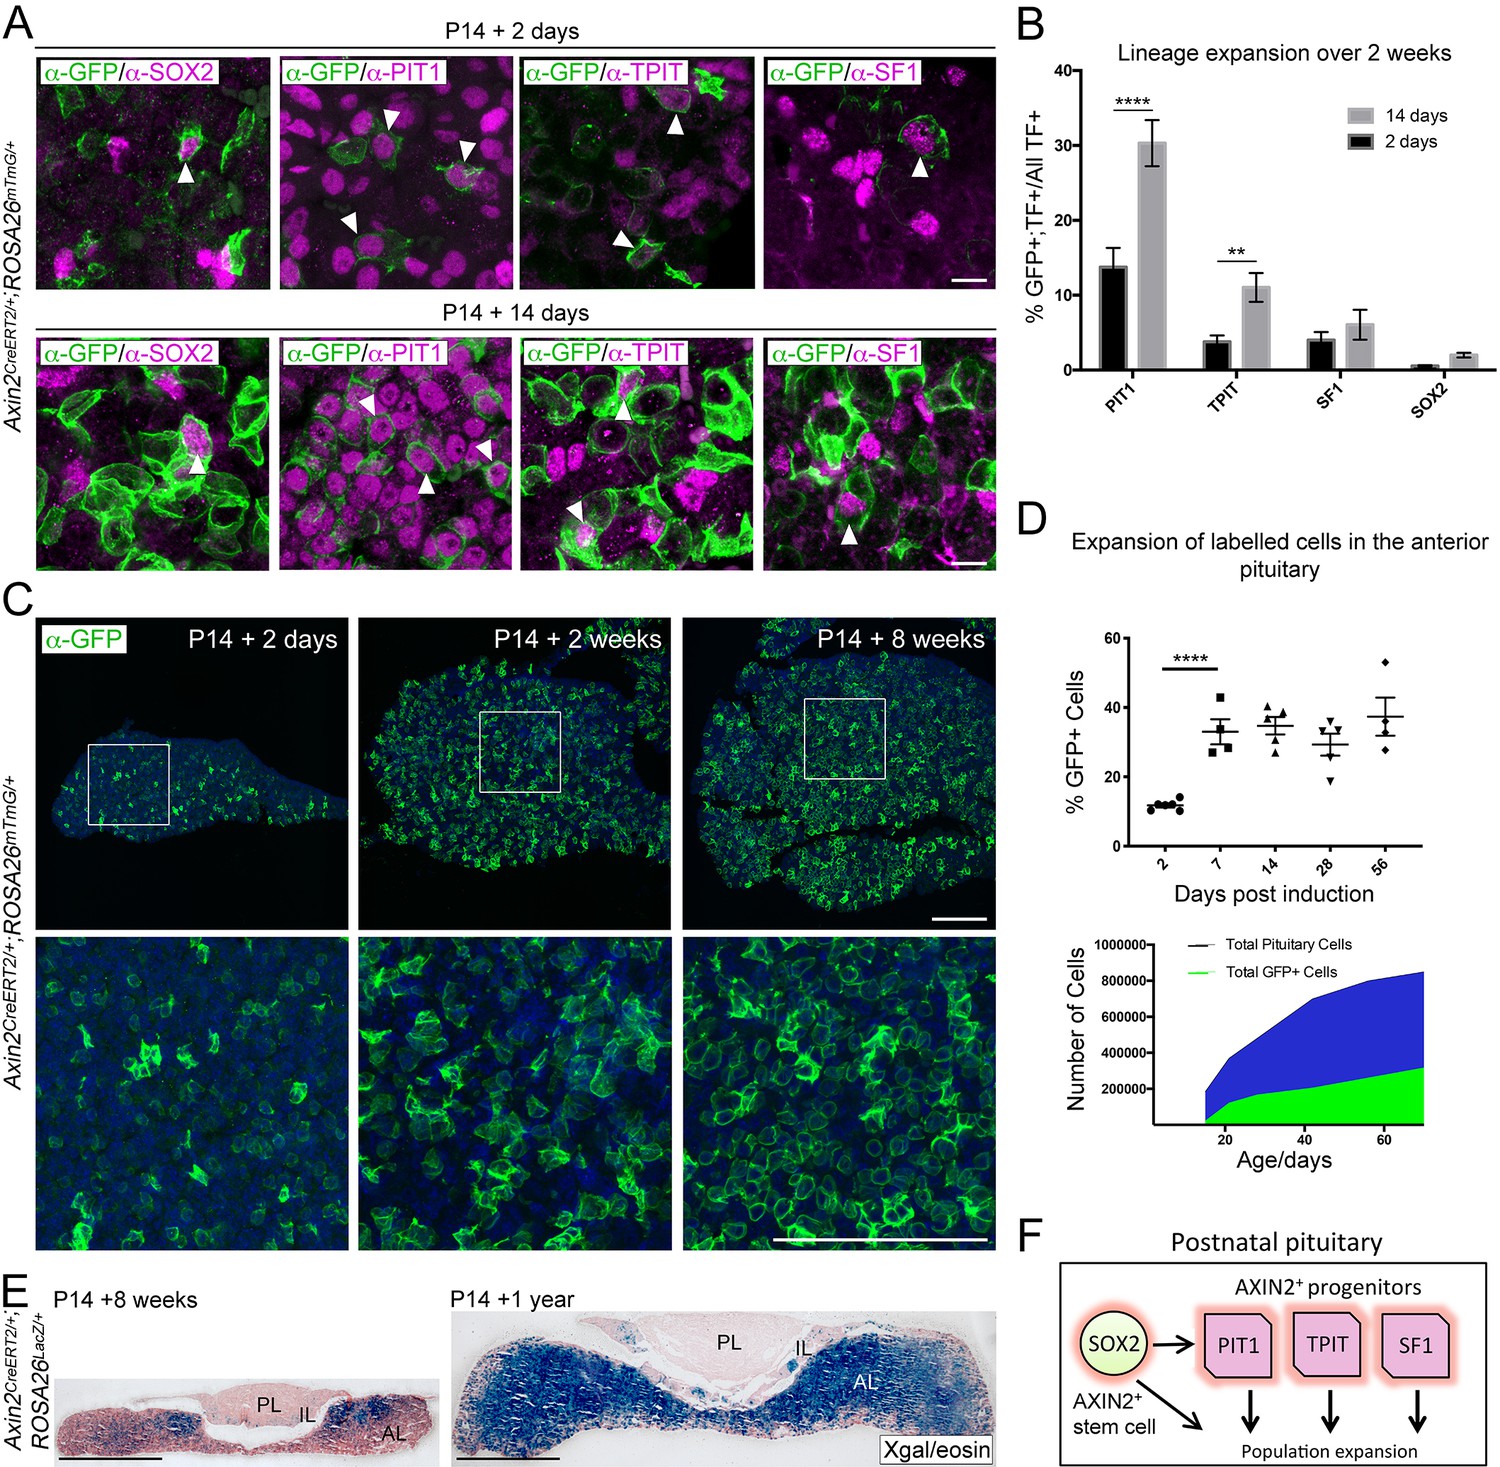
Axin2 expressing cells contribute to pituitary growth and expansion of all lineages.
(A) Immunofluorescence staining against GFP (green) with markers of pituitary stem cells (PSCs) or lineage commitment (magenta) in Axin2CreERT2/+; ROSA26mTmG/+ pituitaries harvested from mice induced at P14 and lineage traced for 2 days (top panel) and 14 days (bottom panel). Scale bar: 10 μm. (B) Quantification of lineage expansion between 2 and 14 days following induction at P14. Graph shows that the proportion of lineage committed cells (either PIT1+, TPIT+, or SF1+) and PSCs (SOX2+), that is, that are transcription factor (TF)+ cells that are GFP+ increases between 2 days (black bars) and 14 days (grey bars) post-induction. PIT1 p=0.000004, TPIT p=0.008 multiple t-tests. n = 4 animals per time point. (C) Immunofluorescence staining against GFP (green) in pituitaries harvested from Axin2CreERT2/+;ROSA26mTmG/+ mice induced at P14 and lineage traced for 2 days, 2 weeks, and 8 weeks. Bottom panel shows magnified fields of view of regions of interest indicated by white boxes in panels above. Scale bars: 50 μm. (D) Top panel showing the quantification of the proportion of all cells in Axin2CreERT2/+;ROSA26mTmG/+ pituitaries that are GFP+ at 2, 7, 14, 28, and 56 days post-induction as analysed by flow cytometry. Days 2–7 p<0.0001 unpaired t-test. Data points show individual measurements from biological replicates, n = 4–8 pituitaries per time point. (Bottom) Graph of the absolute number of GFP+ cells (green) and as a proportion of total cells (blue) at the time points indicated. (E) X-gal staining in Axin2CreERT2/+;ROSA26LacZ/+ pituitaries harvested from mice induced at P14 and lineage traced for 8 weeks (left) and 1 year (right). Scale bars: 500 μm. (F) Model summarising the major contribution of WNT-responsive progenitors of all lineages to pituitary growth, in addition to that of SOX2+ PSCs.
Figure 1—figure supplement 1
Axin2 expressing cells contribute to pituitary growth and expansion of all lineages.
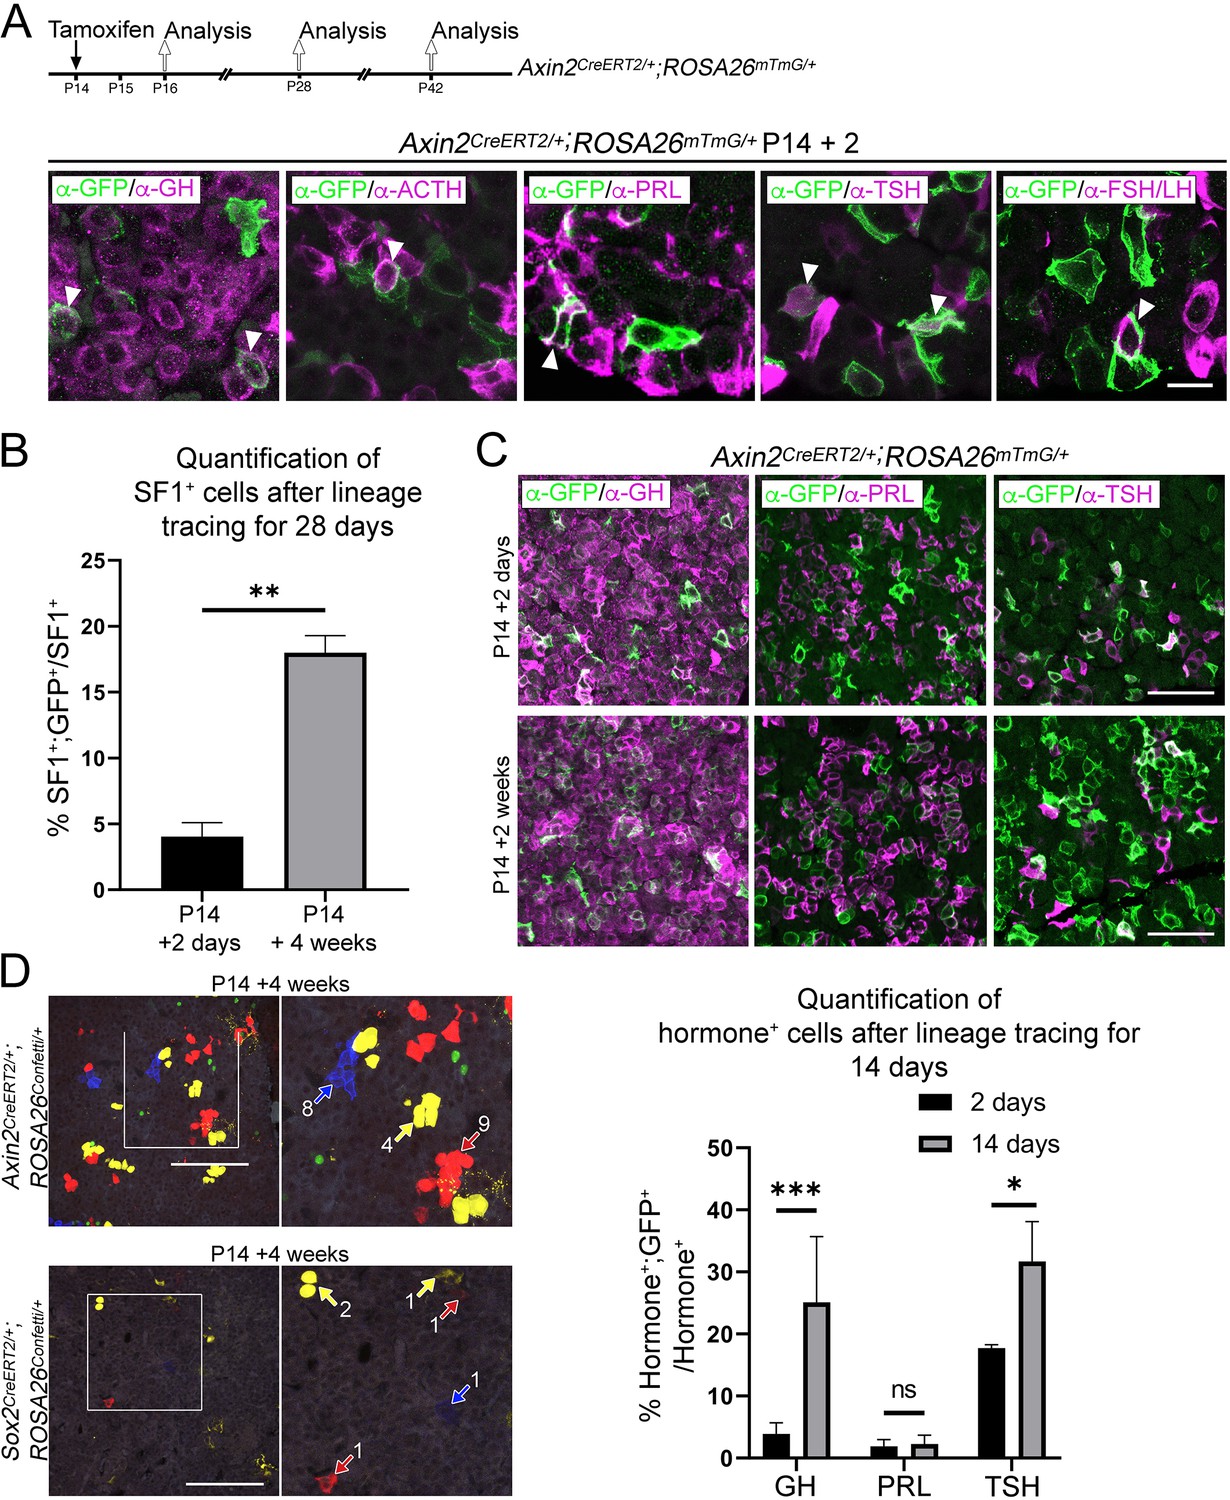
(A) Schematic of the combined experimental timeline used in panels A–C. Immunofluorescence staining against GFP (green) and markers of hormone-secreting endocrine cells (GH [somatotrophs], ACTH [corticotrophs], PRL [lactotrophs], TSH [thyrotrophs], FSH/LH [gonadotrophs]) in Axin2CreERT2/+;Rosa26mTmG/+ pituitaries induced at P14 and lineage traced for 48 hr. Scale bar: 10 µm. (B) Graph of quantification of expansion of the WNT-responsive SF1+ population in Axin2CreERT2/+;ROSA26mTmG/+ pituitaries induced at P14 and lineage traced for 2 or 28 days. There is a significant increase of GFP+;SF1+ cells as a proportion of the total SF1+ cells at P28. p=0.0048, unpaired t-test (n = 2 at 2 days, 3 at 28 days). (C) Immunofluorescence staining against GFP (green) and markers of hormone-secreting endocrine cells of the PIT1 lineage (GH [somatotrophs], PRL [lactotrophs], TSH [thyrotrophs]) in Axin2CreERT2/+;ROSA26mTmG/+ pituitaries induced at P14 and lineage traced for 14 days. Scale bars: 50 µm. Graph showing expansion of each of the Hormone+ cell types (Hormone+;GFP+) as a percentage of the total Hormone+ population between 2 and 14 days post-induction. There is a significant increase in GH+ somatotrophs (p=0.000548) and TSH+ thyrotrophs (p=0.0016), whilst there is no significance (ns) between PRL+ lactotroph populations between the two time points. Multiple t-test (n = 3 at 48 hr, n = 4 at 14 days post-induction). (D) Clonal analysis of individual cells targeted in Sox2CreERT2/+;ROSA26Confetti/+ (left panel) and Axin2CreERT2/+;ROSA26Confetti/+ pituitaries (right panel), induced at P14 and harvested after 4 weeks (P42). Arrows point to individual clones, numbered for the number of cells in the clone. Scale bar: 100 µm.
Figure 1—figure supplement 2
Axin2 expressing cells contribute to pituitary growth and expansion of all lineages.
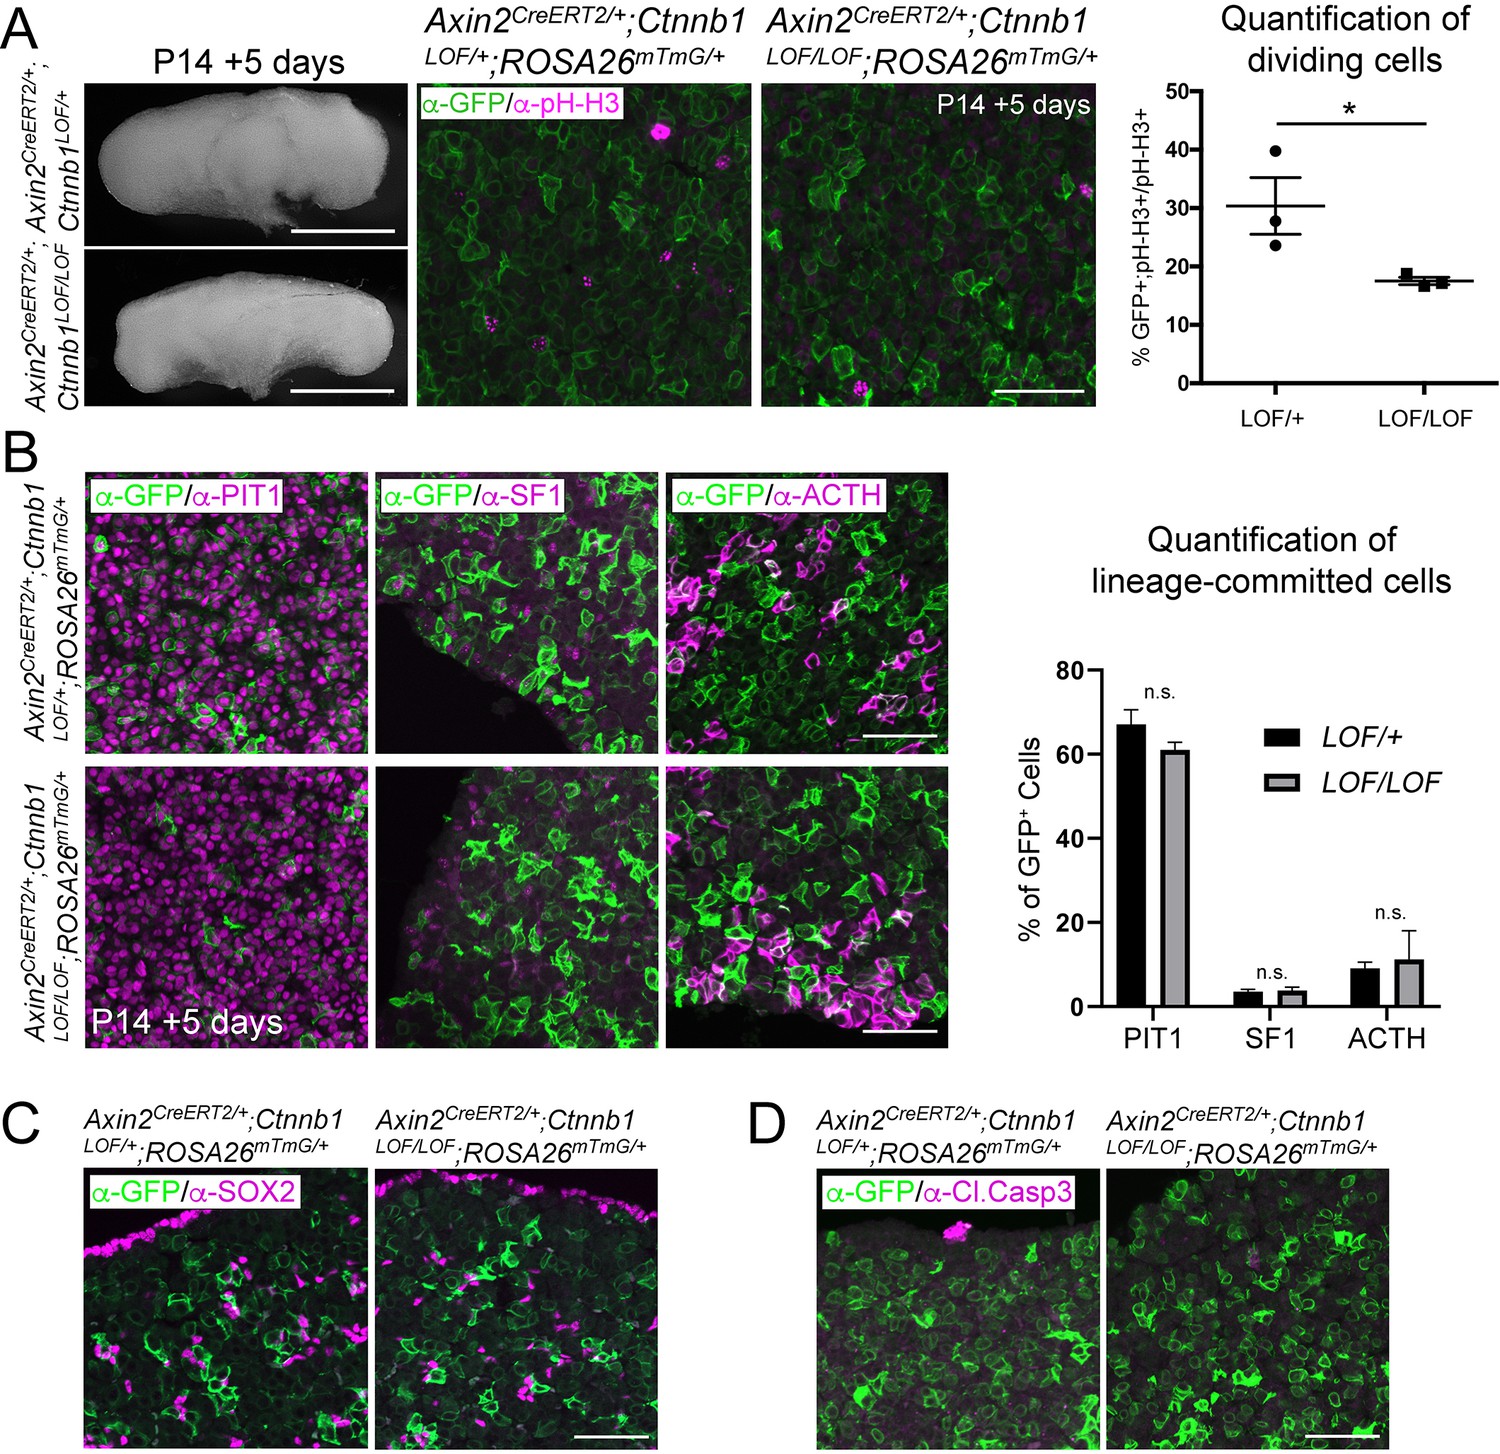
(A) Dorsal wholemount view of Axin2CreERT2/+; Ctnnb1LOF/+;ROSA26mTmG/+ and Axin2CreERT2/+; Ctnnb1LOF/LOF;ROSA26mTmG/+ pituitaries induced at P14 and lineage traced for 5 days. Scale bars: 500 μm. Immunofluorescence staining against GFP (green) and pH-H3 (magenta) in Axin2CreERT2/+; Ctnnb1LOF/+;ROSA26mTmG/+ and Axin2CreERT2/+; Ctnnb1LOF/LOF;ROSA26mTmG/+ pituitaries. Scale bar: 50 µm. Quantification of the contribution of lineage traced cells in control and mutants. Each data point represents the mean from one individual. p=0.0313, unpaired t-test (n = 3). (B) Immunofluorescence staining against GFP (green) and PIT1, SF1, and ACTH (magenta) in Axin2CreERT2/+; Ctnnb1LOF/+;ROSA26mTmG/+ and Axin2CreERT2/+;Ctnnb1LOF/LOF;ROSA26mTmG/+ pituitaries induced at P14 and lineage traced for 5 days. Quantification of the percentage of GFP+ cells, double-positive for each of the lineage markers, showing no significant changes for each lineage between controls and mutants (unpaired t-test, PIT1 p=0.1729, SF1 p=0.9488, ACTH p=0.6186. n = 4 controls, two mutants). Scale bars: 50 µm. (C) Immunofluorescence against GFP (green) and SOX2 (magenta) in Axin2CreERT2/+; Ctnnb1LOF/+;ROSA26mTmG/+ and Axin2CreERT2/+;Ctnnb1LOF/LOF;ROSA26mTmG/+ induced at P14 and lineage traced for 5 days (n = 4 controls, two mutants). Scale bars: 50 µm. (D) Immunofluorescence against GFP (green) and Cleaved Caspase-3 (magenta) in Axin2CreERT2/+; Ctnnb1LOF/+;ROSA26mTmG/+ and Axin2CreERT2/+;Ctnnb1LOF/LOF;ROSA26mTmG/+ induced at P14 and lineage traced for 5 days (n = 4 controls, two mutants). Scale bars: 50 μm.
Figure 2 with 2 supplements
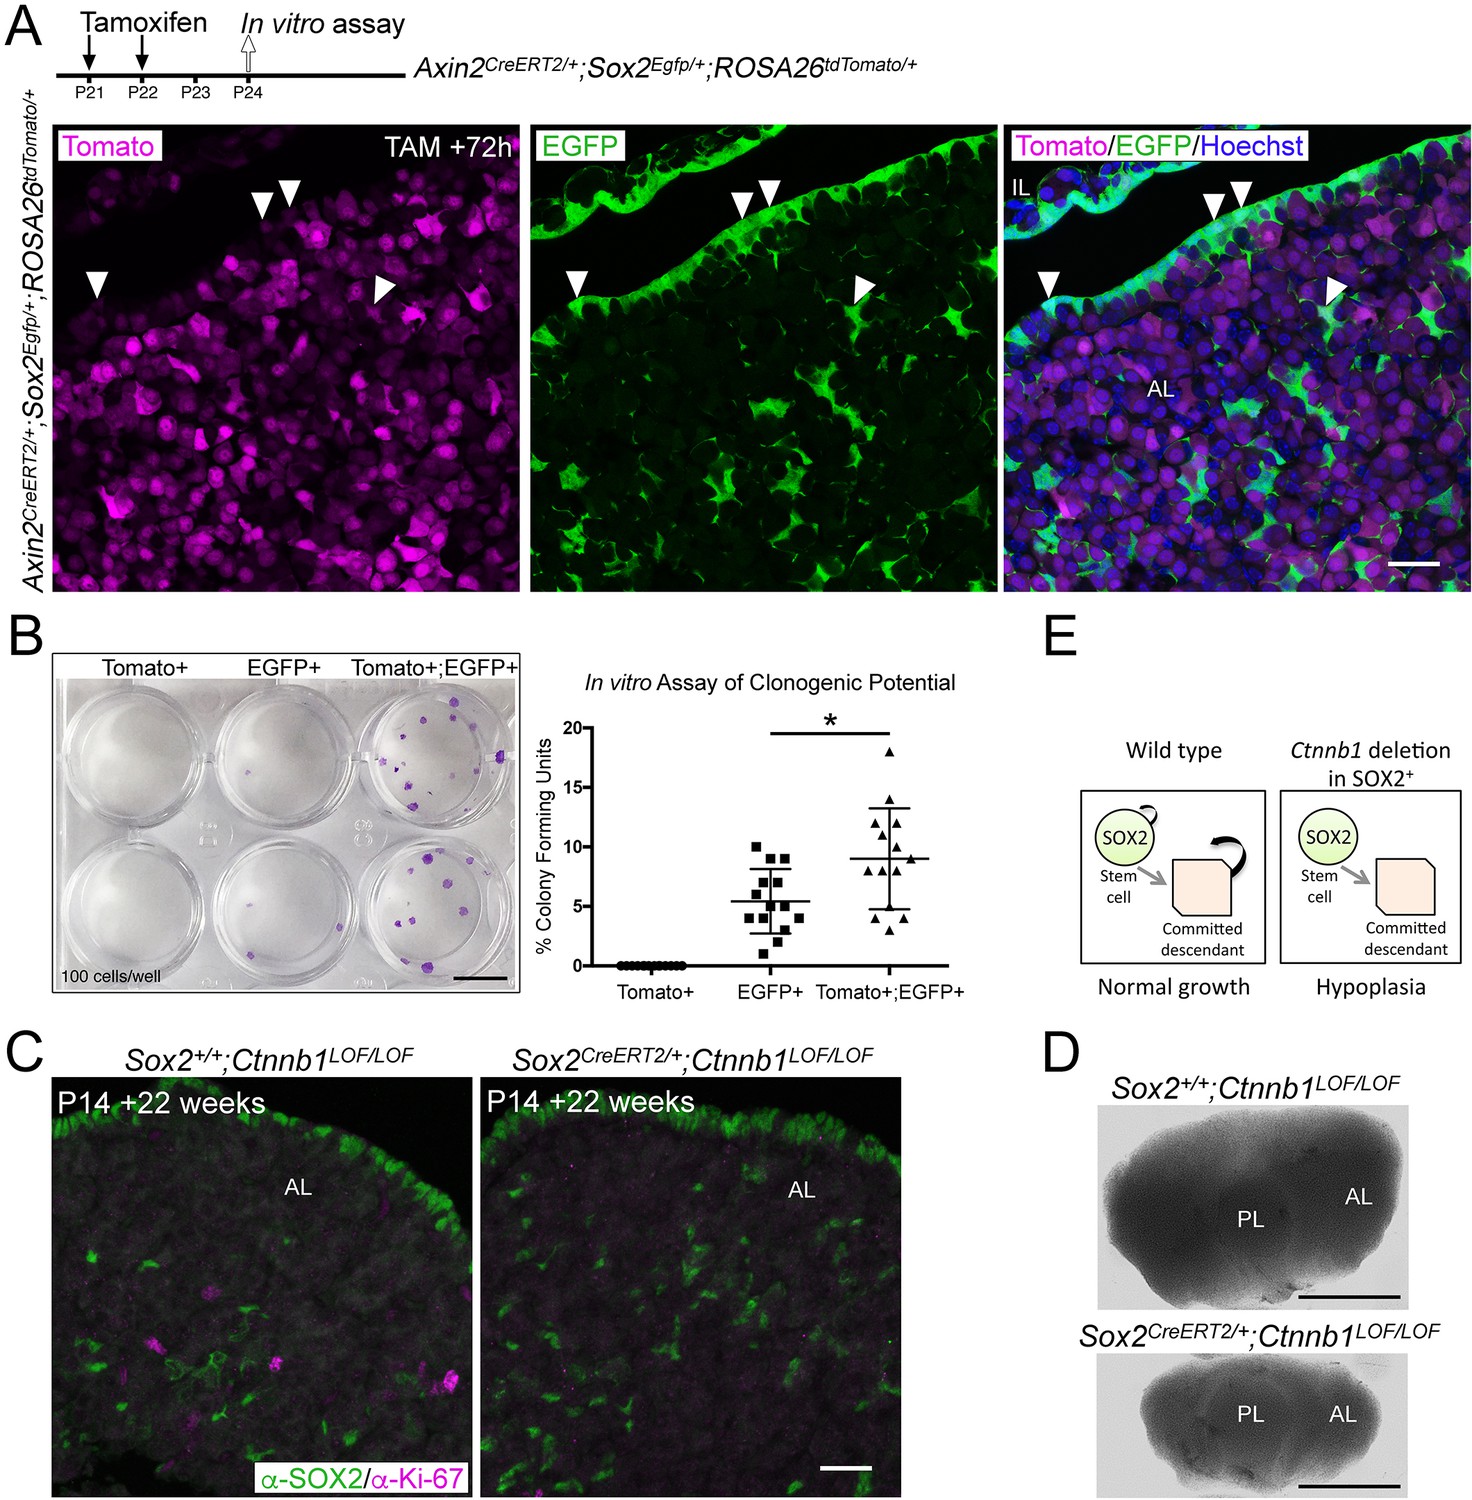
Activation of WNT signalling in SOX2+ pituitary stem cells (PSCs) and their descendants is necessary for long-term growth.
(A) Schematic of the experimental timeline used in panels A and B. Endogenous expression of tdTomato (magenta, Axin2 targeted cells) and EGFP (green, Sox2 expressing cells) in Axin2CreERT2/+;Sox2Egfp/+;ROSA26tdTomato/+ pituitaries harvested at P24 sectioned in the frontal plane. Nuclei are counterstained with Hoechst in the merged panel. Scale bar: 50 μm. (B) A representative culture plate showing colonies derived from Tomato+, EGFP+, or Tomato+;EGFP+ cells that were isolated from Axin2CreERT2/+;Sox2Egfp/+;ROSA26tdTomato/+ pituitaries by fluorescence-activated cell sorting (FACS) plated in stem cell promoting media at clonogenic densities and stained with crystal violet (left panel). The proportion of colony-forming cells in each subpopulation was quantified by counting the number of colonies per well (right panel). Each data point indicates individual wells, n = 5 separate pituitaries. p=0.0226, Mann–Whitney U-test (two-tailed). Scale bar: 10 mm. (C) Immunofluorescence staining against SOX2 (green) and Ki-67 (magenta) in Sox2+/+Ctnnb1LOF/LOF (control) and Sox2CreERT2/+Ctnnb1LOF/LOF (mutant) pituitaries from mice induced at P14 and analysed 22 weeks after induction (at P168) (bottom panel). Scale bar: 50 μm. (D) Dorsal view of whole mount pituitaries of Sox2+/+;Ctnnb1LOF/LOF (control) and Sox2CreERT2/+;Ctnnb1LOF/LOF (mutant), 22 weeks after induction (i.e. P168). Scale bars: 1 mm. (E) Model summarising the effect of Ctnnb1 deletion in SOX2+ PSCs. PL, posterior lobe; IL, intermediate lobe; AL, anterior lobe.
Figure 2—figure supplement 1
Activation of WNT signalling in SOX2+ pituitary stem cells (PSCs) and their descendants is necessary for long-term growth.
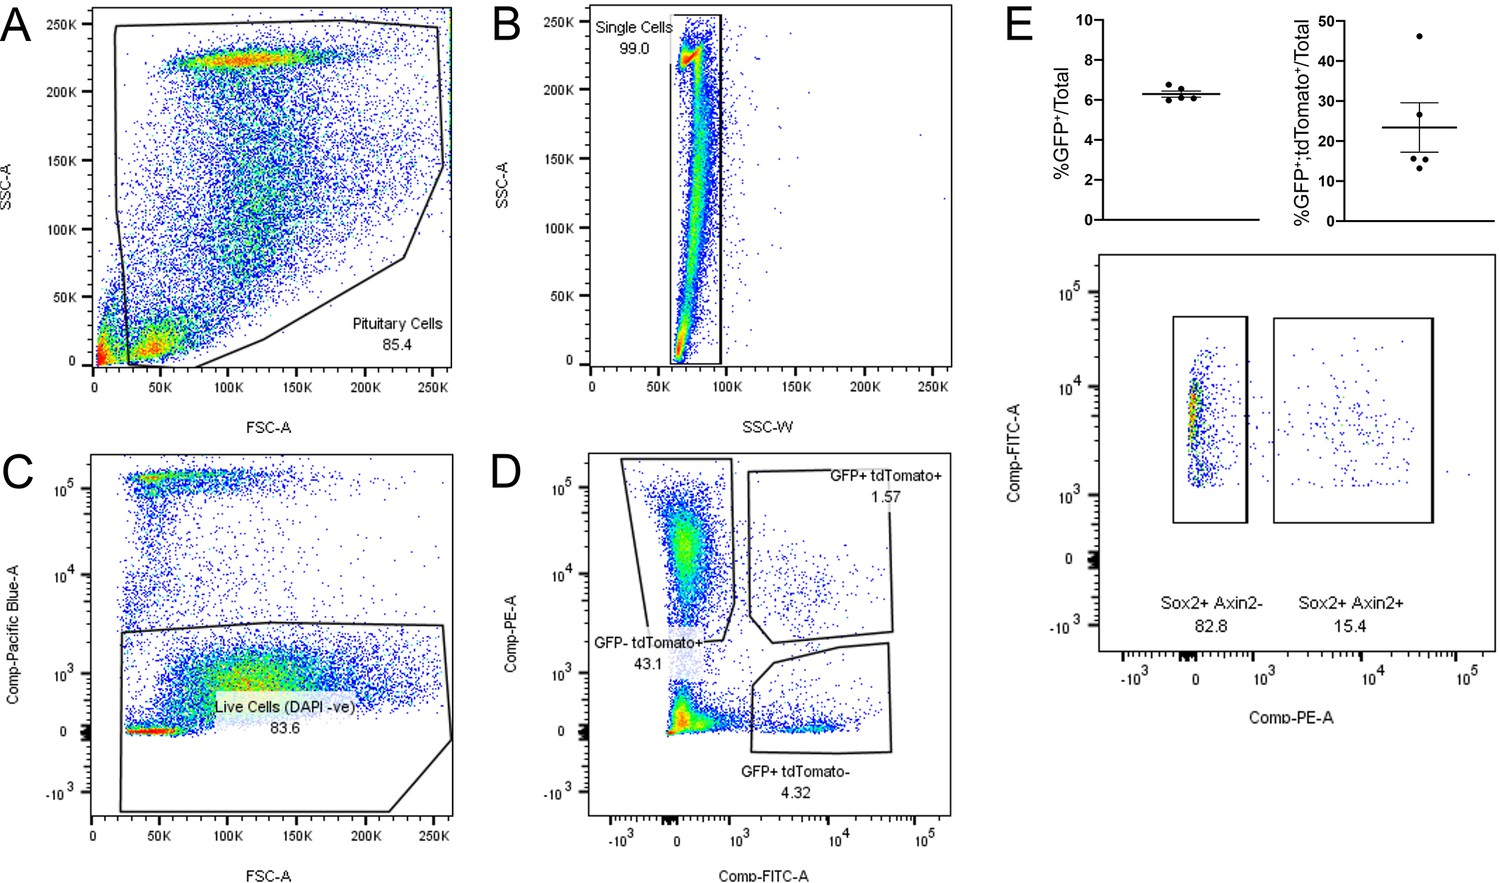
(A–E) Step-wise gating strategy to isolate WNT-responsive, SOX2-EGFP+ cells by flow sorting. (A and B) Single pituitary cells dissociated from Axin2CreERT2/+;ROSA26tdTomato/+;Sox2eGFP/+ mice were gated to exclude debris (A) and gated for single cells according to SSC-A and SSC-W (B). (C) Dead cells were excluded according to incorporation of DAPI. (D) Three populations of fluorescent cells were identified and sorted according to the following profiles: GFP-;tdTomato+, GFP+;tdTomato+, or GFP+;tdTomato-. (E) Quantification of the number of GFP+ cells out of all gated cells (left, n = 5 biological repeats), the proportion of all GFP+ cells that were found to be tdTomato+ (right, n = 5 biological repeats), and a representation of the gating used for quantification (bottom).
Figure 2—figure supplement 2
Activation of WNT signalling in SOX2+ pituitary stem cells (PSCs) and their descendants is necessary for long-term growth.
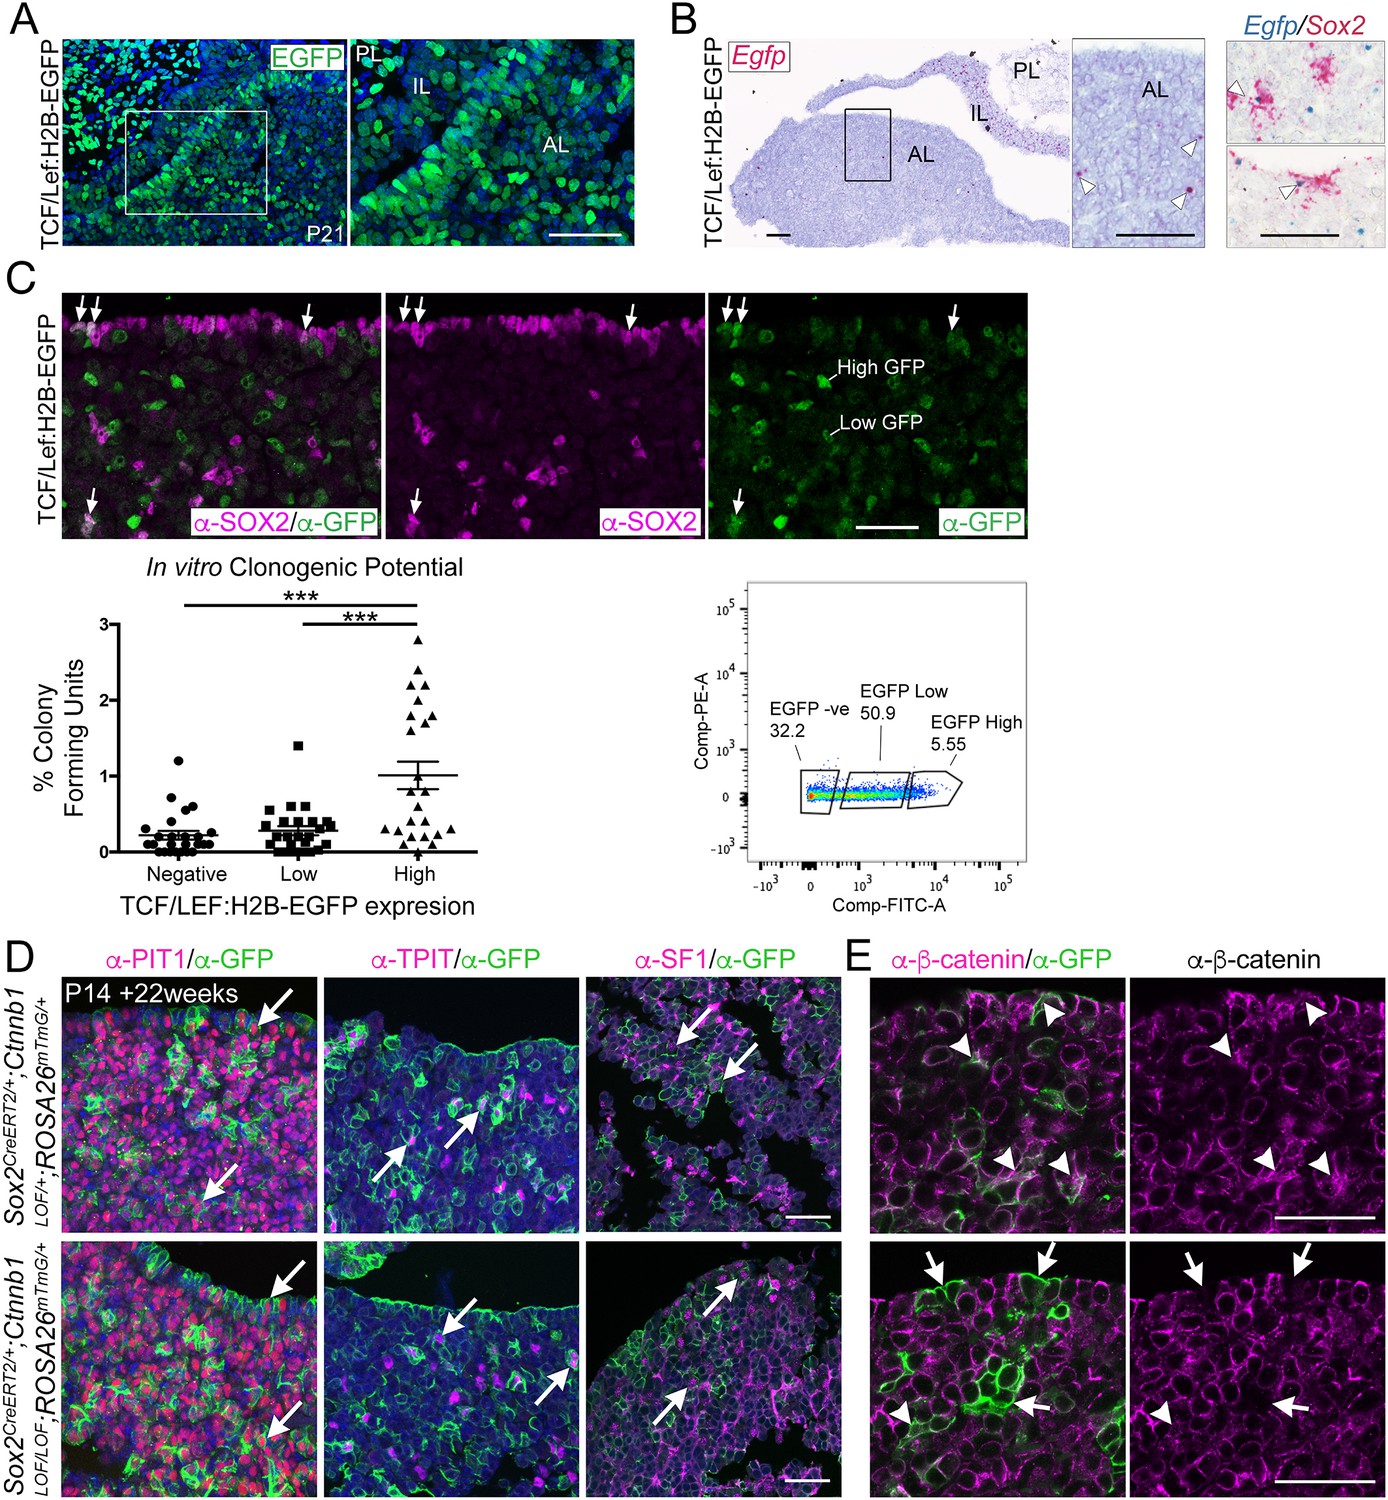
(A) Confocal images of native GFP fluorescence in frontal sections from TCF/Lef:H2B-EGFP pituitaries at P21. Scale bar: 50 μm. (B) mRNA in situ hybridisation in TCF/Lef:H2B-EGFP pituitaries at P21, detecting Egfp transcripts (red). Double mRNA in situ hybridisation showing overlap between Sox2 (red) and Egfp (blue) transcripts in pituitaries at P21. White arrowheads indicate double-positive staining. Scale bars: 50 μm. (C) Immunofluorescence staining against SOX2 (magenta) and GFP (green) in TCF/Lef:H2B-EGFP pituitaries harvested from P21 mice. White arrows indicate double-positive cells. Graph of quantification of the in vitro colony forming potential of GFP cells isolated from P21 TCF/Lef:H2B-EGFP pituitaries by flow sorting. Each data point represents single well replicates. Error bars show SEM, p<0.001 (one-way ANOVA, n = 3 individual pituitaries). Scale bar: 50 μm. Representative scatter plot showing gating used for fluorescence-activated cell sorting and population percentages in each gate. (D) Immunofluorescence staining against PIT1, TPIT, and SF1 (magenta) in Sox2CreERT2/+;Ctnnb1LOF/+;ROSA26mTmG/+ and Sox2CreERT2/+;Ctnnb1LOF/LOF;ROSA26mTmG/+ pituitaries 22 weeks post-induction at P14 (age P24). Arrows indicate double-positive cells. Scale bar: 50 µm. (E) Immunofluorescence staining against β-catenin (magenta) and GFP (green) in Sox2CreERT2/+; Ctnnb1LOF/+;ROSA26mTmG/+ and Sox2CreERT2/+; Ctnnb1LOF/LOF;ROSA26mTmG/+ pituitaries 22 weeks post-induction. Arrowheads indicate double-positive cells, and arrows indicate GFP+ cells that have lost β-catenin expression in mutants. Scale bar: 50 µm. PL, posterior lobe; IL, intermediate lobe; AL, anterior lobe; Inf, infundibulum; RP, Rathke’s pouch; Sph, sphenoid bone.
Figure 3 with 1 supplement
SOX2+ pituitary stem cells (PSCs) are as a source of WNT ligands in the pituitary.
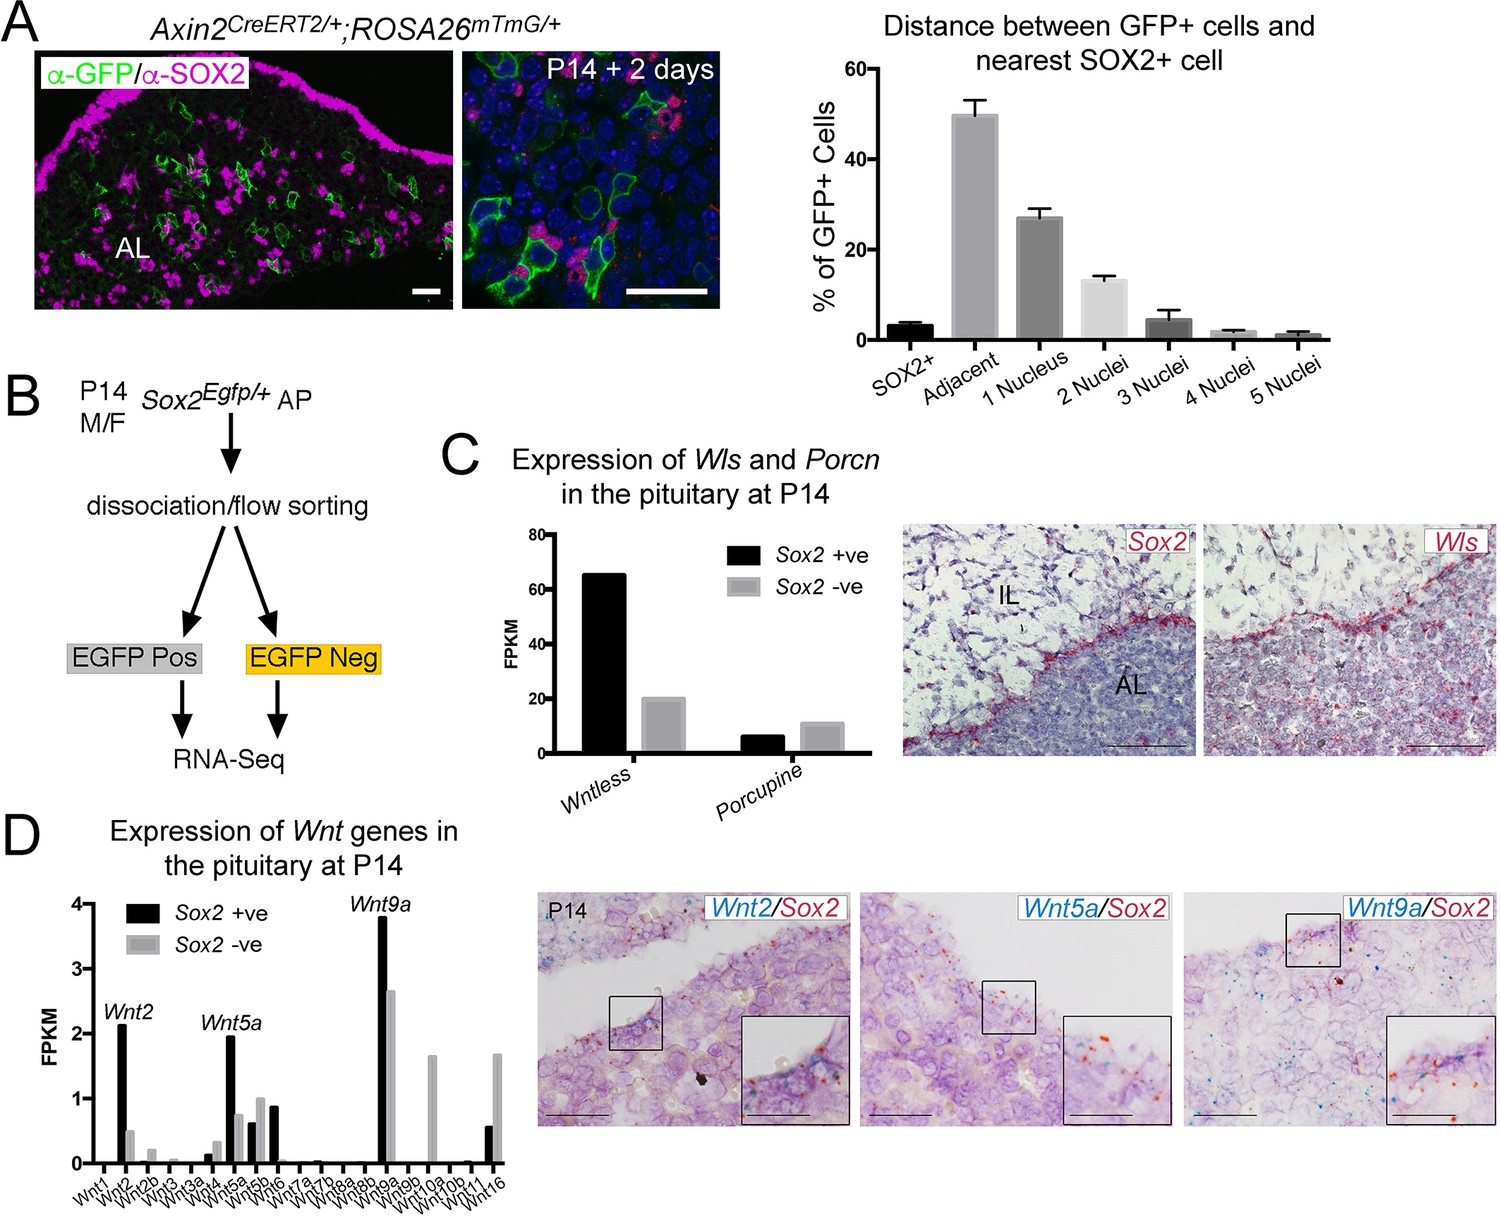
(A) Immunofluorescence staining against GFP (green) and SOX2 (magenta) in Axin2CreERT2/+; ROSA26mTmG/+ pituitaries 48 hr post-induction. Graph representing a quantification of the proximity of individual GFP+ cells to the nearest SOX2+ cell as quantified by the number of nuclei separating them. Plotted data represents the proportion of GFP+ cells that fall into each category of the total GFP+ cells, taken from n = 3 separate pituitaries. Scale bars: 50 μm. (B) Experimental paradigm for RNA Seq analysis of Sox2 positive and negative cells. (C) Graphs representing the FPKM values of Wls and Porcupine in Sox2 positive and negative cells (black and grey bars, respectively). mRNA in situ hybridisation for Sox2 and for Wls on wild-type sagittal pituitaries at P14, demonstrating strong Wls expression in the marginal zone epithelium. Scale bars: 250 μm. (D) Bar chart showing the FPKM values of Wnt genes in the Sox2+ and Sox2− fractions. Double mRNA in situ hybridisation against Wnt2, Wnt5a, and Wnt9a (blue) together with Sox2 (red) validating expression in the Sox2+ population. Boxed regions through the marginal zone epithelium are magnified. Scale bars: 100 μm and 50 μm in boxed inserts.
Figure 3—figure supplement 1
SOX2+ pituitary stem cells (PSCs) are as a source of WNT ligands in the pituitary.
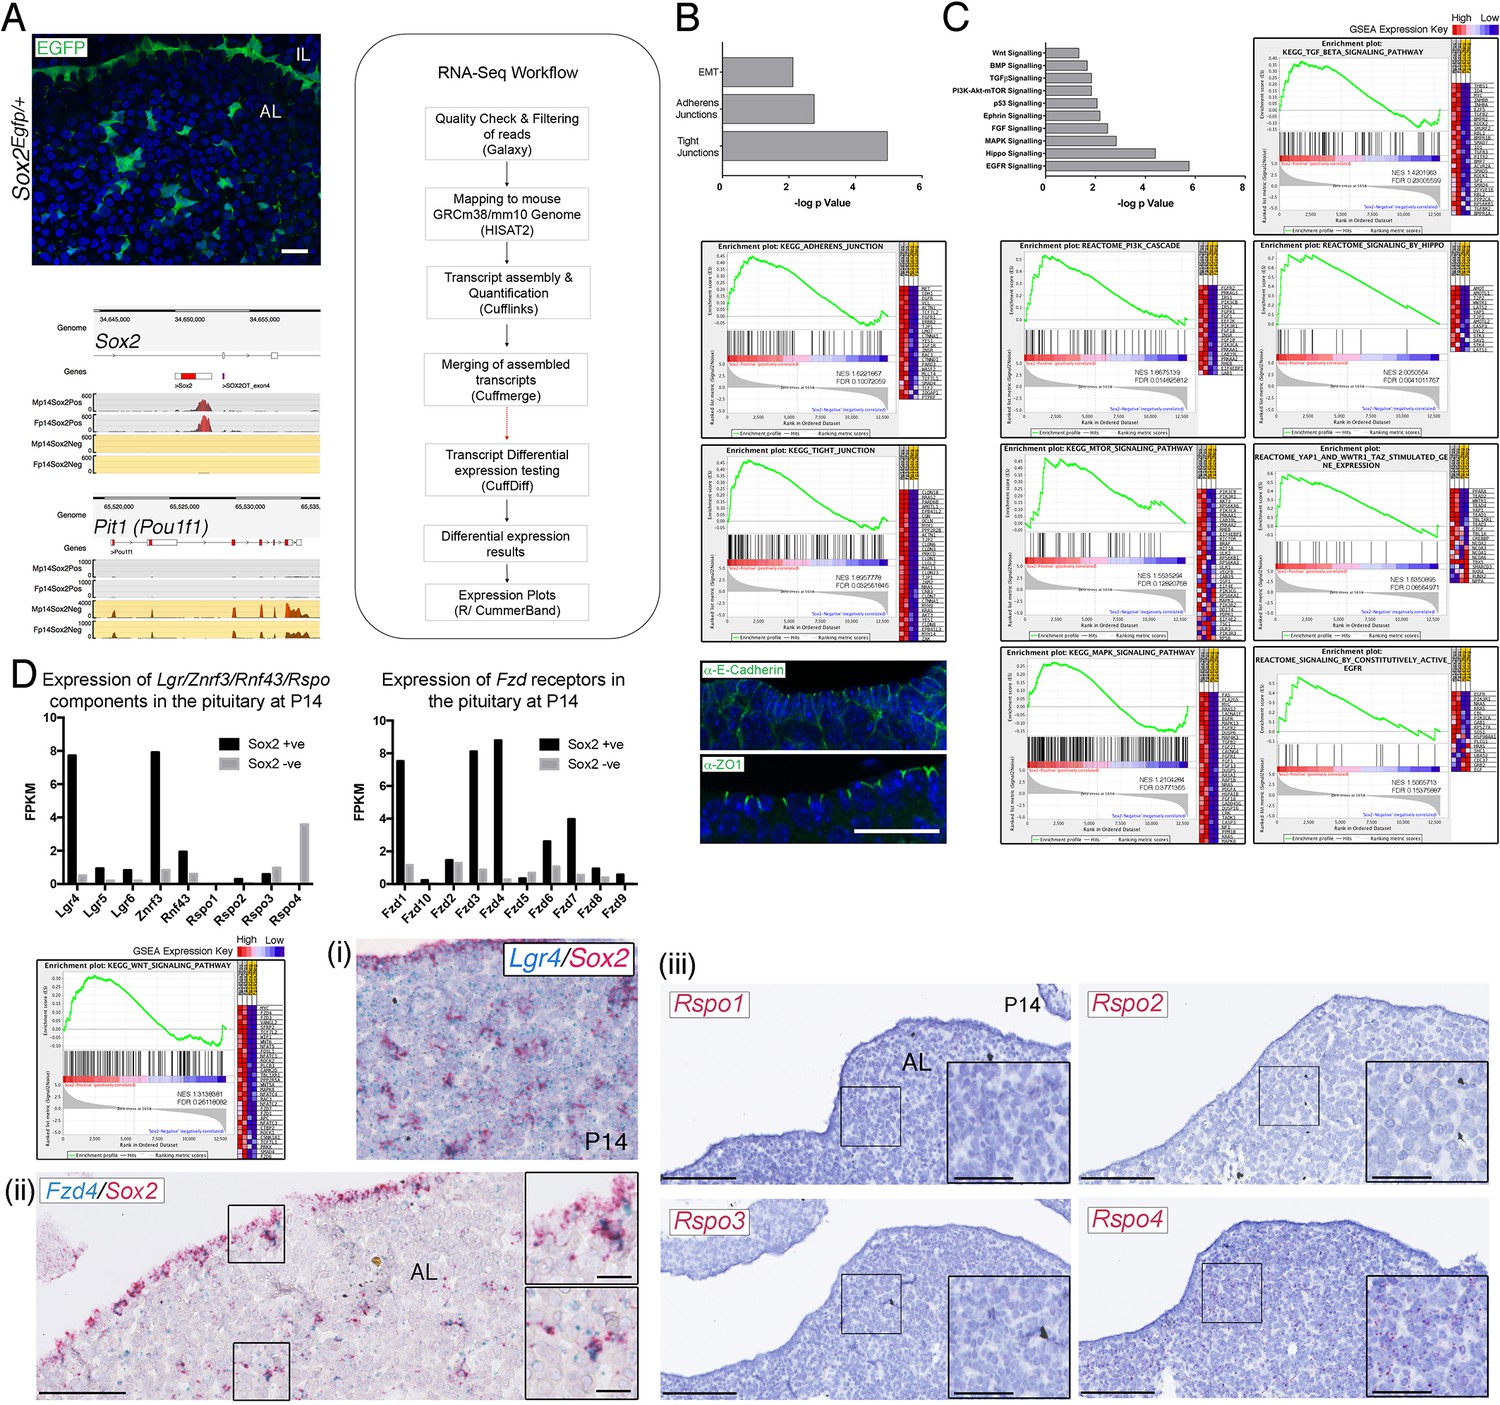
(A) Native EGFP protein expression in frontal cryosection of a P14 Sox2Egfp/+ pituitary. Schematic of the workflow used for bulk RNA-sequencing analysis of Sox2+ and Sox2− cells. Genome browser views of reads aligning to the Sox2 and Pit1 loci in the positive and negative fractions indicating good separation of the EGFP+ population. Scale bar: 50 µm. (B) Sox2+ cells express a significant enrichment in markers associated with epithelial-to-mesenchymal transition (EMT), adherens, and tight junctions, consistent with their epithelial nature. Gene set enrichment analysis (GSEA) plots and immunofluorescence staining against E-Cadherin (adherens junction marker) and ZO1 (tight junction marker) in the marginal zone epithelium at P14. Scale bar: 50 µm. See Supplementary file 1 for full GSEA gene lists. (C) Sox2+ cells express a significant enrichment in several signalling pathways, shown with respective GSEA plots. See Supplementary file 1 for full GSEA gene lists. (D) Bar charts showing the FPKM values of components of the LGR/RNF43/ZNRF3/R-spondin module in the Sox2+ and Sox2− fractions and the distribution of the Frizzled receptors. GSEA plot for components of the WNT pathway. Validation of sequencing: (i) mRNA in situ hybridisation with specific probes against Lgr4 (blue) and Sox2 (red) in P14 pituitaries showing co-expression. (ii) Double mRNA in situ hybridisation against Fzd4 (blue) and Sox2 (red) indicating co-expression in both the marginal zone epithelium and parenchymal Sox2+ cells. Boxed regions are magnified. Scale bars: 250 µm and 50 μm in boxed inserts. (iii) mRNA in situ hybridisation against Rspo1, Rspo2, Rspo3, and Rspo4 in sagittal sections of wild-type pituitaries at P14. Boxed regions are magnified, only Rspo4 is detected. Scale bars: 250 µm and 100 μm in boxed inserts.
Figure 4 with 1 supplement
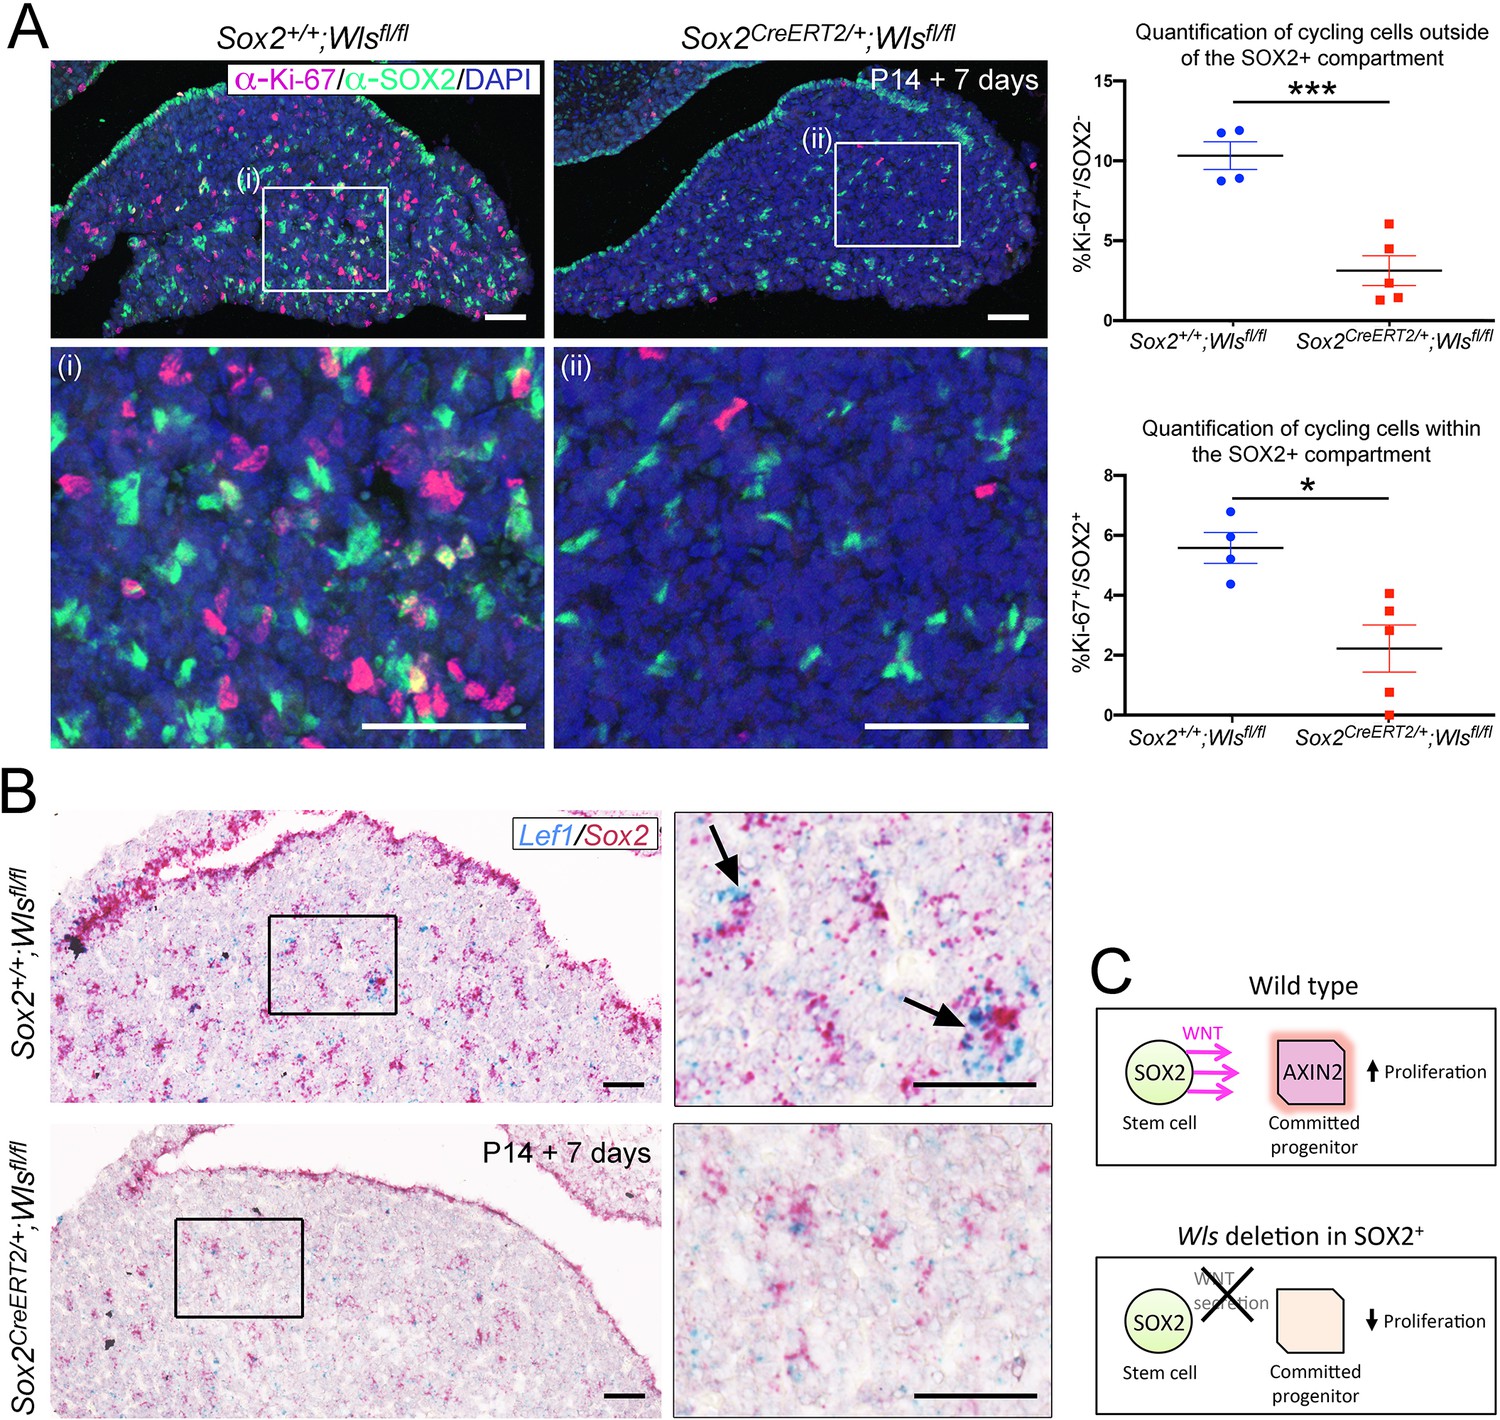
Paracrine secretion of WNTs from SOX2+ pituitary stem cells (PSCs) is necessary for expansion of committed cells.
(A) Immunofluorescence staining against SOX2 (green) and Ki-67 (magenta) in Sox2+/+;Wlsfl/fl (control) and Sox2CreERT2/+;Wlsfl/fl (mutant) pituitaries induced from P14 and analysed after 1 week. Nuclei were counterstained with Hoechst. (i and ii) represent magnified fields of view of regions indicated by white boxes in top panels. Scale bars: 50 μm. Graph of quantification of cycling cells marked by Ki-67 among cells negative for SOX2. Values represent mean ± SEM, p=0.0008, unpaired t-test. Graph of quantification of cycling cells marked by Ki-67 among SOX2-positive cells. Values represent mean ± SEM, p=0.0121, unpaired t-test. Each data point shows the mean of one biological replicate, n = 4 pituitaries from controls and five pituitaries from mutants. (B) Double mRNA in situ hybridisation using specific probes against Lef1 (blue) and Sox2 (red) in control and mutant pituitaries following tamoxifen induction from P14 and tracing for 7 days. Scale bars: 250 μm and 50 μm in boxed regions. (C) Model summarising paracrine WNT secretion from SOX2+ PSCs to lineage-committed progenitors and the effects of abolishing WNT secretion from SOX2+ PSCs through the deletion of Wls.
Figure 4—figure supplement 1
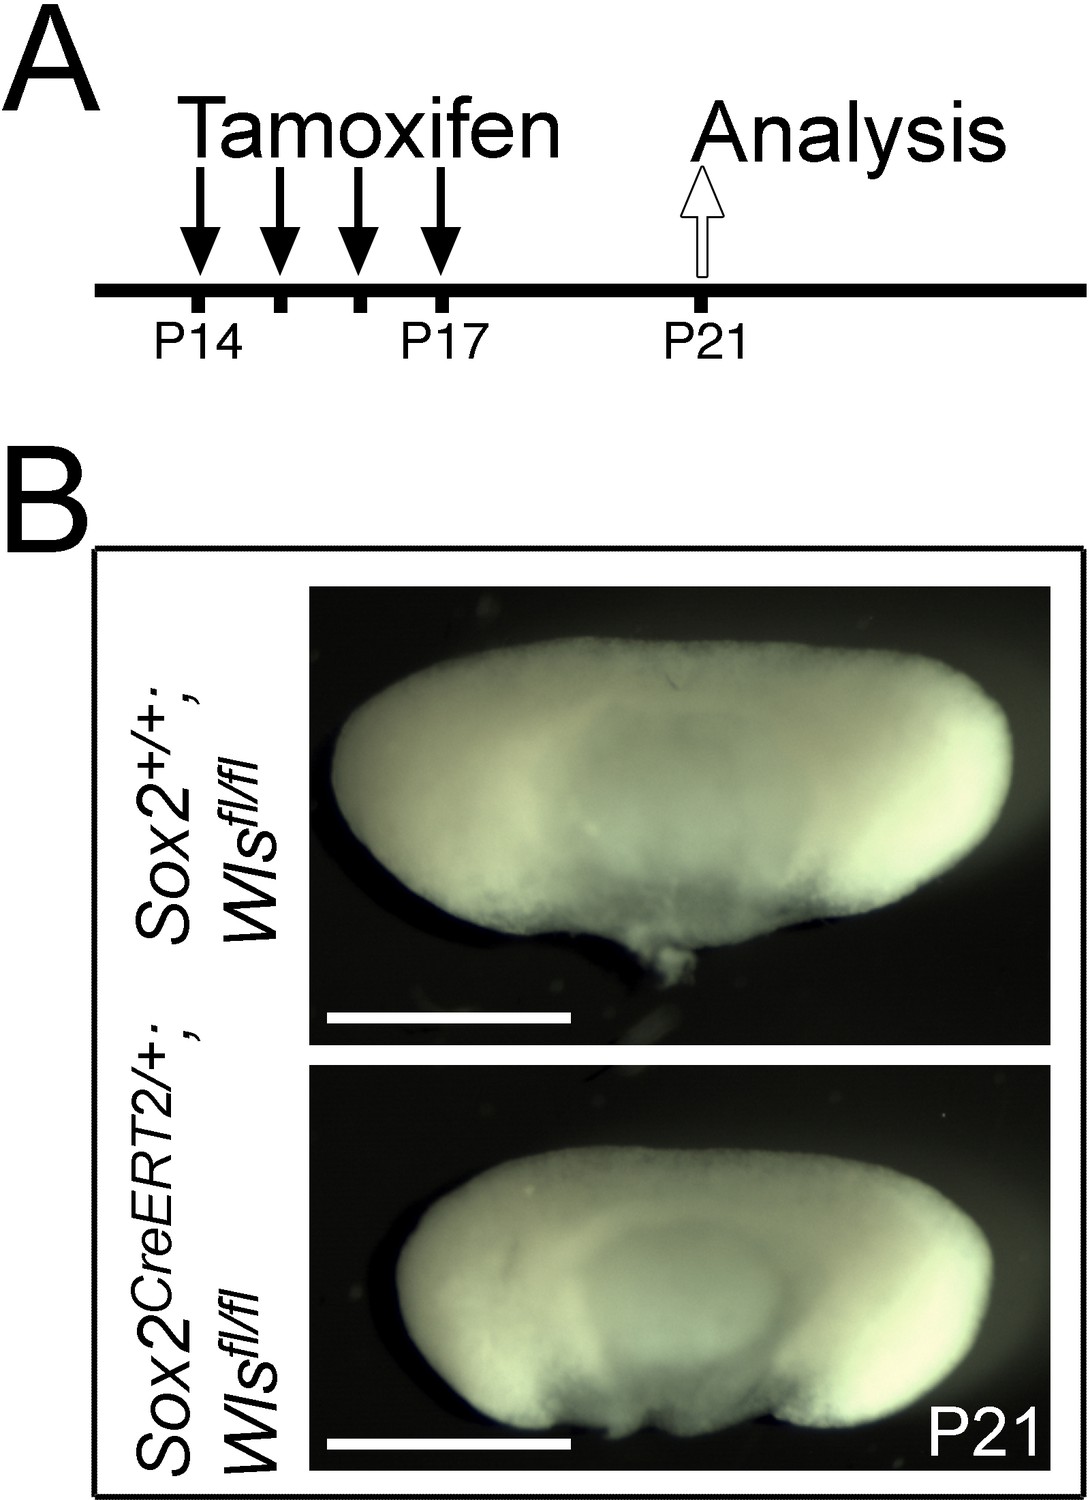
Paracrine secretion of WNTs from SOX2+ pituitary stem cells (PSCs) is necessary for expansion of committed cells.
(A) Schematic of time points for induction by tamoxifen induction and tissue harvesting of control Sox2+/+;Wlsfl/fl and mutant Sox2CreERT2/+;Wlsfl/fl pituitaries. (B) Whole mount, dorsal views of control Sox2+/+;Wlsfl/fl (top panel) and mutant Sox2CreERT2/+;Wlsfl/fl (bottom panel) pituitaries at P21, representative of n = 4 controls and n = 5 mutants. Scale bars: 500 μm.
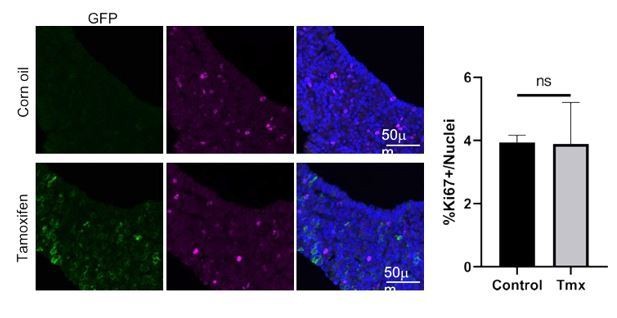
Author response image 1
Tables
Key resources table
| Reagent type (species) or resource | Designation | Source or reference | Identifiers | Additional information |
|---|---|---|---|---|
| Genetic reagent (Mus musculus) | Axin2CreERT2/+ | Roel Nusse, Stanford University The Jackson Laboratory | JAX:018867, RRID:IMSR_JAX:018867 | |
| Genetic reagent (Mus musculus) | Sox2CreERT2/+ | (Andoniadou et al., 2013) PMID:24094324 DOI: 10.1016/j.stem.2013.07.004 | MGI:5512893 | |
| Genetic reagent (Mus musculus) | ROSA26mTmG/mTmG | The Jackson Laboratory | JAX:007676, RRID:IMSR_JAX:007676 | |
| Genetic reagent (Mus musculus) | ROSA26Confetti/Confetti | The Jackson Laboratory | JAX:017492, RRID:IMSR_JAX:017492 | |
| Genetic reagent (Mus musculus) | ROSA26tdTomato/tdTomato | The Jackson Laboratory | JAX:007909, RRID:IMSR_JAX:007909 | |
| Genetic reagent (Mus musculus) | Ctnnb1fl(ex2-6)/ fl(ex2-6) (CtnnbLOF/LOF) | The Jackson Laboratory | JAX:004152, RRID:IMSR_JAX:004152 | |
| Genetic reagent (Mus musculus) | Wlsfl/fl | The Jackson Laboratory | JAX:012888, RRID:IMSR_JAX:012888 | |
| Genetic reagent (Mus musculus) | Sox2eGFP/+ | Ellis et al., 2004 PMID:15711057 DOI: 10.1159/000082134 | MGI:3589809 | |
| Genetic reagent (Mus musculus) | TCF/Lef:H2B-GFP | The Jackson Laboratory | JAX:013752, RRID:IMSR_JAX:013752 | |
| Cell line (Mus musculus) | Primary anterior pituitary cells | This paper | N/A | Freshly isolated from Mus musculus. |
| Antibody | Anti-GFP (Chicken Polyclonal) | Abcam | ab13970, RRID:AB_300798 | IF(1:400) |
| Antibody | Anti-SOX2 (Goat Polyclonal) | Immune Systems Ltd | GT15098, RRID:AB_2195800 | IF(1:200) |
| Antibody | Anti-SOX2(Rabbit Monoclonal) | Abcam | ab92494, RRID:AB_10585428 | IF(1:100) |
| Antibody | Anti-SOX9(Rabbit Monoclonal) | Abcam | ab185230, RRID:AB_2715497 | IF(1:500) |
| Antibody | Anti-POU1F1 (PIT1) (Rabbit Monoclonal) | Gifted by Dr S. J. Rhodes (IUPUI, USA) | 422_Rhodes, RRID:AB_2722652 | IF(1:500) |
| Antibody | Anti-SF1 (NR5A1, clone N1665)(Mouse Monoclonal) | Thermo Fisher Scientific | 434200, RRID:AB_2532209 | IF(1:300) |
| Antibody | Anti-TBX19 (TPIT), (Rabbit Polyclonal) | Gifted by Dr J. Drouin (Montreal Clinical Research Institute, Canada) | Ac1250 #71, RRID:AB_2728662 | IF(1:200) |
| Antibody | Anti-Ki67 (Rabbit Monoclonal) | Abcam | ab15580, RRID:AB_443209 | IF(1:100) |
| Antibody | Anti-pH-H3 (Rabbit Polyclonal) | Abcam | ab5176, RRID:AB_304763 | IF(1:500) |
| Antibody | Anti-GH (Rabbit Polyclonal) | National Hormone and Peptide Program (NHPP) | AFP-5641801 | IF(1:1000) |
| Antibody | Anti-TSH (Rabbit Polyclonal) | National Hormone and Peptide Program (NHPP) | AFP-1274789 | IF(1:1000) |
| Antibody | Anti-PRL (Rabbit Polyclonal) | National Hormone and Peptide Program (NHPP) | AFP-4251091 | IF(1:1000) |
| Antibody | Anti-ACTH(Mouse Monoclonal) | Fitzgerald | 10C-CR1096M1, RRID:AB_1282437 | IF(1:400) |
| Antibody | Anti-LH (Rabbit Polyclonal) | National Hormone and Peptide Program (NHPP) | AFP-697071P | IF(1:300) |
| Antibody | Anti-FSH (Rabbit Polyclonal) | National Hormone and Peptide Program (NHPP) | AFP-HFS6 | IF(1:300) |
| Antibody | Anti-ZO-1 (Rat Monoclonal) | Santa Cruz | SC33725, RRID:AB_628459 | IF(1:300) |
| Antibody | Anti-E-CADHERIN(Rabbit Monoclonal) | Cell Signaling | 3195S, RRID:AB_2291471 | IF(1:300) |
| Antibody | Anti-Rabbit 488 (Goat Polyclonal) | Life Technologies | A11008, RRID:AB_143165 | IF(1:400) |
| Antibody | Anti-Rabbit 555 (Goat Polyclonal) | Life Technologies | A21426, RRID:AB_1500929 | IF(1:400) |
| Antibody | Anti-Rabbit 633 (Goat Polyclonal) | Life Technologies | A21050, RRID:AB_141431 | IF(1:400) |
| Antibody | Anti-Goat 488 (Donkey Polyclonal) | Abcam | ab150133, RRID:AB_2832252 | IF(1:400) |
| Antibody | Anti-Chicken 488 (Goat Polyclonal) | Life Technologies | A11039, RRID:AB_142924 | IF(1:400) |
| Antibody | Anti-Chicken 647 (Goat Polyclonal) | Life Technologies | A21449, RRID:AB_1500594 | IF(1:400) |
| Antibody | Anti-Rat 555 (Goat Polyclonal) | Life Technologies | A21434, RRID:AB_141733 | IF(1:400) |
| Antibody | Anti-Mouse 555 (Goat Polyclonal) | Life Technologies | A21426, RRID:AB_1500929 | IF(1:400) |
| Antibody | Anti-Rabbit Biotinylated (Donkey Polyclonal) | Abcam | ab6801, RRID:AB_954900 | IF(1:400) |
| Antibody | Anti-Rabbit Biotinylated (Goat Polyclonal) | Abcam | ab207995 | IF(1:400) |
| Antibody | Anti-Mouse Biotinylated (Goat Biotinylated) | Abcam | ab6788, RRID:AB_954885 | IF(1:400) |
| Sequence-based reagent | RNAscope probe M. musculus Axin2 | Advanced Cell Diagnostics | 400331 | |
| Sequence-based reagent | RNAscope probe M. musculus Lef1 | Advanced Cell Diagnostics | 441861 | |
| Sequence-based reagent | RNAscope probe M. musculus Wls | Advanced Cell Diagnostics | 405011 | |
| Sequence-based reagent | RNAscope probe M. musculus Rspo1 | Advanced Cell Diagnostics | 401991 | |
| Sequence-based reagent | RNAscope probe M. musculus Rspo2 | Advanced Cell Diagnostics | 402001 | |
| Sequence-based reagent | RNAscope probe M. musculus Rspo3 | Advanced Cell Diagnostics | 402011 | |
| Sequence-based reagent | RNAscope probe M. musculus Rspo4 | Advanced Cell Diagnostics | 402021 | |
| Sequence-based reagent | RNAscope probe M. musculus Lgr4 | Advanced Cell Diagnostics | 318321 | |
| Sequence-based reagent | RNAscope probe M. musculus Wnt9a | Advanced Cell Diagnostics | 405081 | |
| Sequence-based reagent | RNAscope probe M. musculus Wnt2 | Advanced Cell Diagnostics | 313601 | |
| Sequence-based reagent | RNAscope probe M. musculus Wnt5a | Advanced Cell Diagnostics | 316791 | |
| Sequence-based reagent | RNAscope probe eGFP | Advanced Cell Diagnostics | 400281 | |
| Sequence-based reagent | RNAscope probe M. musculus Jun | Advanced Cell Diagnostics | 453561 | |
| Sequence-based reagent | RNAscope probe M. musculus Axin2 (Channel 2) | Advanced Cell Diagnostics | 400331-C2 | |
| Sequence-based reagent | RNAscope probe M. musculus Sox2 (Channel 2) | Advanced Cell Diagnostics | 401041-C2 | |
| Sequence-based reagent | RNAscope probe eGFP (Channel 2) | Advanced Cell Diagnostics | 400281-C2 | |
| Sequence-based reagent | RNAscope probe M. musculus Sox2 | Advanced Cell Diagnostics | 401041 | |
| Sequence-based reagent | RNAscope probe M. musculus Pou1f1 | Advanced Cell Diagnostics | 486441 | |
| Sequence-based reagent | RNAscope probe Duplex Positive Control Ppib-C1, Polr2a-C2 | Advanced Cell Diagnostics | 321641 | |
| Sequence-based reagent | RNAscope probe Duplex Negative Control DapB (both channels) | Advanced Cell Diagnostics | 320751 | |
| Sequence-based reagent | RNAscope probe Singleplex Positive Control Ppib | Advanced Cell Diagnostics | 313911 | |
| Sequence-based reagent | RNAscope probe: Singleplex Negative Control DapB | Advanced Cell Diagnostics | 310043 | |
| Peptide, recombinant protein | Streptavidin 488 | Life Technologies | S11223 | IF(1:400) |
| Peptide, recombinant protein | Streptavidin 555 | Life Technologies | S32355 | IF(1:400) |
| Peptide, recombinant protein | Streptavidin 633 | Life Technologies | S21375 | IF(1:400) |
| Commercial assay or kit | RNAScope 2.5 HD Assay-RED | Advanced Cell Diagnostics | 322350 | |
| Commercial assay or kit | RNAScope 2.5 HD Duplex Assay | Advanced Cell Diagnostics | 322430 | |
| Commercial assay or kit | LIVE/DEAD Fixable Near IR-Dead Cell Stain Kit | Life Technologies | L34975 | |
| Commercial assay or kit | FIX and PERM Cell Permeabilization Kit | Life Technologies | GAS003 | |
| Chemical compound, drug | Tamoxifen | Sigma | T5648 | |
| Chemical compound, drug | Corn Oil | Sigma | C8267 | |
| Chemical compound, drug | Collagenase Type 2 | Worthington | 4178 | C |
| Chemical compound, drug | 10× Trypsin | Sigma | 59418C | |
| Chemical compound, drug | Deoxyribonuclease I | Worthington | LS002172 | |
| Chemical compound, drug | Fungizone | Gibco | 15290 | |
| Chemical compound, drug | Hank’s Balanced Salt Solution (HBSS) | Gibco | 14170 | |
| Chemical compound, drug | Foetal Bovine Serum | Sigma | F2442 | |
| Chemical compound, drug | HEPES | Thermo Fisher | 15630 | |
| Chemical compound, drug | bFGF | R&D Systems | 233-FB-025 | |
| Chemical compound, drug | Cholera Toxin | Sigma | C8052 | |
| Chemical compound, drug | DMEM-F12 | Thermo Fisher | 31330 | |
| Chemical compound, drug | Penicillin/Streptomycin | Gibco | 15070-063 | |
| Chemical compound, drug | Neutral Buffered Formalin | Sigma | HT501128 | |
| Chemical compound, drug | Hoechst 33342 | Thermo Fisher | H3570 | 1:1000 |
| Chemical compound, drug | Declere | Sigma | D3565 | |
| Chemical compound, drug | Neo-Clear | Sigma | 65351-M | |
| Software, algorithm | FlowJo | FlowJo, LLC | https://www.flowjo.com/ RRID:SCR_008520 | |
| Software, algorithm | Prism 7 | GraphPad Software | https://www.graphpad.com/ | |
| Software, algorithm | Image Lab | Bio-Rad Laboratories | http://www.bio-rad.com/ | |
| Software, algorithm | NDP View | Hamamatsu Photonics | https://www.hamamatsu.com/ | |
| Software, algorithm | HISAT v2.0.3 | Kim et al., 2015 | https://github.com/infphilo/hisat2 RRID:SCR_015530 | |
| Software, algorithm | DESeq2 v2.11.38 | Love et al., 2014 | https://github.com/Bioconductor-mirror/DESeq2 RRID:SCR_015687 | |
| Software, algorithm | featureCounts v1.4.6p5 | Liao et al., 2014 | http://subread.sourceforge.net/ RRID:SCR_012919 | |
| Software, algorithm | The Galaxy Platform | Afgan et al., 2016; Blankenberg et al., 2010; Goecks et al., 2010 | https://usegalaxu.org RRID:SCR_006281 | |
| Software, algorithm | Gene Set Enrichment Analysis (GSEA) | Subramanian et al., 2005 | software.broadinstitute.org/gsea/index.jsp RRID:SCR_003199 | |
| Software, algorithm | Cufflinks | Trapnell et al., 2012 | https://github.com/cole-trapnell-lab/cufflinks RRID:SCR_014597 | |
| Other | Deposited Data, RNA-Seq | BioProject (NCBI) | PRJNA421806 |
Additional files
-
Supplementary file 1
Gene lists of gene set enrichment analyses.
Gene lists generated from gene set enrichment analyses of bulk RNA-sequencing data comparing Sox2+ and Sox2− cells. Associated with Figure 3—figure supplement 1.
- https://cdn.elifesciences.org/articles/59142/elife-59142-supp1-v2.xlsx
-
Transparent reporting form
- https://cdn.elifesciences.org/articles/59142/elife-59142-transrepform-v2.docx
Download links
A two-part list of links to download the article, or parts of the article, in various formats.
Downloads (link to download the article as PDF)
Open citations (links to open the citations from this article in various online reference manager services)
Cite this article (links to download the citations from this article in formats compatible with various reference manager tools)
Pituitary stem cells produce paracrine WNT signals to control the expansion of their descendant progenitor cells
eLife 10:e59142.
https://doi.org/10.7554/eLife.59142


