The structural determinants of PH domain-mediated regulation of Akt revealed by segmental labeling
- Division of Genetics, Department of Medicine, Brigham and Women's Hospital, United States
- Department of Biological Chemistry and Molecular Pharmacology, Harvard Medical School, United States
- Department of Pharmacology and Molecular Sciences, Johns Hopkins School of Medicine, United States
- Department of Cancer Biology, Dana-Farber Cancer Institute, United States
Figures
Figure 1
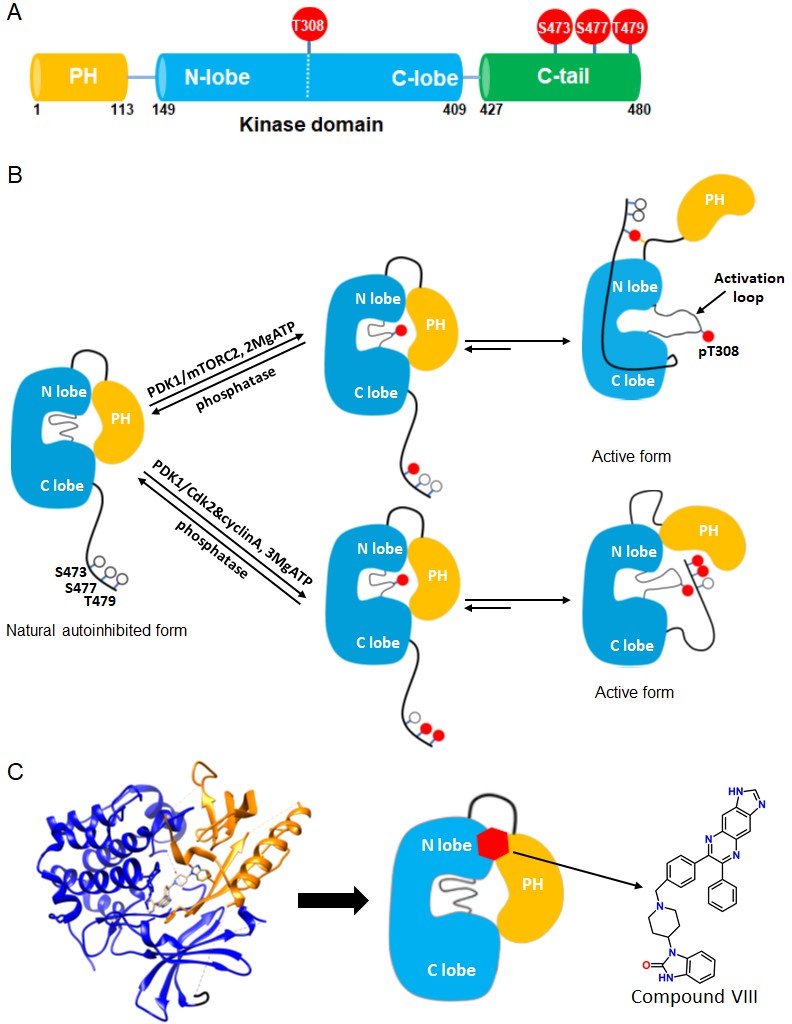
Akt domain architecture, two distinct activation mechanisms mediated by C-tail phosphorylations, and the current model for drug-induced autoinhibited form.
(A) Schematic representation of Akt domains with phosphorylation sites of interest highlighted as red balls. (B) Cartoon model depicted for two distinct Akt activation mechanisms induced by phospho-Ser473 and dual phospho-Ser477/Thr479 (Chu et al., 2018). Without C-tail phosphorylations, Akt remains in an inactive autoinhibited state where the PH and kinase domains interact intramolecularly. The mTORC2-mediated Ser473 phosphorylation activates Akt by inducing an interaction between the C-tail and the PH-kinase domain linker, dislodging the PH domain from the kinase domain. Alternatively, the dual Cdk2/cyclinA-mediated pSer477/pThr479 is presumed to activate Akt by interaction with the activation loop and PH domain. Note that, although C-terminal phosphorylation is shown preceding activation loop Thr308 phosphorylation by PDK1, it is uncertain in normal cell signaling whether C-terminal phosphorylation or Thr308 phosphorylation comes first in Akt activation or if it is in random order. (C) Crystal structure of Akt (aa 1–443) bound to allosteric inhibitor compound VIII (left, PDB: 3O96, [Wu et al., 2010]) and cartoon model illustrating the current model of the allosteric drug-induced autoinhibited form of Akt with the non-phosphorylated C-tail.
Figure 2 with 1 supplement
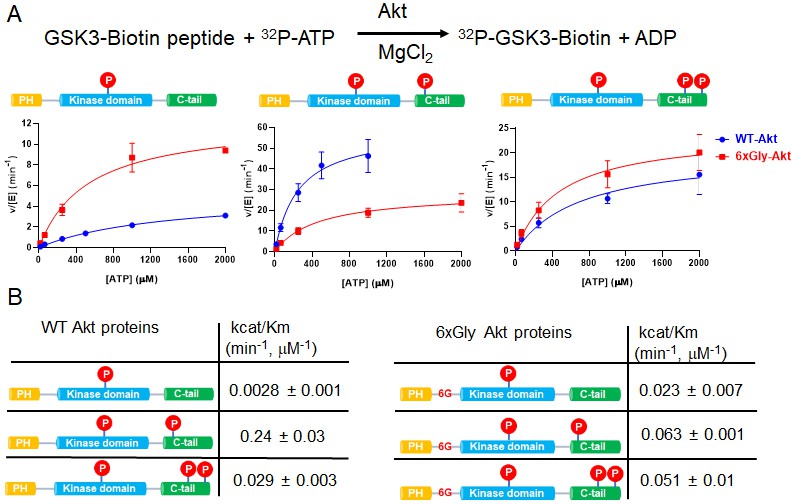
The PH-kinase domain linker length/flexibility affects Akt activation.
(A) Schematic illustration for radiometric kinase assay using a biotinylated GSK3 peptide as Akt substrate and steady-state kinetic plots for v/[E] versus [ATP] with 20 µM GSK3 peptide for semisynthetic pThr308 Akt proteins WT (blue) versus the linker 6xGly insertion (red) with non-p C-tail (left), pSer473 (middle) and dual-pSer477/pThr479 (right), n = 2. (B) Enzyme catalytic efficiencies (apparent kcat/Km) obtained from (A) for each semisynthetic Akt protein, WT (left) and 6xGly insertion (right), two independent repeats were performed for each assay, S.D. shown.
Figure 2—figure supplement 1
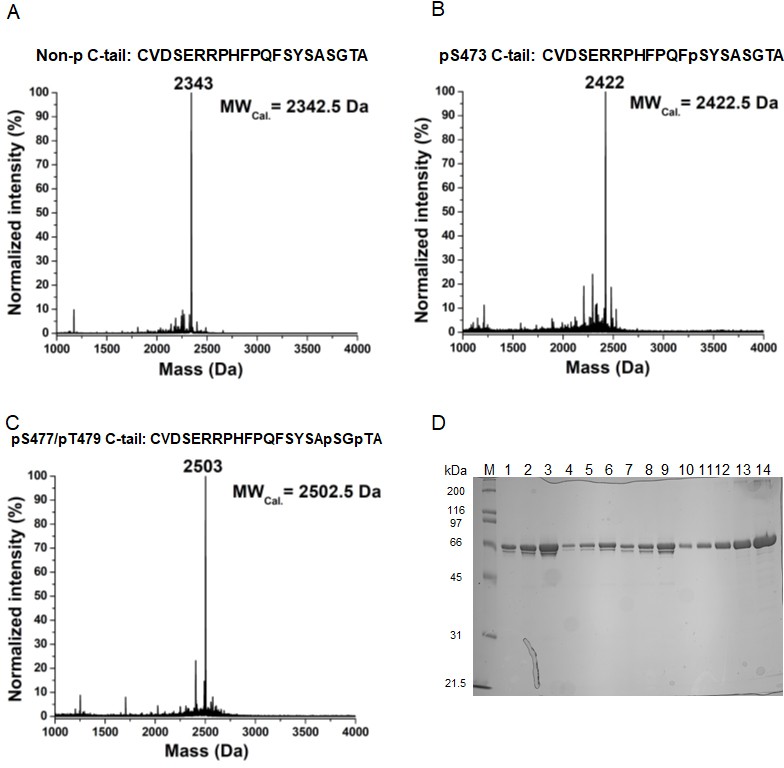
Semisynthesis of hexa-Gly Akt proteins.
(A–C) MALDI-MS analysis of synthetic Akt C-tail peptides that were used in this work. (D) Full length, 6xGly insertion, pThr308-Akt proteins with non-p C-tail (lanes 1–3), pSer473 (lanes 4–6) and di-pSer477/pThr479 (lanes 7–9) obtained from 2-piece expressed protein ligation strategy, diluted 10-fold, and loaded 2.5, 5 and 10 µl, respectively; lanes 10–14: BSA standards.
Figure 3 with 1 supplement
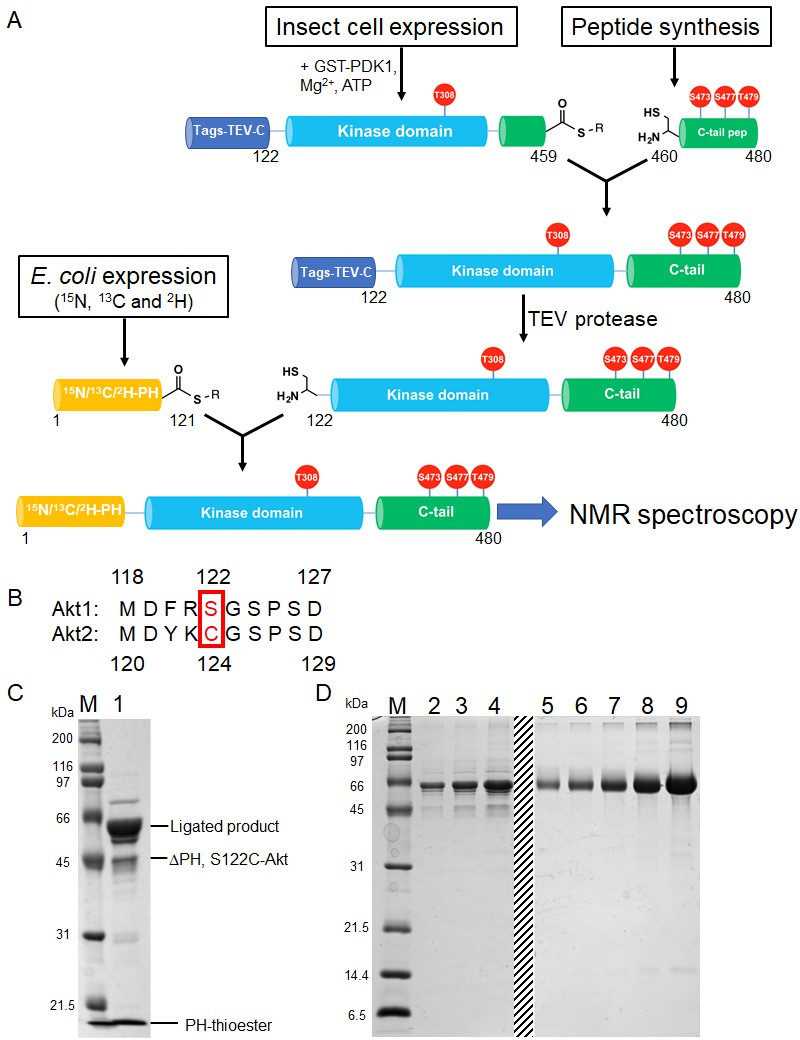
Semisynthesis strategy to generate segmentally 15N, 13C, 2H isotopically labeled Akt containing distinct C-tail phospho forms.
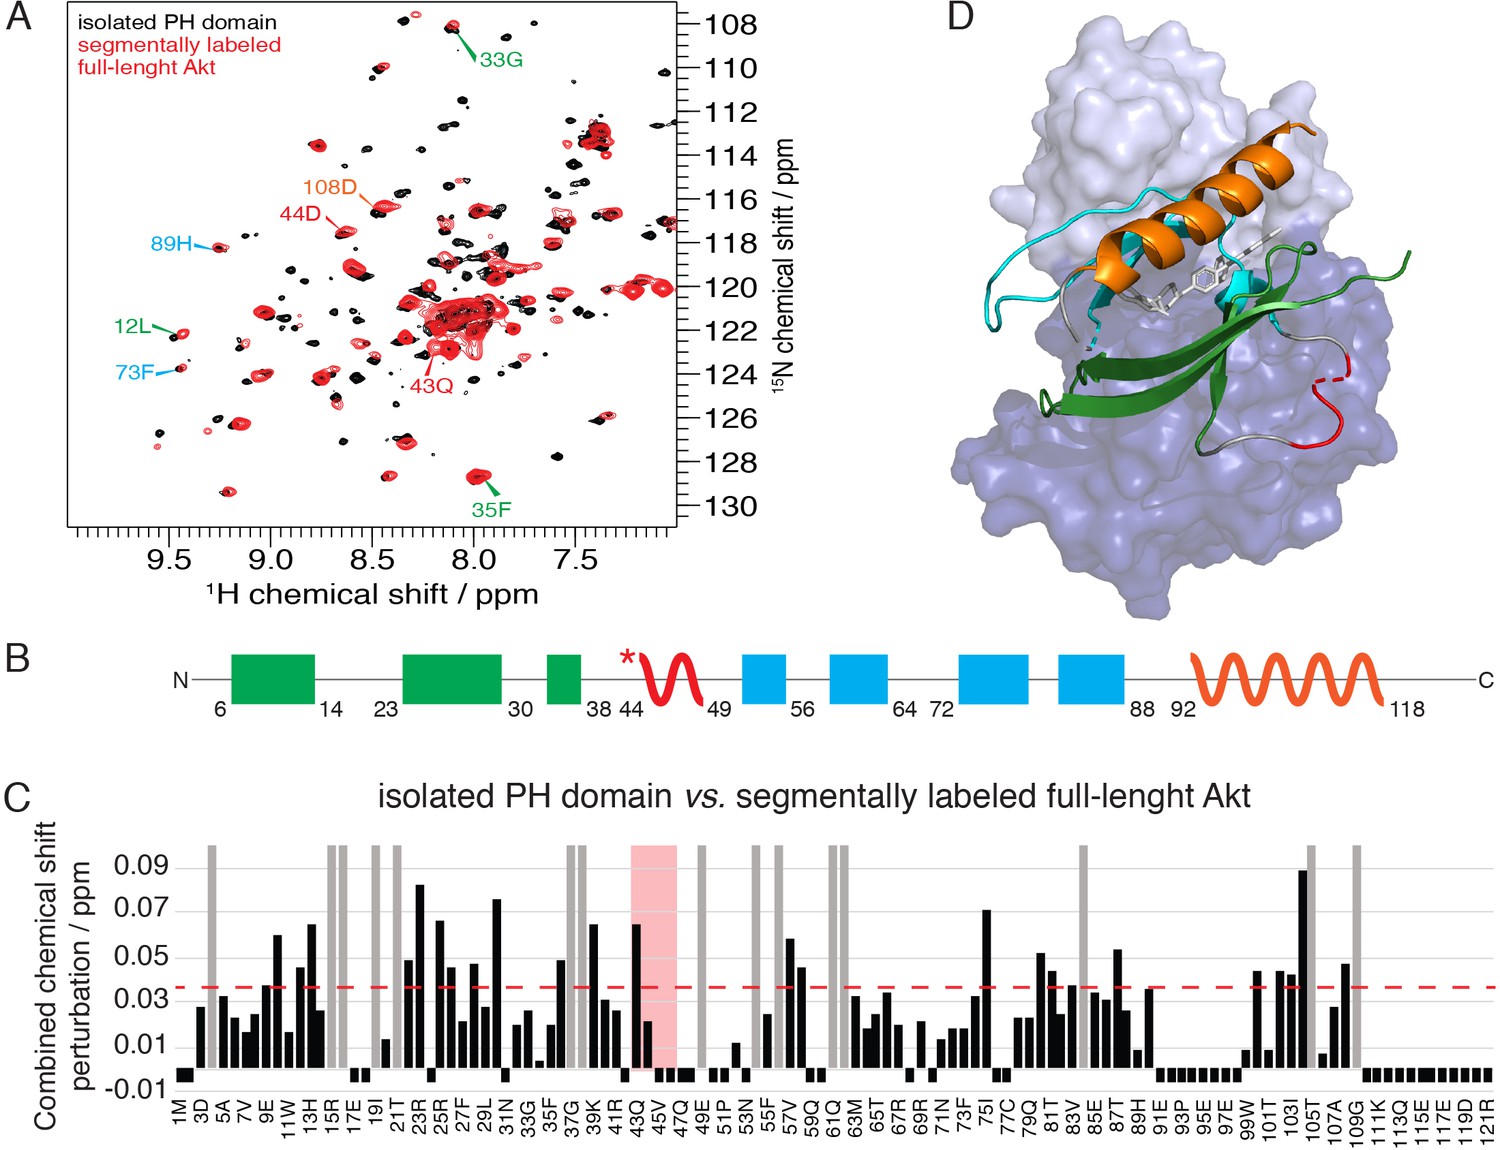
(A) Schematic representation of the semisynthesis strategy. (B) Alignment of Akt1 (aa 118–127) and Akt2 (aa 119–129) linkers with Akt1 Ser122 (ligation site, mutated to Cys in our study) and Akt2 Cys124 highlighted (red). (C–D) SDS-PAGE analyses of EPL reaction between S122C, Δ121, pThr308, pSer473 Akt fragment and isotopically labeled PH thioester fragment (C); and segmentally isotopically labeled pThr308, pSer473 full-length Akt purified from (C) using size exclusion chromatography (D), lanes 2–4: purified full-length Akt diluted 10-fold from stock, loaded volumes are 2.5, 5 and 10 µl, respectively, lanes 5–9: BSA standards 0.25, 0.5, 1, 2, 4 µg, dashed line: deletion of unrelated samples. M: protein markers (kDa).
Figure 3—figure supplement 1
Generation of segmentally 15N, 13C, 2H isotopically labeled Akt proteins.
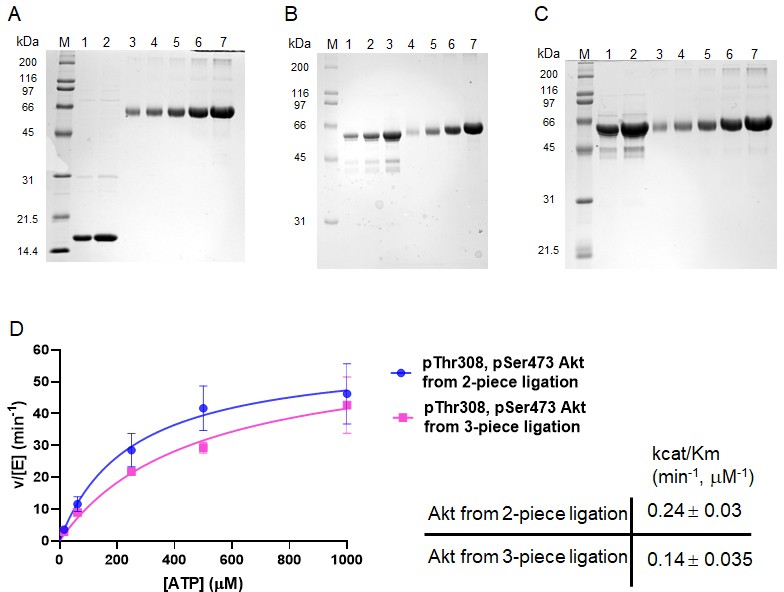
(A) 15N, 13C, 2H isotopically labeled PH domain purified from 1 L of E. coli expression, diluted 20-fold, and loaded 5 and 10 µl (lanes 1–2); lanes: 3–7. (B–C) Pure segmentally isotopically labeled full-length pThr308 Akt proteins with non-p C-tail (B, lanes 1–3: 2.5, 5, 10 µl) and di-pSer477/pThr479 (C, lanes 1–2: 5, 10 µl) diluted 10-fold; lanes 4–7: BSA standards. (D) Steady-state kinetic plots v/[E] versus [ATP] with 20 µM GSK3 peptide for semisynthetic pThr308, pSer473 Akt proteins from two-piece (blue) and three-piece (magenta) expressed protein ligation strategies, n = 2. Note that, Akt protein obtained from three-piece ligation is lacking the N-terminal tags: Flag, HA and 6xHis. The obtained catalytic efficiencies (apparent kcat/Km values) expressed in the table (right) from at least two independent repeats performed for each assay, S.D. shown.
Figure 4

NMR reveals differences in the PH domain dependent on C-tail phospho states.
(A) Overlay of 15N-1H HSQC spectra of the PH domain in the context of full-length semisynthetic Akt with non-phosphorylated C-tail (blue) and pSer473 (red). Select residue-specific assignments are shown. (B) Overlay of 15N-1H HSQC spectra of the PH domain in the context of full-length semisynthetic Akt with non-phosphorylated C-tail (blue) and pSer477/pThr479 (green). Select residue-specific assignments are shown. (C) Expanded spectra around the peaks assigned to Ile6, Gln43, Asp44, Thr65 and Thr101. Overlay of all three spectra, same color coding. Arrows indicate chemical shift perturbations. Note that contour levels have been plotted lower for the non-p-C Gln43 and pSer477/pThr479 Asp44 peaks.
Figure 5 with 3 supplements
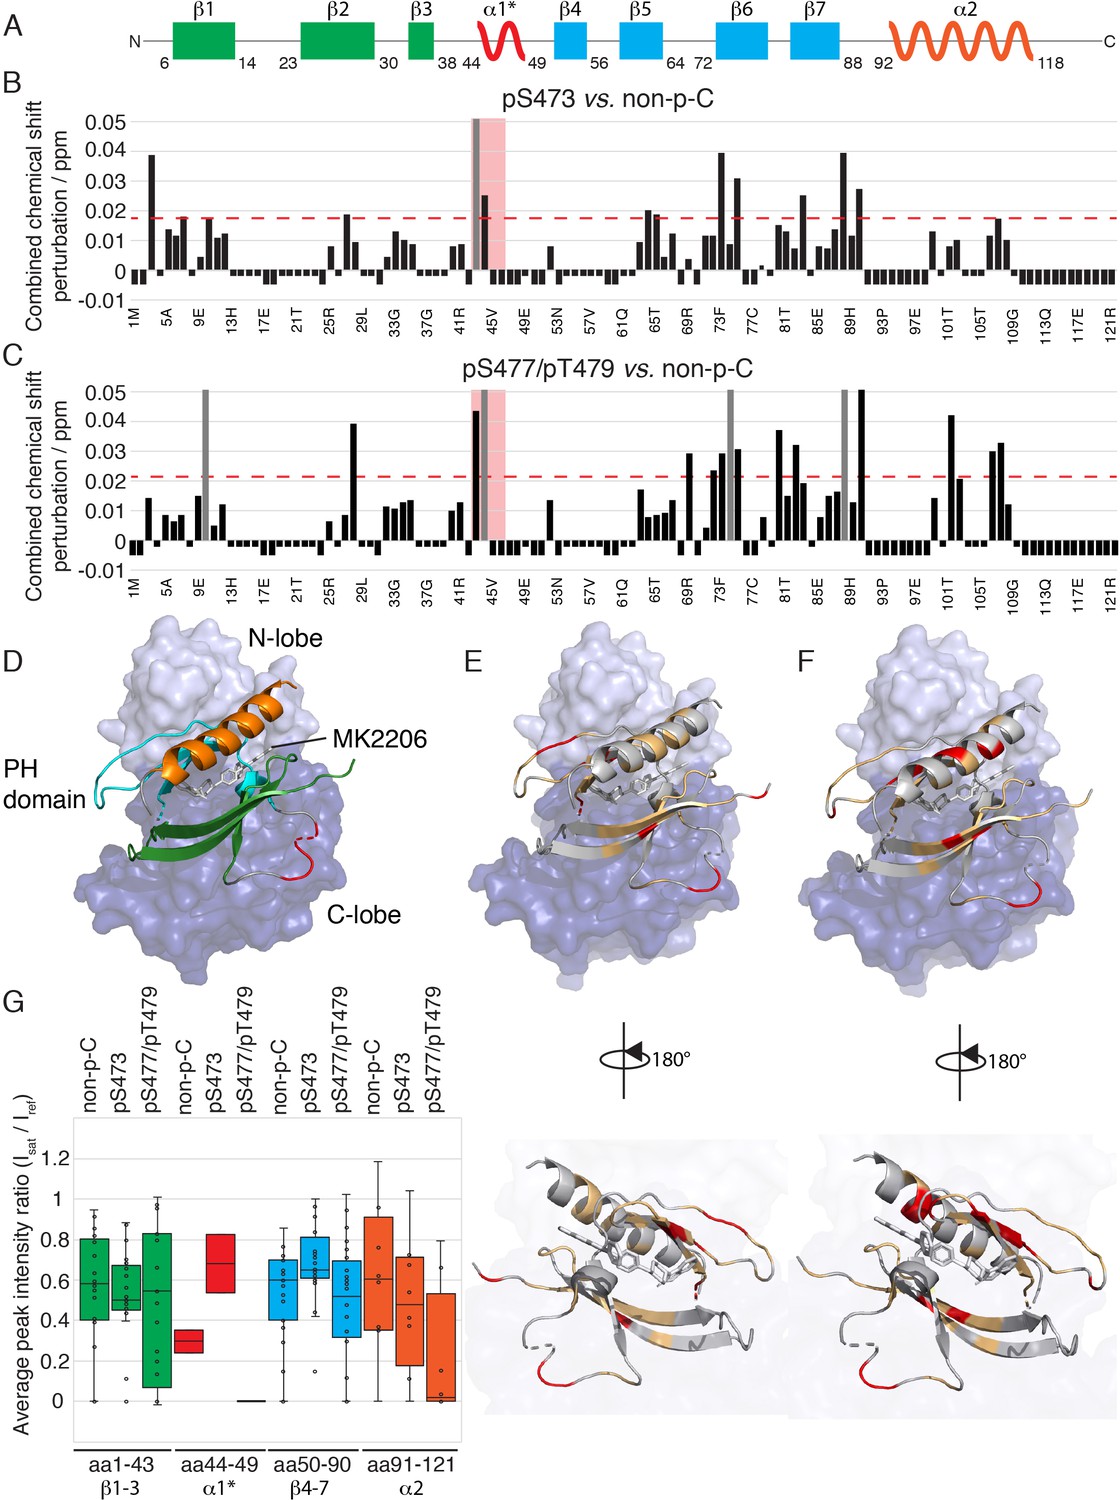
The PH domain of Akt interacts with the kinase domain differently depending on C-tail phosphorylations.
(A) Cartoon representation of secondary structure elements (rectangle for β-strands, zigzag for α-helices) in Akt PH domain. Color coding represents regions with distinct binding modes to the kinase domain. Star indicates that the α-helix is present only when Akt is bound to IP4. (B–C) Combined chemical shift perturbations derived from spectra in Figure 4 and plotted along the PH domain primary sequence for pSer473 (B) and pSer477/pThr479 (C) referenced to non-p-C. Dashed red line corresponds to the standard deviation to the mean, excluding outliers (higher than 3xStDev). Grey bars indicate peaks that disappeared from the spectrum, also indicating strong interaction. Red area highlights the short hinge primarily studied here. Negative bars (−0.05) indicate non-assigned residues, negative bars (−0.025) indicate residues which assignment could not be easily transferred or recovered in the context of full-length Akt. (D) Structure of allosteric drug inhibited Akt (PDB: 3O96, [Wu et al., 2010]) with PH domain as ribbon in the front and kinase domain as surface in the back (N-lobe in light blue, C-lobe in dark blue). Color coding of secondary structure elements in the PH domain corresponds to (A). Allosteric inhibitor MK2206 is displayed in white. Main Akt domains are labeled. (E–F) Same structure representation as in (D) with the most significantly affected residues (chemical shift perturbations higher than the standard deviation) colored in red in the PH domain in case of pSer473 (E) and pSer477/pThr479 (F). Non-affected residues are shown in light orange and non-assigned residues in grey. Representations rotated by 180° are shown. (G) Statistical bar and whisker plots of saturation transfer efficiencies from CST data (Figure 5—figure supplement 3) for each C-tail phospho-state, categorized and color coded according to secondary structure elements as in (A) and (D). A ratio of 0 indicates maximum saturation transfer efficiency (very tight interaction) whereas a ratio of 1 indicate no saturation transfer (no interaction).
Figure 5—figure supplement 1
The PH domain of Akt is significantly affected in the context of full-length Akt.
(A) 15N-1H HSQC spectra of the isolated PH domain (black) and the PH domain in the context of full-length semisynthetic Akt with pS473 C-tail (red). Select residue-specific assignments are shown, color coded according to (B). (B) Cartoon representation of secondary structure elements (rectangle for β-strands, zigzag for α-helices) in Akt PH domain. Color coding represents regions with distinct binding modes to the kinase domain. Star indicates that the α-helix is present only when Akt is bound to IP4. (C) Combined chemical shift perturbations derived from spectra in (A) and plotted along the PH domain primary sequence. Dashed red line corresponds to the standard deviation to the mean, excluding outliers (higher than 3xStDev). Grey bars indicate peaks that disappeared from the spectrum, also indicating strong interaction. Red area highlights the short hinge primarily studied here. Negative bars (−0.05) indicate non-assigned residues. (D) Structure of allosteric drug-inhibited Akt (PDB: 3O96, [Wu et al., 2010]) with PH domain as carton on top and kinase domain as surface in the back. Color coding of secondary structure elements in the PH domain corresponds to (B). Allosteric inhibitor MK2206 is displayed in white.
Figure 5—figure supplement 2

Akt kinase domain and inositol phosphates compete for interaction with PH domain.
(A–B) 15N-1H HSQC spectra of the isolated PH domain (black) in the absence and in the presence of kinase domain (A, red) or IP6 (B, red). Select residue-specific assignments are shown, color coded according to (C). (C) Cartoon representation of secondary structure elements (rectangle for β-strands, zigzag for α-helices) in Akt PH domain. Color coding represents regions with distinct binding modes to the kinase domain. Star indicates that the α-helix is present only when Akt is bound to IP4. (D–E) Combined chemical shift perturbations derived from spectra in (A–B) and plotted along the PH domain primary sequence for PH domain in the presence of kinase domain (D) or IP6 (E), respectively, referenced to the isolated PH domain. Dashed red line corresponds to the standard deviation to the mean, excluding outliers (higher than 3xStDev). Grey bars indicate peaks that disappeared from the spectrum, also indicating strong interaction. Red area highlights the short hinge primarily studied here. Negative bars indicate non-assigned residues. (F–G) Crystal structures of the isolated PH domain (F, PDB:1UNP) and IP4-bound PH domain (G, PDB: 1UNQ) (Milburn et al., 2003). IP4 is shown in magenta. The short hinge shown in red is folded as a short α-helix. (H) Structure of allosteric drug-inhibited Akt (PDB:3O96, [Wu et al., 2010]) with PH domain as a ribbon cartoon and the kinase domain as a surface representation (purple). The allosteric inhibitor MK2206 is displayed in white. It is evident that IP4 and the kinase domain partially overlap in their interactions with the PH domain.
Figure 5—figure supplement 3
Cross-saturation transfer NMR analysis of the the PH-kinase domain interactions.
(A–C) 15N-1H cross-saturation transfer spectra of the deuterated PH domain in the context of the semisynthetic full-length protonated Akt. Spectra where the kinase domain’s protons have been saturated are shown in red and their unsaturated reference in black for the non-phosphorylated C-tail (A), pSer473 (B) and pSer477/pThr479 (C) forms, respectively. Select residue-specific assignments are shown, color coded according to (E). (D) Structure of allosteric drug-inhibited Akt (PDB:3O96, [Wu et al., 2010]) with the PH domain as a ribbon cartoon on top and the kinase domain as a surface representation in the back. Color coding of secondary structure elements in the PH domain corresponds to (E). Allosteric inhibitor MK2206 is displayed in white. (E) Cartoon representation of secondary structure elements (rectangle for β-strands, zigzag for α-helices) in Akt PH domain. Color coding highlights regions with distinct binding modes to the kinase domain. Star indicates that the α-helix is present only when Akt is bound to IP4. (F–H) Saturation transfer efficiency derived from (A–C) plotted as the ratio of peak intensities of saturated over unsaturated spectra against the PH domain primary sequence for non-p (F), pSer473 (G) and pSer477/pThr479 (H) forms, respectively. A ratio of 0 indicates maximum saturation transfer efficiency, whereas a ratio of 1 indicate no saturation transfer. An indicative dashed red line has been drawn at 0.5. Red area highlights the short hinge primarily studied here. Negative ratios indicate non-assigned residues. Residues that were not present in 70% 2H2O have ratios set to 0.
Figure 6 with 1 supplement

A short hinge 44–46 aa in the PH domain governs Akt activation using a two-pronged approach.
(A) Steady-state kinetic plots v/[E] versus [ATP] with 20 µM GSK3 peptide for semisynthetic pThr308 Akt proteins WT (blue) versus D44G/V45P/D46G (GPG) mutant with non-P C-tail (left), pSer473 (middle) and pSer477/pThr479 (right), n = 2. (B) Catalytic efficiencies (apparent kcat/Km values) for each semisynthetic Akt phospho form of WT (left) and GPG mutant (right) obtained from kinase assays in (A), two independent repeats were performed for each assay, S.D. shown. (C) Cellular analysis of the effect of GPG mutant on Akt phosphorylation. Left, Akt and GAPDH antibodies western blot of cell lysate at different time points after stimulation, as indicated, Neg.: non-transfected cells stimulated with insulin/IGF-1; (-): transfected with DNA plasmid but not stimulated with insulin/IGF-1 (left). Right, quantification of Akt Thr308 phosphorylation level (blue for WT and green for GPG mutant) using ImageJ2 (n = 5, SEM shown, 0.01 < p < 0.05). (D) Time course kinase assay for PDK1-catalyzed Akt Thr308 phosphorylation (schematic illustration). Left, western blot of semisynthetic pSer473 Akt (WT or GPG) after incubation with PDK1 for different times, as indicated. Right, corresponding calculated half-time of completion obtained from two independent repeats and S.D. shown.
Figure 6—figure supplement 1
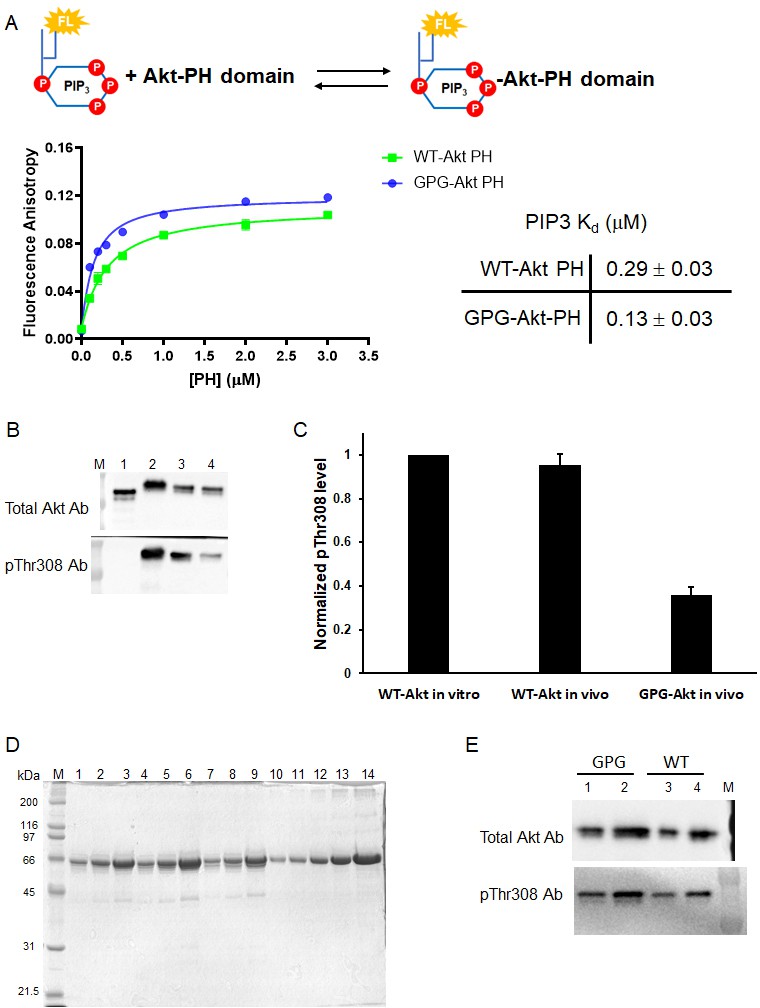
A short hinge 44-46 aa affects Thr308 phosphorylation but not PIP2 affinity.
(A) Fluorescence anisotropy measurements of Akt PH domains WT and GPG mutant with fluorescein-labeled soluble PIP3 (n = 2). The obtained PIP3 Kd values expressed in the table (right) with S.D. shown. (B) Western blot analysis of pThr308 level for WT and GPG-Akt with pThr308 obtained from Sf9 co-expressed Akt(aa 1–459)-MxeIntein-CBD and GST-PDK1, and treated with okadaic acid (in vivo pThr308). Lane 1: truncated Akt(aa 2–459) without pThr308, lane 2: full-length WT Akt following in vitro PDK1-catalyzed pThr308 (WT-Akt in vitro), lane 3: full-length WT Akt pThr308 obtained with PDK1 co-expression and okadaic acid treatment (WT-Akt in vivo), lane 4: full-length GPG Akt mutant with in vivo pThr308 (GPG-Akt in vivo). (C) Quantification of western blot intensities in (B). (D) Semisynthesis of pThr308 GPG-Akt proteins with pSer473 (lanes 1–3), dual-pSer477/pThr479 (lanes 4–6) and non-p C-tail (lanes 7–9), lanes 10–14: BSA standards. Regarding to partial GPG-Akt Thr308 phosphorylation shown in (B) and (C), truncated GPG-Akt(aa 1–459) thioester fragment was further treated with PDK1 in in vitro kinase reaction to reach similar pThr308 level for WT-Akt. (E) Western blot analysis of pThr308 level for GPG (lanes 1–2, obtained from D) and WT (lanes 3–4) Akt proteins with pSer473 with different loading amounts 25 ng (lanes 1, 3) and 50 ng (lanes 2, 4).
Figure 7 with 1 supplement
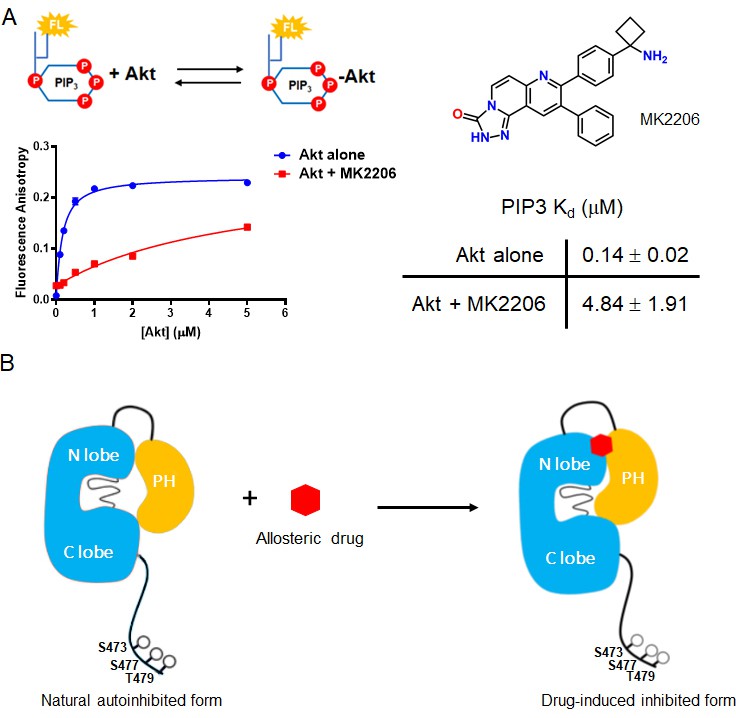
The allosteric drug-induced Akt inhibited form is distinct from its native autoinhibited form.
(A) Binding assays of phospholipid PIP3 with full-length Akt in presence of 20 µM MK2206. Chemical structure of MK2206 is shown on the right. The fluorescence anisotropy measurements (n = 2) were carried out and fit to quadratic binding isotherms, and Kd values shown ± S.D. (B) Cartoon model illustrated the distinct conformational structure of PH domain of allosteric drug-bound Akt when compared to that of natural autoinhibited form.
Figure 7—figure supplement 1
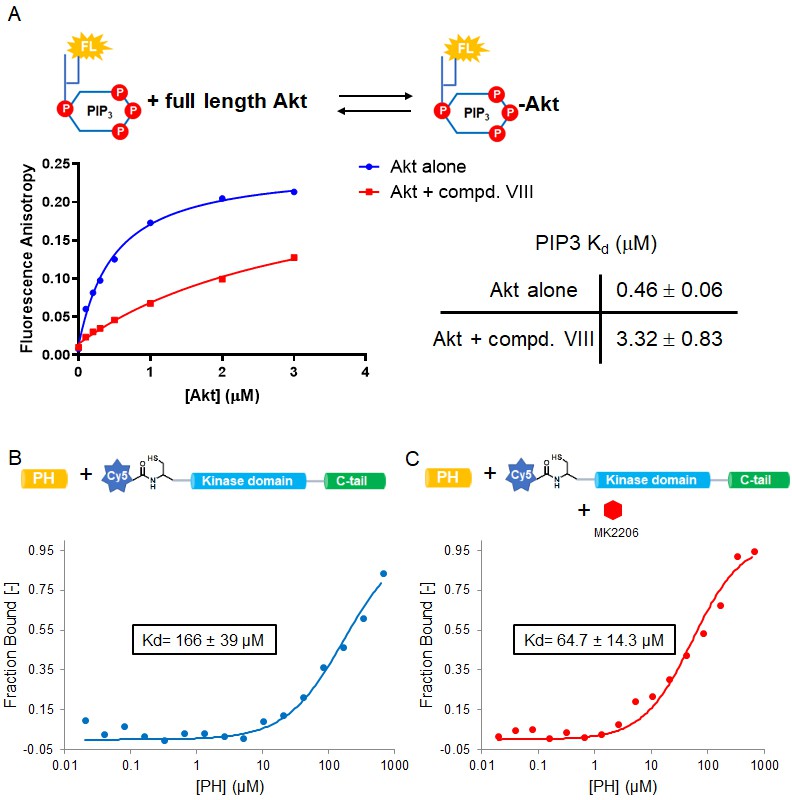
Allosteric inhibitors glue PH and kinase domains together and compete with PIP3.
(A) Binding assays of soluble phospholipid PIP3 with full-length Akt in presence of 10 µM compound VIII (compd. VIII), fluorescence anisotropy measurements (n = 2) were carried out and fit to quadratic binding isotherms, and Kd values shown ± S.D. (B–C) MST measurements (n = 2) for trans-binding of varied amounts of PH domain with N-terminally Cy5-labeled Akt (aa 122–480) fragment without (B) and with 20 µM MK2206 (C), the obtained Kd values expressed in the inset boxes, S.D. shown.
Figure 8
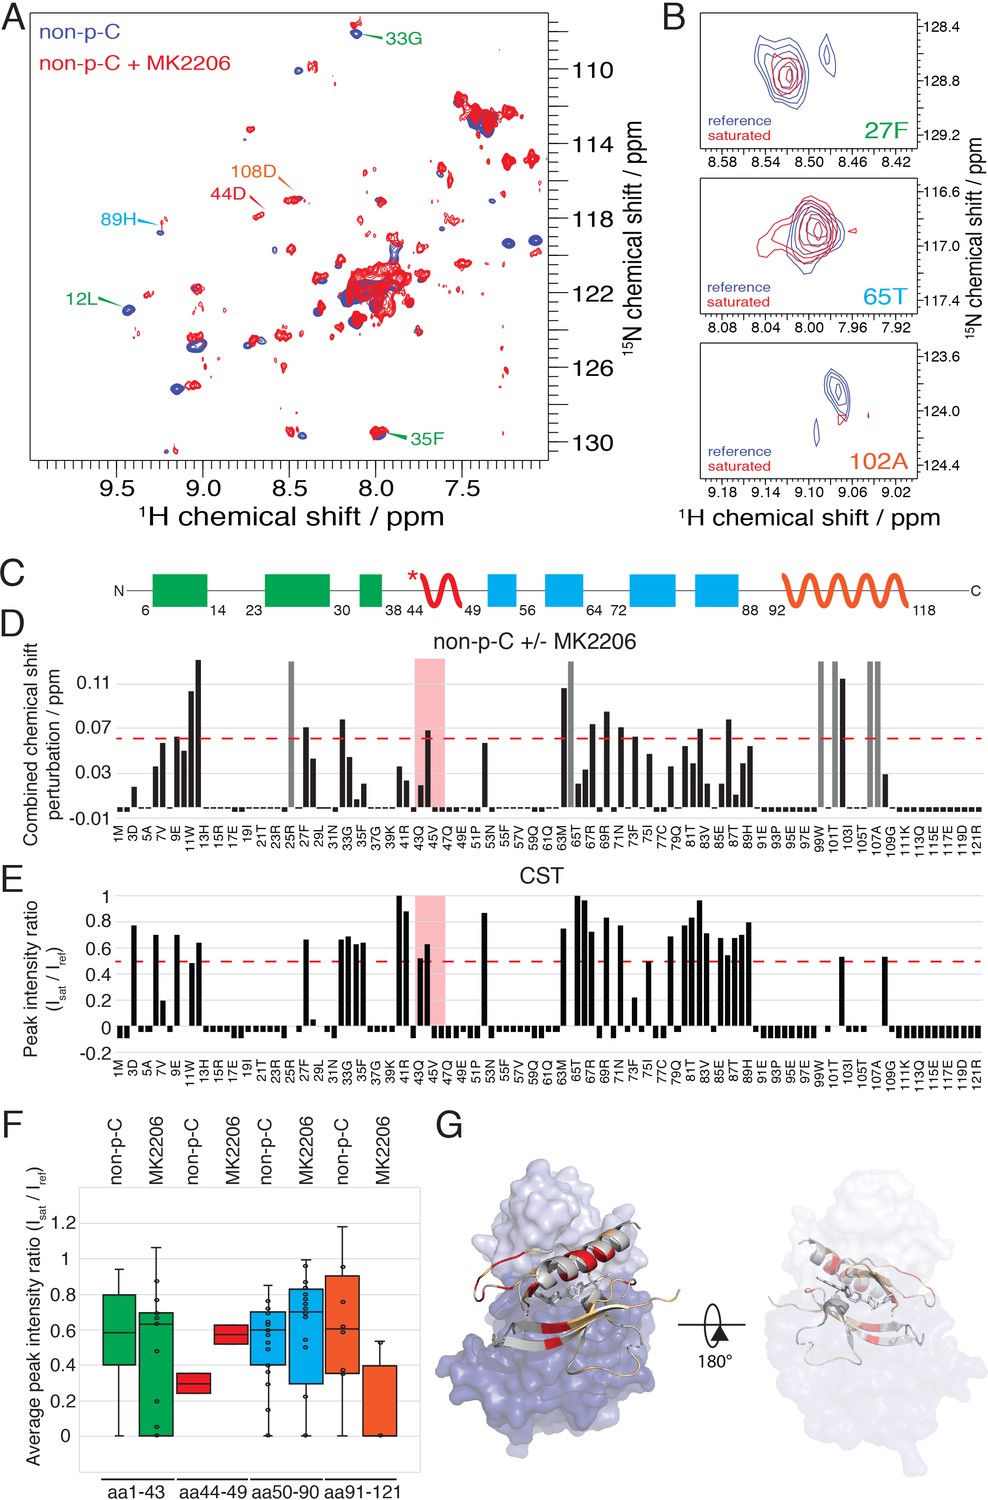
The allosteric drug-induced Akt inhibited form is distinct from its native autoinhibited form.
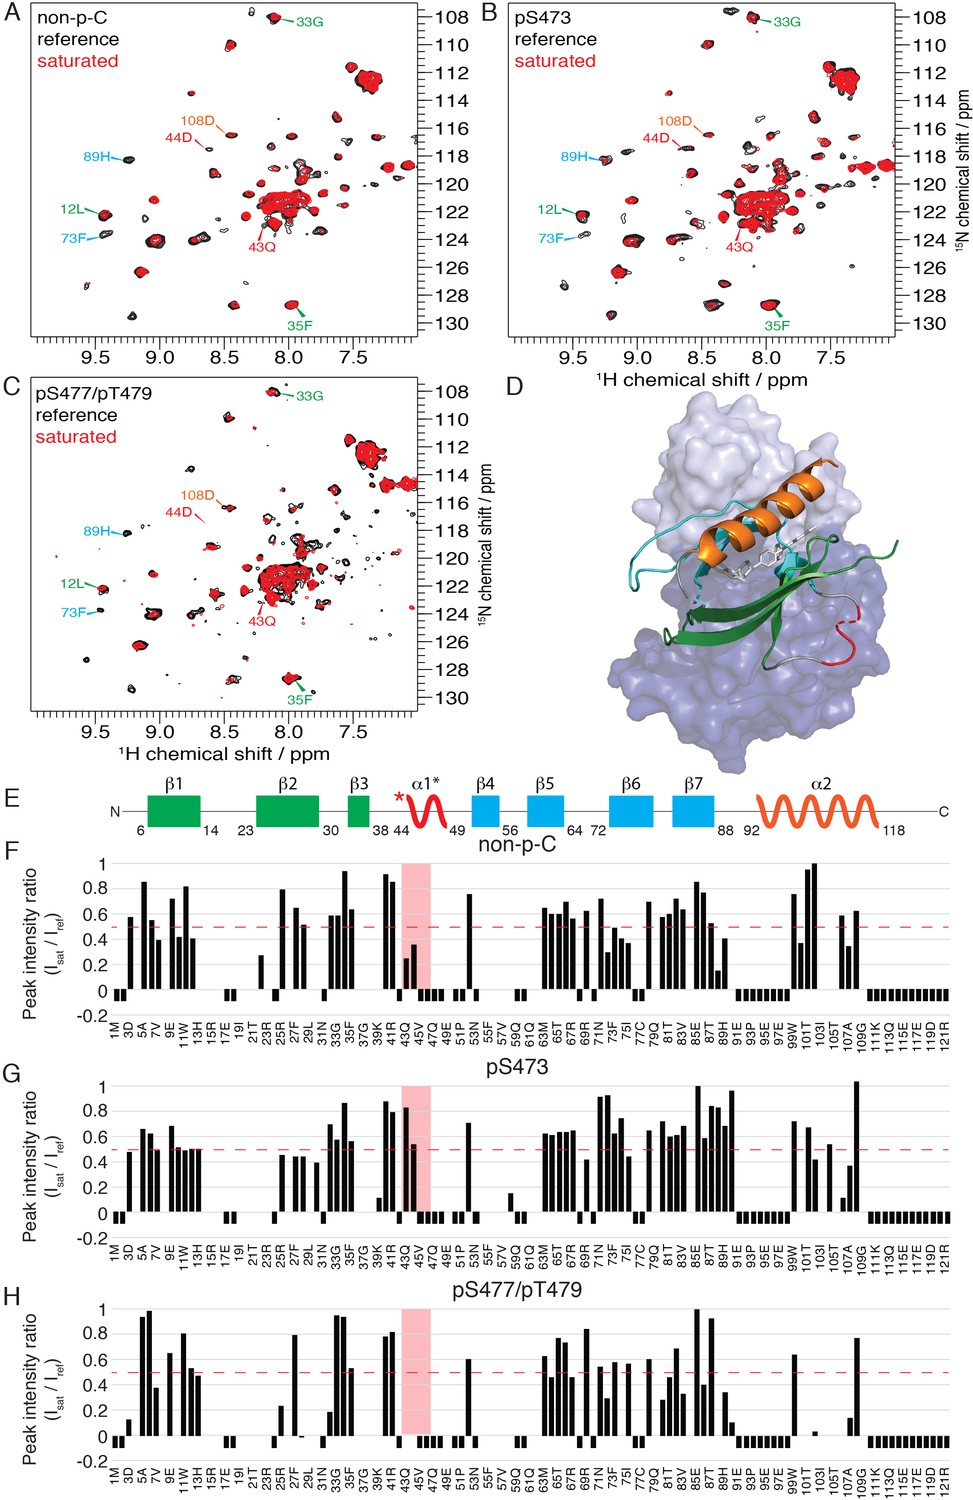
(A) Overlay of 15N-1H HSQC spectra of the PH domain in the context of full-length semisynthetic Akt with non-phosphorylated C-tail in the presence of the allosteric inhibitor MK2206 (red) or in its absence (blue). Select residue-specific assignments are shown. (B) Expanded 15N-1H HSQC cross saturation transfer (CST) spectra around the peaks assigned to Phe27, Thr65 and Ala102. Reference (unsaturated) spectrum is shown in blue and its saturated counterpart in red. (C) Cartoon representation of secondary structure elements (rectangle for β-strands, zigzag for α-helices) in Akt PH domain. Color coding represents regions with distinct binding modes to the kinase domain. Star indicates that the α-helix is present only when Akt is bound to IP4. (D) Combined chemical shift perturbations corresponding to spectra in (A) plotted along the primary sequence for the PH domain in the context of semisynthetic full-length Akt with non-p C-tail with MK2206, referenced to the control without drug. Dashed red line corresponds to the standard deviation to the mean, excluding outliers (higher than 3xStDev). Grey bars indicate peaks that disappeared from the spectrum, also indicating strong interaction. Red area highlights the short hinge primarily studied here. Negative bars (−0.05) indicate non-assigned residues, negative bars (−0.025) indicate residues which assignment could not be easily transferred or recovered in the context of full-length Akt. (E) Saturation transfer efficiency derived from spectra in (B) plotted as the ratio of peak intensities of saturated over unsaturated spectra against the PH domain primary sequence. A ratio of 0 indicates maximum saturation transfer efficiency (very tight interaction), whereas a ratio of 1 indicate no saturation transfer (no interaction). An indicative dashed red line has been drawn at 0.5. Red area highlights the short hinge primarily studied here. Negative ratios (−0.05) indicate non-assigned residues, negative ratios (−0.025) indicate residues that were not present in 70% 2H2O spectra. (F) Statistical bar and whisker plots of saturation transfer efficiencies from CST data (B,E), categorized and color coded according to secondary structure elements as in (C). (G) Structure of allosteric drug inhibited Akt (PDB: 3O96, [Wu et al., 2010]) with PH domain as ribbon in the front and kinase domain as surface in the back (N-lobe in light blue, C-lobe in dark blue). Significantly affected residues (chemical shift perturbations higher than the standard deviation) are colored in red. Non-affected residues are shown in light orange and non-assigned residues in grey. A representation rotated by 180° is shown.
Tables
Key resources table
| Reagent type (species) or resource | Designation | Source or reference | Identifiers | Additional information |
|---|---|---|---|---|
| Gene (human) | Akt1 | Addgene and DOI:10.1093/nar/gkh238 | Addgene # 9021 | |
| Strain, strain background (E. coli) | Rosetta 2(DE3) pLysS | Novagen | Cat. No.: 71400 | Competent cells |
| Strain, strain background (E. coli) | DH10Bac | Invitrogen | Cat. No.: 18297010 | Competent cells |
| Cell line (insect cell) | Sf21 | Invitrogen | 11497–013 | |
| Cell line (insect cell) | f9 | Invitrogen | 11496–015 | |
| Cell line (human) | Akt1/2-/- HCT116 | DOI:10.1073/pnas.0914018107 | Colon cancer cell line; The Akt1-/-and Akt2-/-HCT116 colon cancer cell line was a gift from Dr. Bert Vogelstein (Johns Hopkins University) (Ericson et al., 2010). These cells were authenticated by western blot showing the absence of Akt and by the lack of signaling response to growth factors. They were also shown to be mycoplasma-free by PCR testing. | |
| Antibody | pan-Akt (11E7) (Rabbit monoclonal) | Cell Signaling Technology | Cat. No.: 4685S, RRID:AB_10698888 | WB (1:1000 for cell-based assays; 1:20000 for activation assays) |
| Antibody | Akt phospho-Thr308 (D25E6) (Rabbit monoclonal) | Cell Signaling Technology | Cat. No.: 13038S, RRID:AB_2629447 | WB (1:1000, for cell-based assays; 1:10000 for activation assays) |
| Antibody | Akt phospho-Ser473 [EP2109Y] (Rabbit monoclonal) | AbCam | Cat. No.: ab81283, RRID:AB_2224551 | WB (1:1000) |
| Antibody | GAPDH (14C10) (Rabbit monoclonal) | Cell Signaling Technology | Cat. No.: 2118S, RRID:AB_561053 | WB (1:5000) |
| Antibody | HRP conjugated, anti-Rabbit IgG (Goat monoclonal) | Cell Signaling Technology | Cat. No.: 7074S, RRID:AB_2099233 | WB (1:5000) |
| Chemical compound, drug | Deuterium oxide (D, 99.8%) | Cambridge Isotope Laboratories | DLM-4–99.8-1000 | |
| Chemical compound, drug | Ammonium chloride (15N, 99%) | Cambridge Isotope Laboratories | NLM-467–1 | |
| Chemical compound, drug | D-Glucose (U-13C6, 99%; 1,2,3,4,5,6,6-D7, 97–98%) | Cambridge Isotope Laboratories | CDLM-3813–2 | |
| Chemical compound, drug | Celtone base powder (13C, 98%+; D, 97%+; 15N, 98%+) | Cambridge Isotope Laboratories | CGM-1030P-CDN-1 | |
| Chemical compound, drug | D-Glucose (U-13C6, 99%) | Cambridge Isotope Laboratories | CLM-1396–2 | |
| Chemical compound, drug | 20 Fmoc-amino acids, Fmoc-Ser(HPO3Bzl)-OH, and Fmoc-Thr(HPO3Bzl)-OH | P3Bio systems | ||
| Chemical compound, drug | Sulfo-Cy5-NHS ester | Lumiprobe | Cat. No.: 43320 | |
| Chemical compound, drug | 32P-ATP | Perkin Elmer | Cat. No.: NEG002Z2-50UC | |
| Chemical compound, drug | Pierce avidin | Thermo Scientific | Cat. No.: 21128 | |
| Chemical compound, drug | Recombinant human insulin | Thermo Scientific | Cat. No.: 12585014 | |
| Chemical compound, drug | Human insulin-like growth factor 1 (hIGF-1) | Cell Signaling Technology | Cat. No.: 8917SC | |
| Software, algorithm | ImageJ2 | DOI:10.1186/s12859-017-1934-z | ||
| Software, algorithm | GraphPad Prism version 8.2.1 | GraphPad | ||
| Software, algorithm | NmrPipe | DOI:10.1007/BF00197809 | ||
| Software, algorithm | CCPNmr Analysis version 2.4 | DOI:10.1002/prot.20449 | ||
| Software, algorithm | hmsIST | DOI:10.1007/s10858-012-9611-z | ||
| Software, algorithm | Topspin version 3.6 | Bruker |
Additional files
Download links
A two-part list of links to download the article, or parts of the article, in various formats.
Downloads (link to download the article as PDF)
Open citations (links to open the citations from this article in various online reference manager services)
Cite this article (links to download the citations from this article in formats compatible with various reference manager tools)
The structural determinants of PH domain-mediated regulation of Akt revealed by segmental labeling
eLife 9:e59151.
https://doi.org/10.7554/eLife.59151


