HetL, HetR and PatS form a reaction-diffusion system to control pattern formation in the cyanobacterium nostoc PCC 7120
- Aix Marseille Univ, CNRS, LCB, Laboratoire de Chimie Bactérienne, France
- Aix Marseille Univ, CNRS, Protein Expression Facility, Institut de Microbiologie de la Méditerranée, France
- Université de Lorraine, INRAE, DynAMic, France
Figures
Figure 1 with 1 supplement
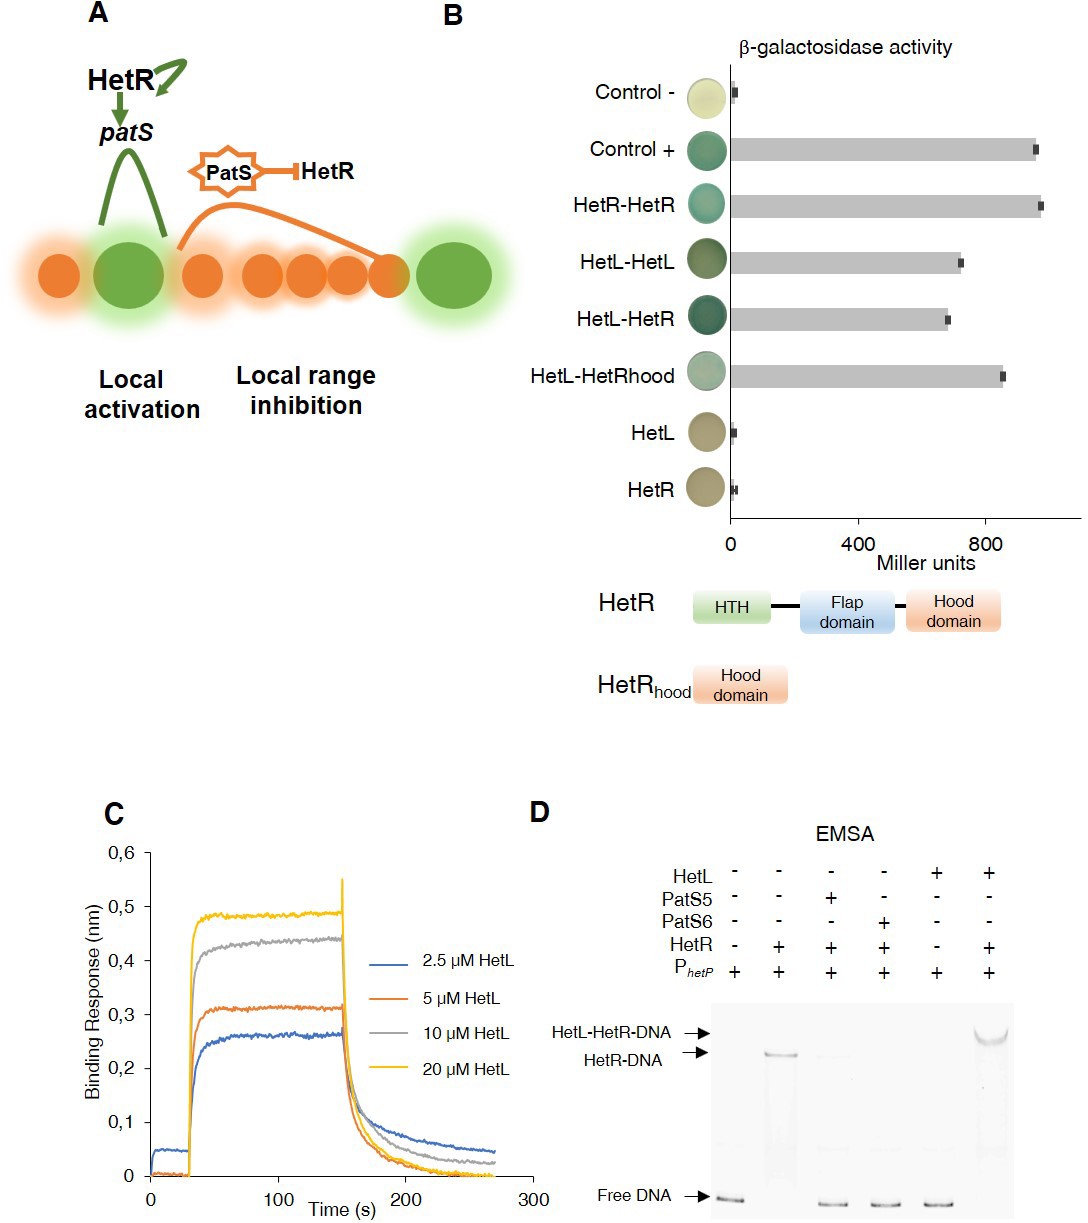
Patterning model and HetL/HetR interaction.
(A) Self-organized patterning in Nostoc Heterocysts are presented in green. Vegetative cells in brown. The width of the shade around the cells represents the strength of the activation/inhibition. Processed PatS is framed by a star. (B) (upper) Bacterial two hybrid assay between HetL and HetR. BTH101 strain was transformed with pKT25-hetL and pUT18C-HetR, β-galactosidase activities were measured as described in section ‘Materials and methods’ and were expressed in Miller units. Strains producing the T18 with T25 (control -), T25-HetR with T18 (HetR) and T25 with T18-HetL (HetL) served as negative controls. Strains producing T18-Zip and T25-Zip served as positive control (control +). Error bars indicate standard deviation. The characteristics of the fusion proteins used in this assay are indicated below: HetR-HetR: T25-HetR/T18-HetR; HetL-HetL: T25-HetL/T18-HetL; HetL-HetR: T25-HetL/T18-HetR; HetL-HetRhood: T25-HetL/HetRhood-T18; HetL: T25-HetL/T18; HetR: T25/T18-HetR. (lower) Domains organization of HetR: Helix-turn-helix domain, flap domain and hood domain. (C) BLi assay between HetL and HetR. 2.2 µM of biotinylated HetR was loaded onto streptavidin biosensors. A 30 s baseline in PBS was performed before a 120 s association step with various concentrations of HetL at 2.5, 5, 10 and 20 µM followed by a 120 s dissociation step. Each curve represents the average of two experiments minus the control experiment. As a negative binding control, HetL 20 µM was added to the empty biosensor devoid of HetR. (D) EMSA assay of HetR (1 µM) with the hetP promoter (50 nM) in the presence of or PatS-5 or PatS-6 (1 µM) and HetL (4 µM). The hetP promoter incubated alone served as negative control (free DNA) and HetL plus DNA as a specific control for the binding activity of HetR.
-
Figure 1—source data 1
Source data to Figure 1B.
(upper) Bacterial two hybrid assay between HetL and HetR. BTH101 strain was transformed with pKT25-HetL and pUT18C-HetR, β-galactosidase activities were measured.
- https://cdn.elifesciences.org/articles/59190/elife-59190-fig1-data1-v2.xlsx
-
Figure 1—source data 2
Source data to Figure 1C.
BLi assay between HetL and HetR. 2.2 µM of biotinylated HetR was loaded onto streptavidin biosensors. A 30 s baseline in PBS was performed before a 120 s association step with various concentrations of HetL at 2.5, 5, 10 and 20 µM followed by a 120 s dissociation step.
- https://cdn.elifesciences.org/articles/59190/elife-59190-fig1-data2-v2.xlsx
Figure 1—figure supplement 1
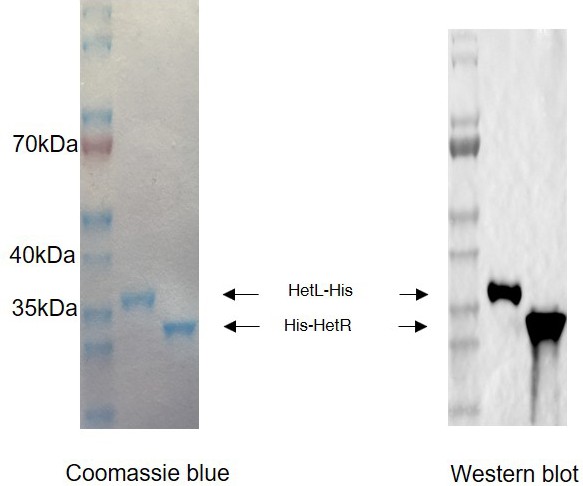
Purified HetL and HetR proteins.
(left) 1 µg purified proteins migrated in 4–20% gel (Nusep) colored by instant blue. (right) Anti-Histidine immunoblot analysis of 1 µg purified proteins.
Figure 2 with 3 supplements
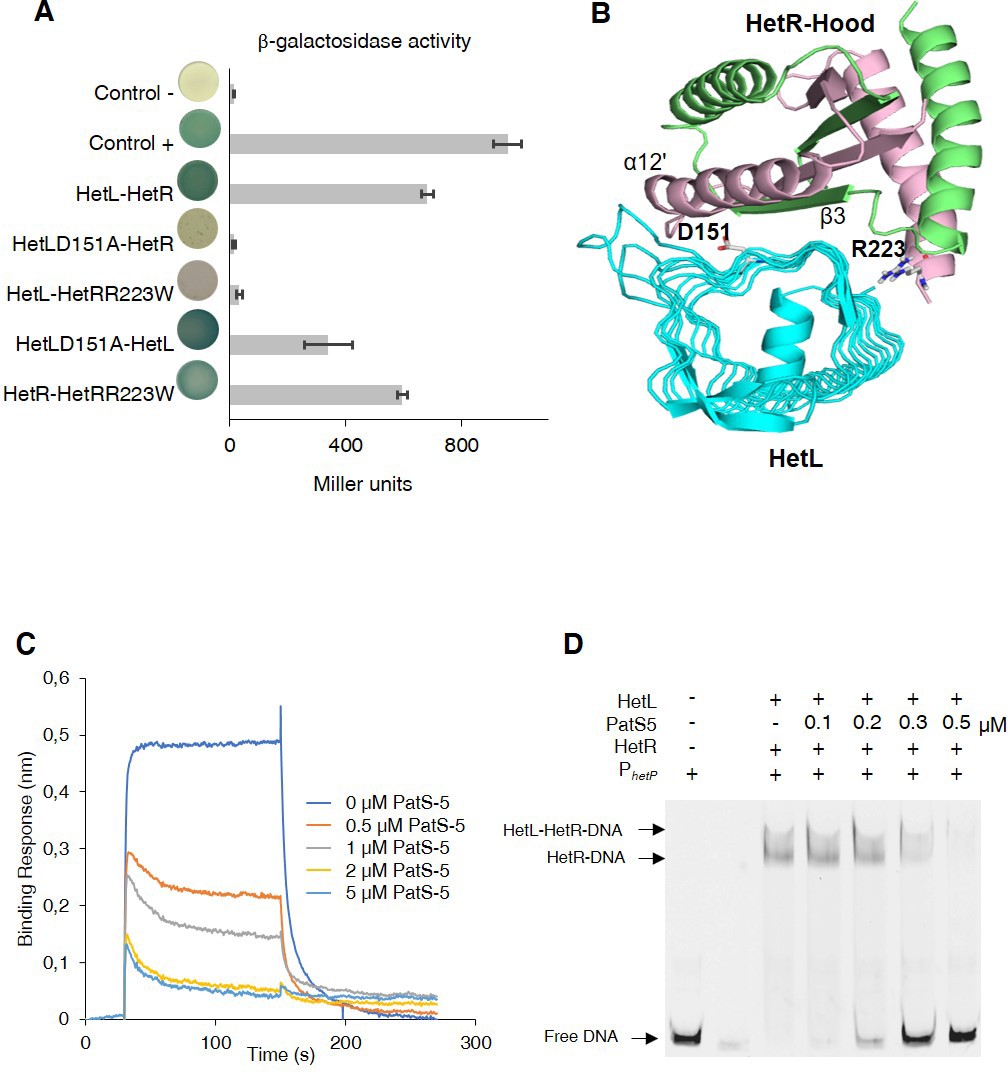
HetL-HetR interaction interface.
(A) Bacterial two hybrid assay between HetL and HetR. β-galactosidase activities were measured as described in section ‘Materials and methods’ and were expressed in Miller units. Strains producing the T18 and T25 served as negative control (control -). Strains producing T18-Zip and T25-Zip served as positive control (control +). Error bars indicate standard deviation. The characteristics of the fusion proteins used in this assay are indicated below: HetL-HetR: T25-HetL/T18-HetR; HetLD151A-HetR: T25-HetLD151A/T18-HetR; HetL-HetRR223W: T25-HetL/T18-HetRR223W; HetLD151A-HetL: T25-HetLD151A/T18-HetL; HetR-HetRR223W: T25-HetR/T18-HetRR223W. (B) Model of HetR-Hood:HetL complex. Monomers of HetR-Hood dimer structure are presented in green and light pink. HetL is presented in cyan. D151 from HetL and R223 from HetR are indicated. (C) BLi assay between HetL and HetR in the presence of PatS-5. 10 µM of HetL was incubated 5 min with different concentrations of PatS at 0.5, 1, 2.5 and 5 µM before bringing HetL in contact with the bound HetR. Each curve represents the average of two experiments minus the control experiment. Control experiment HetL plus different concentrations of PatS loaded onto a biosensor devoid of HetR. (D) EMSA assay of HetL (2 µM) and HetR (1 µM) with the hetP promoter in the presence of PatS-5 at different concentrations. Note that, to distinguish the HetL/HetR-DNA and HetR-DNA complexes the concentration of HetL used in this experiment was lower than that shown in Figure 1.
-
Figure 2—source data 1
Source data to Figure 2A.
Bacterial two hybrid assay between HetL and HetR. β-galactosidase activities were measured as described in section ‘Materials and methods’ and were expressed in Miller units. Strains producing the T18 and T25 served as negative control (control -). Strains producing T18-Zip and T25-Zip served as positive control (control +).
- https://cdn.elifesciences.org/articles/59190/elife-59190-fig2-data1-v2.xlsx
-
Figure 2—source data 2
Source data to Figure 2C.
BLi assay between HetL and HetR in the presence of PatS-5. 10 µM of HetL was incubated five mins with different concentrations of PatS at 0.5, 1, 2.5 and 5 µM before bringing HetL in contact with the bound HetR. The same experiment was undergone with PatS-6 and similar results were obtained.
- https://cdn.elifesciences.org/articles/59190/elife-59190-fig2-data2-v2.xlsx
Figure 2—figure supplement 1
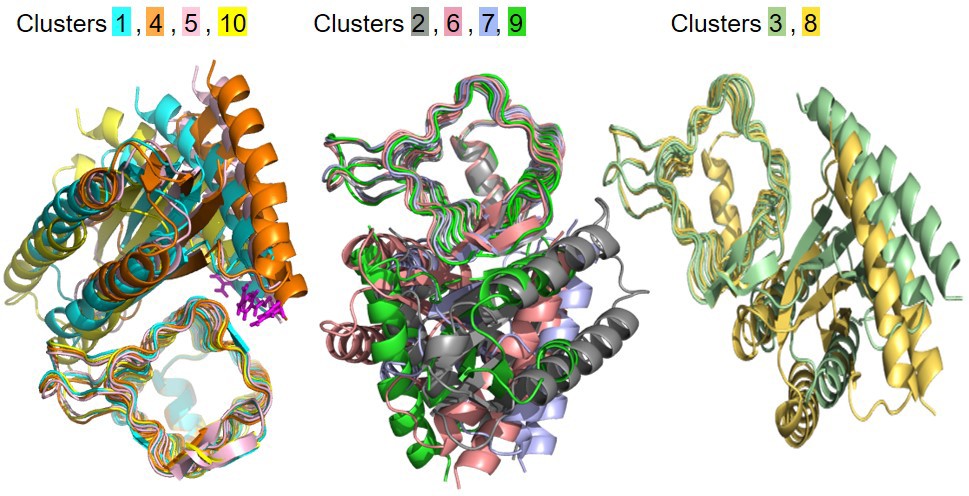
Best models obtained from docking simulations.
Three groups composed by equivalent models are presented. Models from each group are superimposed. Each color represents a defined model. R223 residue from the best models in clusters 1, 4, 5, 10 are colored in magenta.
Figure 2—figure supplement 2

BLi assay between HetL and HetR in the presence of PatS-6.
10 µM of HetL was incubated 5 min with different concentrations of PatS-6 at 0, 0.05, 0.1 and 0.5 µM before bringing HetL in contact with the bound HetR. Each curve represents the average of two experiments minus the control experiment. Control experiment HetL 10 µM loaded onto a biosensor devoid of HetR.
-
Figure 2—figure supplement 2—source data 1
BLi assay between HetL and HetR in the presence of PatS-6.
10 μM of HetL was incubated 5 min with different concentrations of PatS-6 at 0, 0.05, 0.1 and 0.5 μM before bringing HetL in contact with the bound HetR. Each curve represents the average of two experiments minus the control experiment. Control experiment HetL 10 μM loaded onto a biosensor devoid of HetR.
- https://cdn.elifesciences.org/articles/59190/elife-59190-fig2-figsupp2-data1-v2.xlsx
Figure 2—figure supplement 3

PatS-6 interferes with HetL-HetR interaction.
Bacterial two hybrid assay between HetL and HetR in the presence of PatS. Strains after transformations with indicated plasmids were grown on LB plates containing IPTG, X-gal, and corresponding antibiotics for 48 hr at 30 °C. Strains producing the T18 and T25 served as negative control. Strains producing T18-Zip and T25-Zip served as positive control. PatS17 (the full-length PatS) and PatS-6 (ERGSGR) were produced from plasmids pXX7 and pXX8, respectively. The characteristics of the fusion proteins used in this assay are indicated below: HetR-HetL: T25-HetR/T18-HetL; HetR-HetL/PatS17: T25-HetR/T18-HetL/PatS; HetR-HetL/PatS6: T25-HetR/T18-HetL/PatS-6.
Figure 3
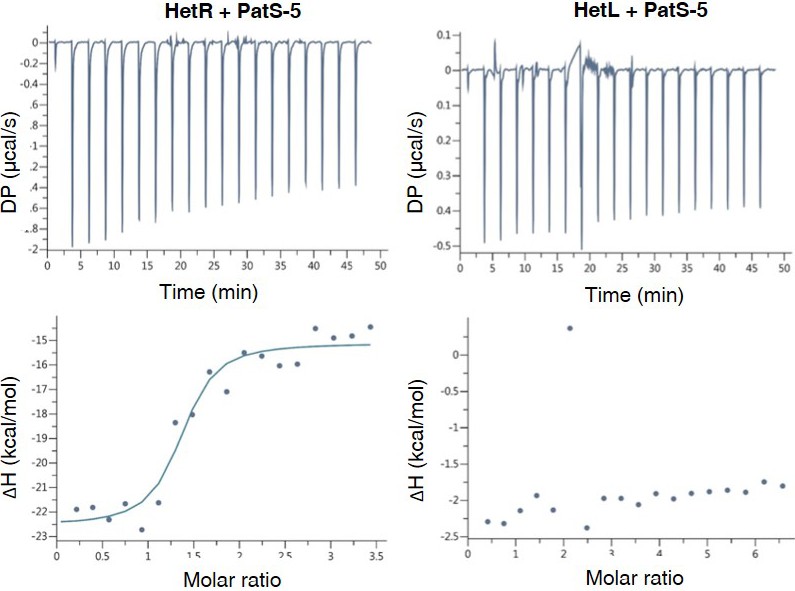
HetL does not interact with PatS-5.
ITC experiment to detect HetL interaction with PatS-5. The right panel shows HetR and PatS-5 interaction. The left panel shows the non-interaction of HetL and PatS-5. The respective upper panels show heat exchange upon ligand titration and bottom panels show integrated data with binding isotherms (solid line) fitted to a single–site binding model. The constant heat dilution was removed before the integrated binding isotherms. The titrant PatS-5 (800 µM) was titrated into a cell containing 23 µM HetR at 25°C.
-
Figure 3—source data 1
Raw data for ITC experiments run with HetL (page 1) or HetR (page 2).
- https://cdn.elifesciences.org/articles/59190/elife-59190-fig3-data1-v2.xlsx
Figure 4 with 1 supplement

HetL-HetR interaction is required for heterocyst differentiation.
(A) hetL or hetLD151A in the indicated strains was overexpressed from the petE promoter. Gene expression was induced with 3 µM copper. qRT-PCR experiments were undergone to determine hetL or hetLD151A expression level. Each sample was measured in triplicate and the standard deviation is indicated by error bars. (B) Microscopic bright field images (upper) and auto-fluorescence images (lower) of indicated Nostoc strains after nitrogen stepdown in addition of 3 µM copper. White arrows point to heterocysts. Images with heterocysts are framed in red.
-
Figure 4—source data 1
Source data to Figure 4A.
hetL or hetLD151A in the indicated strains was overexpressed from the petE promoter. Gene expression was induced with 3 µM copper. qRT-PCR experiments were undergone to determine hetL or hetLD151A expression level.
- https://cdn.elifesciences.org/articles/59190/elife-59190-fig4-data1-v2.xlsx
Figure 4—figure supplement 1
WT/PpetE-hetL strain was able to form heterocysts in the presence of the PatS-5 peptide.
Microscopic bright field images (upper) and auto-fluorescence images (lower) of indicated Nostoc strains after 24 hr of nitrogen stepdown in addition of 3 µM copper are shown. White arrows point to heterocysts. Images with heterocysts are with red frames. Similar results were obtained with PatS-6.
Figure 5
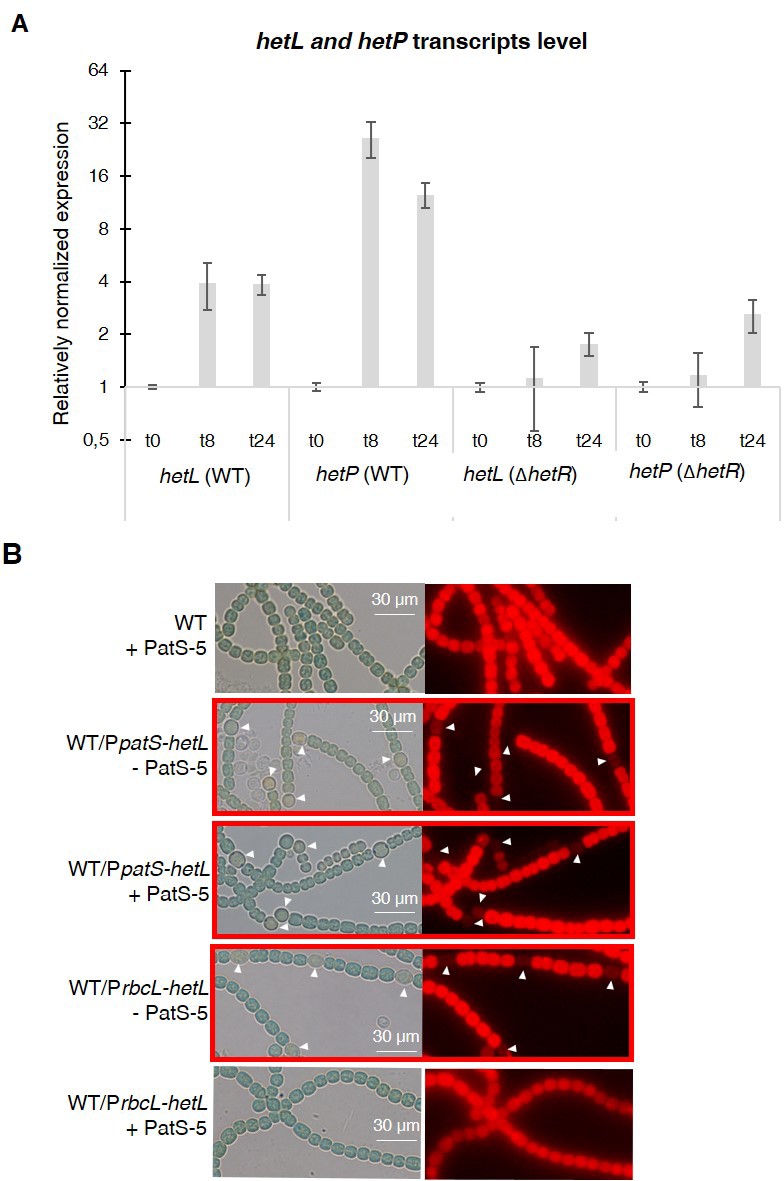
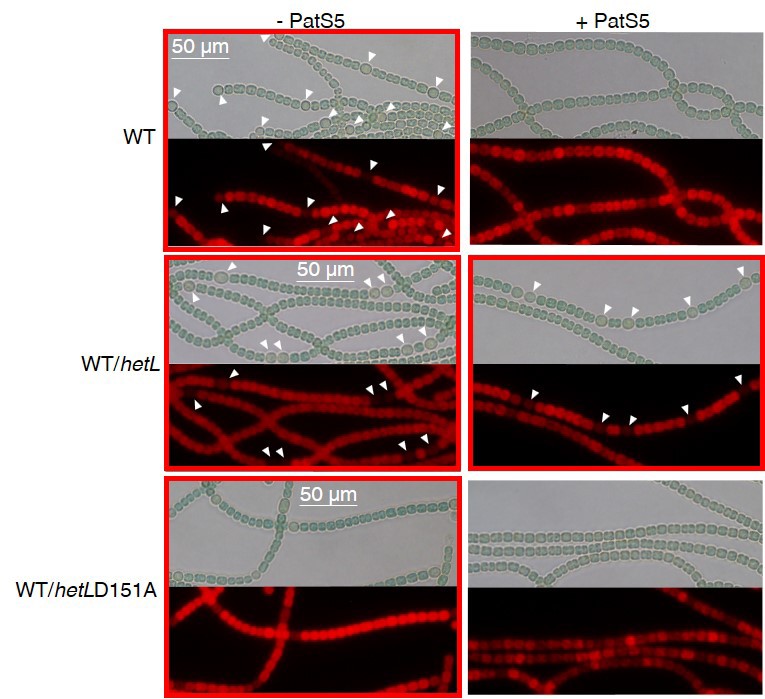
hetL expression is under the control of HetR.
(A) hetL expression is induced in response to nitrogen starvation and is dependent on HetR. qRT-PCR was made to determine the hetL expression in WT and ΔhetR strains. hetP expression was determined as inner positive control. Each sample was measured in triplicate and the standard deviation is indicated by error bars (B) Effect of hetL expression from patS promoter or rbcL promoter. Microscopic bright field images (left) and auto-fluorescence images (right) of indicated Nostoc strains after 24 hr of nitrogen stepdown are shown. White arrows point to heterocysts. Images with heterocysts are with red frames.
-
Figure 5—source data 1
Source data to Figure 4A.
hetL or hetLD151A in the indicated strains was overexpressed from the petE promoter. Gene expression was induced with 3 µM copper. qRT-PCR experiments were undergone to determine hetL or hetLD151A expression level.
- https://cdn.elifesciences.org/articles/59190/elife-59190-fig5-data1-v2.xlsx
Figure 6
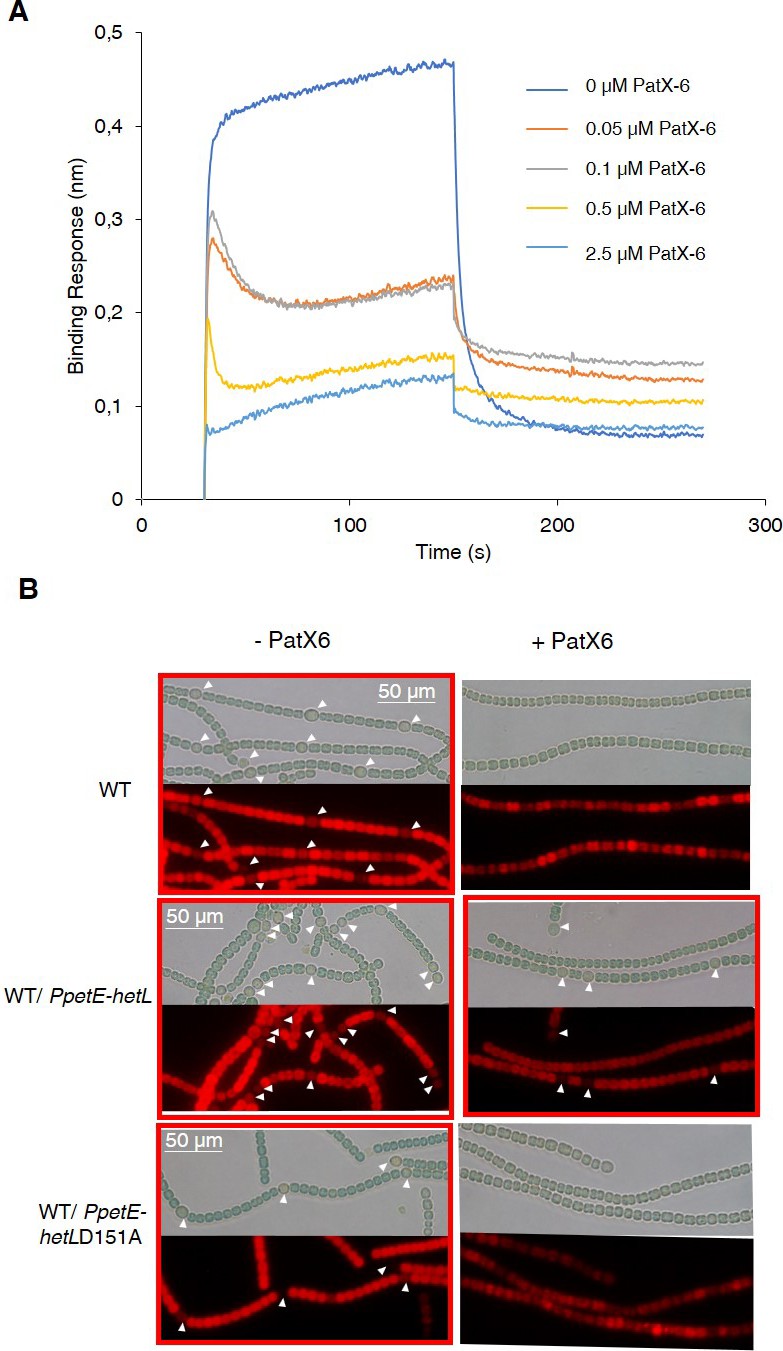
HetL provides protection against PatX-derived pentapeptide.
(A) BLi assay between HetL and HetR in the presence of PatX-6 (HRGTGR). 10 µM of HetL was incubated 5 min with different concentrations of PatX6 at 0.05, 0.1, 0.5 and 2.5 µM before bringing HetL in contact with the bound HetR. Each curve represents the average of two experiments minus the control experiment. Control experiment HetL 10 µM loaded onto a biosensor devoid of HetR. (B) WT/PpetE-hetL strain was able to form heterocysts even in the presence of the PatX-6 peptide. Microscopic bright field images (upper) and auto-fluorescence images (lower) of indicated Nostoc strains after 24 hr of nitrogen stepdown in addition of 3 µM copper are shown. White arrows point to heterocysts. Images with heterocysts are with red frames.
-
Figure 6—source data 1
Source data to Figure 6A.
BLi assay between HetL and HetR in the presence of PatX6 (HRGTGR). 10 µM of HetL was incubated five mins with different concentrations of PatX6 at 0.05, 0.1, 0.5 and 2.5 µM before bringing HetL in contact with the bound HetR.
- https://cdn.elifesciences.org/articles/59190/elife-59190-fig6-data1-v2.xlsx
Figure 7
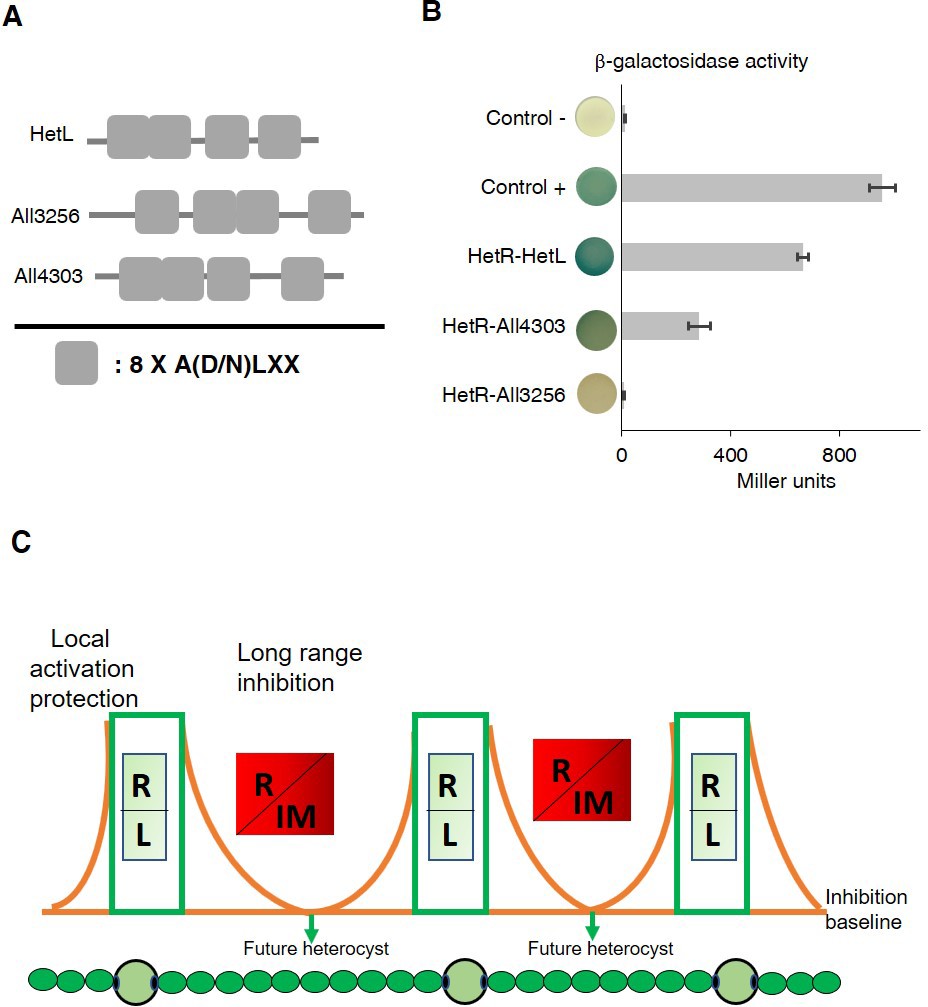
HetR interacts with a HetL homolog and patterning model including HetL.
(A) HetL, All3256 or All4303 PR domains organization. (B) Bacterial two hybrid assay between HetR and HetL paralogs. BTH101 strain was transformed with pKT25-hetR and pUT18C-all4303 or pUT18C-all3256, β-galactosidase activities were measured as described in section ‘Materials and methods’ and were expressed in Miller units. Strains producing the T18 and T25 served as negative control. Strains producing T18-Zip and T25-Zip served as positive control. Error bars indicate standard deviation. The characteristics of the fusion proteins used in this assay are indicated below: HetR-HetL: T25-HetR/T18-HetL; HetR-All4303: T25-HetR/T18-All4303; HetR-All3256: T25-HetR/T18-All3256. (C) Schematic model integrating HetL in the patterning system of Nostoc. R: HetR, L: HetL or HetL homolog, IM: inhibiting morphogen (Providing from the processing of PatX, PatS or HetN). Local activation/protection: once activated, HetR activates the transcription of hetR, hetL, patS/hetN. The HetR/HetL network is favored. HetL provides immunity against the inhibiting morphogens produced in situ or entering the cell. HetR is active, heterocyst develops. Long range inhibition: the diffusion of the morphogens from both sides of the heterocyst creates an inhibition gradient. In the HetR/Morphogen network, HetR is inactive and the concentration of HetL is below the protective threshold. Differentiation is inhibited.
-
Figure 7—source data 1
Source data to Figure 7B.
Bacterial two hybrid assay between HetR and HetL paralogs. BTH101 strain was transformed with pKT25-hetR and pUT18C-all4303 or pUT18C-all3256, β-galactosidase activities were measured as described in section ‘Materials and methods’ and were expressed in Miller units. Strains producing the T18 and T25 served as negative control. Strains producing T18-Zip and T25-Zip served as positive control.
- https://cdn.elifesciences.org/articles/59190/elife-59190-fig7-data1-v2.xlsx
Tables
Table 1
Percentage of heterocysts formed by different strains used in this study after combined nitrogen starvation.
The number of the filaments analyzed was 60–100 in average.
| Strain and condition | % of heterocysts, 24H after nitrogen starvation | Mean interval between two heterocysts |
|---|---|---|
| Wild type | 9.1 ± 1.6 | 10.7 ± 1.3 |
| WT/PpetE-patS | 0 | ND |
| WT and PatS-5 addition | 0 | ND |
| WT/PpetE-hetL[D151A] | 10.5 ± 0.6 | 9.1 ± 1.6 |
| WT/PpetE-patS PpetE-hetL | 11.1 ± 2.4 | 6.1 ± 1.8 |
| WT/PpetE-patS PpetE-hetL[D151A] | 0 | ND |
-
Table 1—source data 1
Raw data for heterocyst intervals and percentages.
- https://cdn.elifesciences.org/articles/59190/elife-59190-table1-data1-v2.xlsx
Key resources table
| Reagent type (species) or resource | Designation | Source or reference | Identifiers | Additional information |
|---|---|---|---|---|
| Gene (Nostoc PCC 7120) | hetR | GenBank | Genomic sequence:NC_003272.1; Gene ID:1105936 | |
| Gene (Nostoc PCC 7120) | patS | GenBank | Gene ID:1105898 | |
| Gene (Nostoc PCC 7120) | hetL | GenBank | Gene ID:1107338 | |
| Gene (Nostoc PCC 7120) | all4303 | GenBank | Gene ID:1107905 | |
| Gene (Nostoc PCC 7120) | all3256 | GenBank | Gene ID:1106854 | |
| Strain, strain background (Nostoc) | Wild-type strain; WT | Pasteur Institute Collection | PCC 7120 | |
| Strain, strain background (Nostoc) | ΔhetR | DOI:10.1111/j.1365-2958.2005.04678.x | Nostoc PCC 7120 deletion mutant of thehetR gene | |
| Strain, strain background (Escherichia coli) | BL21DE3 | New England Biolabs | C2527 | competent cells for production of proteins |
| Strain, strain background (Escherichia coli) | BTH101 | DOI:10.1073/pnas.95.10.5752 | competent cells for two hybrid assays | |
| Antibody | Anti-histidine (mouse monoclonal) | Qiagen | Cat# 34660; RRID:AB_2619735 | (1:1000) |
| Recombinant DNA reagent | pRL1272 (plasmid) | DOI:10.1128/jb.170.3.1239-1244.1988 | replicative in Nostoc, encoding resistance to erythromycin | |
| Recombinant DNA reagent | pCSB270 (plasmid) | Other | lab collection (pRL1272 with petE promoter) | |
| Recombinant DNA reagent | pRL25T (plasmid) | DOI: 10.1016/j.resmic.2012.10.010 | replicative in Nostoc encoding resistance to neomycin | |
| Recombinant DNA reagent | pCSB265 (plasmid) | Other | lab collection (pRL25T bearing thepetE promoter) | |
| Sequence-based reagent | PhetP fw (PCR primers) | Other | [6FAM]ATTTAGTGGTAAATTCTCTT | lab collection |
| Sequence-based reagent | PhetP rv (PCR primers) | Other | TGAGTTATACGCTATATCAA | lab collection |
| Peptide, recombinant protein | PatS-5 (synthesized peptide) | Genecust | RGSGR | desalted > 99% |
| peptide, recombinant protein | PatS-6 (synthesized peptide) | Genecust | ERGSGR | desalted > 99% |
| Peptide, recombinant protein | PatX-6 (synthesized peptide) | Genecust | HRGTGR | desalted > 99% |
| Commercial assay or kit | In-Fusion HD Cloning kit | Takara | 639646 | |
| Commercial assay or kit | GoScript Reverse transcriptase | Promega | A5000 | |
| Chemical compound, drug | HisTrap Excel | GE healthcare | GE17-3712-05 | |
| Chemical compound, drug | Disposable PD 10 Desalting Columns | GE healthcare | GE17-0851-01 | |
| Chemical compound, drug | DiDC competitor | Sigma-Aldrich | 81349 | |
| Software, algorithm | HADDOCK2.2 webserver | DOI: 10.1016/j.jmb.2015.09.014 | http://milou.science.uu.nl/services/HADDOCK2.2/ |
Additional files
-
Supplementary file 1
List of the strains and plasmids used in the study.
Sequences of the primers used. Supplementary Table 1. PRPs encoding genes in the genome of Nostoc The sequences were retrieved from the Microscope Mage database. The genes located on Nostoc plasmids are marked by an asterisk. The functional domains were analyzed by Pfamscan. The cellular localization was deduced from the presence of transmembrane domain, signal peptide and lipopeptide using TMhmm, SignalIP and LipoP softwires. For gene expression, the reads values are those reported in Flaherty et al., 2011. Supplementary Table 2. List of active residues used as input for HetRhood:HetL docking simulations
- https://cdn.elifesciences.org/articles/59190/elife-59190-supp1-v2.docx
-
Transparent reporting form
- https://cdn.elifesciences.org/articles/59190/elife-59190-transrepform-v2.pdf
Download links
A two-part list of links to download the article, or parts of the article, in various formats.
Downloads (link to download the article as PDF)
Open citations (links to open the citations from this article in various online reference manager services)
Cite this article (links to download the citations from this article in formats compatible with various reference manager tools)
HetL, HetR and PatS form a reaction-diffusion system to control pattern formation in the cyanobacterium nostoc PCC 7120
eLife 9:e59190.
https://doi.org/10.7554/eLife.59190


