A rat epigenetic clock recapitulates phenotypic aging and co-localizes with heterochromatin
- Department of Pathology, Yale University School of Medicine, United States
- Program in Computational Biology and Bioinformatics, Yale University, United States
- Comparative Medicine Section, Biomedical Research Center, National Institute on Aging, National Institutes of Health, United States
- Translational Gerontology Branch, Biomedical Research Center, National Institute on Aging, National Institutes of Health, United States
- Calico Life Sciences, United States
- Department of Human Genetics, University of California, Los Angeles, United States
- Laboratory of Molecular Biology and Immunology, Flow Core Unit, Biomedical Research Center, National Institute on Aging, National Institutes of Health, United States
- Molecular Biology Institute and Departments of Energy Laboratory of Structural Biology and Molecular Medicine, and Chemistry and Biochemistry, University of California, Los Angeles, United States
Figures
Figure 1 with 4 supplements
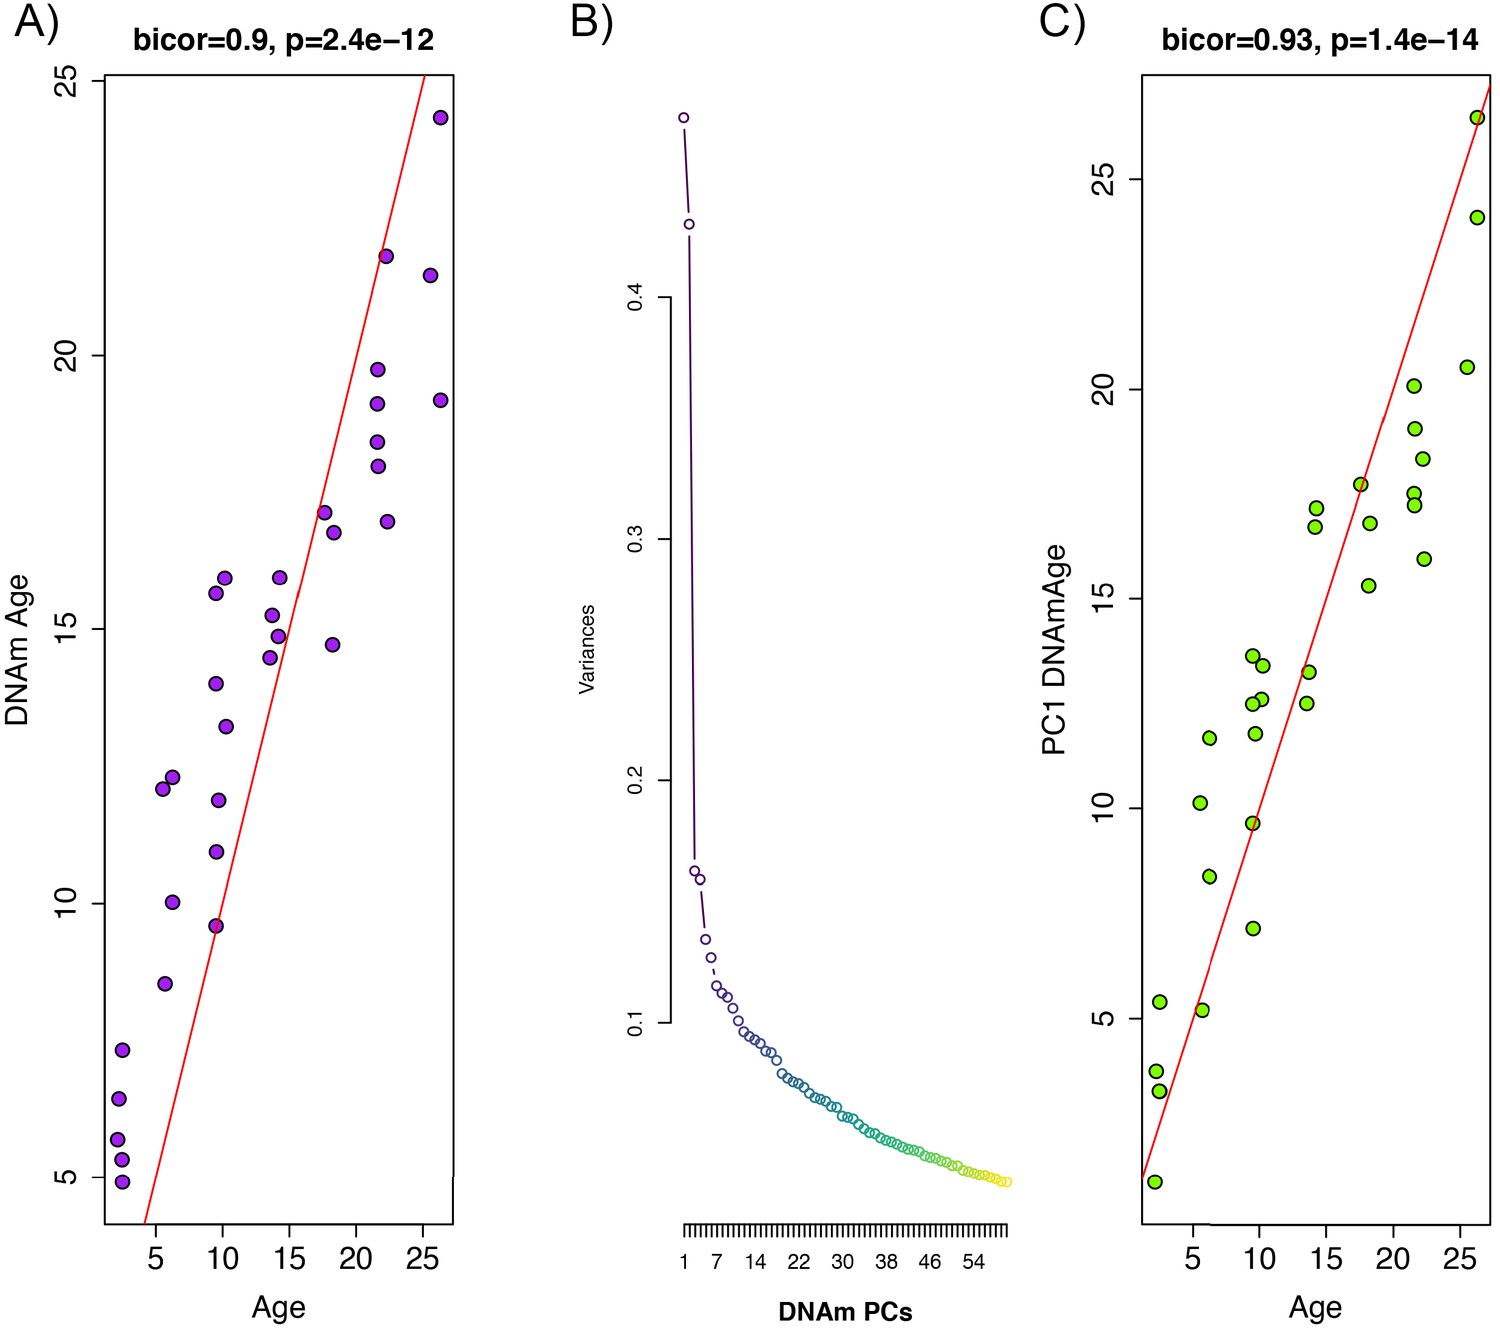
Principal component analysis (PCA)-based construction of DNAmAge in rats.
(A) Supervised approach: A sample of male F344 rats, ages 1 to 27 months, were split into training (n = 102) and test sets (n = 32). Using DNAm levels measured at 5,505,909 CpGs across the genome as input, we applied elastic net penalized regression to train a predictor of age. Based on training data, 68 CpGs were selected for the DNAmAge measure. The plot shows the biweight midcorrelation between age (x-axis) and DNAmAge (y-axis) in the test sample. (B) Screeplot of variance explained for PCs1-60. A large amount of the variance is captured by PCs 1 and 2, with an elbow forming around PC7, suggesting that the amount of variance explained drops-off significantly after the first six PCs. (C) Unsupervised approach: we converted PC1 (estimated based on PCA in the training sample) to units of months by regressing age on PC1 and then multiplying the coefficient by PC1 and adding the constant in the test sample. We then tested the biweight midcorrelation between PC1 DNAmAge and chronological age.
Figure 1—figure supplement 1
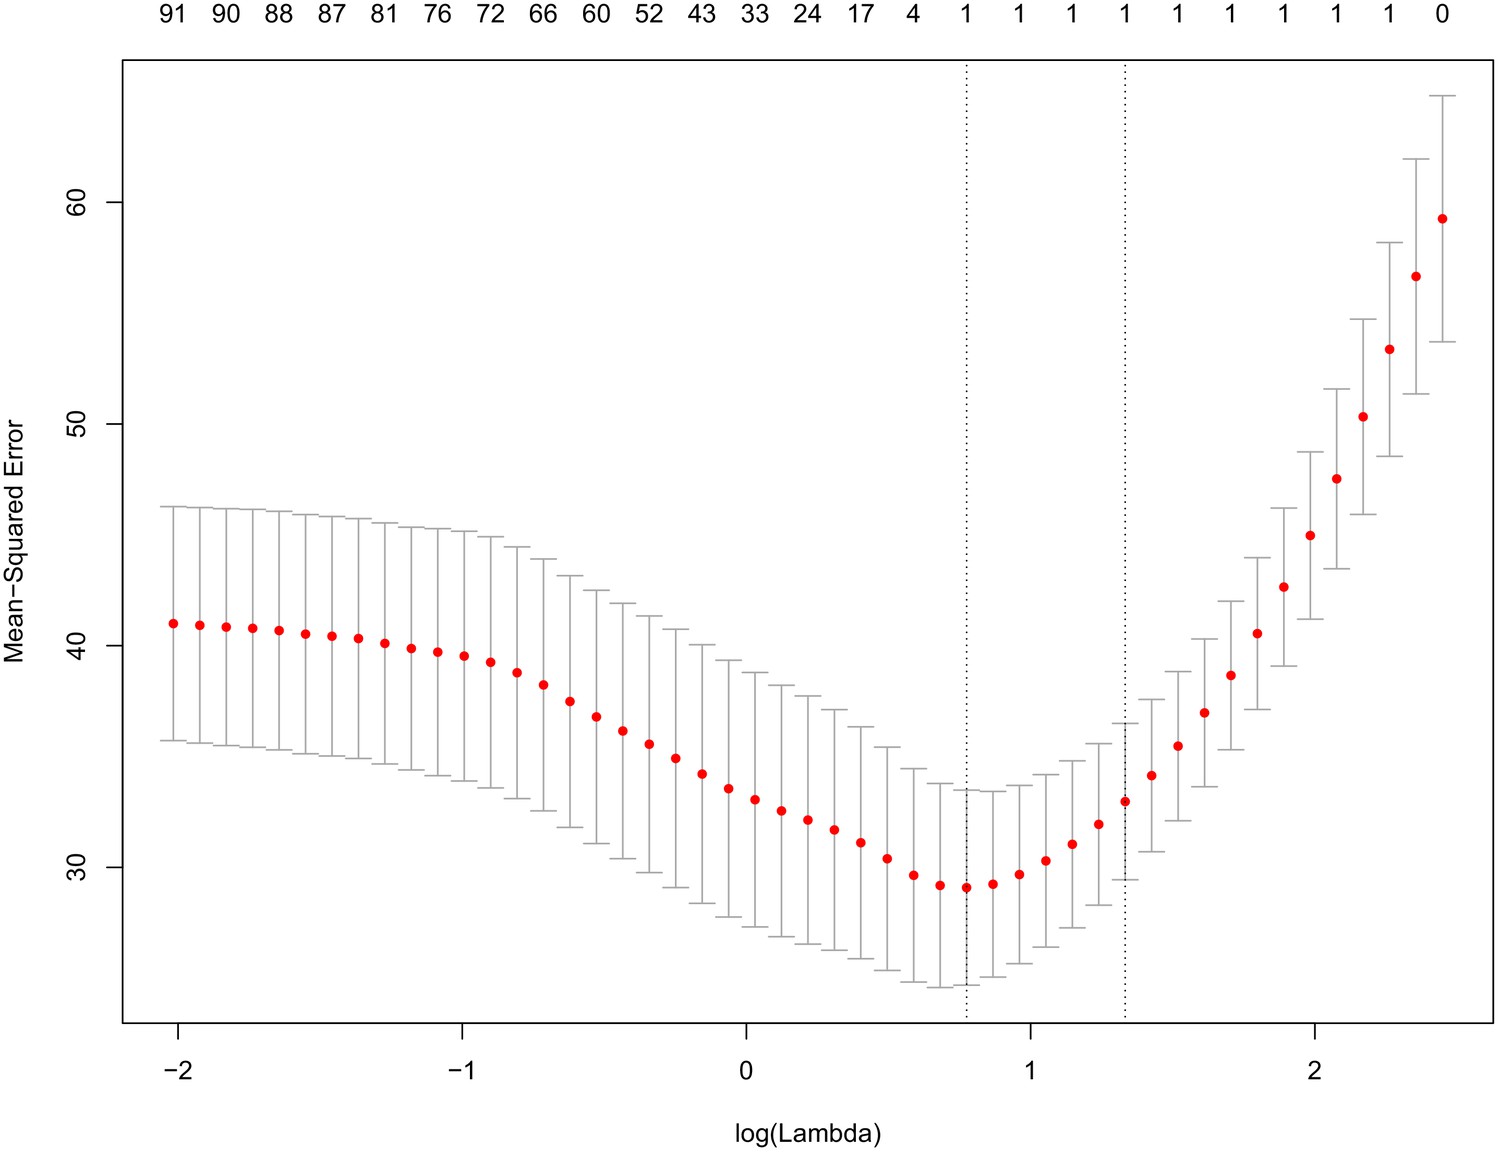
Tenfold cross-validation of prediction of chronological age using eigenvalues from PCA of DNAm.
Principal component analysis was run on DNAm data and the resulting eigenvalues were used as inputs to train a predictor of age using elastic net penalized regression. Based on 10-fold cross-validation, we found that the most accurate model was derived from a single variable (PC1). The x-axis represents the log of the penalty/shrinkage parameter, lambda. The y-axis depicts the MSE for the 10-fold analysis, with means plotted as red dots and standard errors plots shown. The values across the top of the graph show the number of variables selected as a function of the lambda (x-axis). The lowest MSE (left most dashed line) was for log(lambda)=0.775, which selected a model with only one variable (PC1).
Figure 1—figure supplement 2
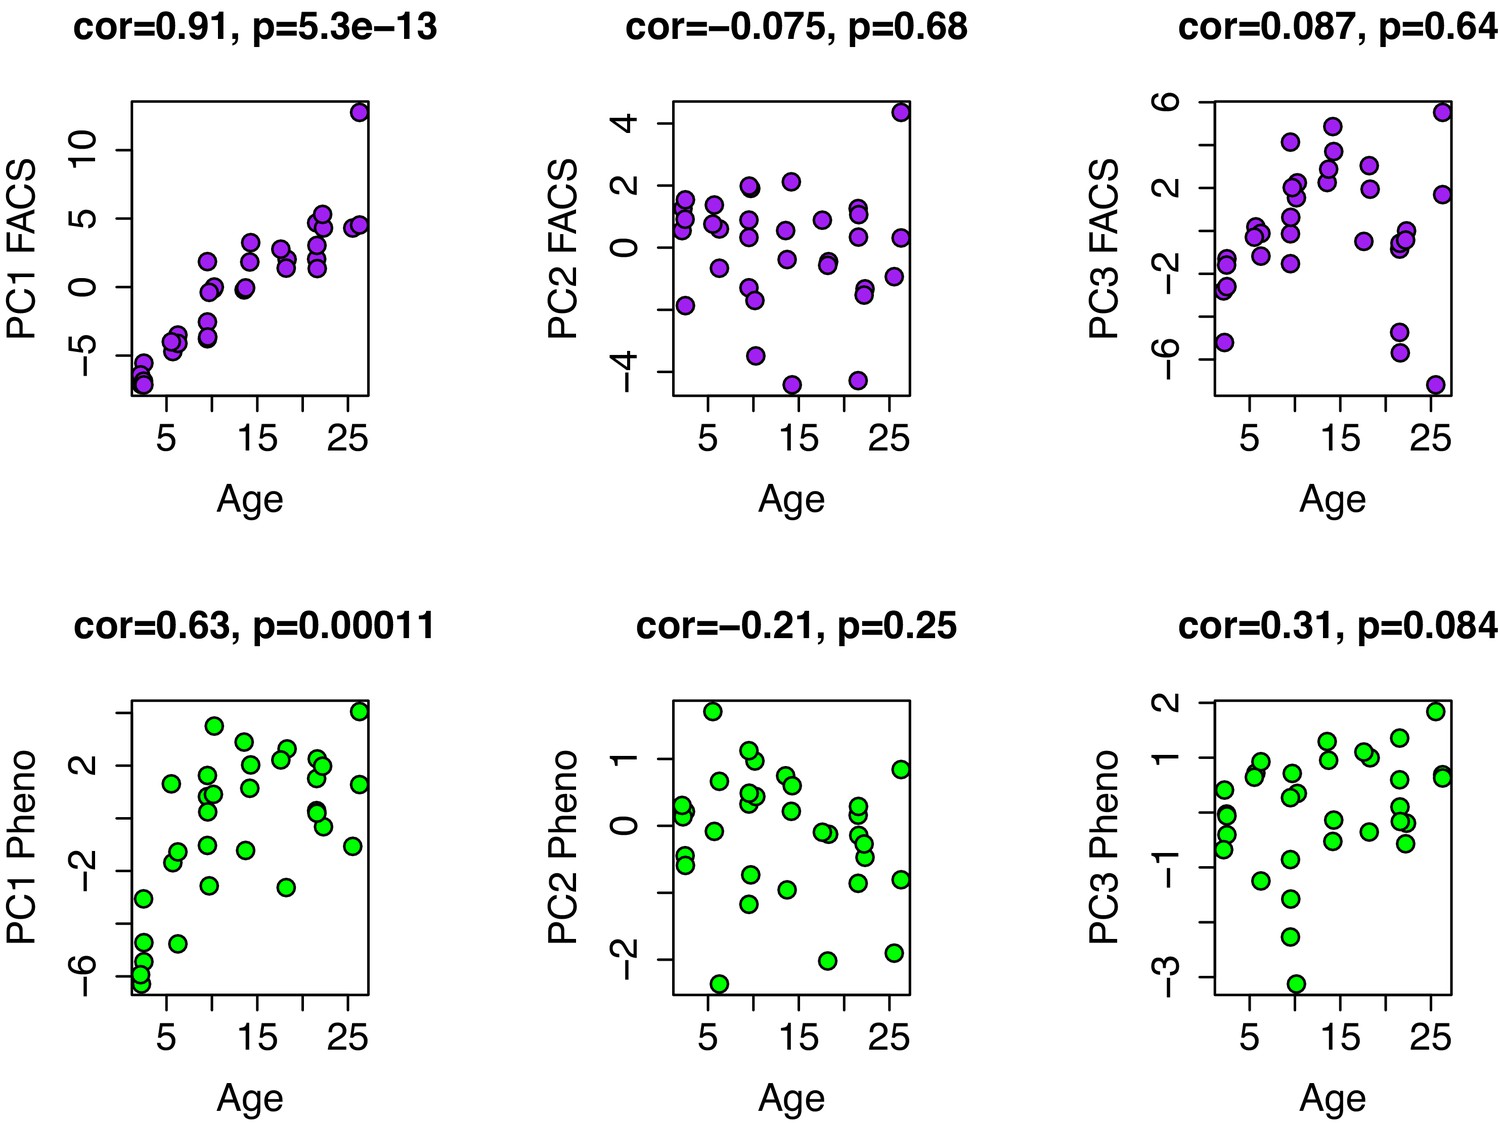
Age associations for PCs1-3 from FACS and phenotype data.
PCs were generated from 39 variables of white blood cell composition using FACS (top row) and from ten phenotypic variables (bottom row), which included eight summarized open-field test variables and two rotarod variables (max time and mean time). In both instances, only PC1 is strongly correlated with age.
Figure 1—figure supplement 3
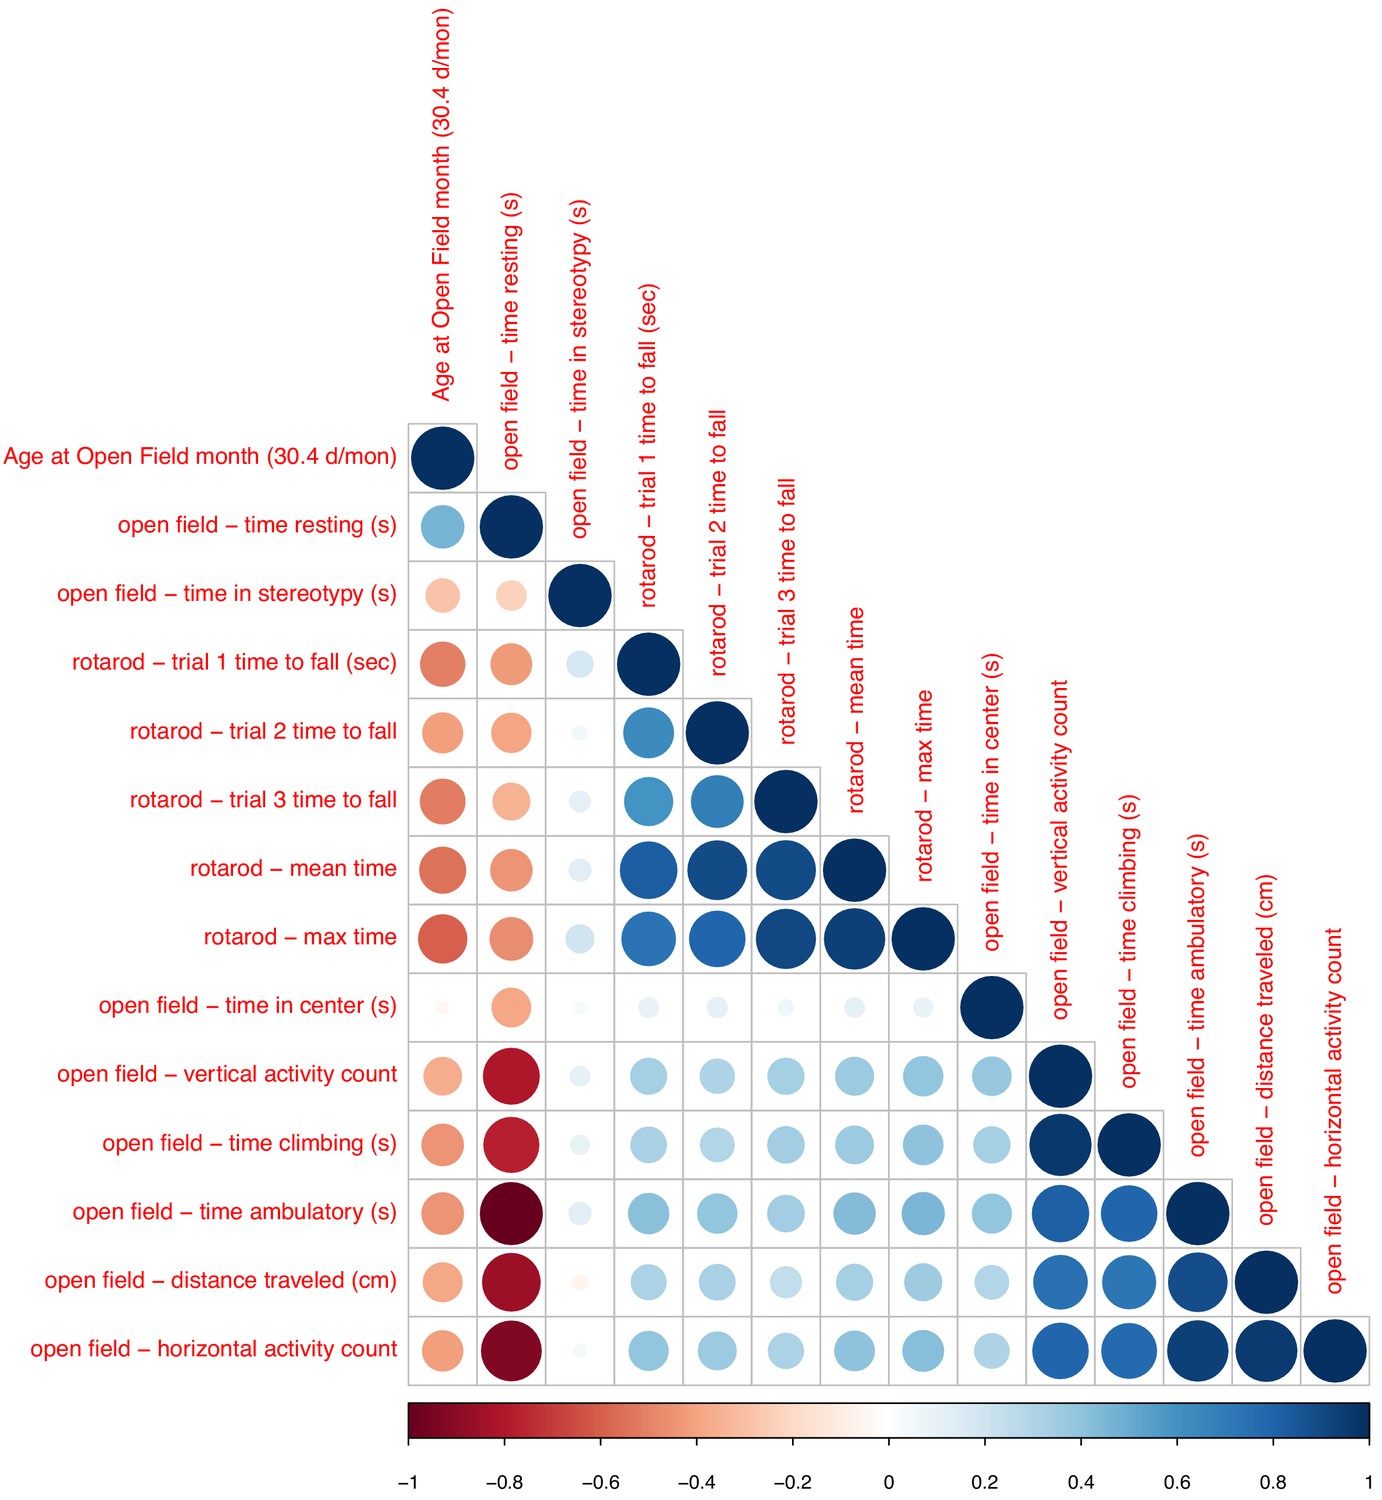
Associations between chronological age and phenotypic data (open field and rotarod).
Sizes and colors of circles depict correlation coefficients. Variables are ordered according to hieratical clustering.
Figure 1—figure supplement 4
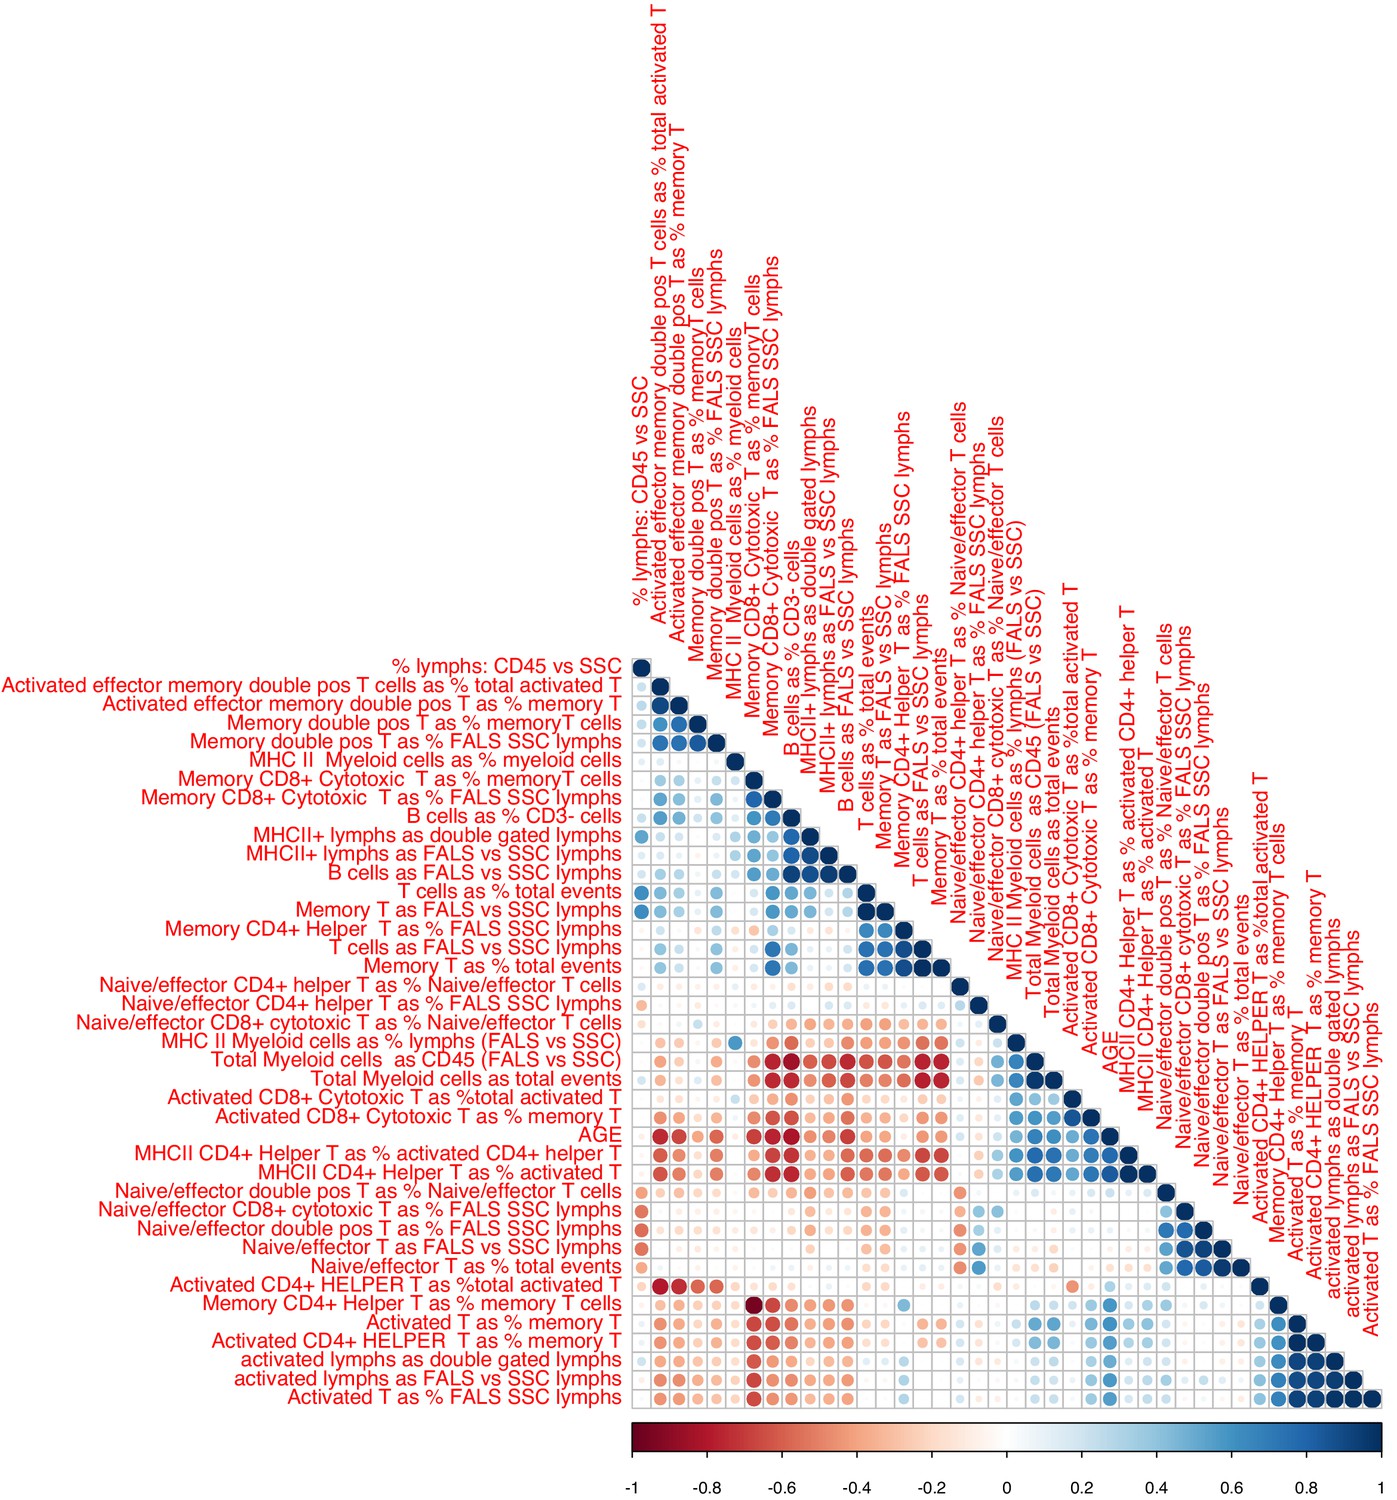
Associations between chronological age and FACS data.
Sizes and colors of circles depict correlation coefficients. Variables are ordered according to hieratical clustering.
Figure 2 with 1 supplement
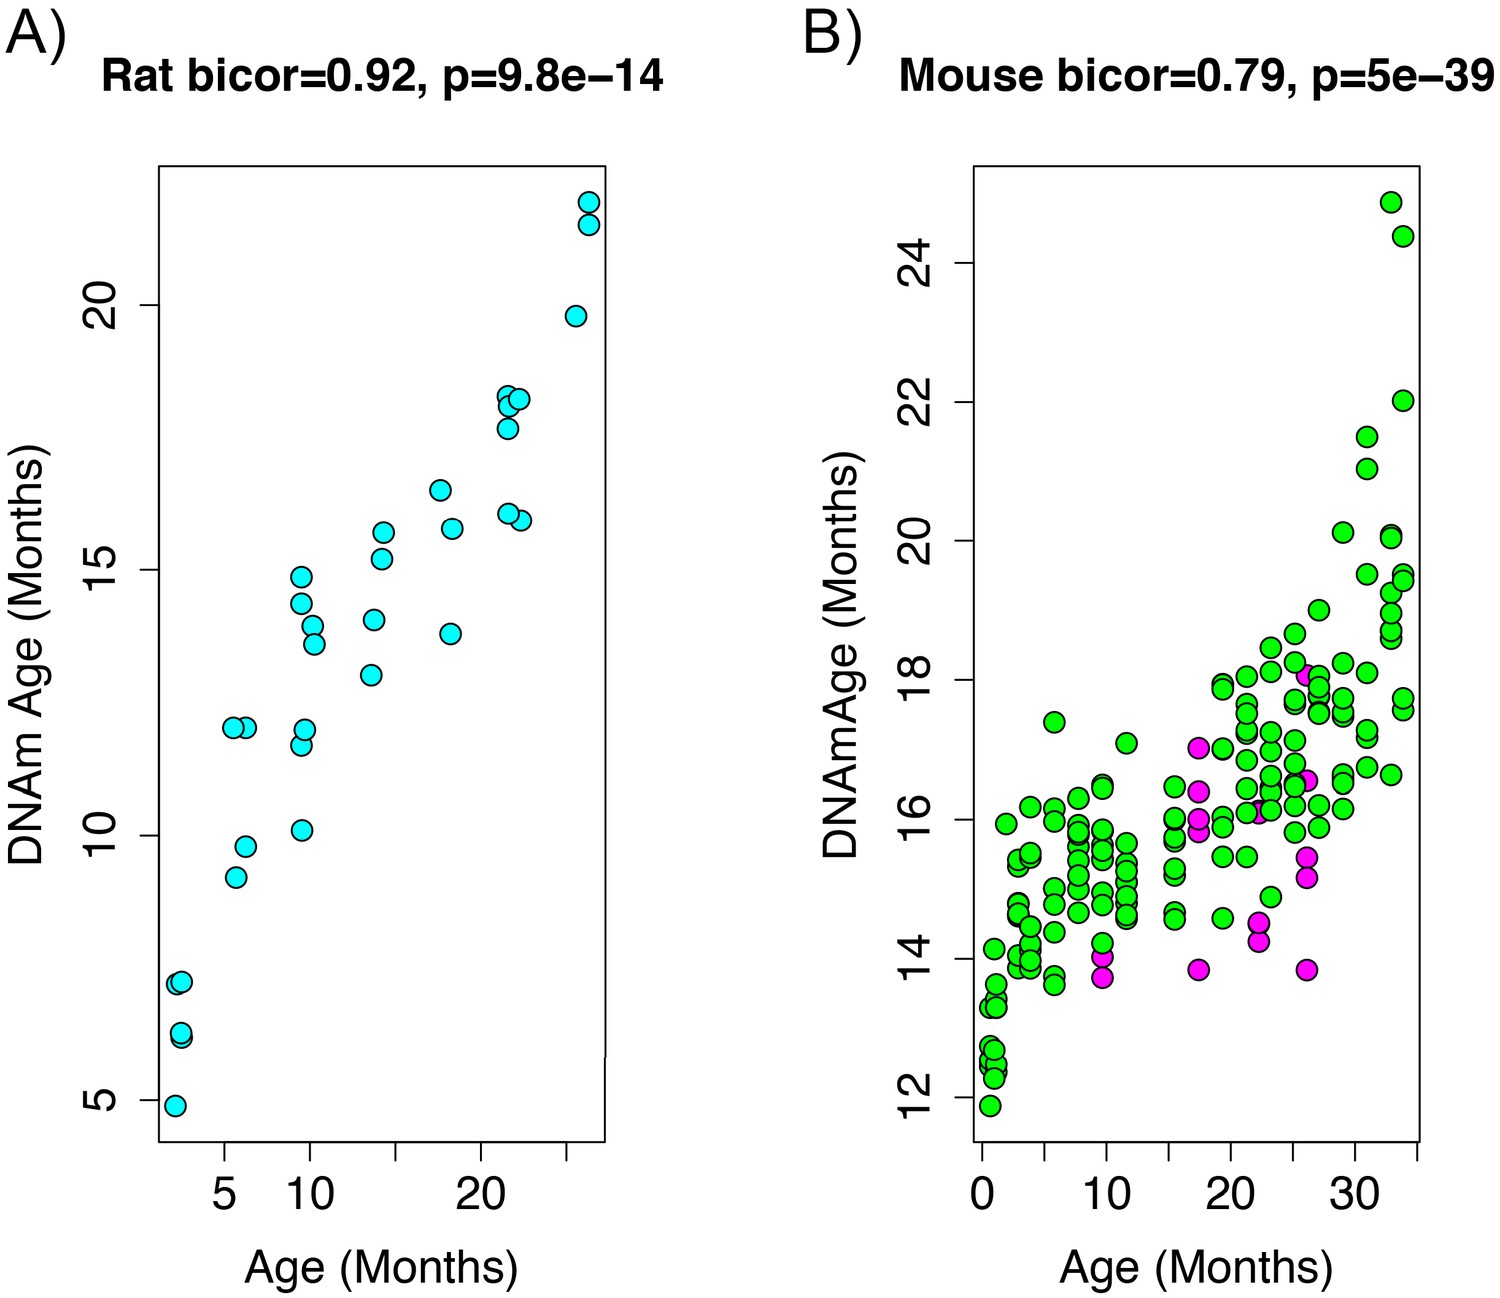
Age correlation in rats and mice using the restricted overlapping CpGs.
(A) PC1 DNAmAge was re-estimated using only the CpGs that were overlapped between rat and mouse (n = 3,625). Although this variable contained only 0.066% of the CpGs in the original measure, we were able to observe an equivalent age biweight midcorrelation. (B) This variable was then applied to data from C57BL/6 mice and was found to be strongly correlated with age (biweight midcorrelation). We also observed the calorie-restricted mice (magenta) trended towards lower DNAmAge than ad libitum fed animals (green)—significance was tested using OLS regression.
Figure 2—figure supplement 1
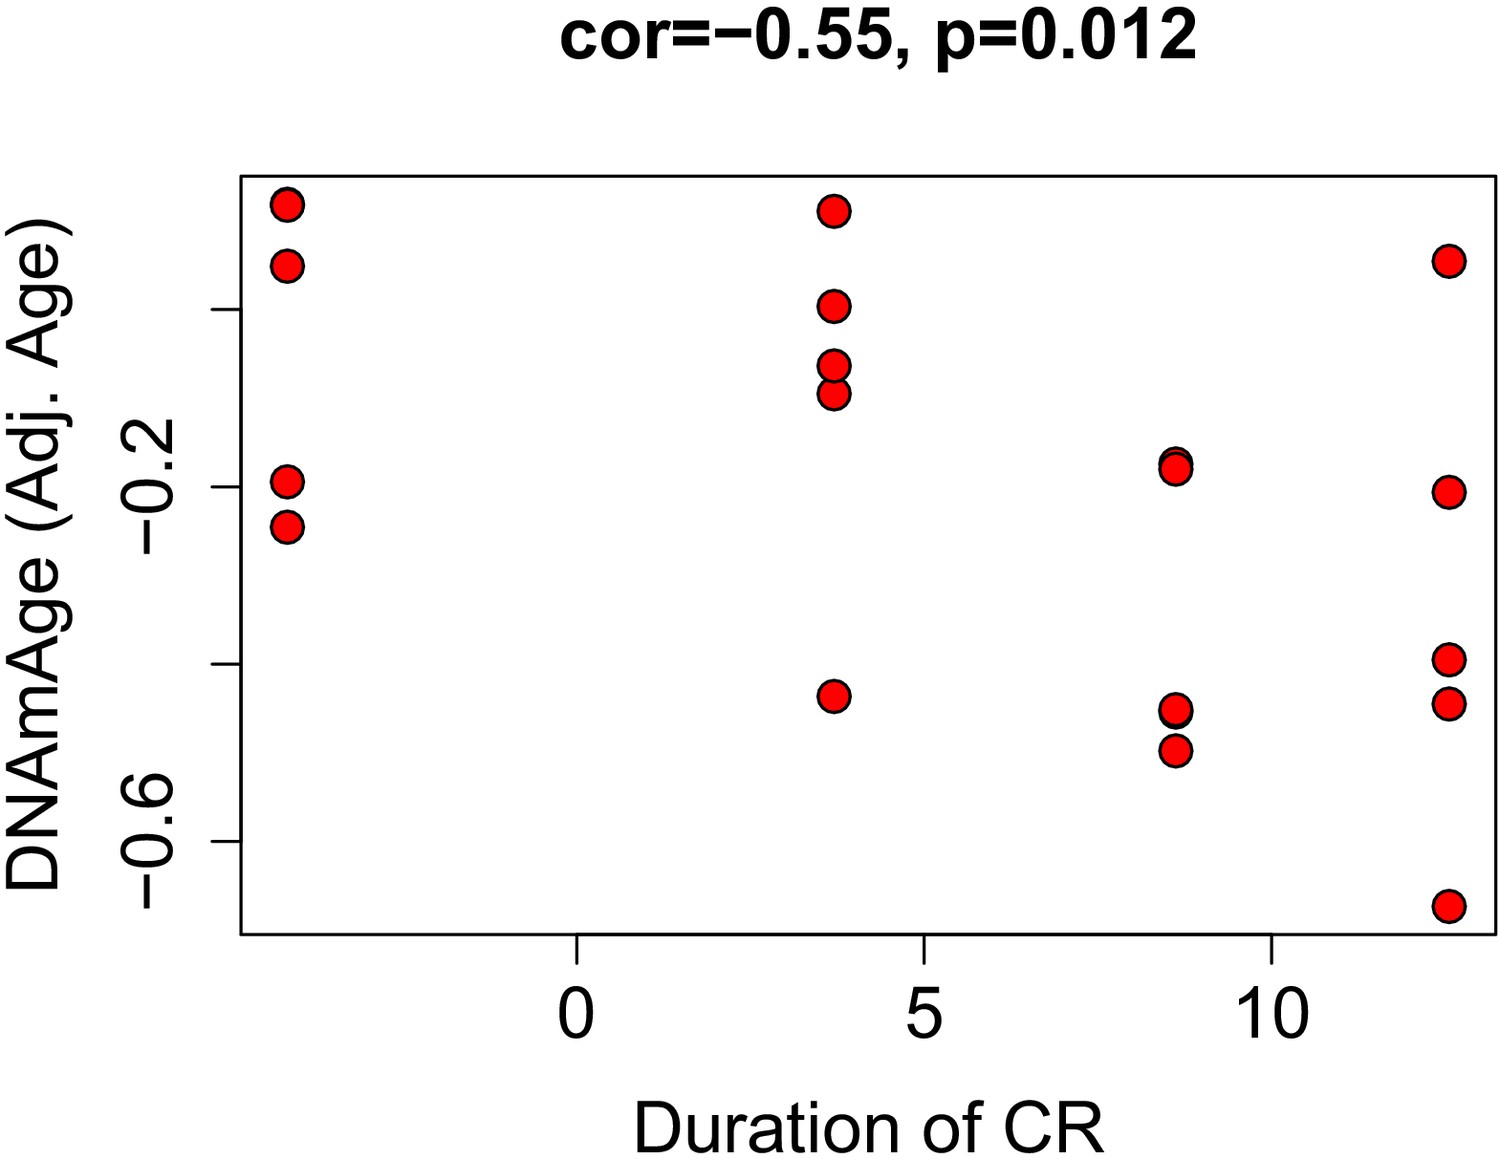
Correlations between duration of caloric restriction and epigenetic age acceleration.
Based on the equation of DNAm regressed on age in ad libitum fed mice, we calculated age adjusted DNAmAge for calorically restricted animals. This value represents how much epigenetically older/younger a mouse is compared to what is expected for its chronological age. It is similar to the delta (DNAmAge—Age), but also accounts for non-linearities and bias in over-/under-estimation with age. We found that this was correlated with duration the animal had been on CR, suggesting that a longer time spent on the intervention was associated with a greater reduction in epigenetic age.
Figure 3
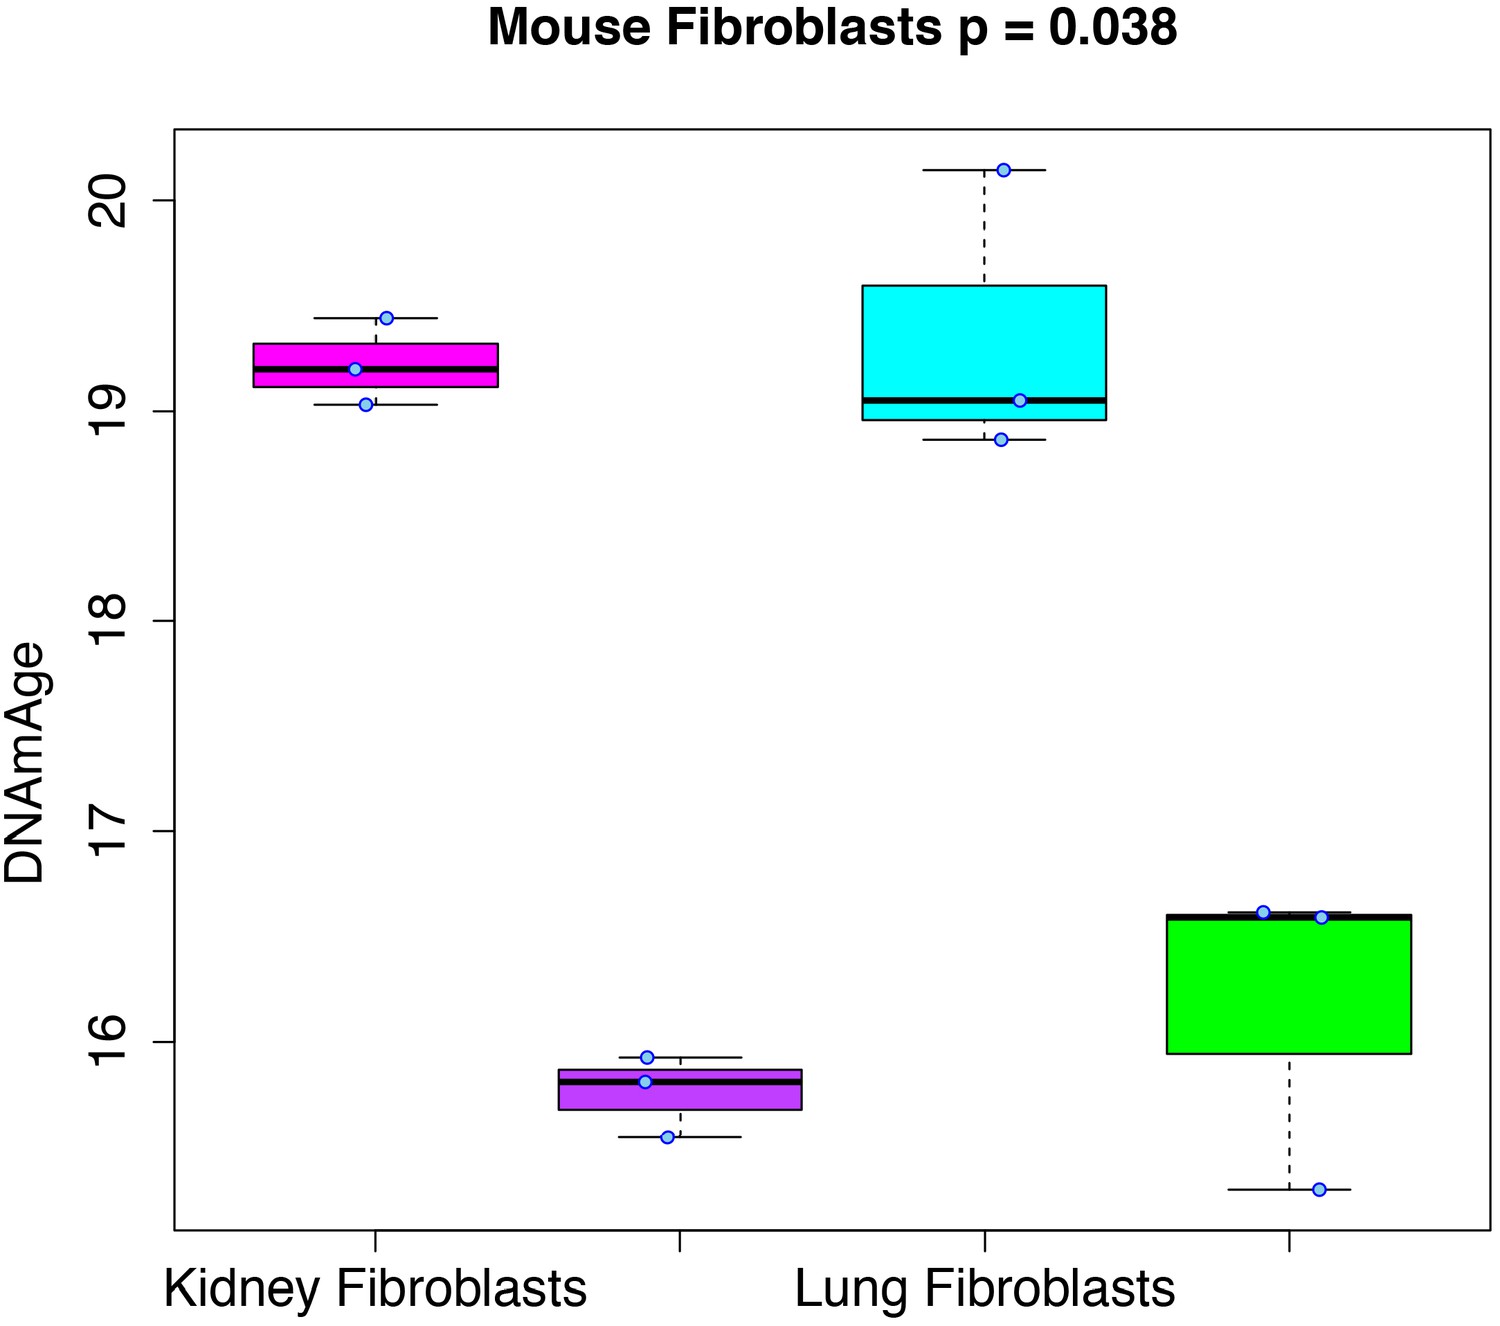
Rejuvenation of fibroblast-derived iPSCs.
We applied our DNAmAge measure to data from kidney and lung fibroblast controls and derived iPSCs (GSE80672). We find that a significant reduction (Kruskal-Wallis test) in DNAmAge for lung- and kidney-derived iPSCs versus controls.
Figure 4 with 2 supplements
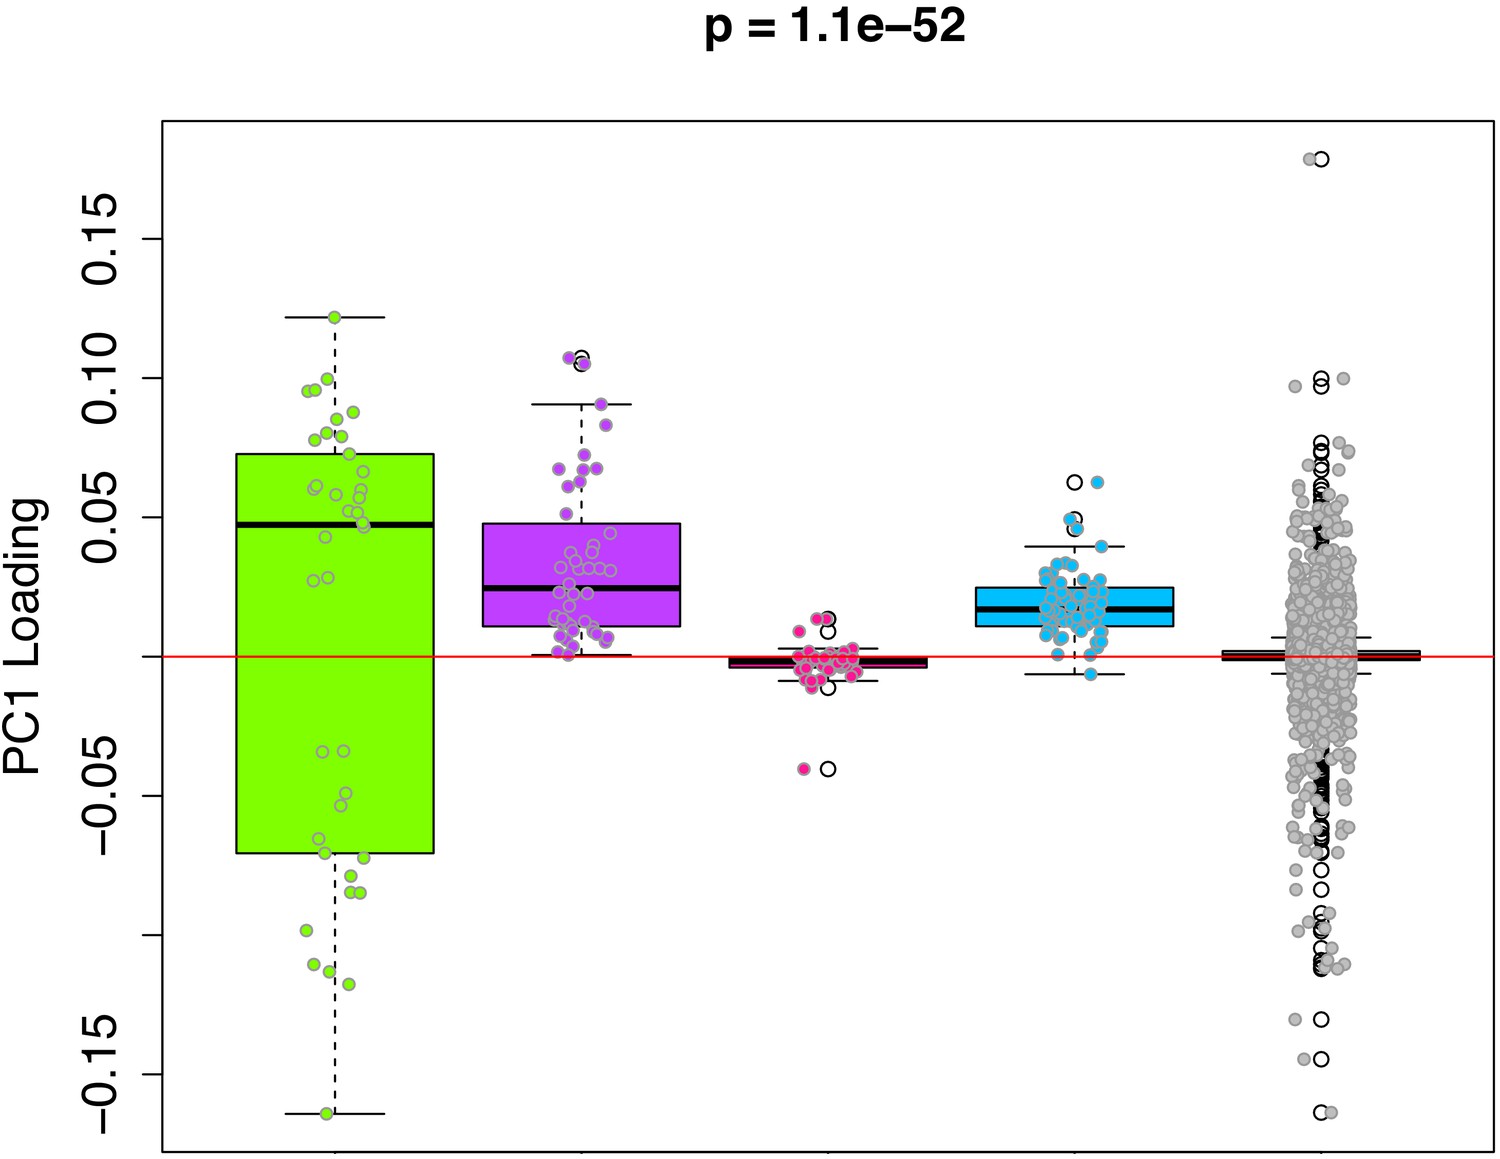
PC1 loadings (for overlapped CpGs from mouse data) by module.
Each of the 3625 CpGs was assigned to a module (i.e. green, purple, pink, blue, grey). The y-axis shows the loadings from PC1 that was used to signify the DNAmAge measure. The Purple and Blue modules tend to have CpGs with positive loadings, signifying that DNAm levels for CpGs in these modules were more strongly related to higher DNAmAge. The green module had CpGs with both high positive and high negative loadings, suggesting that half the CpGs in this module are hypomethylated in accordance with higher DNAmAge whereas the other half are hypermethylated with higher DNAmAge. p-Values denotes significance using Kruskal-Wallis test.
Figure 4—figure supplement 1
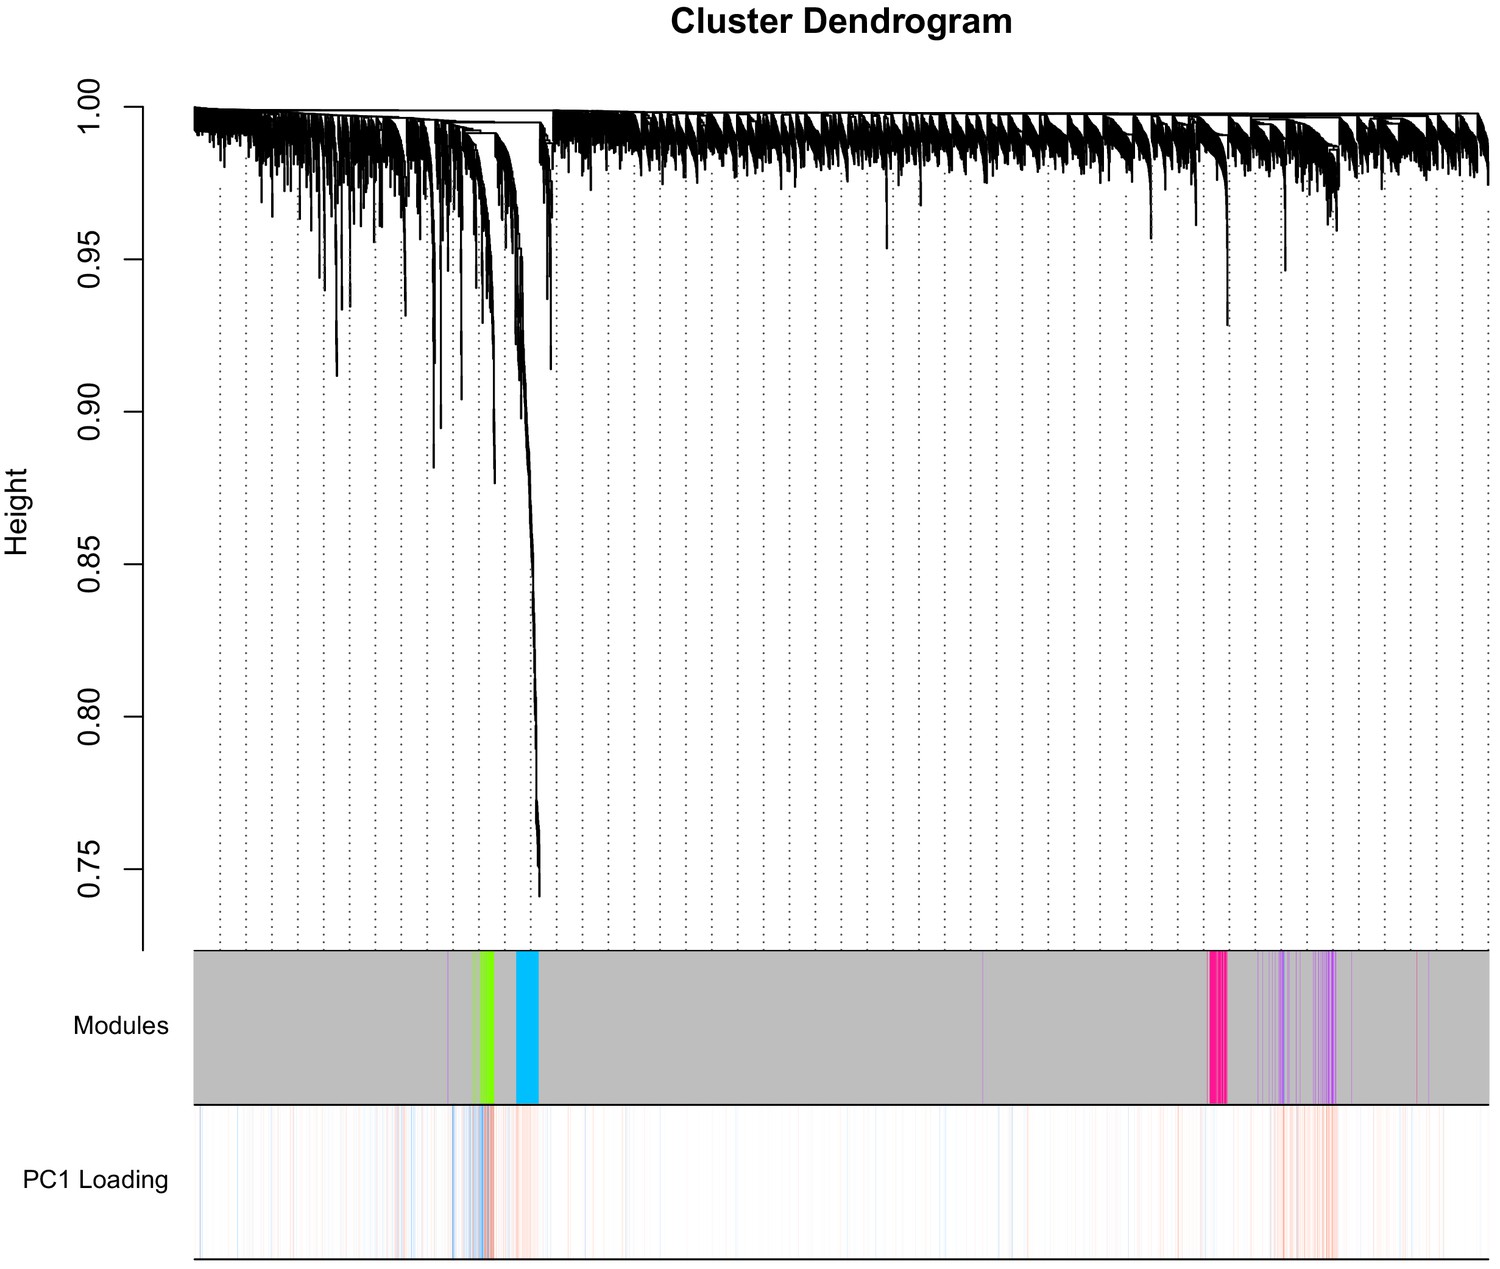
Dendrogram from WGCNA.
The y-axis pertains to distance, such that lower values pertain to higher topological overlap. The first column displays the module colors for each CpG—the majority of CpGs are unassigned (grey module), whereas a smaller proportion are in the green, blue, pink, or purple modules. PC1 loadings for the PC used for DNAmAge is shown in the second column (red is positive, blue is negative). CpGs in the purple and blue module tend to have strong positive loadings, whereas green has a mix of strong positive and negative loadings, that segregate based on the dendrogram.
Figure 4—figure supplement 2
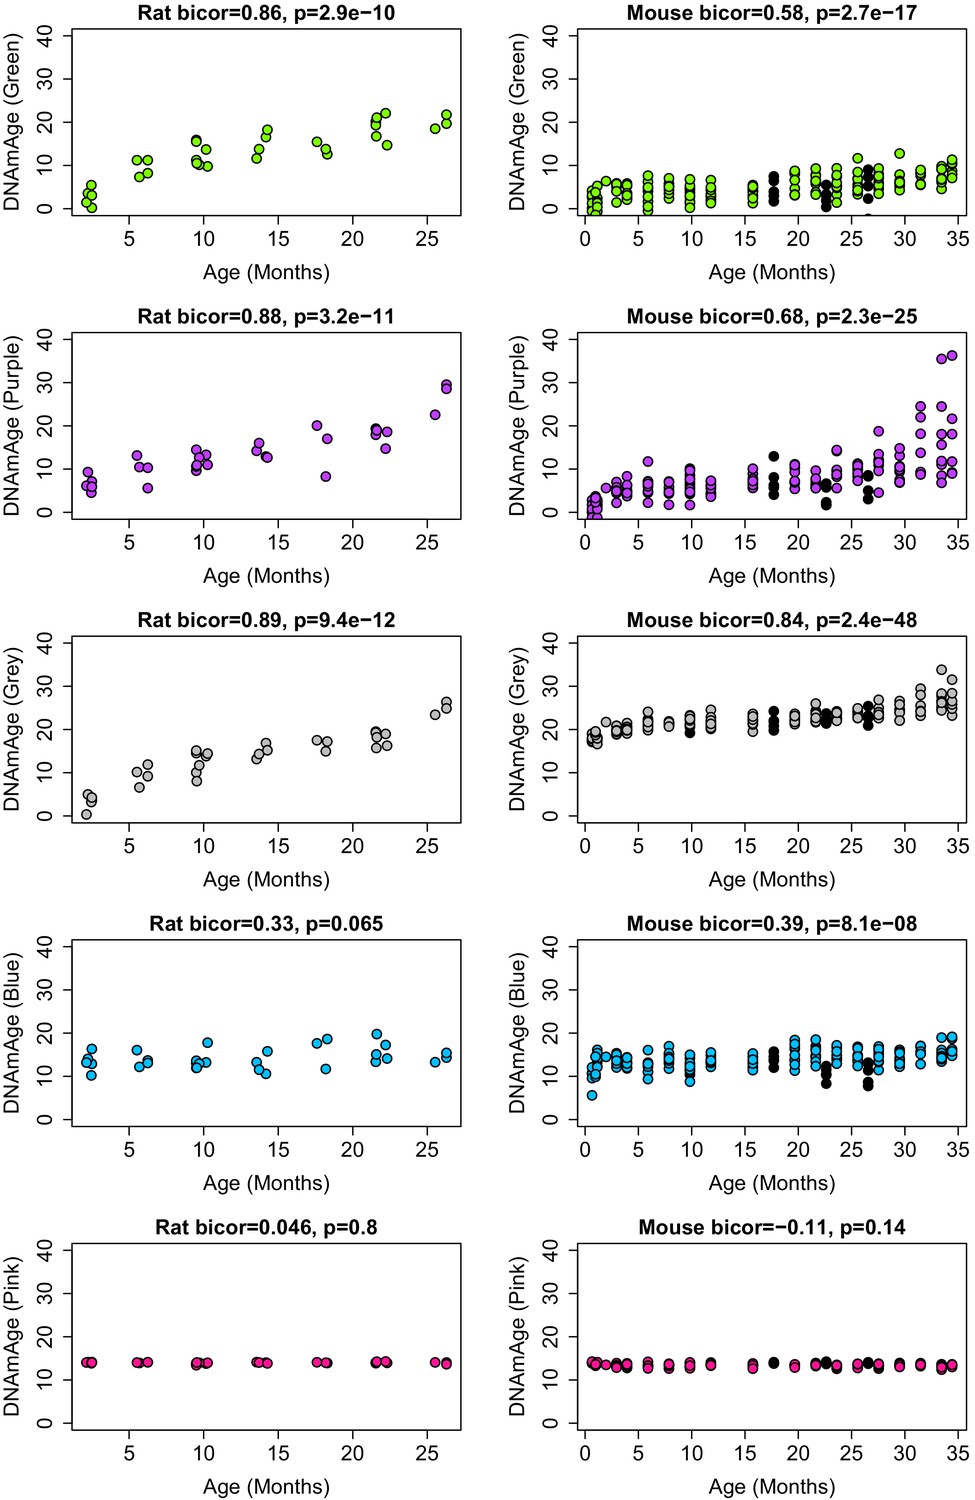
Correlations between module-based DNAmAge and age in both rats and mouse.
Modules are denoted by color. Panels in the first column show biweight micorrelations between age and DNAm Age in the validation set for rats. Panels in the second column show biweight micorrelations for C57BL/6 Mice. Black dots in the right panels denote samples who underwent caloric restriction starting at 14 weeks.
Figure 5 with 4 supplements
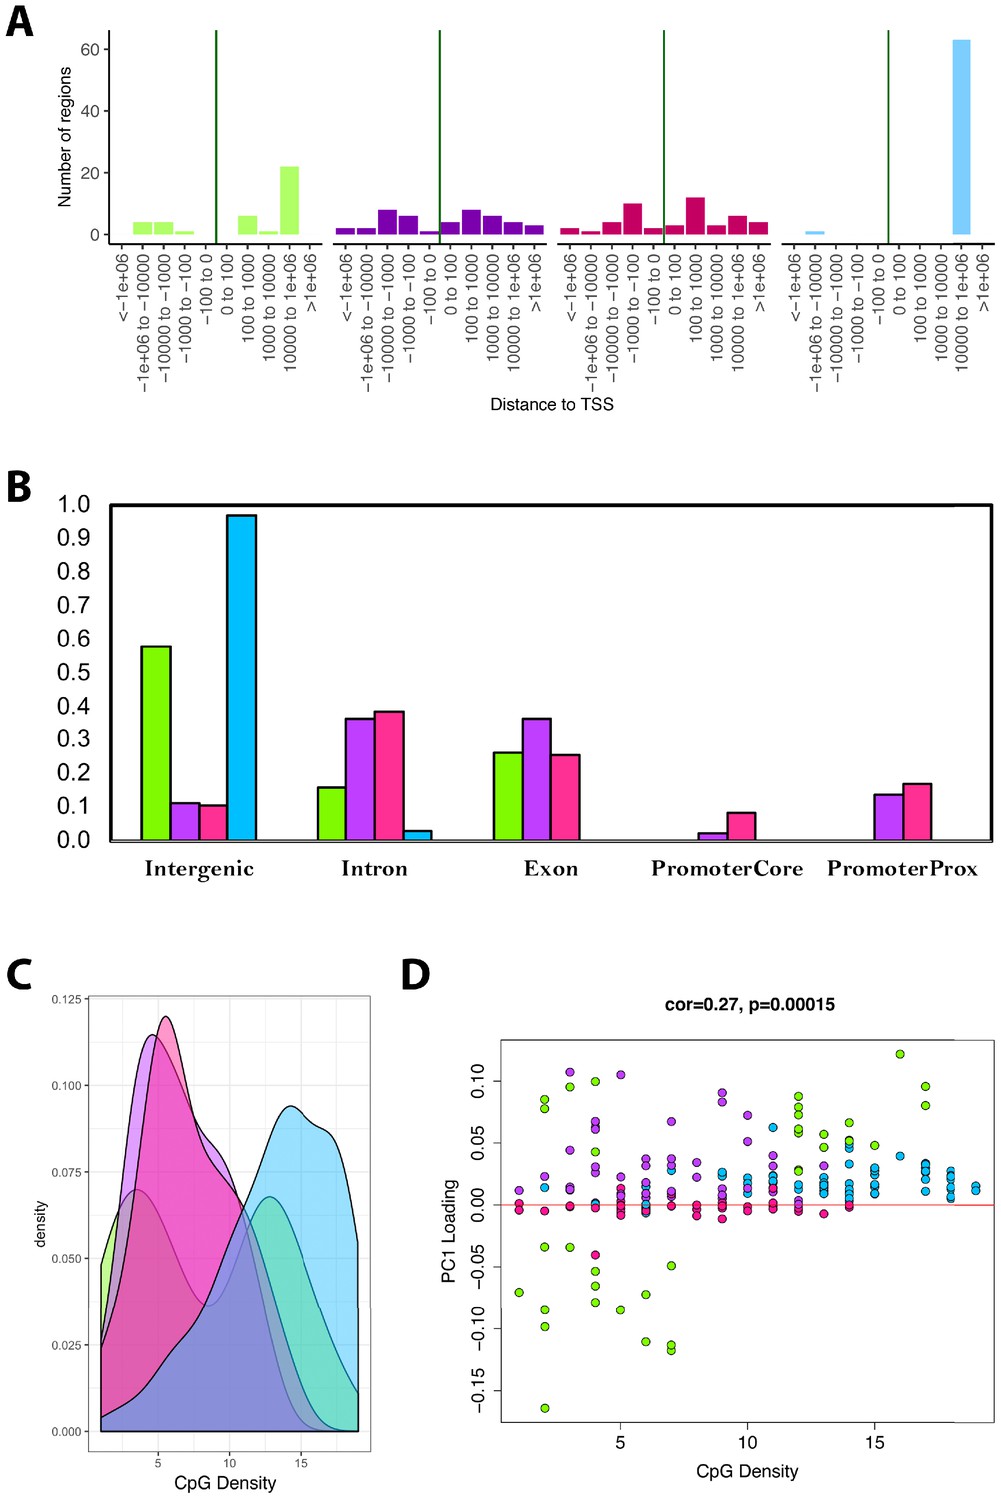
Module characteristics.
(A) Base-pair proximities of CpGs to Transcription Start Sites (TSS), according to module assignment (denoted by color). We find a high proportion of CpGs in the blue module (and to some extent the green module) are located 10,000 to 1,000,000 downstream of TSS. (B) Proportion of CpGs in various genomic regions as a function of module (denoted by color). Results suggest that 98% of CpGs in the blue module and 60% of CpGs in the green module are in intergenic regions. (C) Distribution of surrounding CpGs densities according to module (denoted by color). CpG density was (x-axis) was calculated as the number of CpGs within a 100 bp window (50 bp on either side of the CpG of interest). We observed that the blue module tended to be comprised of CpGs located in regions of higher CpG density (island), while the green module was bimodal, with half the CpGs in it being located in high-density regions, and the other half in low-density regions. (D) We then plotted CpG density as a function of the CpG loading for PC1 that was used to estimate DNAmAge from overlapped CpGs. We find that for the green module, CpGs with strong negative loadings are in low-density regions, while those with high loadings are in both low- and high-density regions.
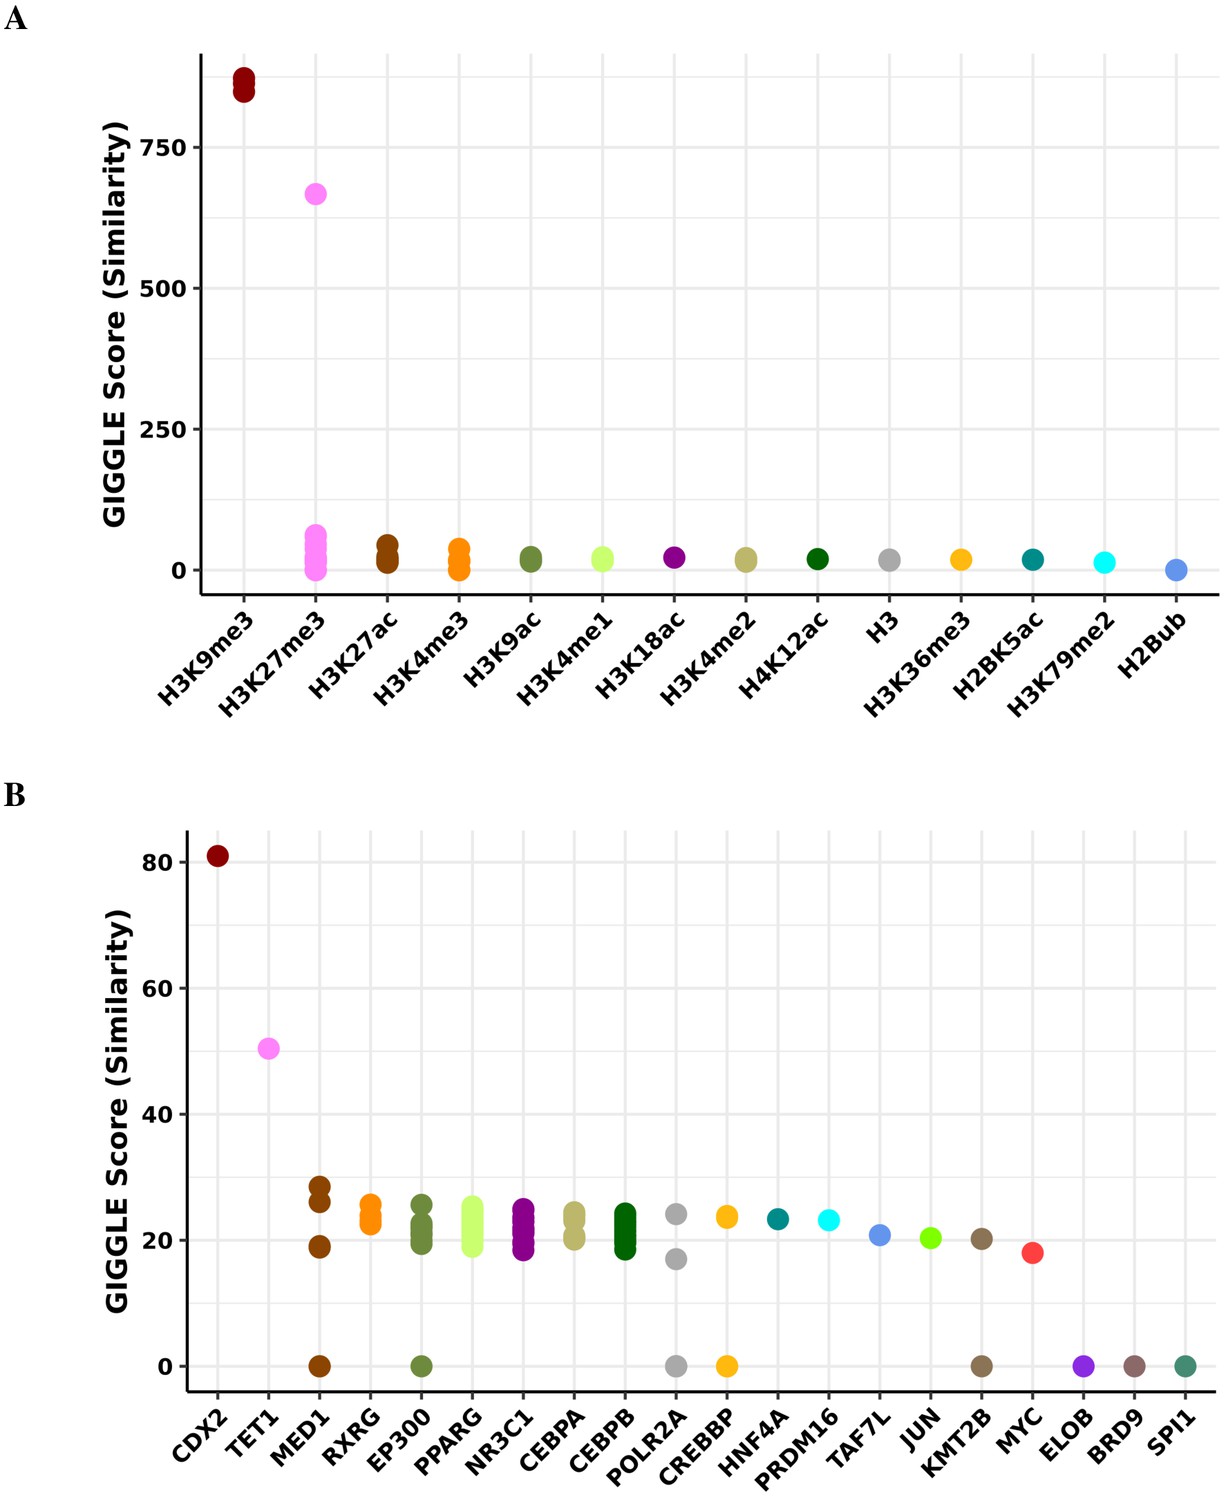
Figure 5—figure supplement 1

Transcription factor binding and histone mark enrichment for blue module.
Based on the genomic locations of CpGs in the blue module (n = 64), Cistrome Project database (http://cistrome.org) was used to assess enrichment for binding overlap of histone marks and variants (A) and transcription factors and chromatic regulators (B).
Figure 5—figure supplement 2
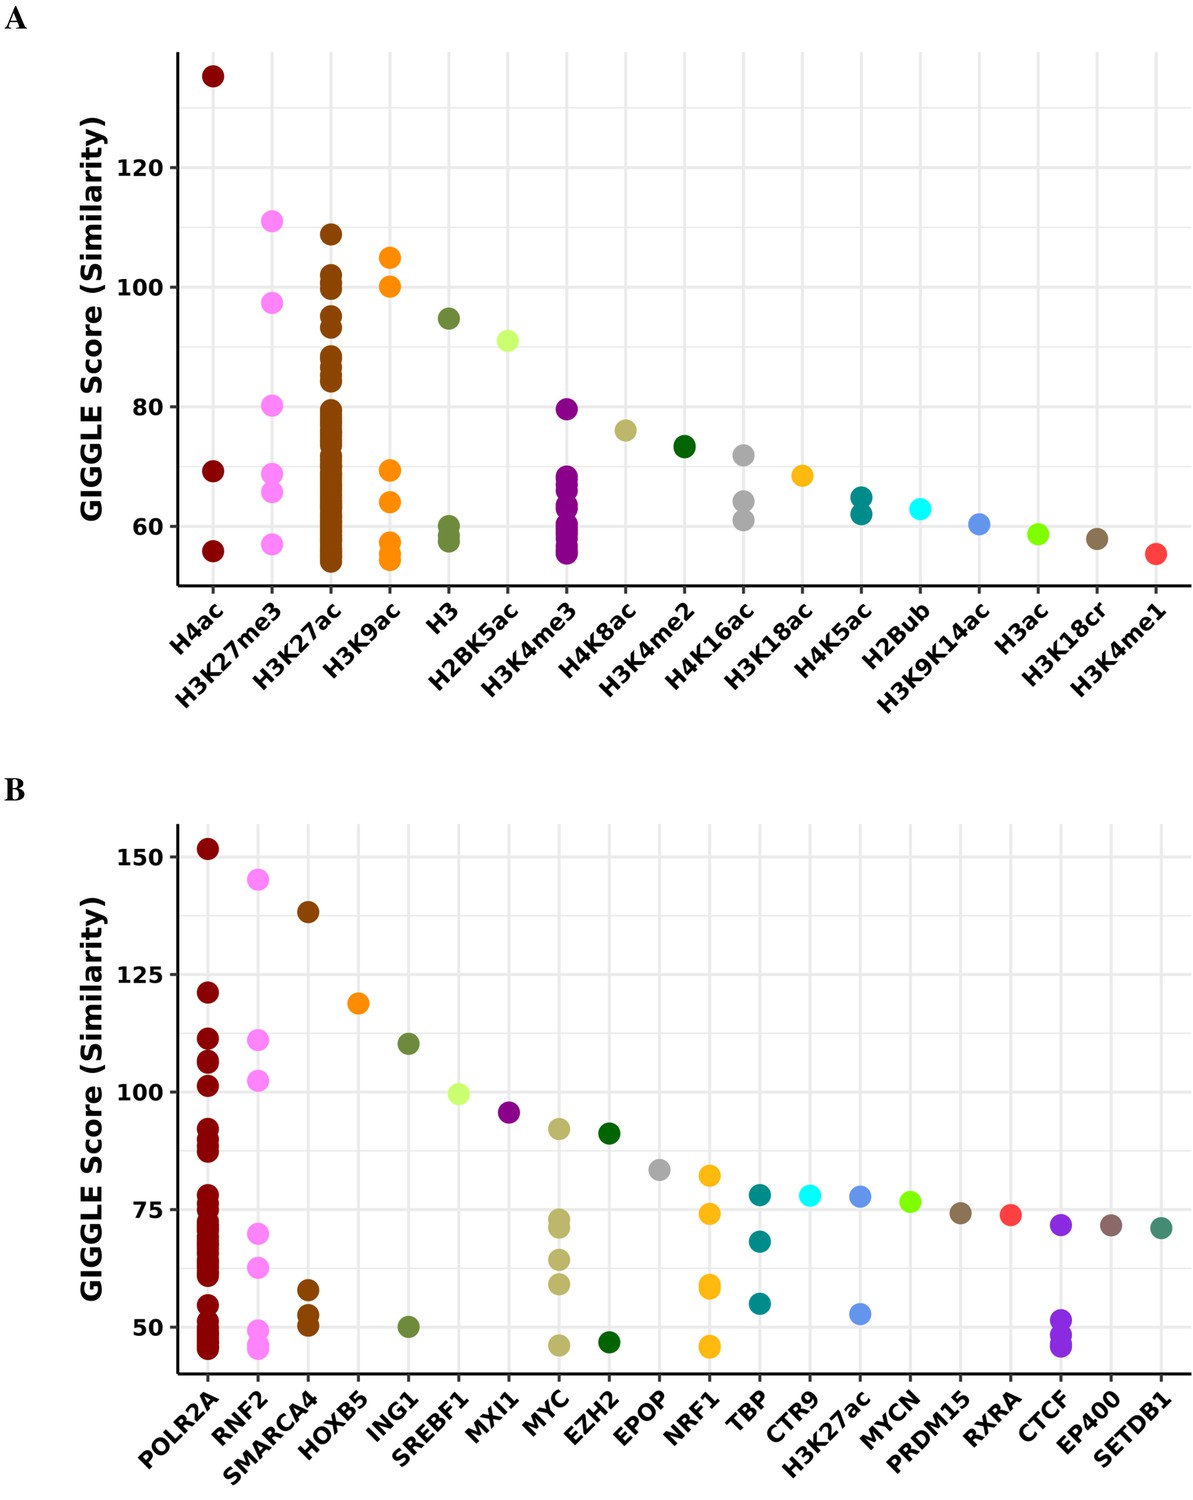
Transcription factor binding and histone mark enrichment for green module.
Based on the genomic locations of CpGs in the green module (n = 38), Cistrome Project database (http://cistrome.org) was used to assess enrichment for binding overlap of histone marks and variants (A) and transcription factors and chromatic regulators (B).
Figure 5—figure supplement 3

Transcription factor binding and histone mark enrichment for purple module.
Based on the genomic locations of CpGs in the purple module (n = 44), Cistrome Project database (http://cistrome.org) was used to assess enrichment for binding overlap of histone marks and variants (A) and transcription factors and chromatic regulators (B).
Figure 5—figure supplement 4
Transcription factor binding and histone mark enrichment for pink module.
Based on the genomic locations of CpGs in the pink module (n = 47), Cistrome Project database (http://cistrome.org) was used to assess enrichment for binding overlap of histone marks and variants (A) and transcription factors and chromatic regulators (B).
Tables
Table 1
Pheno PC1 and FACS PC1 are standardized variables, such that they have a standard deviation of 1.
Given that the DNAmAge variable is in units of (months), the beta coefficients represent the increase in DNAmAge (in units of months) associated with every 1 s.d. increase in either PC1 FACS or PC1 Pheno.
| Beta coefficient (P-value) | |||
|---|---|---|---|
| Model 1 | Model 2 | Model 3 | |
| DNAmAge (PC1) | |||
| Age | 0.75 (6.0e-15) | 0.63 (1.27e-11) | 0.42 (4.4e-4) |
| Pheno PC1 | -- | 1.46 (3.4e-3) | 1.29 (5.9e-3) |
| FACS PC1 | -- | 1.91 (2.7e-2) | |
Key resources table
| Reagent type (species) or resource | Designation | Source or reference | Identifiers | Additional information |
|---|---|---|---|---|
| Strain, strain background (Rattus norvegicus, male) | Fischer 344 CDF | NIA Aged Rodent Colony | ||
| Software, algorithm | Fusion 4.0 | Accuscan Instruments, Inc | ||
| Software, algorithm | Rota-Rod Treadmill Control Software | MED-Associates, Inc | SOF-ENV-575 | |
| Commercial assay or kit | QIAamp DNA Blood Mini Kit | Qiagen | 51106 | |
| Commercial assay or kit | Genomic DNA Clean & Concentrator (gDCC) | Zymo | D4010 | |
| Commercial assay or kit | Qubit 1x dsDNA HS Assay Kit | Thermo Fisher Scientific | Q33231 | |
| Antibody | Anti-rat CD3-FITC (Mouse monoclonal) | BioLegend | Cat#: 201403 | FACS (1.0 ul/test) |
| Antibody | Anti-rat CD25-PE (Mouse monoclonal) | BioLegend | Cat#: 202105 | FACS (1.25 ul/test) |
| Antibody | Anti-rat CD8a-PerCP (Mouse monoclonal) | BioLegend | Cat#: 201712 | FACS (5.0 ul/test) |
| Antibody | Anti-rat CD11b/c-PE-Cy7 (Mouse monoclonal) | BioLegend | Cat#: 201818 | FACS (1.25 ul/test) |
| Antibody | Anti-rat CD4-APC-Cy7 (Mouse monoclonal) | BioLegend | Cat#: 201518 | FACS (2.5 ul/test) |
| Antibody | Anti-rat RT1B-AF647 (Mouse monoclonal) | BD Biosciences | Cat#: 562223 | FACS (1.25 ul/test) |
| Antibody | Anti-rat CD45RA-BV421 (Mouse monoclonal) | BD Biosciences | Cat#: 740043 | FACS (1.25 ul/test) |
| Antibody | Anti-rat CD45-BV605 (Mouse monoclonal) | BD Biosciences | Cat#: 740371 | FACS (1.25 ul/test) |
| Sequence-based reagent | Immunoprep Reagent System | Beckman Coulter | Cat#: 7546999 | |
| Sequence-based reagent | AMPure XP | Beckman Coulter | CAT#:A63880 | RRBS (variable) |
| Commercial assay or kit | TruSeq Barcoded Adapters | Illumina | CAT#:FC-121-1003 | RRBS |
| Software, algorithm | CutAdapt | v2.4 | RBBS adapter trimming | |
| Software, algorithm | BSSeeker2 | v2.0.4 | RRBS Alignment / Methylation Calling |
Author response table 1
| Β Coefficient (P-value) | ||||
|---|---|---|---|---|
| Model 1 | Model 2 | Model 3 | ||
| DNAmAge (PC1) | ||||
| Age | 0.75 (6.0e-15) | 0.63 (1.27e-11) | 0.42 (4.4e-4) | |
| Pheno PC1 | -- | 1.46 (3.4e-3) | 1.29 (5.9e-3) | |
| FACS PC1 | -- | 1.91 (2.7e-2) | ||
Additional files
-
Source data 1
Rat estimated DNAmAge and traits.
DNAmAge is estimated using the PCA-based method with input from the 3625 overlapped CpGs.
- https://cdn.elifesciences.org/articles/59201/elife-59201-data1-v1.csv.zip
-
Source data 2
Mouse estimated DNAmAge and traits.
DNAmAge is estimated using the PCA-based method with input from the 3625 overlapped CpGs.
- https://cdn.elifesciences.org/articles/59201/elife-59201-data2-v1.csv.zip
-
Supplementary file 1
Table S1. PC1 loading for phenotypic variables. Table S2. Phenotypic associations with DNAmAge based on overlapped CpGs. Table S3. Association between DNAmAge and caloric restriction (CR) in C57BL/6. Table S4. Phenotypic associations with DNAmAge based on overlapped CpGs. Table S5. Association between DNAmAge and individual phenotype variables PC1 loading for phenotypic variables.
- https://cdn.elifesciences.org/articles/59201/elife-59201-supp1-v1.docx
-
Transparent reporting form
- https://cdn.elifesciences.org/articles/59201/elife-59201-transrepform-v1.docx
Download links
A two-part list of links to download the article, or parts of the article, in various formats.
Downloads (link to download the article as PDF)
Open citations (links to open the citations from this article in various online reference manager services)
Cite this article (links to download the citations from this article in formats compatible with various reference manager tools)
A rat epigenetic clock recapitulates phenotypic aging and co-localizes with heterochromatin
eLife 9:e59201.
https://doi.org/10.7554/eLife.59201


