Discovery and characterization of a novel family of prokaryotic nanocompartments involved in sulfur metabolism
- Department of Molecular and Cell Biology, University of California, Berkeley, United States
- Department of Molecular Genetics, University of Toronto, Canada
- Department of Plant and Microbial Biology, University of California, Berkeley, United States
- Department of Chemistry, University of California Berkeley, United States
- Howard Hughes Medical Institute, University of California, Berkeley, United States
- Molecular Biophysics and Integrated Bioimaging Division, Lawrence Berkeley National Laboratory, United States
- California Institute for Quantitative Biosciences (QB3), University of California, Berkeley, United States
- Molecular Biophysics and Integrated Bio-Imaging Division, Lawrence Berkeley National Laboratory, United States
Figures
Figure 1 with 4 supplements
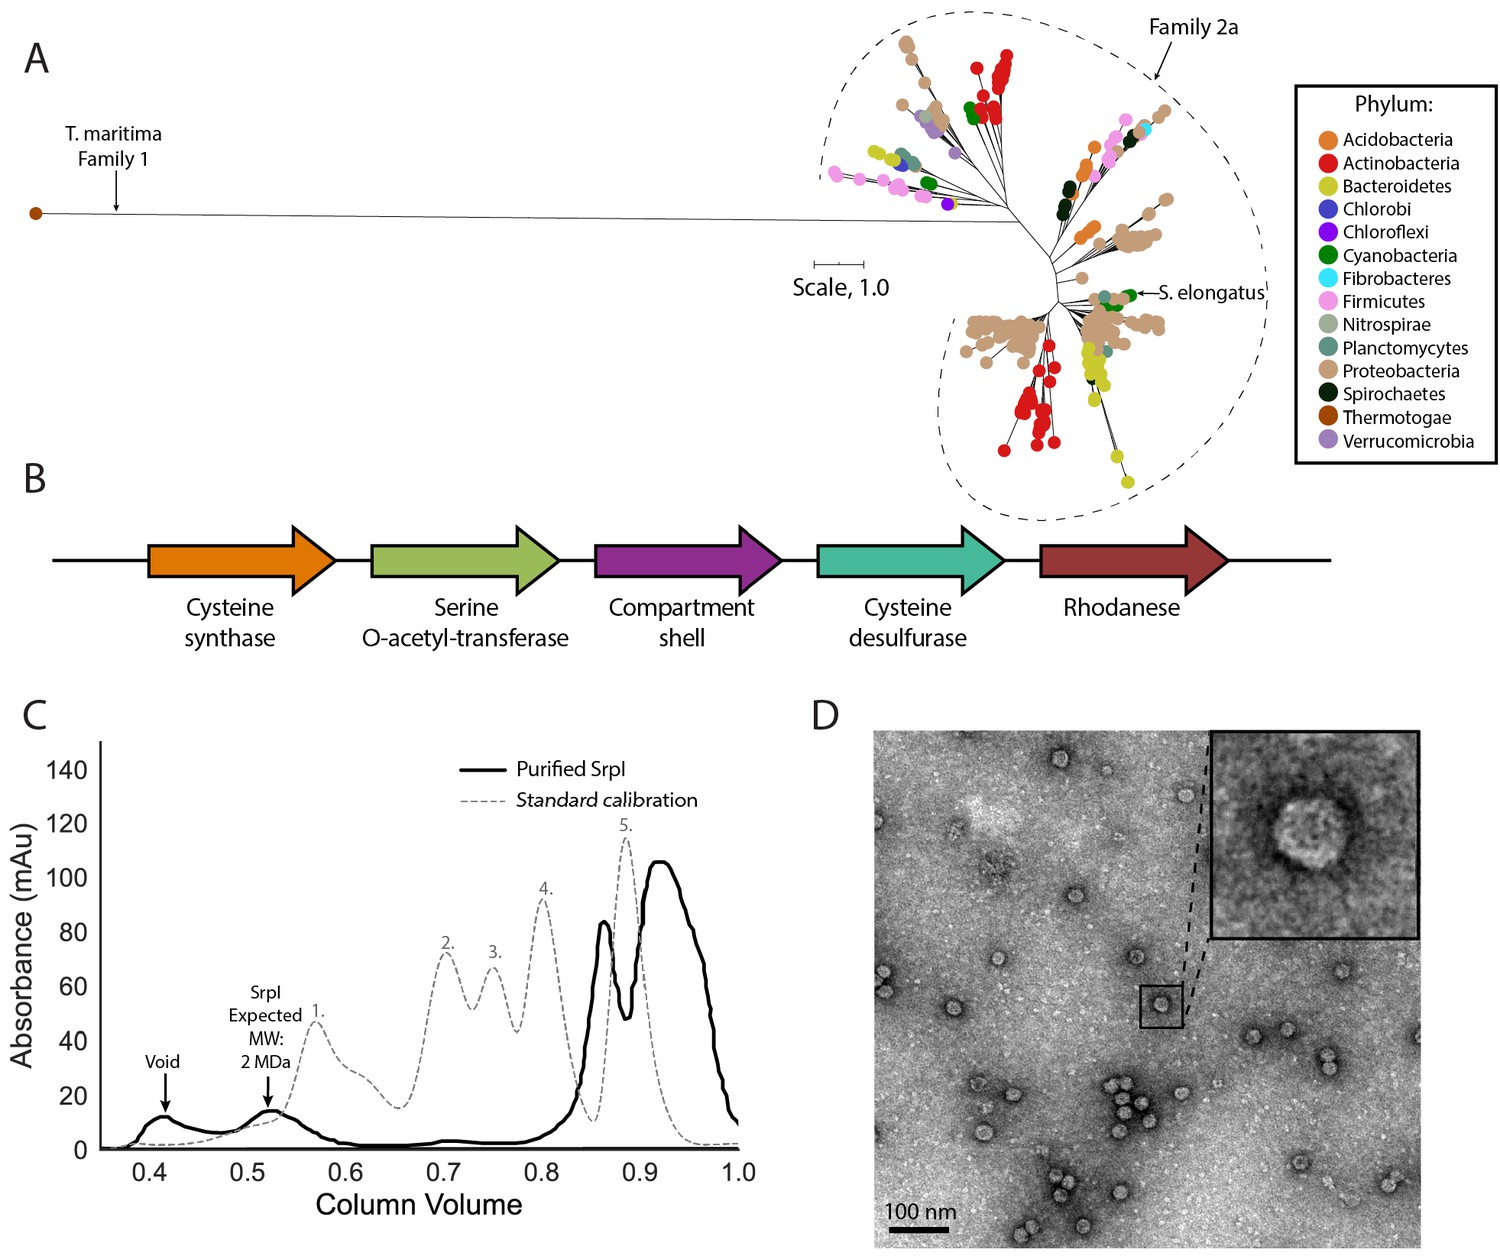
SrpI is a bacterial nanocompartment that is widespread throughout bacterial phyla and found neighboring sulfur metabolism genes.
(A) Maximum-likelihood phylogenetic tree of Family 2a encapsulin shell proteins using the T. maritima Family 1 encapsulin shell protein (WP_004080898.1) as a Family 1 representative. Scale bar, one substitution per site. (B) Genomic neighborhood of the Family 2a encapsulin shell gene from S. elongatus PCC 7942. (C) Size exclusion-chromatogram of purified SrpI shell protein (black solid line) and Bio-Rad gel filtration calibration standard (gray dashed line) using a Superose 6 Increase column (GE Life Sciences). Expected molecular weight was determined using Bio-Rad gel filtration calibration standard: 1. Thyroglobin (670 kDa) 2. γ-globulin (158 kDa) 3. Ovalbumin (44 kDa) 3. Myoglobin (17 kDa) Vitamin B12 (1.4 kDa). (D) Negative stain TEM micrograph of resulting SrpI encapsulin-containing fraction post size-exclusion chromatography. Scale bar, 100 nm.
Figure 1—figure supplement 1
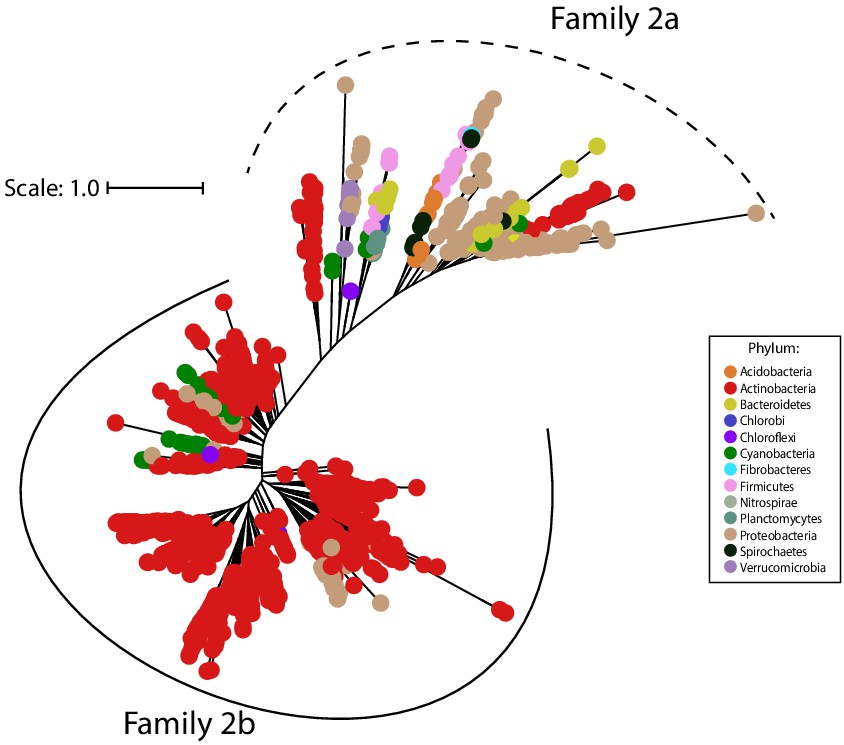
Family 2 encapsulins can be divided into two phylogenetically distinct subfamilies.
Maximum likelihood phylogenetic tree of 1383 members of Family 2 encapsulins. Family 2a (dashed line grouping) and Family 2b (solid line grouping) represent two subfamilies. Family 2 encapsulins are found throughout 13 different bacterial phyla and are distributed in a polyphyletic fashion. Scale bar, one substitution per site.
Figure 1—figure supplement 2
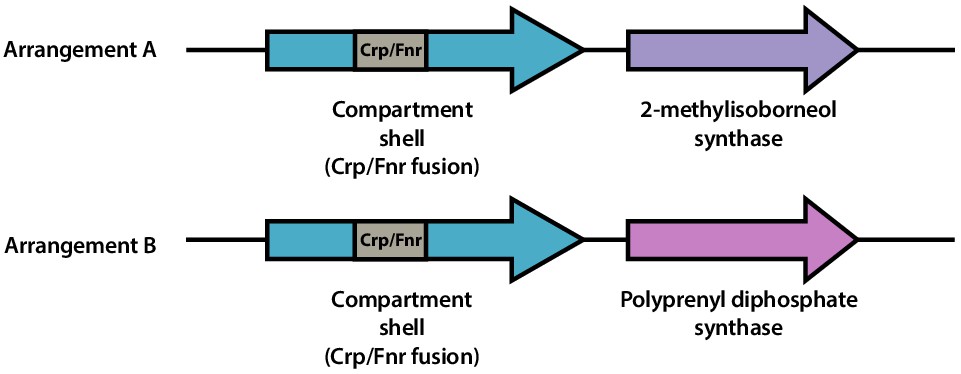
Family 2b shell genes neighbor 2-methylisoborneol synthase or polyprenyl diphosphate synthase.
Schematic of representative genomic arrangements for Family 2b shell genes determined using the EFI-GNT web tool. One or both arrangements (A and B) may be found within a given genome. Family 2b shell genes possess a Crp/Fnr transcriptional regulator domain (gray) within the shell gene.
Figure 1—figure supplement 3
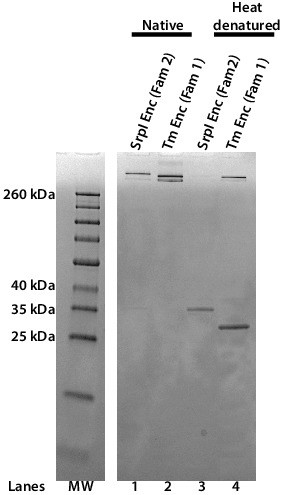
The Family 2 encapsulin, SrpI, forms a high-molecular-weight complex similar to the Family 1encapsulin from T. maritima.
SDS-PAGE analysis of purified S. elongatus PCC 7942 Family 2 encapsulin (SrpI Enc) and T. maritima Family 1 encapsulin (Tm Enc). Lanes 1 and 2 correspond to samples that were not heat-denatured (Native). Lanes 3 and 4 correspond to samples that were heat denatured at 95°C for 15 min. Molecular weight marker (MW): Spectra Multicolor Broad Range Protein Ladder.
Figure 1—figure supplement 4
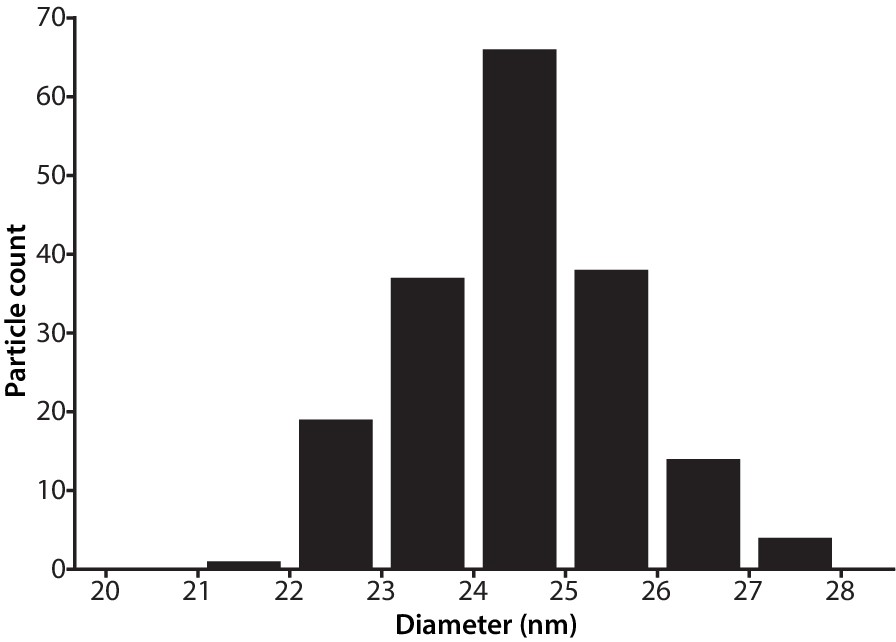
Size distribution of SrpI encapsulin.
Diameter of purified SrpI encapsulin determined by negative stain transmission electron microscopy. Quantification of 180 particles from micrographs performed using FIJI image processing package.
Figure 2 with 3 supplements
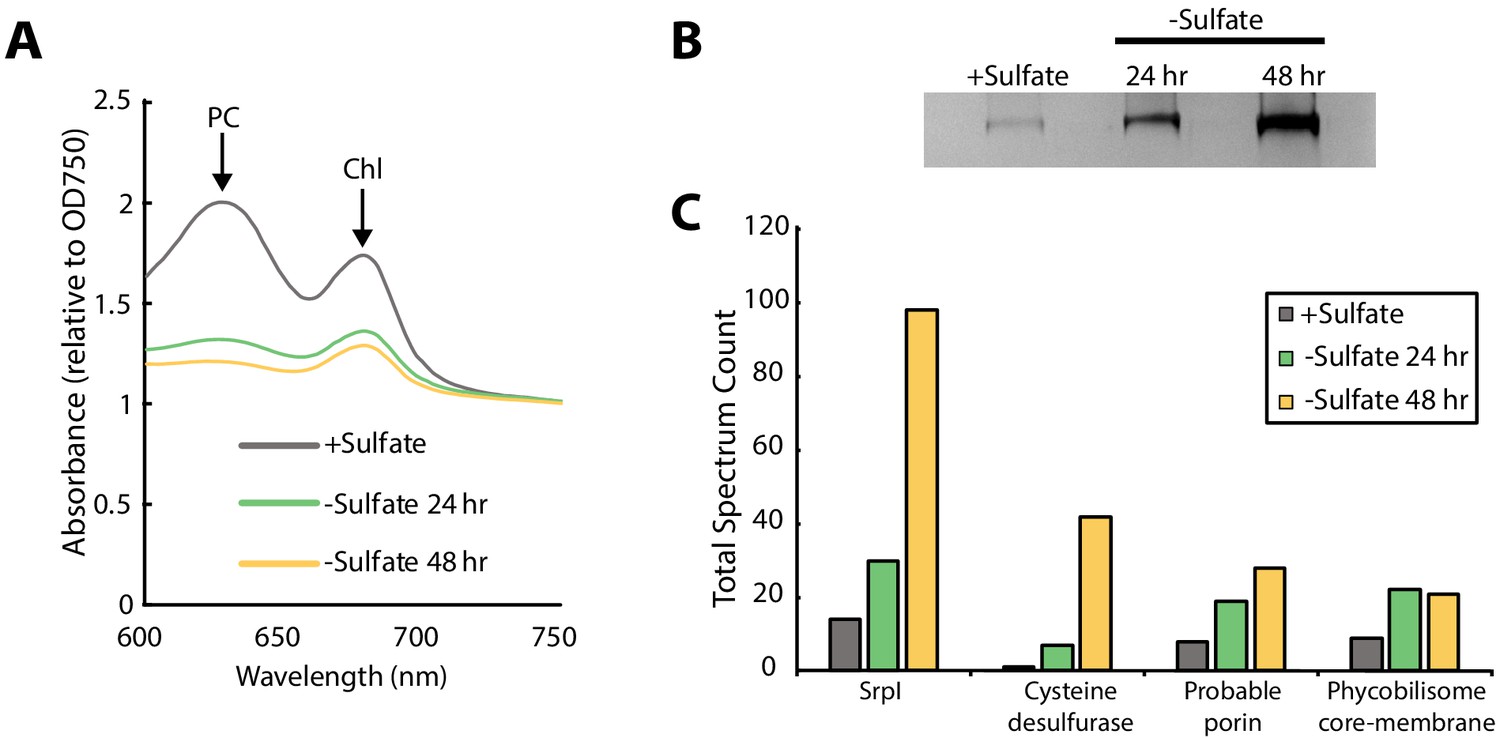
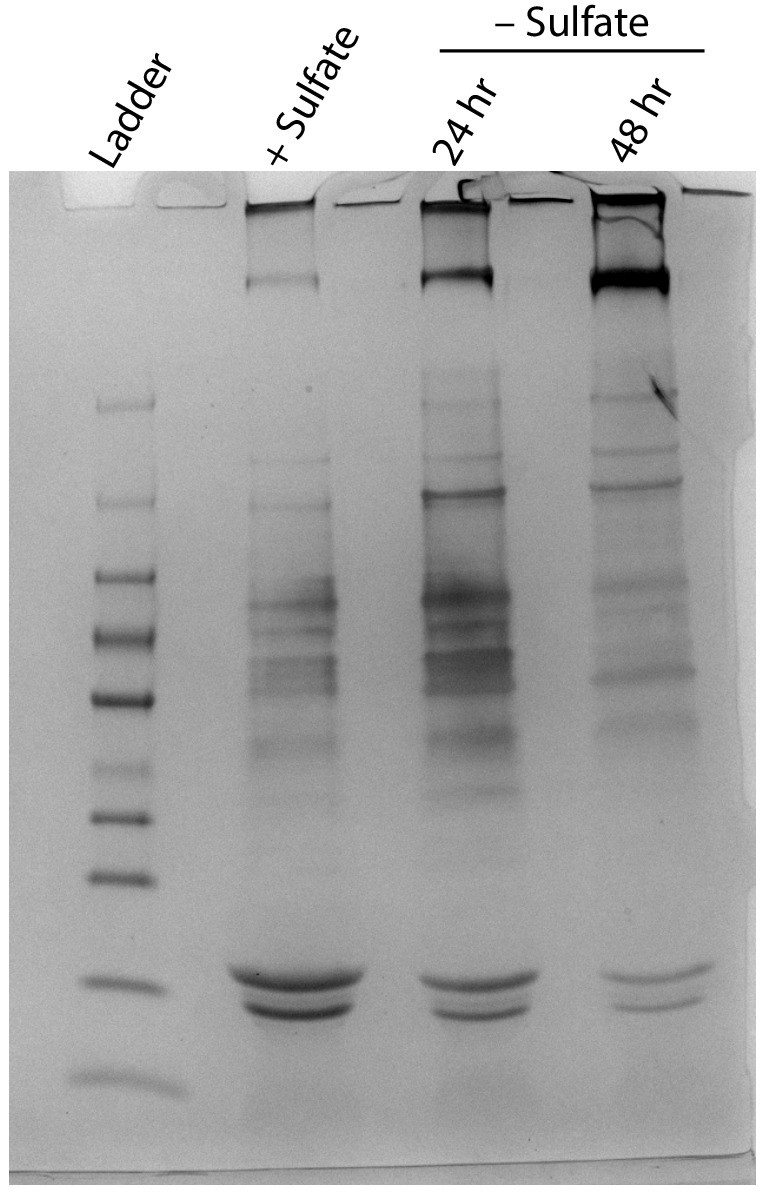
SrpI encapsulin is upregulated in S. elongatus upon sulfate starvation.
(A) Absorbance spectra of S. elongatus liquid cultures under nutrient-replete conditions (+Sulfate) and sulfur starvation (-Sulfate) for 24 and 48 hr. Absorbance maxima of phycocyanin (PC) at 620 nm and chlorophyll (Chl) at 680 nm are indicated. Absorbance spectra are normalized to the same optical density at 750 nm. (B) Non-denaturing SDS-PAGE analysis of lysates from nutrient-replete and sulfur starved S. elongatus cultures visualized by silver stain. Inputs were normalized using absorbance at 280 nm. (C) Liquid chromatography-mass spectrometry of excised high-molecular-weight bands from SDS-PAGE analysis. Top protein hits from each condition are represented by total spectrum counts. Total spectrum count of all identified proteins can be found in Supplementary file 5.
Figure 2—figure supplement 1
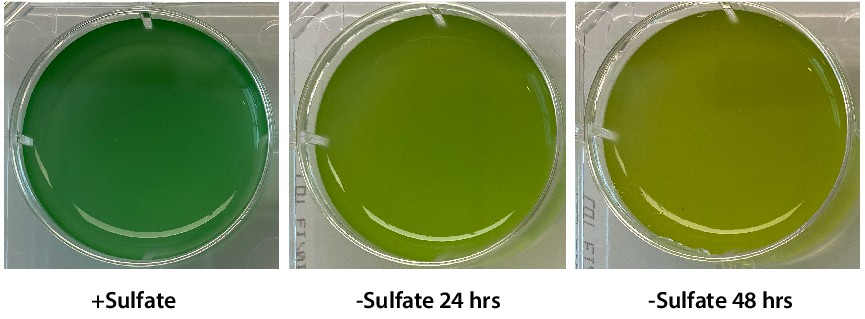
Chlorosis phenotype of sulfur-starved S. elongatus PCC 7942.
Liquid cultures of S. elongatus PCC 7942 grown in nutrient replete medium (+Sulfate) or under sulfate starvation for 24 hr and 48 hr.
Figure 2—figure supplement 2
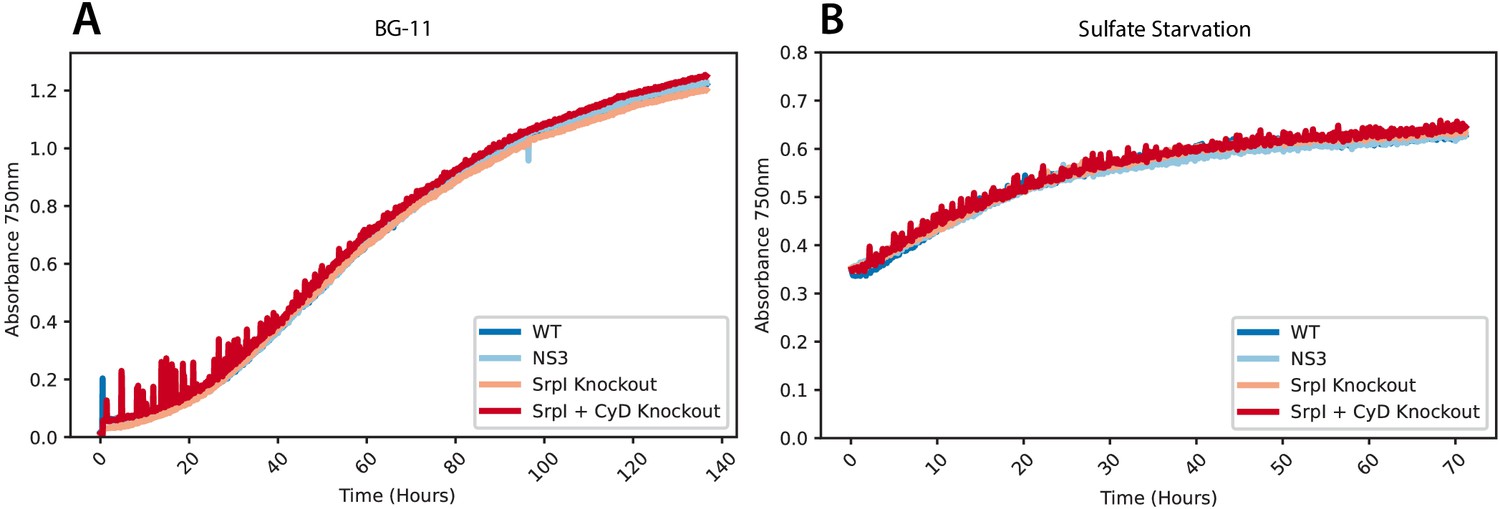
Growth curves of S. elongatus PCC 7942 mutants under sulfur replete and sulfur starvation conditions.
Wild type, SrpI knockout-CmR, SrpI and CyD knockout-CmR, and NS3-CmR strains of S. elongatus PCC 7942 cells were (A) inoculated at OD750 = 0.02 into nutrient replete BG-11 media with constant light (100 μE) at 30°C, bubbling in ambient air for mixing in a Photon Systems Instruments MC-1000 photobioreactor. (B) S. elongatus PCC 7942 strains were grown in in nutrient replete BG-11 until cells reached OD750 = 0.4. Cells were washed three times and resuspended in sulfate dropout BG-11 media and grown in the photobioreactor with constant light (100 μE) at 30°C, bubbling in ambient air for mixing.
Figure 2—figure supplement 3
Non-denaturing SDS-PAGE analysis of lysates from nutrient-replete and sulfur starved S. elongatus cultures visualized by silver stain.
Inputs were normalized using absorbance at 280 nm.
Figure 3 with 4 supplements

An N-terminal signal sequence directs cargo loading in vivo.
(A) Domain organization of cysteine desulfurase (CyD; Synpcc7942_B2661) and the predicted disorder scores calculated using DISOPRED3. CyD can be split into two domains – a highly disordered N-terminal domain and an ordered cysteine desulfurase domain. (B) Sequence WebLogos of conserved motifs found within the N-terminal domain of CyD calculated using the MEME suite motif discovery server. (C) SDS-PAGE analysis of CyD constructs fused to sfGFP. Loading of fusion cargo and untagged-sfGFP control was determined by fluorescence of the nanocompartment band prior to Coomassie staining.
Figure 3—figure supplement 1
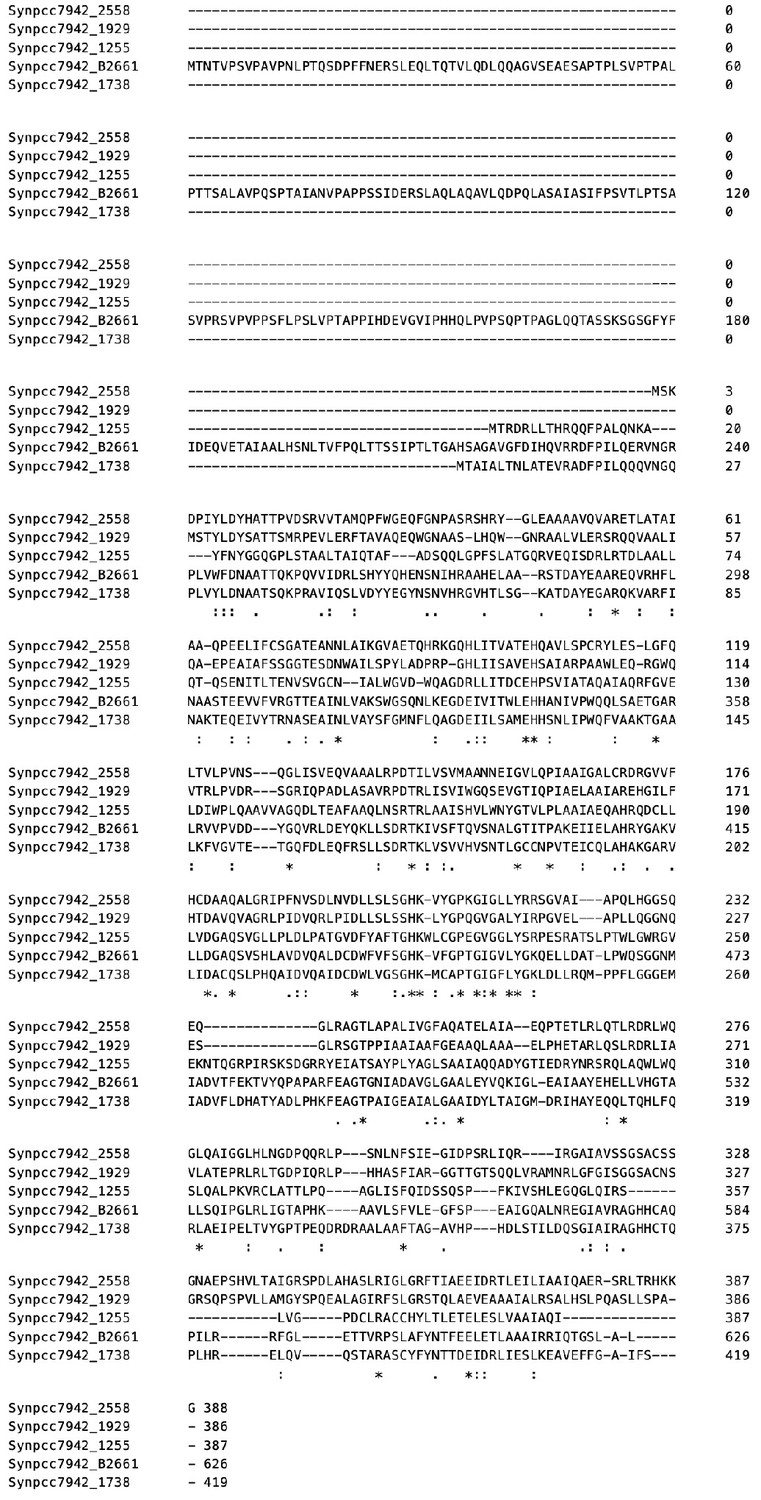
SrpI-associated cysteine desulfurase, CyD, possesses a unique N-terminal domain that is absent in the four other cysteine desulfurase genes in the S. elongatus PCC 7942 genome.
Multiple sequence alignment of the SrpI encapsulin-associated cysteine desulfurase (Synpcc7942_B2661) and the other genomic cysteine desulfurases (Synpcc7942_2558, Synpcc7942_1929, Synpcc7942_1255, Synpcc7942_1738). Alignment was performed using ClustalOmega. An asterisk (*) indicates a fully conserved residue, a colon (:) indicates conservation between amino acids of strongly similar properties, and a period (.) indicates conservation between amino acids of weakly similar properties.
Figure 3—figure supplement 2
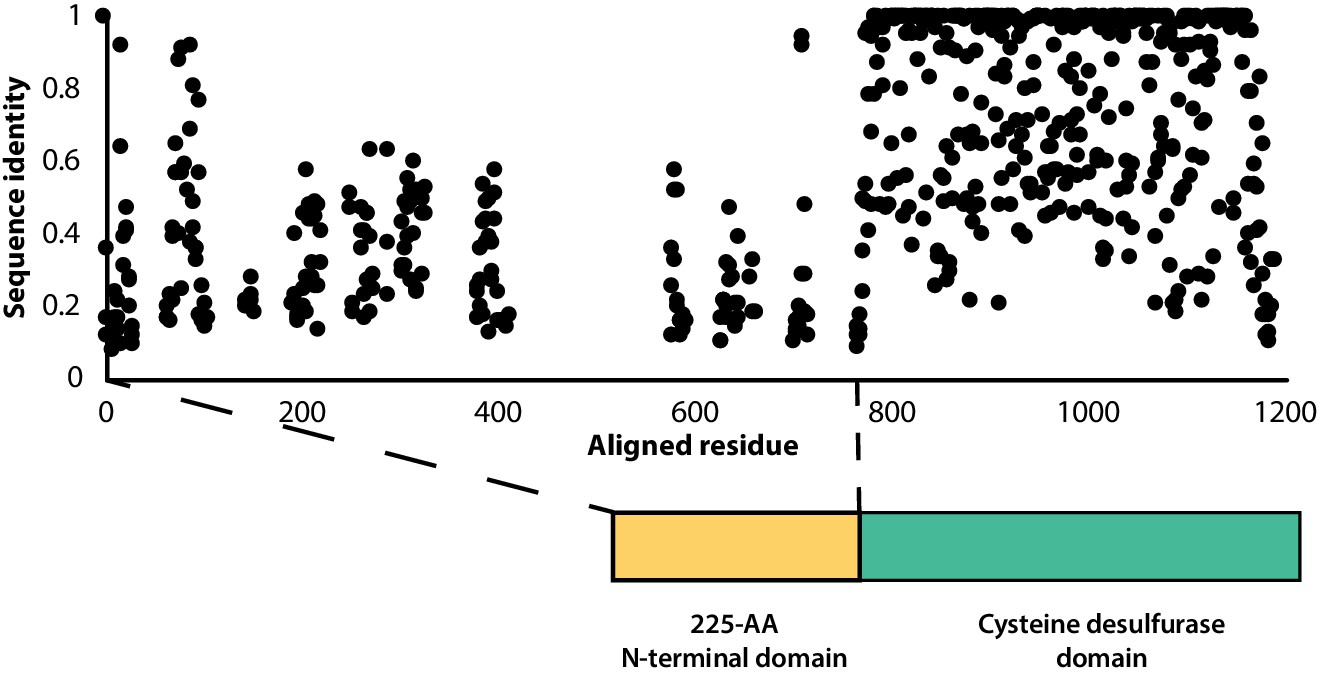
Sequence conservation of the F2A encapsulin-associated cysteine desulfurase is sparse throughout the disordered N-terminal domain.
Percent sequence identity from multiple sequence alignment of 997 F2A encapsulin-associated cysteine desulfurase sequences.
Figure 3—figure supplement 3
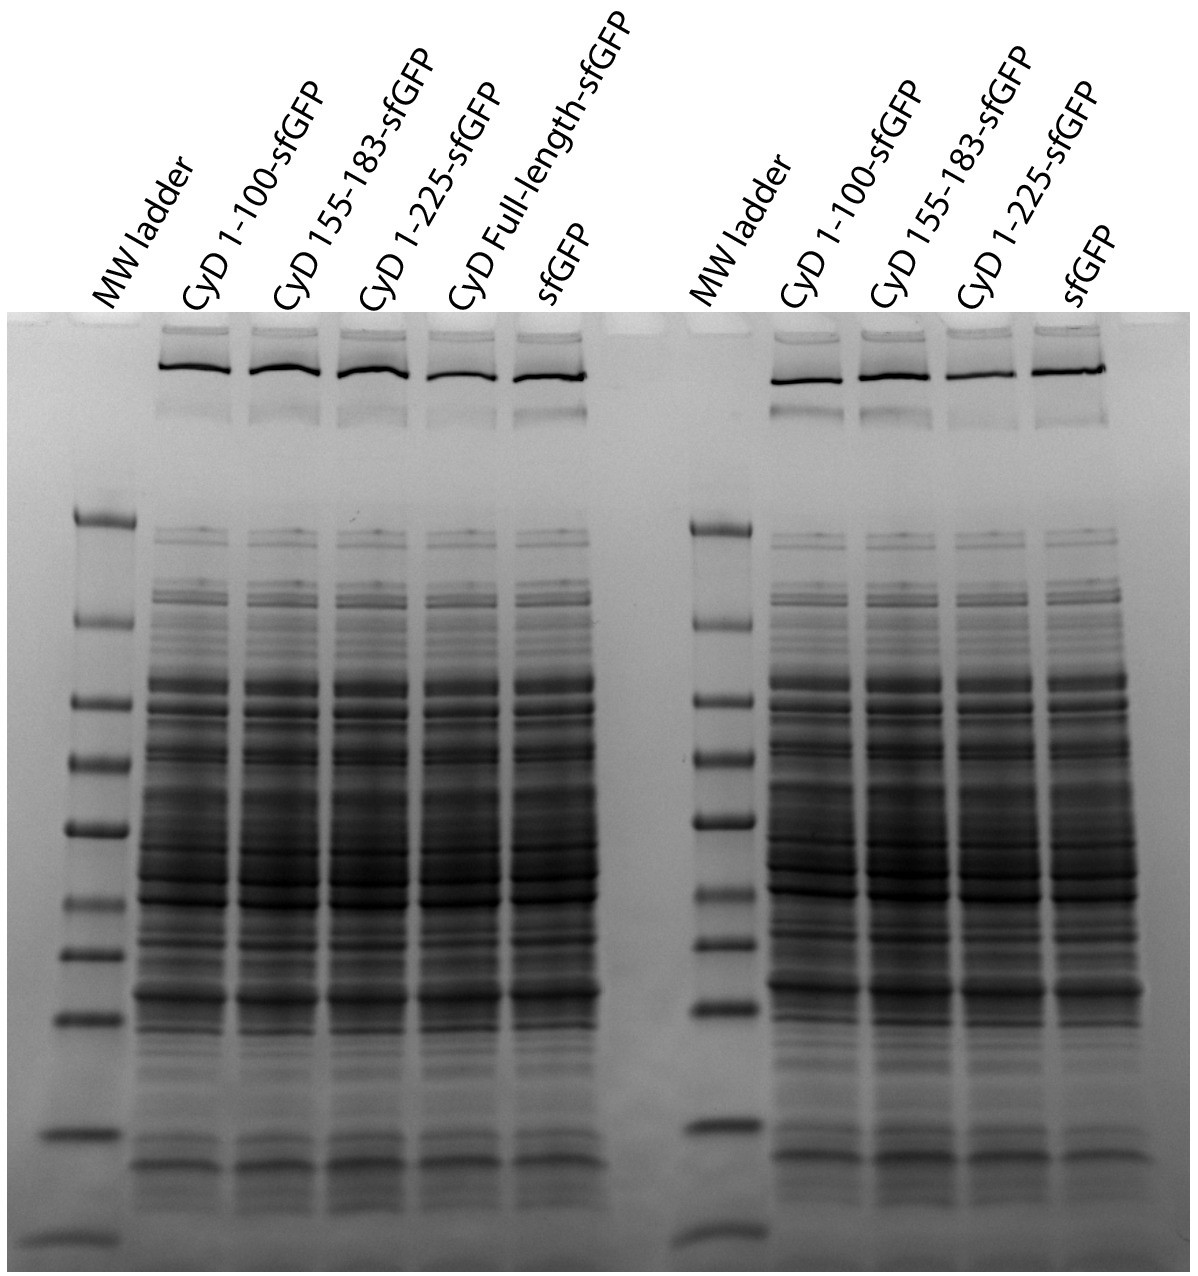
Full gel from Coomassie stain panel of Figure 3C.
Figure 3—figure supplement 4
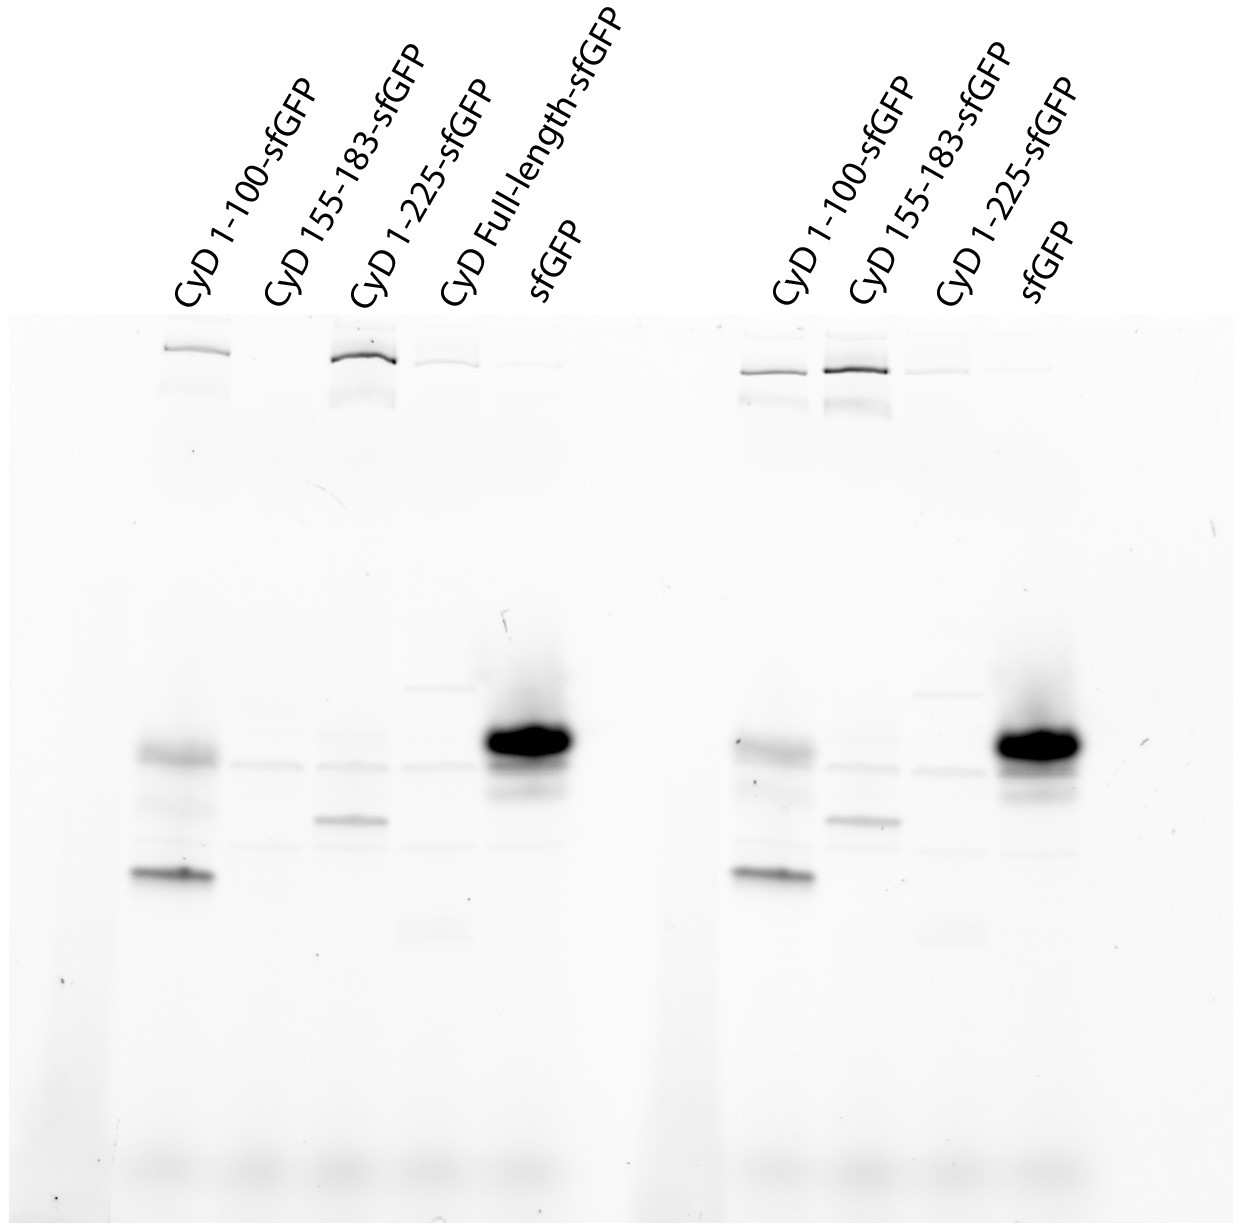
Full gel from sfGFP fluorescence panel of Figure 3C.
Figure 4 with 5 supplements
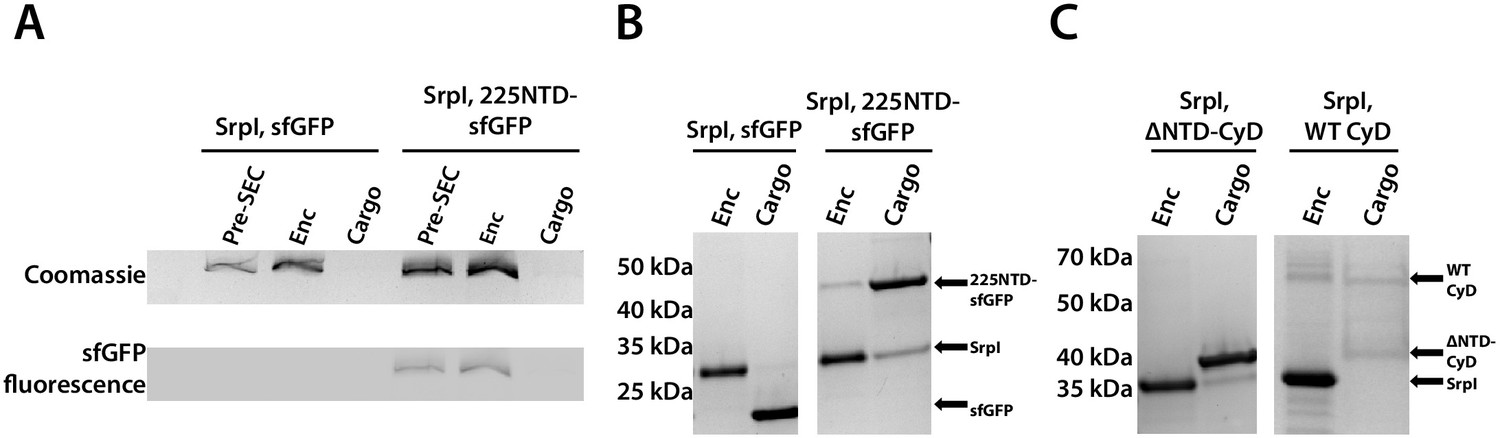
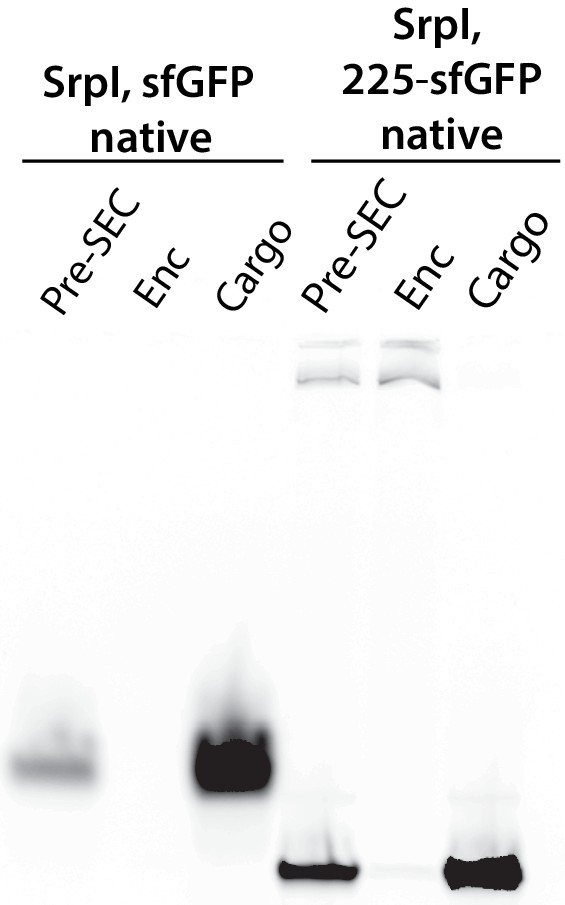
The 225-NTD of CyD is necessary and sufficient for cargo loading in vitro.
(A) Non-denaturing SDS-PAGE of sfGFP or the CyD N-terminal domain-sfGFP fusion (225NTD-sfGFP) loaded in vitro into SrpI encapsulin. sfGFP fluorescence followed by Coomassie staining of the encapsulin (Enc), cargo, and pre size-exclusion chromatography (Pre-SEC) fractions was performed to determine cargo loading and presence of nanocompartment, respectively. (B) Denaturing SDS-PAGE of in vitro loaded sfGFP and 225NTD-sfGFP samples to determine presence of SrpI shell monomer (35 kDa), sfGFP (27 kDa), and 225NTD-sfGFP (50 kDa) in the encapsulin and cargo fractions from size-exclusion chromatography. (C) Denaturing SDS-PAGE of in vitro loaded native cysteine desulfurase (WT CyD) and cysteine desulfurase with the N-terminal domain removed (ΔNTD-CyD) to determine presence of SrpI shell monomer (35 kDa), WT CyD (68 kDa), and ΔNTD-CyD (45 kDa) in the encapsulin and cargo fractions from size-exclusion chromatography. WT CyD is subject to proteolysis, leading to the presence of a ΔNTD-CyD band in the WT CyD cargo fraction.
Figure 4—figure supplement 1
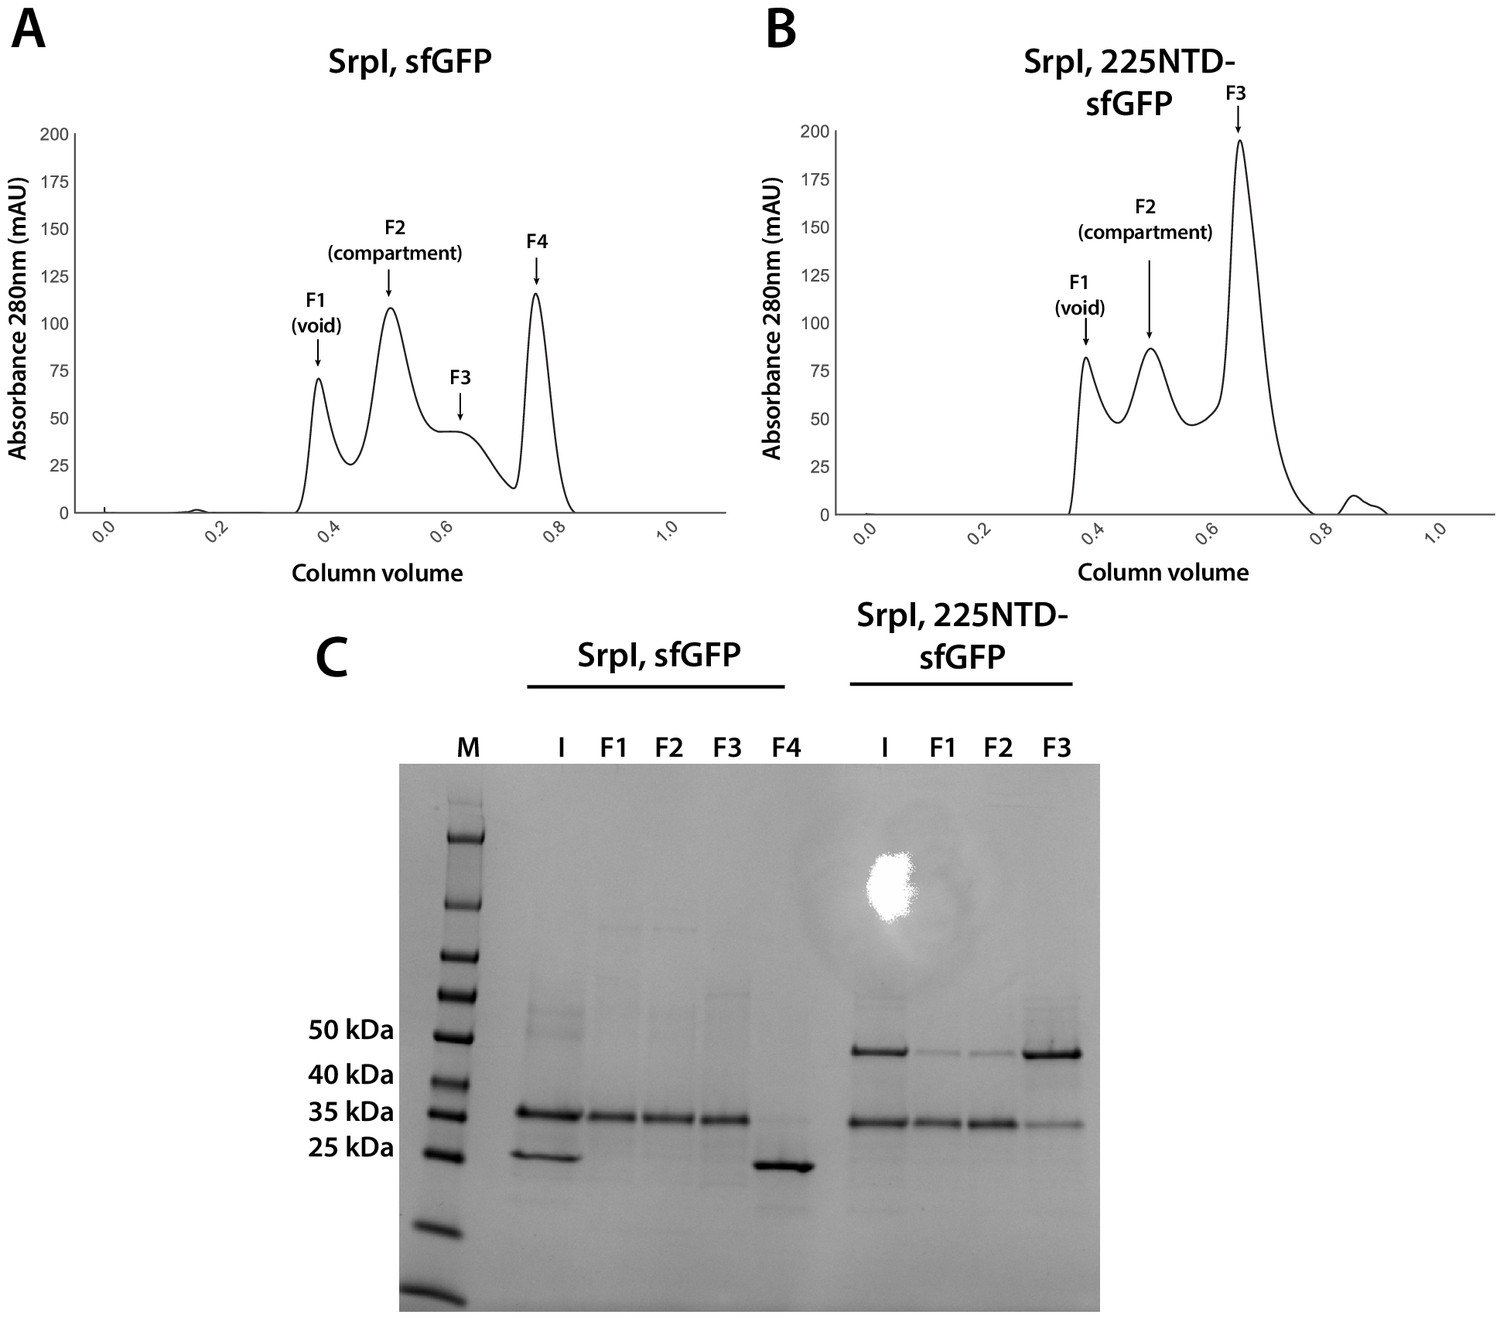
Analysis of sfGFP and 225NTD-sfGFP loading into SrpI encapsulin.
(A and B) size exclusion chromatogram of SrpI encapsulin shell protein (35 kDa) refolded in the presence of untagged sfGFP (27 kDa) and 225NTD-sfGFP (50 kDa) respectively using a Superose 6 Increase column (GE Life Sciences). Fractions are labeled F1-F4 (C) SDS-PAGE analysis of fractions from size exclusion (F1-4), the pre-size exclusion input (I), and a molecular weight marker (M).
Figure 4—figure supplement 2
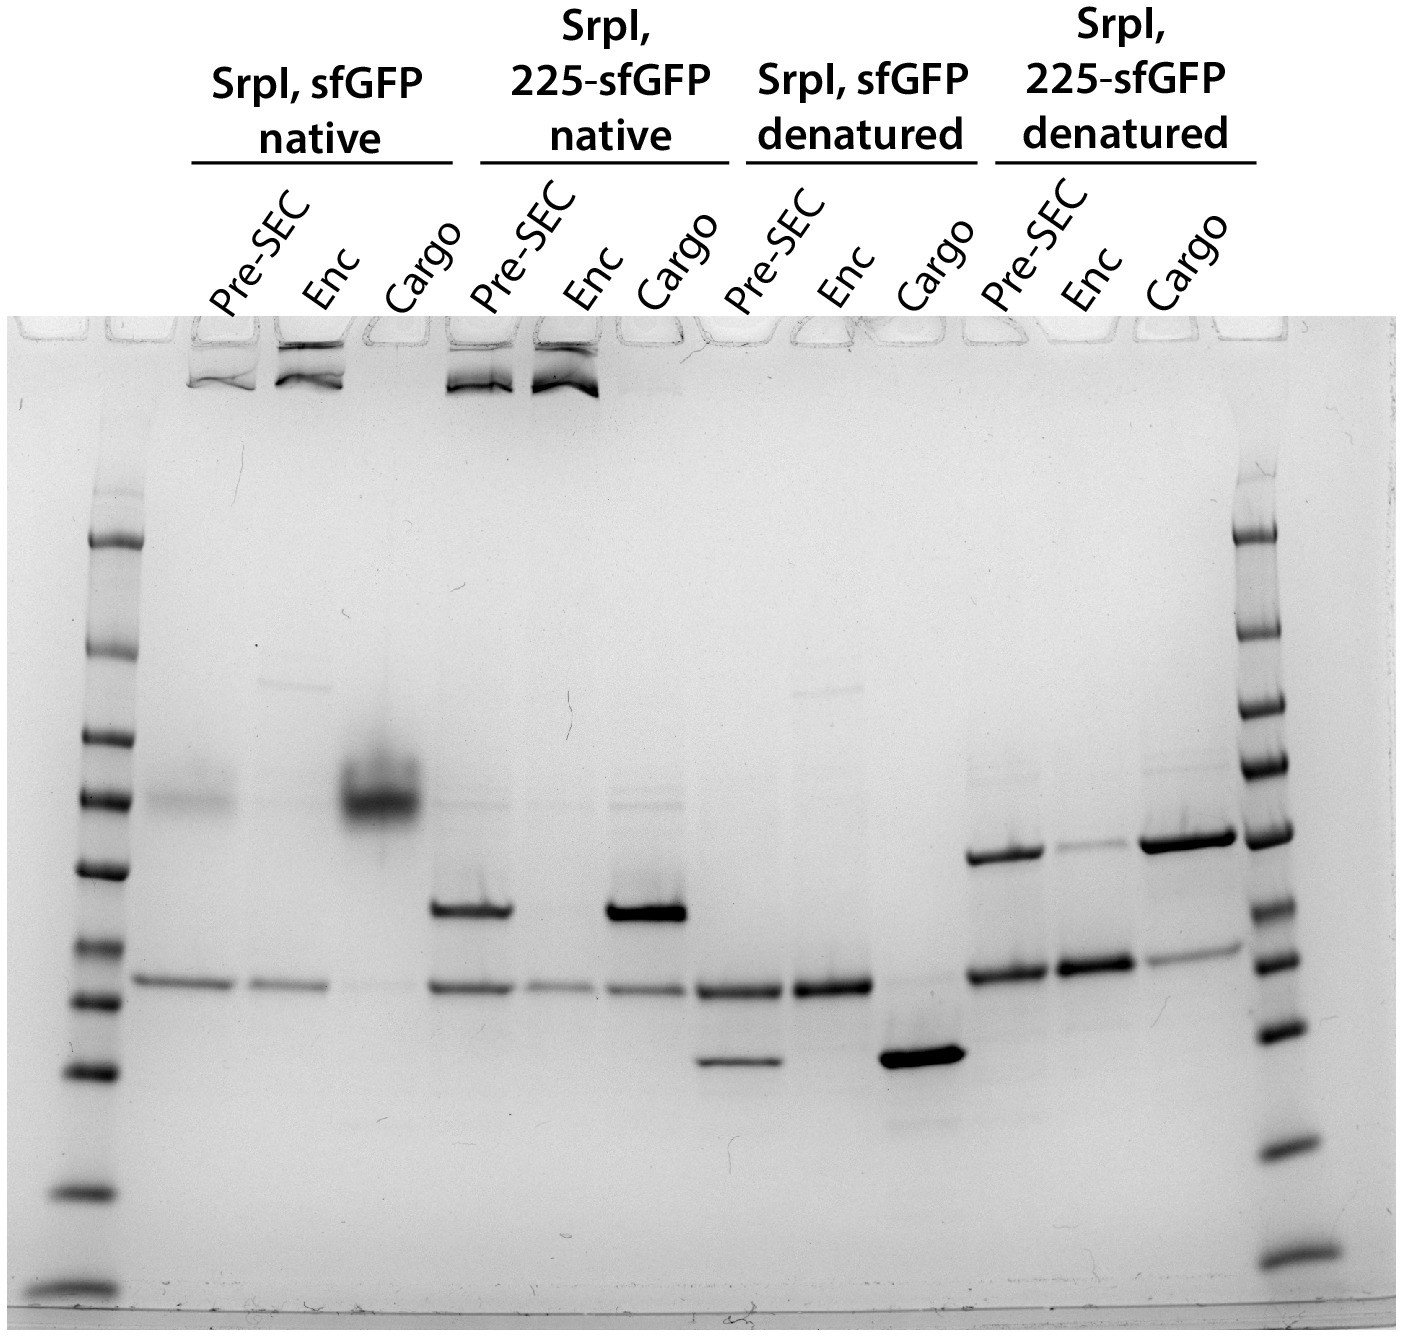
Full Coomassie stained gel for panels A and B of Figure 4.
Figure 4—figure supplement 3
Full gel for fluorescent panel of Figure 4A.
Figure 4—figure supplement 4
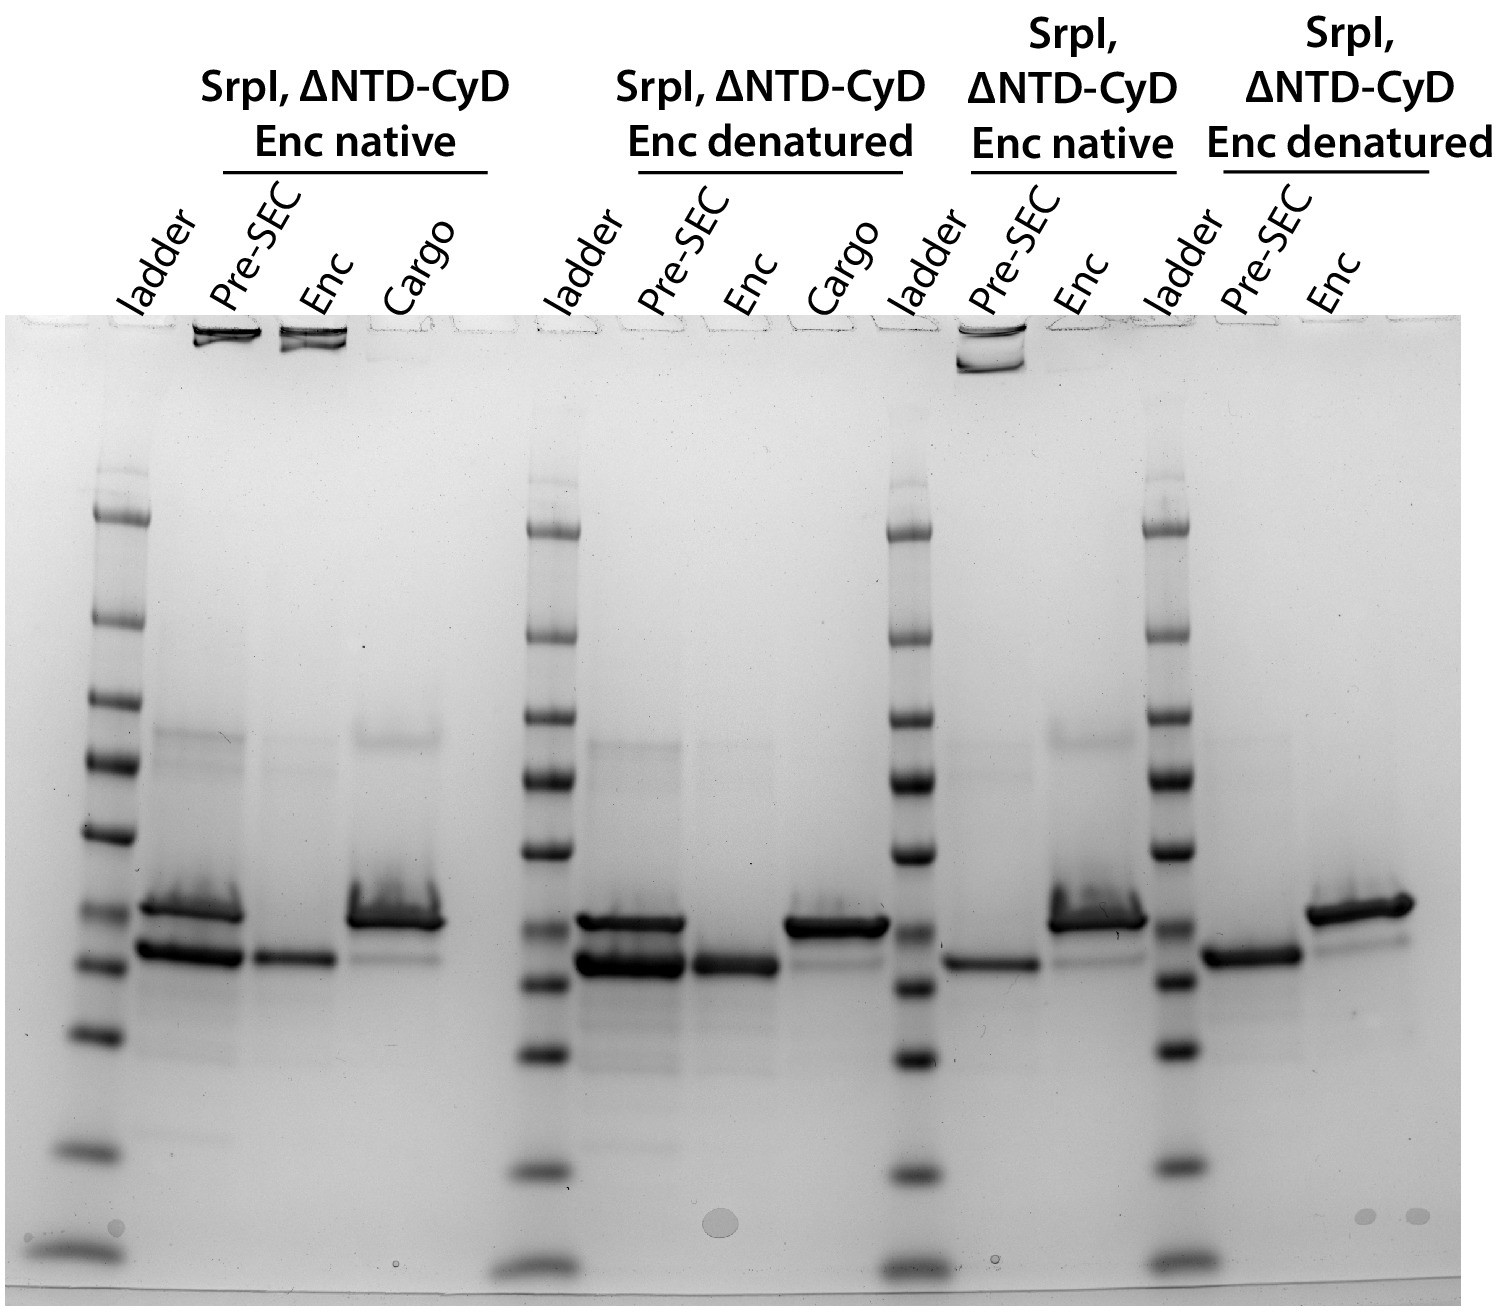
Full gel of the SrpI, ΔNTD-CyD panel from Figure 4C.
Figure 4—figure supplement 5
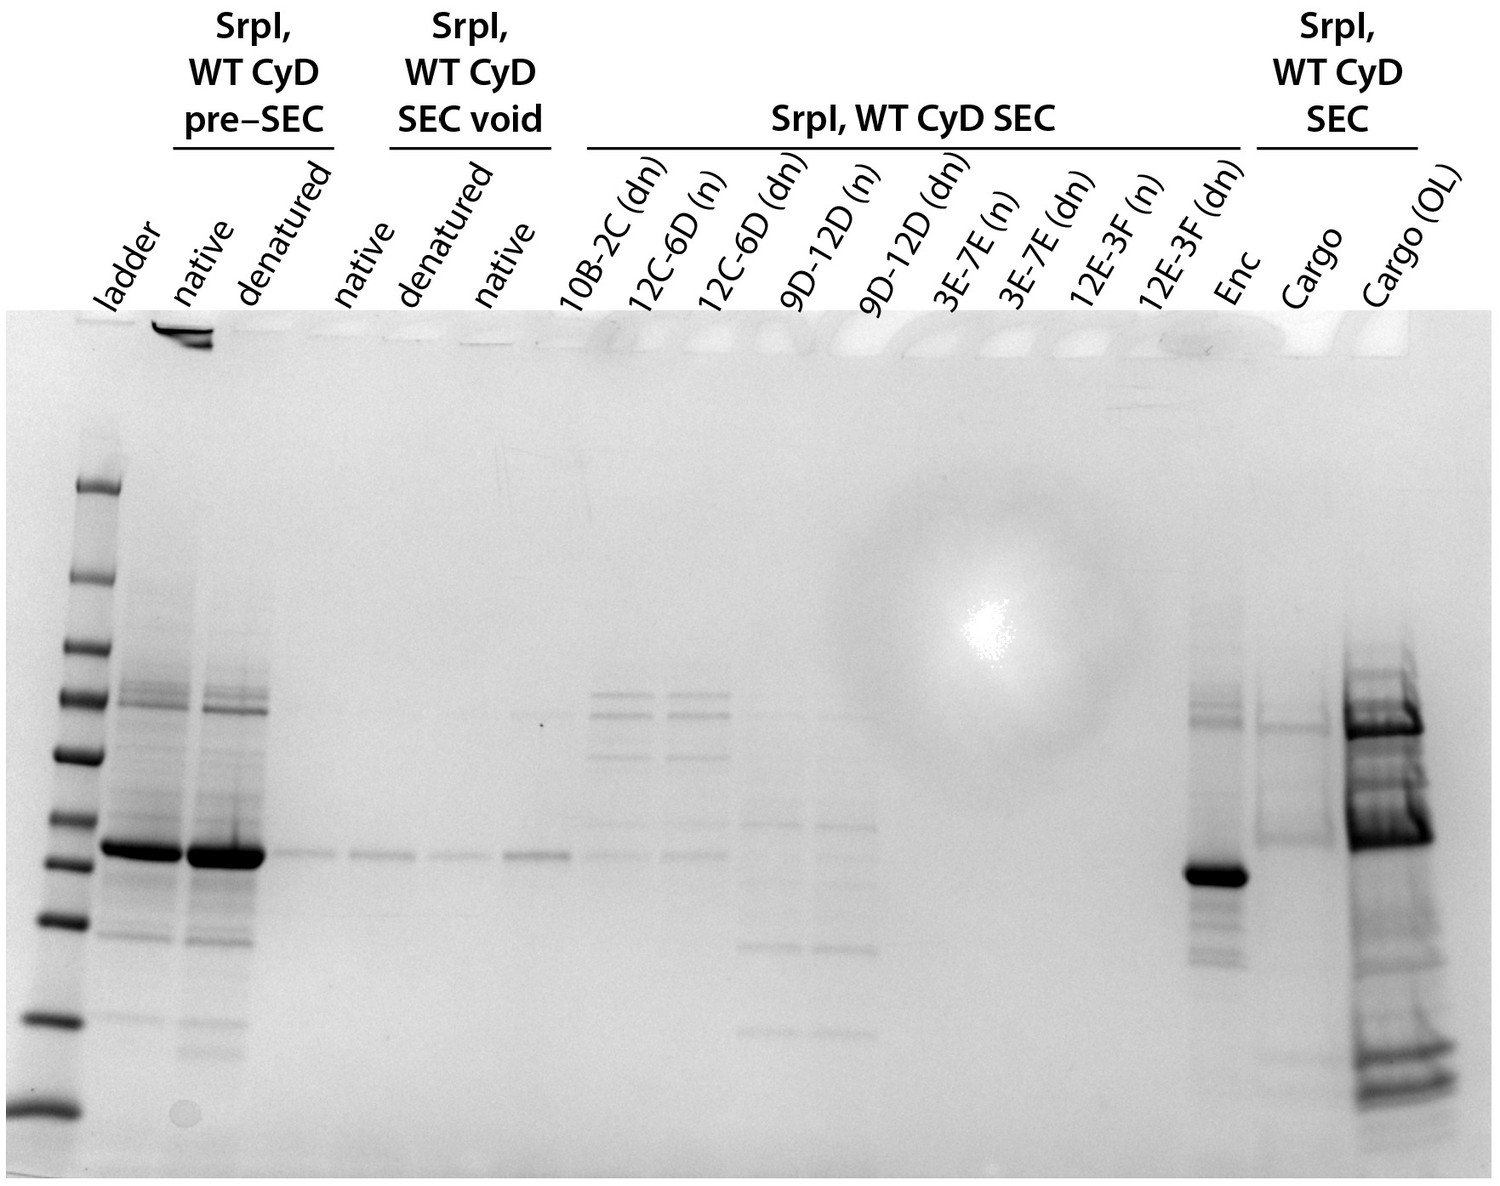
Full gel of the SrpI, WT CyD panel from Figure 4C.
Figure 5
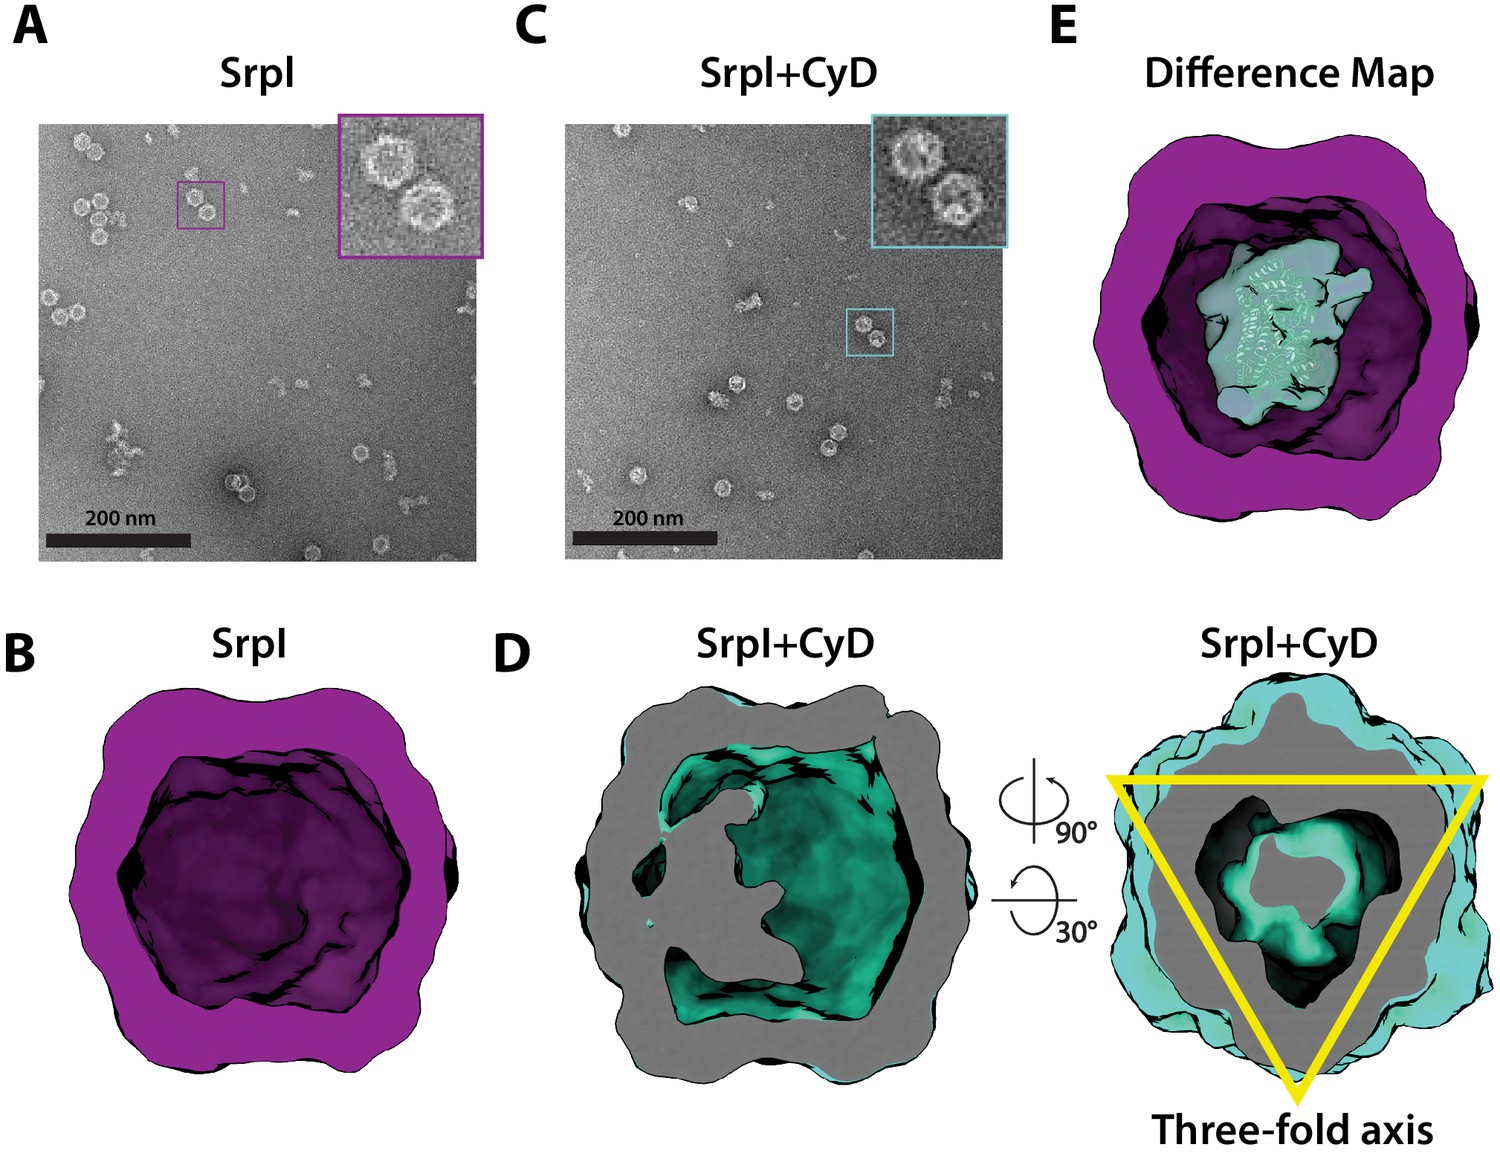
Negative stain analysis indicates CyD loading into SrpI encapsulin.
(A) Negative stain micrograph of an apo-SrpI shell in contrast with (C) the holo-SrpI shell that includes the CyD cargo. (B and D) 3D reconstruction of apo-Srpl and holo-SrpI, respectively. (E) Difference map showing additional density for the holo-SrpI with a homologous cysteine desulfurase dimer docked in (pdb:6c9e).
Figure 6 with 6 supplements
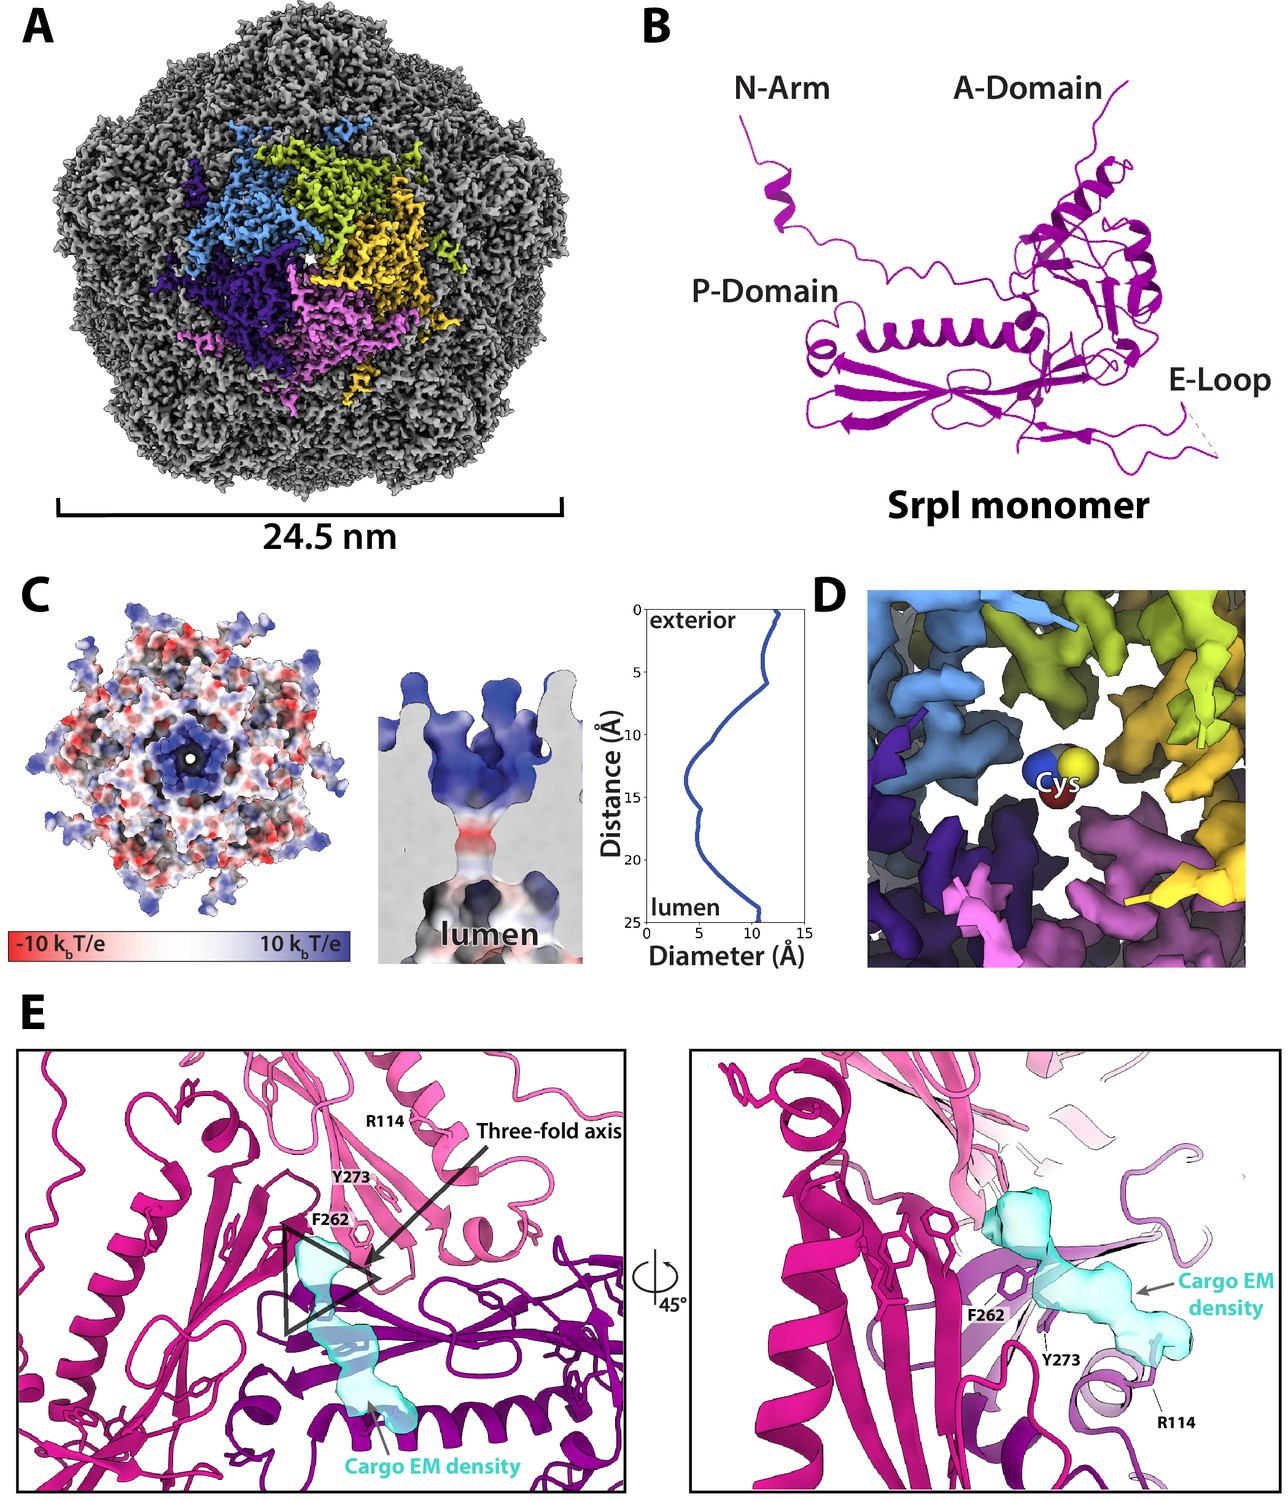
CryoEM structure of the SrpI encapsulin reveals a common HK97 fold, a potential mechanism for cysteine selectivity, and a cargo binding site (A) The SrpI encapsulin structure at 2.2 Å resolution.
This Srpl encapsulin forms a T = 1 icosahedral structure 24.5 nm in diameter. Five subunits around a fivefold axis are shown in distinct colors. (B) SrpI monomer subunits have a HK97 fold with the characteristic A-Domain, E-Loop, P-Domain, and N-Arm. (C) Electrostatic surface potential at the fivefold symmetry axis indicates a relatively neutral pore with an electropositive exterior (left). At its constriction point, the pore is 3.7 Å in diameter. (D) Modeling of a cysteine amino acid at the fivefold axis illustrates the possible mechanism of substrate selection (permissivity to cysteines) by the pore. (E) Unassigned density (turquoise) near the threefold axis (gray triangle) revealed by symmetry expansion and focused classification of the holo-SrpI cryoEM map shown in two different orientations.
Figure 6—figure supplement 1
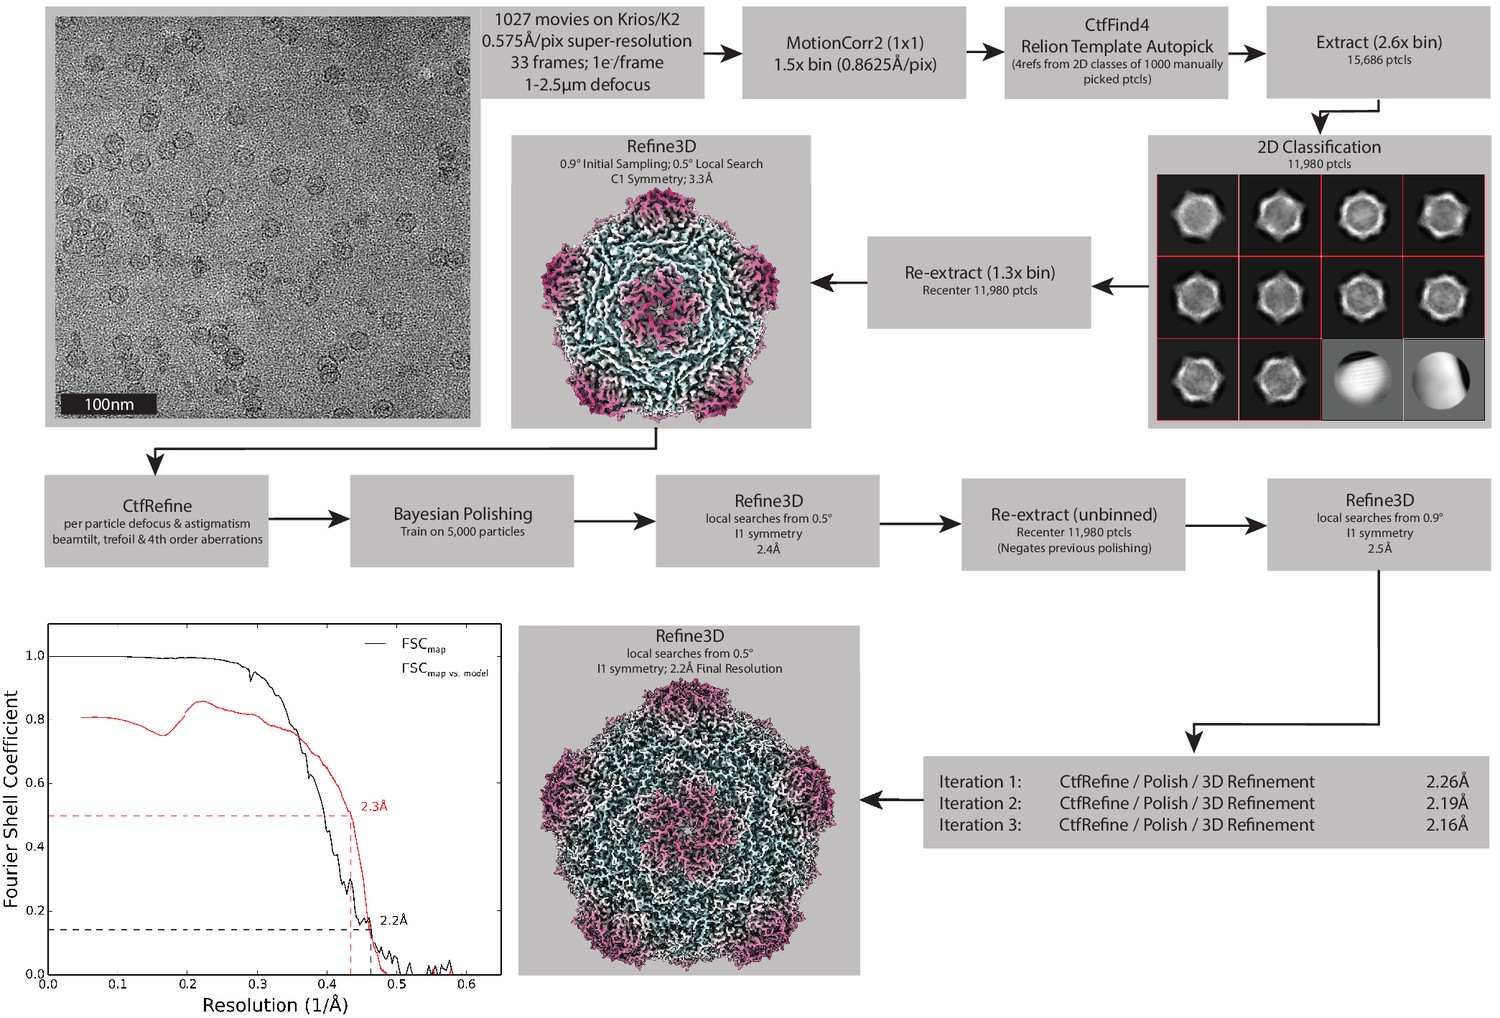
Processing pipeline for the Srpl encapsulin.
Processing workflow within RELION that used to reconstruct the holo-Srpl structure. An identical approach was used for the apo-Srpl encapsulin. Once both these structures were determined, symmetry expansion and focused classification was used to compare subtle differences in the density (not shown, see Figure 6E).
Figure 6—figure supplement 2
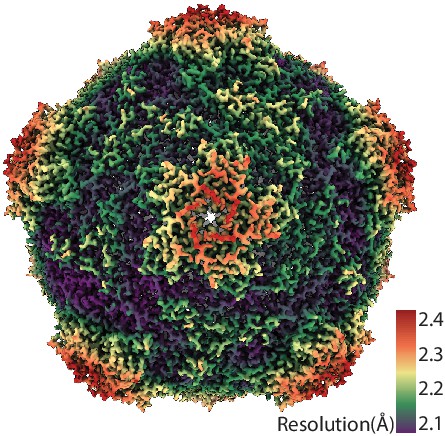
CryoEM resolution map of SrpI encapsulin.
Figure 6—figure supplement 3
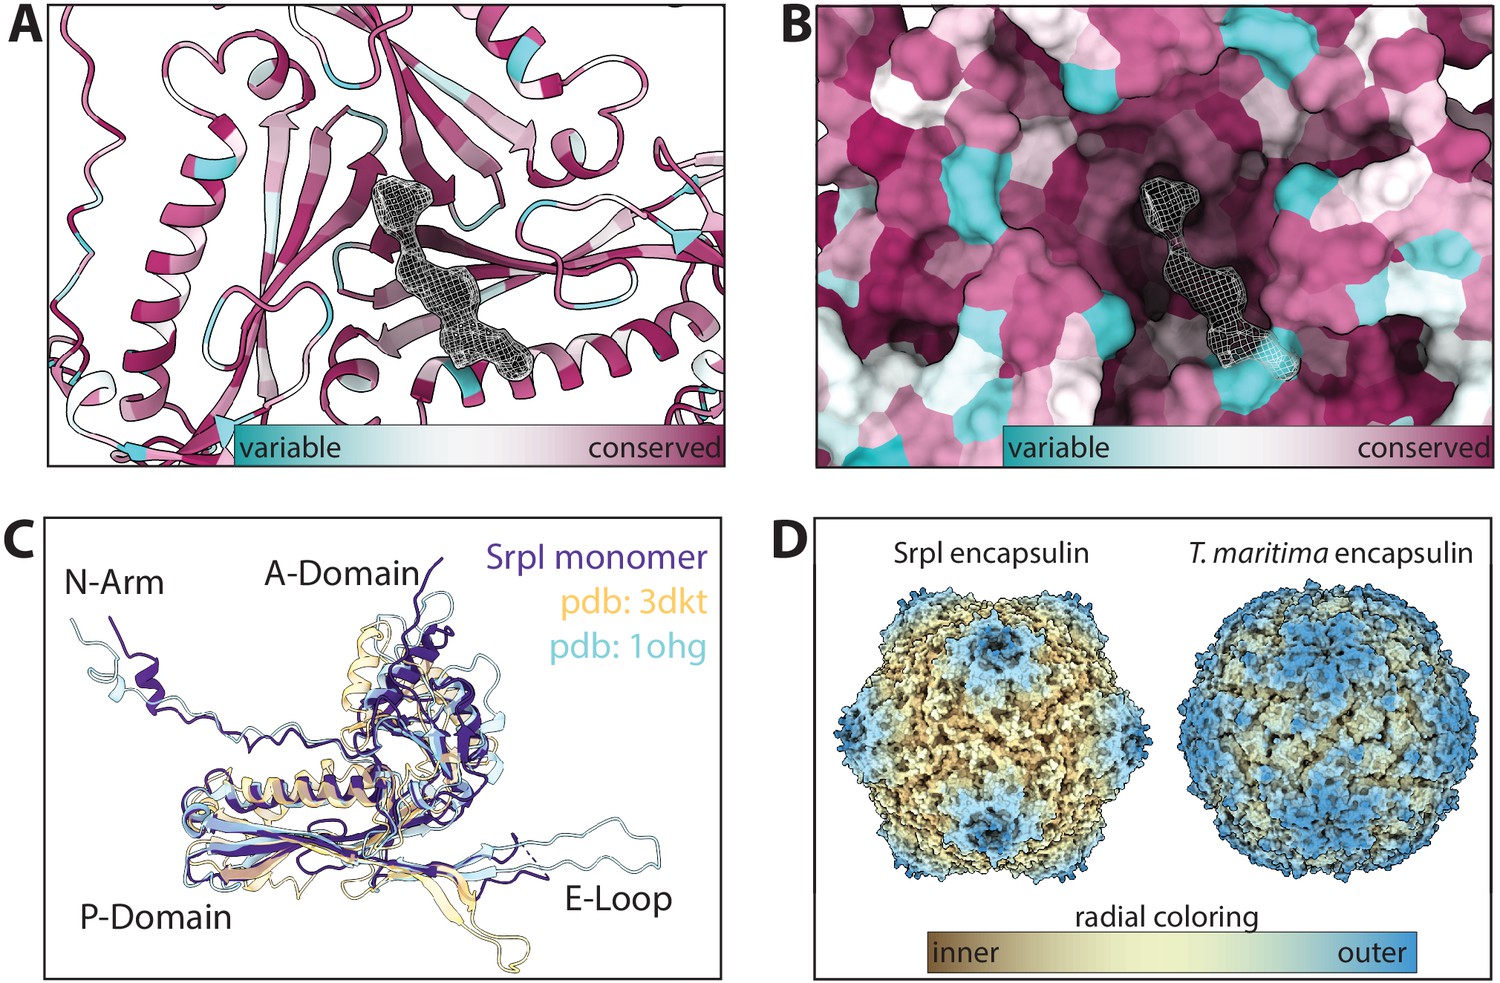
Secondary, tertiary, and quaternary homology between Srpl and other known encapsulins.
(A and B) Sequence conservation of Family 2a encapsulins mapped onto the atomic model and surface display for the Srpl shell respectively (conservation was calculated via ConSurf). (C) Single subunit of Srpl compared to other proteins with a known HK97 structure: The Family 1 encapsulin from T. maritima (pdb: 3DKT) and the HK97 bacteriophage capsid (pdb: 1OHG) (D) Radial coloring to show the spikes of the Srpl encapsulin morphology in comparison with the T. maritima encapsulin.
Figure 6—figure supplement 4
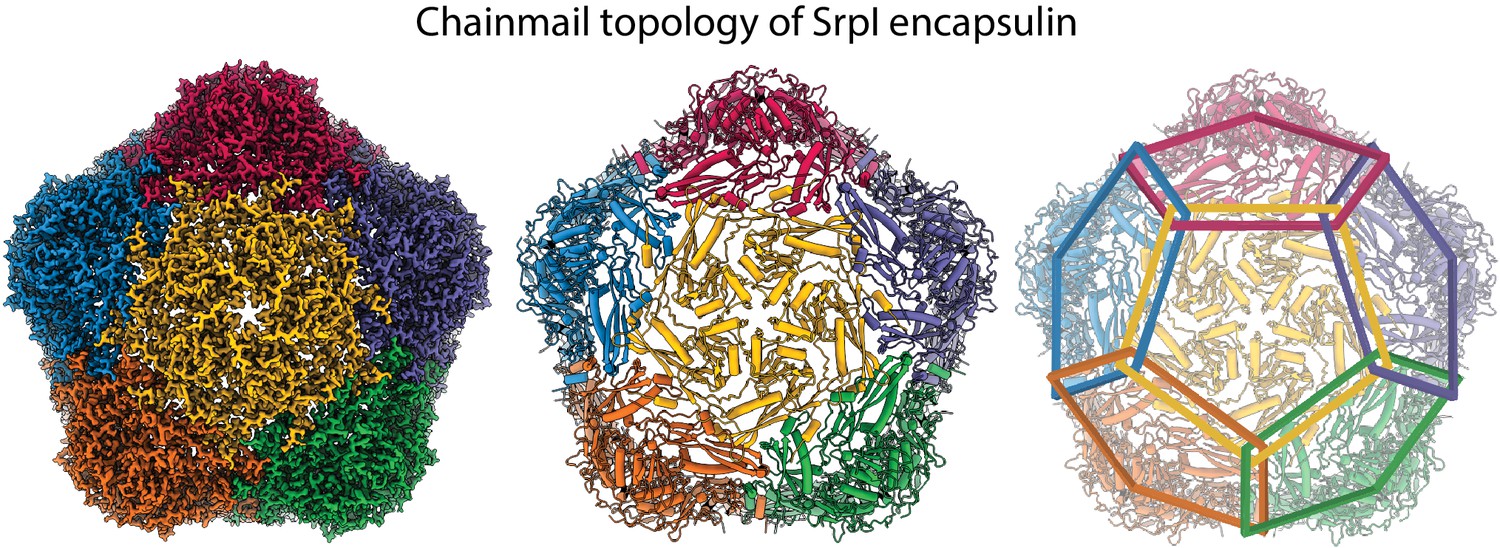
Chainmail-like topography of Srpl.
Coloring of individual subunits highlights the chainmail overlapping topology of the Srpl encapsulin.
Figure 6—figure supplement 5
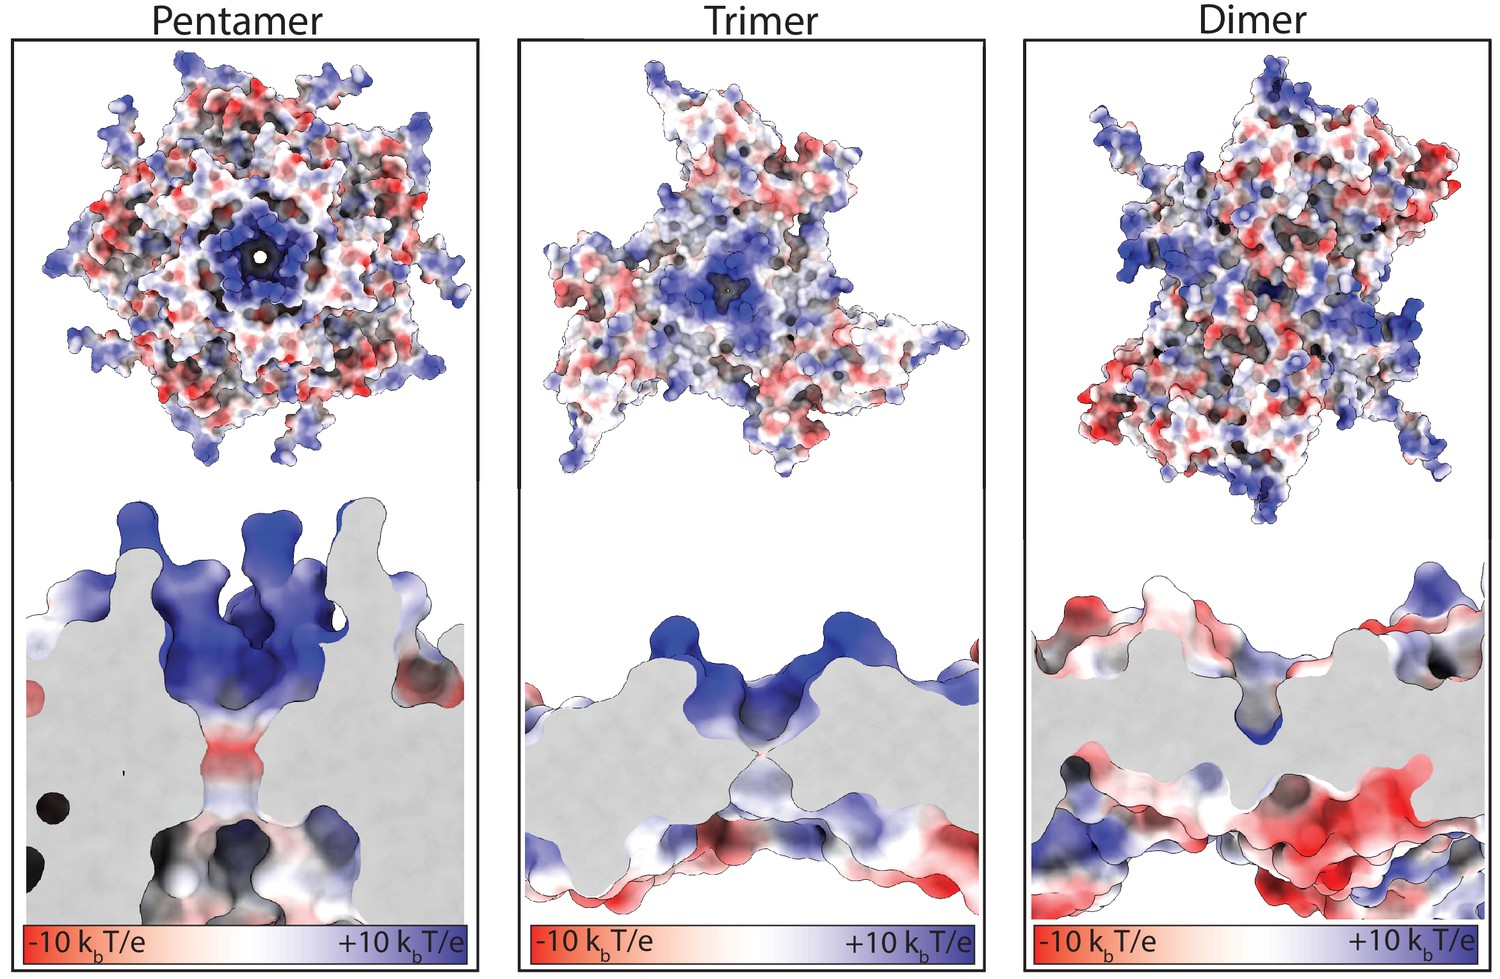
Electrostatic surface charges at the symmetry axes of the Srpl shell.
Close-up and slice-through views of the five-fold, three-fold, and two-fold axes. Surfaces colored according to electrostatic potential (red=negative, blue=positive).
Figure 6—figure supplement 6
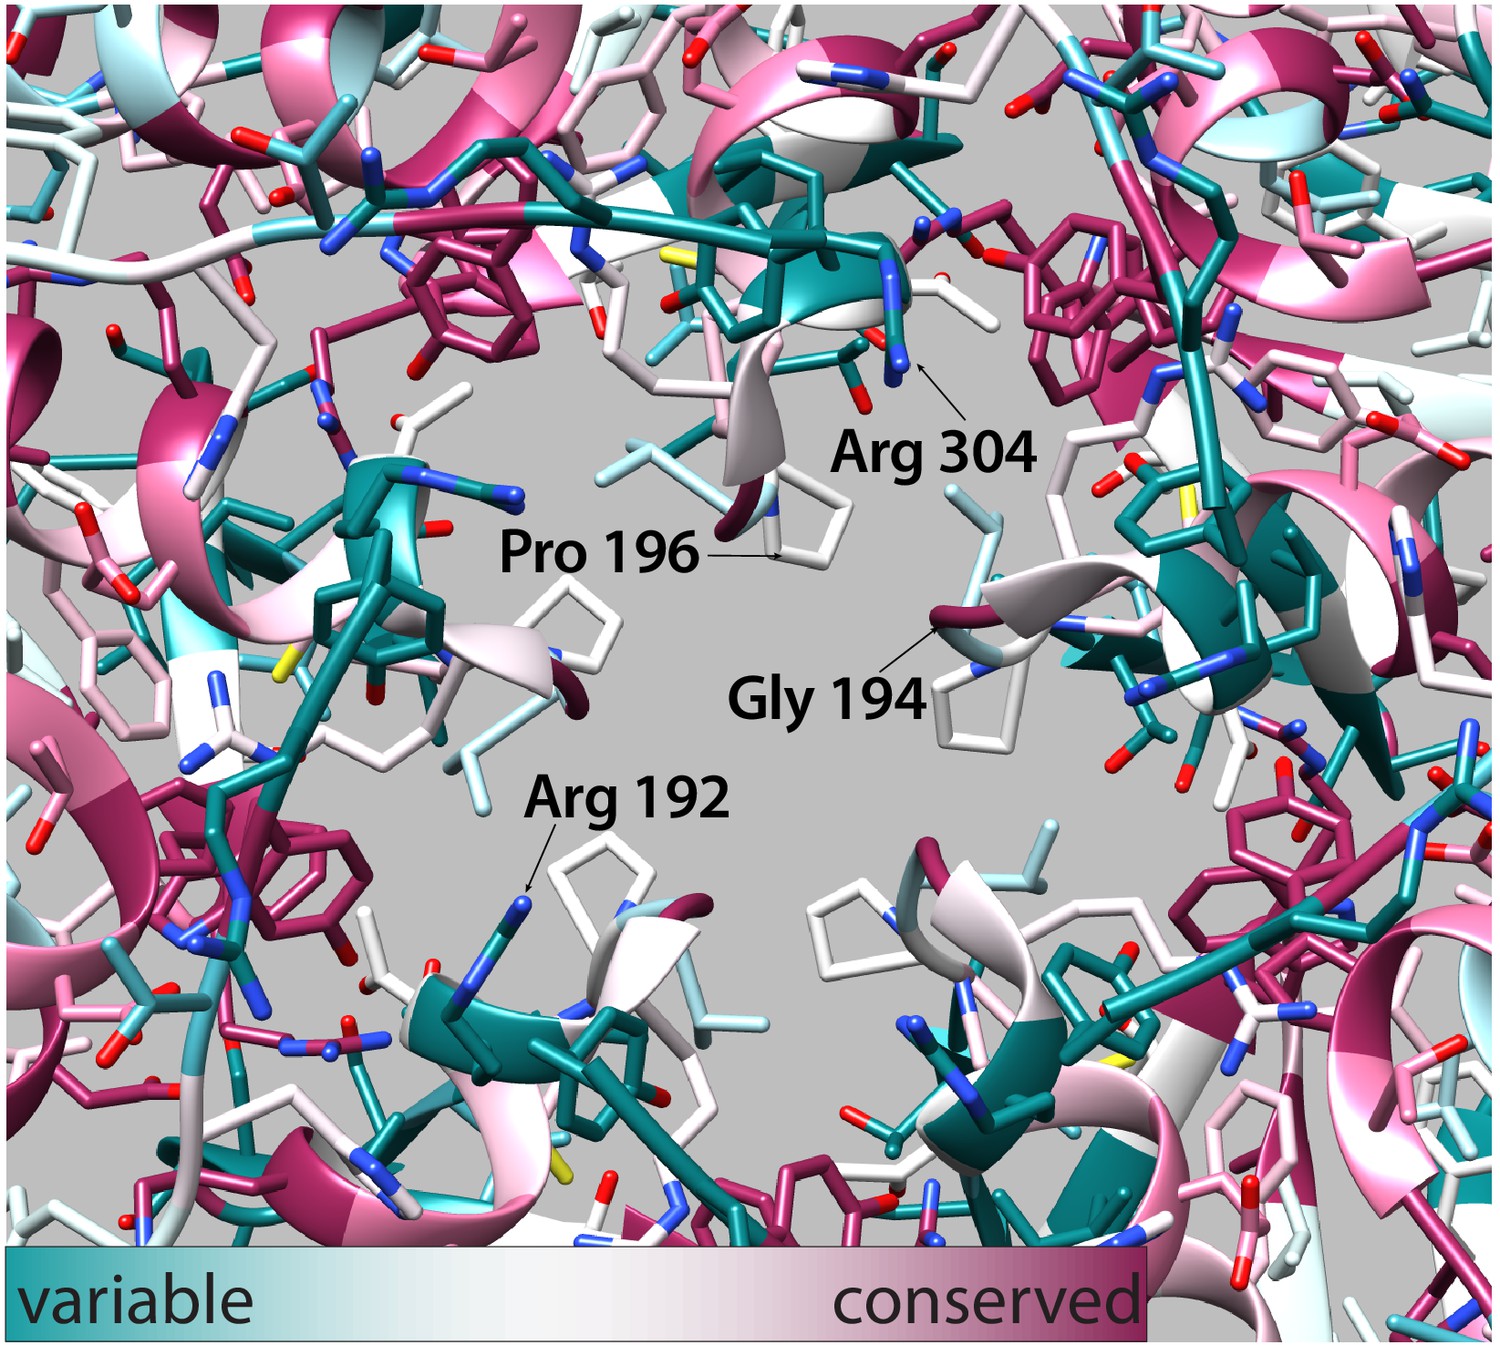
Conservation of residues at the fivefold pore.
Ball and stick model of the fivefold pore (displayed exterior of the compartment facing out). Residues are colored by sequence conservation as calculated by the ConSurf webserver (cyan – conserved, magenta – variable). Labeled residues Gly 194 and Pro 196 form the most restrictive points of the pore. Residues Arg 192 and Arg 304 are residues that result in the positively charged pore of the SrpI encapsulin structure.
Figure 7 with 1 supplement

Cysteine desulfurase activity is enhanced upon encapsulation.
Substrate-dependent activity of encapsulated cysteine desulfurase (encapsulated CyD), unencapsulated cysteine desulfurase (CyD alone), unencapsulated cysteine desulfurase lacking its NTD (ΔNTD-CyD alone), and empty nanocompartment using a coupled-enzyme assay with alanine dehydrogenase and production of NADH as a readout of cysteine desulfurase activity. Error bars are SD of 3–6 replicate experiments. Reactions were carried out at 25°C in 25 mM Tris-HCl pH 8, 150 mM NaCl, 5 mM NAD+, 0.4 Units of alanine dehydrogenase, 200 nM cysteine desulfurase, and varying L-cysteine concentrations.
Figure 7—figure supplement 1
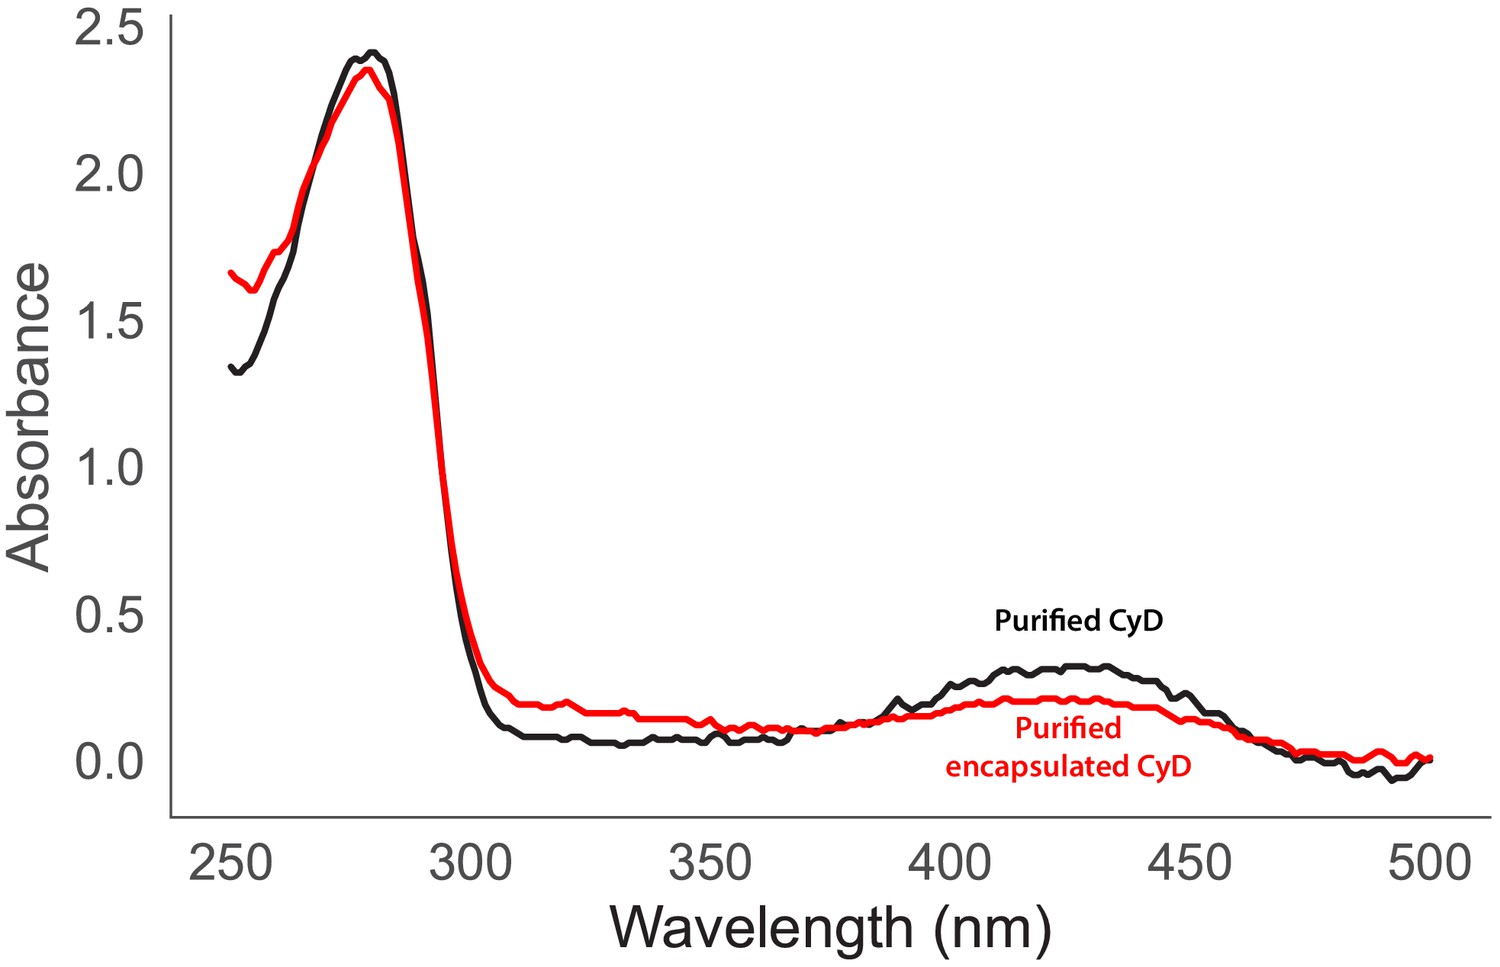
Ultraviolet-visible absorbance spectra of purified CyD (black) and encapsulated CyD (Red).
Additional files
-
Supplementary file 1
Total counts of Family 1 and Family 2 encapsulins found in prokaryotic genomes.
Number of total Family 1 and Family 2 homologs compiled using NCBI BLASTp (E-value <0.01). Accession IDs WP_004080898.1 (T. maritima encapsulin shell) and WP_011055154.1 (S. elongatus PCC 7942) encapsulin shell genes were used as Family 1 and Family 2 queries, respectively. Results based on NCBI’s Genome Information resource (February 2020).
- https://cdn.elifesciences.org/articles/59288/elife-59288-supp1-v2.xlsx
-
Supplementary file 2
Genome neighborhood analysis of Family 2a shell genes.
Co-occurrence and median gene distance of genes found to neighbor Family 2a shell genes using the EFI-GNT web tool. Open reading frames neighboring Family 2a shell genes in the European Nucleic Acid (ENA) database are grouped by shared pfam values.
- https://cdn.elifesciences.org/articles/59288/elife-59288-supp2-v2.xlsx
-
Supplementary file 3
Genome neighborhood analysis of Family 2b shell genes.
Co-occurrence and median gene distance of genes found to neighbor Family 2b shell genes using the EFI-GNT web tool. Open reading frames neighboring Family 2b shell genes in the European Nucleic Acid (ENA) database are grouped by shared pfam values.
- https://cdn.elifesciences.org/articles/59288/elife-59288-supp3-v2.xlsx
-
Supplementary file 4
Family 2a shell genes are found in freshwater and brackish water cyanobacteria, but not marine cyanobacteria.
NCBI BLASTp results of Family 2a shell homologs found in cyanobacteria. Results based on NCBI’s Genome Information resource (February 2020). Environment annotations based on the Joint Genome Institute (JGI) Integrated Microbial Genomes and Microbiomes (IMG/M) database and (Shih et al., 2013).
- https://cdn.elifesciences.org/articles/59288/elife-59288-supp4-v2.xlsx
-
Supplementary file 5
Total spectrum count of all identified proteins from liquid chromatography-mass spectrometry of excised high-molecular-weight bands from Figure 2B.
- https://cdn.elifesciences.org/articles/59288/elife-59288-supp5-v2.xlsx
-
Supplementary file 6
Data collection, reconstruction, and processing statistics.
- https://cdn.elifesciences.org/articles/59288/elife-59288-supp6-v2.xlsx
-
Transparent reporting form
- https://cdn.elifesciences.org/articles/59288/elife-59288-transrepform-v2.docx
Download links
A two-part list of links to download the article, or parts of the article, in various formats.
Downloads (link to download the article as PDF)
Open citations (links to open the citations from this article in various online reference manager services)
Cite this article (links to download the citations from this article in formats compatible with various reference manager tools)
Discovery and characterization of a novel family of prokaryotic nanocompartments involved in sulfur metabolism
eLife 10:e59288.
https://doi.org/10.7554/eLife.59288


